Embed Size (px)
DESCRIPTION
BBM Project
Citation preview

in SBI
CHAPTER I
INTRODUCTION
HISTORY OF BANKING
A banker or bank is a financial institution that acts as a payment agent for customers, and
borrows and lends money. In some countries such as Germany and Japan banks are the
primary owners of industrial corporations while in other countries such as the United States
Banks are prohibited from owning non financial companies.
Banks act as payment agents by conducting current accounts for customers paying cheques
drawn by customers on the bank, and collection cheques deposited to customer’s current
accounts for customer payment via other payment methods such as telegraphic transfer.
Banks borrow money by accepting funds deposited on current account, accepting term
deposit and by issuing debt securities such as banknotes and bonds. Banks lend money by
making advances to customers on current account, by making installment loans, and by
investing in marketable debt securities and forms of lending.
Banks provide almost all payment services, and a bank account is considered indispensable
by most businesses, individuals and governments. Non-banks that provide payment services
such as remittance companies are not normally considered an adequate substitute for having a
bank account.
Banks borrow most funds borrowed from households and non-financial businesses, and lend
most funds lent to households and non-financial businesses, but non-bank lenders provide a
significant and in many cases adequate substitute for bank loans, and money market funds,
cash management trusts and other non-bank financial institution in many cases provide an
adequate substitute to banks for lending saving to.
Seshadripuram academy of business studies. Page 1

in SBI
GROWTH OF BANKING IN INDIA:
Banking in India back to 1786 where the first bank that was established in India. Then the
nationalization of banks in 1969 liberalisation in 1991.In India, Banking sector is segregated
as public sector banks, private sector banks and co-operative banks.
Banks can be categorized into non-scheduled banks and scheduled banks. Scheduled banks
constitute of commercial banks and co-operative banks. There are about 67,000 branches of
scheduled banks spread across India. During the first phase of financial reforms, there was a
nationalization of 14 major banks in 1969. This crucial step led to a shift from Class banking
to Mass banking. Since then the growth of the banking industry in India has been a
continuous process.
As far as the present scenario is concerned the banking industry is in a transition phase. The
Public Sector Banks (PSBs), which are the foundation of the Indian Banking System account
for more than 78 percent of total banking industry assets. On the other hand the Private
Sector Banks in India is witnessing immense progress. They are leaders in Internet banking,
mobile banking, phone banking, ATMs. On the other hand the Public Sector Banks are still
facing the problem of unhappy employees. There has been a decrease of 20 percent in the
employee strength of the private sector in the wake of the Voluntary Retirement Schemes
(VRS). As far as foreign banks are concerned they are likely to succeed in India.
Indus land Bank was the first private bank to be set up in India. IDBI, ING Vysya Bank, SBI
Commercial and International Bank Ltd., Dhanalakshmi Bank Ltd., Karur Vysya Bank Ltd.,
Bank of Rajasthan Ltd etc are some Private Sector Banks. Banks from the Public Sector
include Punjab National Bank, Vijaya Bank, UCO Bank, Oriental Bank, Allahabad Bank.
Banking industry has revolutionized the transactions and financial services system
worldwide. Through the development in technology, banking services has been availed to
customers at all times, even after the normal banking hours. Banking industry services is
nothing but the access of most of banking related services (Verification of account details,
going with transaction, etc.).
Seshadripuram academy of business studies. Page 2

in SBI
DEFINITION OF BANKING:
Sec(1)(b) defines banking as accepting for the purpose of lending or investments of deposits
of money from the public repayable on demand or otherwise and withdrawal by cheque ,
draft, order, or otherwise.
IMPORTANCE OF BANKING IN INDIA:
Banking plays a very important role in economic development of a country. They touch every
aspect of the modern banking. Some of the important roles played by banking for the
developments of Indian economy are as follows.
Banking mobilizes the small, scattered and ideal saving of the people and
make available for the productive purpose i.e. they help in the process of
capital formation.
By offering interest banks attracts depositors and promote the habit of thrift
and saving among people.
Bank is a convient and economic means payment and transfer of funds i.e.
cheques, DD, bank drafts.
Bank helps the movement of funds from region where they are not very useful
to regions where they can be more usefully employed.
Though the supply of money (bank money and credit money) bank exert a
powerful influence on the interest rates in the money market.
Banks helps trade and commerce. Industry and agriculture by meeting their
financial needs.
Bank directs flow of funds into productive channels. While lending money
they discriminate in favor of essential activities and against non-essential
activities.
In the modern economy people who save people who undertakes investment
are different hence there is a need for financial intermediaries like banks that
should help the flow of funds from savers to investors.
Seshadripuram academy of business studies. Page 3

in SBI
INDIAN BANKING SYSTEM
The Indian banking system can be broadly classified into nationalized, private banks and
specialized banking institution, the RESERVE BANK OF INDIA acts as a centralized body
monitoring any discrepancies and shortcoming in the system. Since the nationalization of
bank in 1969 the public sector banks like THE SBI BANK have acquired a place of
prominence and has since then seen tremendous progress.
The need to become highly CUSTOMER FOCUSSED has forced the slow moving
public sector banks to adopt a fast track approach, the varieties of products and services
through e-banking has increased the scope of our banking system.
The conservative banking practices allowed Indian. Banks to be insulted partially from the
Asian currency crisis. Indian banks are now quoting all higher valuation when compared to
banks in other Asian countries (Via, Hong Kong, Singapore, Philippines etc.) that have major
problems linked to huge Non-performing assets (NPA’s) and payments defaults. The SBI are
growing its revenue through the efficient branch networks mainly focused on the retail
segments like car finance, housing loans, track finance etc.
The Indian banking has finally worked up to face the competitive dynamics of the new Indian
market and is addressing the relevant issues to take on the multifarious challenges of
globalization. Banks that employ INFORMATION TECHNOLOGY SOLUTION are
perceived to be FUTURISTICS and PROACTIVE players capable of meeting the
multifarious requirement of the large customers ‘base.
Now the private banks have been fast on the uptake and are reorienting their strategies using
E-BANKING as a medium, the E-BANKING has emerged as the new a challenging frontier
of marketing with the conventional physical world being just as applicable like in any other
marketing medium.
The Indian banking has come from a long way from being a sleepy business institution to
a highly proactive and dynamics entity. This transformation has been largely brought about
by the large close of liberalization and economic reforms that allowed banks to expose new
business opportunities rather than generating revenues from conventional streams (i.e.
Seshadripuram academy of business studies. Page 4
in SBI
borrowing and lending). The banking in India is highly fragmented with 30 banking units
contributing to almost 50% of deposits and 60% of advance.
Indian nationalized banks (i.e. Government owned) continue to be the major lenders
in the economy due to their sheer size and penetrative networks which assures them high
deposit mobilization.
ESSENTIAL CHARACTERISTICS OF BANK:
The essential characteristics of a bank are:
Acceptance of deposits from the public on fixed, current or savings bank account
Allowing of withdrawal of such deposits by cheques, drafts, orders or otherwise.
Utilization of deposits in hand for the purpose of lending or investments.
FUNCTIONS OF BANKING
The most important functions of banking may be classified as follows:
To assemble capital and make it effective.
To receive deposits and make collections.
To check out and transfer funds.
To discount or lend.
To exercise fiduciary or trust powers.
To issue circulating notes.
Every bank which expects to succeed must first of all prove its value to the community. The
services which a bank performs are so generally taken for granted that the public is unaware
of the real extent of the facilities offered. Banks are equipped to utilize funds, for either a
short or long period of time, safely, and with some profit.
CLASSIFICATION OF BANKS
Banks are classified into several types based on the function they perform. Generally the
banks are classified:
Seshadripuram academy of business studies. Page 5

in SBI
Commercial banks
Investment or industrial banks
Exchange banks
Co-operative banks
Land Mortgage banks
Saving banks
Central banks
Commercial banks.
1. Commercial banks:
Commercial banks perform all types of business transactions and accept three
types of deposits fixed deposits, saving bank deposits and current deposits. They accept these
deposits which are repayable on demand or on short notice. They provide funds only for short
term needs.
2. Investment bank /industrial banks:
Investment bank is those banks, which provide funds on long term for
industries. The investment banks are specialized in providing long term loans to industries
with a view to buy plant and machinery. The investment banks obtain funds through share
capital, debentures and long term deposits from the public.
3. Exchange banks:
Exchange banks are known as foreign banks or foreign exchange banks,
which provide foreign exchange for import trade. Their main function is to make
international payments through the purchase and sale of exchange bills. They convert home
currency into foreign currency and foreign currency into home currency.
4. Co-operative banks:
Co-operative banks are promoted to meet the banking requirements of
consumer not only in urban areas and rural areas. They are formed on the co-operative banks
principle and as such they are more service oriented than profit oriented.
Seshadripuram academy of business studies. Page 6

in SBI
5. Central banks:
Central banks are an apex bank in the country, which brings the entire banking
system unified, controlled and regulated. In our country the central bank is the Reserve Bank
of India (RBI).
6. Land Mortgage banks:
Land Mortgage bank provides long term loans on the security of the land to
initiate permanent improvements on the land to buy agriculture machineries.
BANKER AND A CUSTOMER
BANKER
A banker is a person or company carrying on the business of receiving money and
collecting drafts, for customers subject to the obligation of honoring cheques drawn upon
them time to time by the extent of the available in their ‘current accounts’.
CUSTOMER
A person becomes a customer of a bank, when he makes a regular transaction with
the bank and has maintained his accounts regularly with the banker, the moment his cheques
is accepted for collection and there must be some recognizable course of habit of dealing
between the person and the bank.
FINANCE
A branch of economics concerned with resource allocation as well as resource
management, acquisition and investment. Simply finance deals with matters related to money
and the market. The term “Finance” may thus incorporate any of the following:
The study of money and other assets;
The management and control of those assets;
Profiling and managing project risks;
The science of managing money;
Seshadripuram academy of business studies. Page 7

in SBI
Finance is defined as the provision of money at the time when it is required. Every
Enterprise, whether big, medium or small, needs finance to carry on its operation achieve its
targets finances is some indispensable today that it is rightly said that it is the life blood of an
enterprise.
DEFINITION OF FINANCE:
According to OXFORD DICTIONARY finance may be defined as:
The management of money.
Monetary support for an organization.
As a verb, “to finance” is to provide funds for business or for an individual’s
large purchase (car, home, etc)
The activity of finance is the application of a set of technique that individual
and organizations (entities) use to manage their money, particularly the differences between
income and expenditure and the risks of their investments.
Finance is used by individuals (personal finance) by governments (public
finance), by business (corporate finance), as well as by a wide variety of organization
including schools and non –profit organization.
In general, the goals of each of the above activities are achieved through the
use of appropriate financial instruments, with consideration to their institutional setting.
Finance is one of the most important aspects of business management without
proper financial planning a new enterprise is unlikely to be successful. Managing money (a
liquid asset) is essential to ensure a secure future, both for the individual and an organization.
OBJECTIVES OF FINANCE
Profit maximization.
Wealth maximization.
Maintaining balanced asset structure.
Long-term Liquidity.
Seshadripuram academy of business studies. Page 8

in SBI
Judicious planning of funds.
Innovation and efficiently.
Financial discipline like capital budgeting, fund flow and cash flow analysis and
performance budgeting.
FEATURES OF FINANCE
Finance or Financing is an essential business activity.
Finance may be short-term finance, medium-term finance or long-term finance,
depending upon the nature of the activities to be financed.
Business Finance includes owned funds or owned capital and ploughed back
profits, and borrowed funds or borrowed capital like Debentures issued, public
deposits accepted, loans from financial institutions accepted and banks.
Finance estimates the financial requirements of the undertakings, profitable use of
the funds.
TPYES OF FINANCE
Depending upon the nature of nature of activities to be finance, the financial requirements
or needs of a business enterprise may be classified into three types of finance:
1. Short-term finance.
2. Medium-term finance.
3. Long-term finance.
Short-Term Finance:
Short-term finance refers to the financial required by a firm for a period of one year or
less. It is a finance required for the purchase of raw materials, payment of wages and salaries
and for meeting the other day-to-day expenditure like manufacturing, administrative,
marketing and other expenses of a firm.
Seshadripuram academy of business studies. Page 9

in SBI
Short- term finance is also known as working capital finance, as it is required for
investment in working capital or current assets like cash and bank balances, inventories and
accounts receivables and marketable securities.
Medium-Term Finance:
Medium-Term Finance refers to finance required for period of one year to five
years. It is the finance required for permanent or regular working capital, replacement of
worn-out machines, heavy repairs to buildings, heavy advertising campaign, small expansion
and modernization and also for meeting long-term needs for which long-term finance cannot
be quickly arranged.
Long-Term Finance:
Long-term finance refers to the finance required for a period exceeding five years,
usually for five to twenty years. It is required for financing the fixed capital, like, for
procurement of fixed assets required for the establishment of a new undertaking and for
major expansion and modernization of an existing undertaking.
FUNCTIONS OF FINANCE
The functions of finance includes:-
Benchmarking of Finance processes and practices to identify performance gaps and
issues;
Visioning of the overall Finance Function, considering organization, process, people
and technology;
Developing Finance policies and control frameworks, factoring in all relevant
business, regulatory, governance and internal control requirements;
Designing best of breed Finance organizations, including mapping of roles and
responsibilities of corporate, business unit and shared services Finance groups;
Identifying opportunities for shared services and outsourcing/co-sourcing delivery
models
Seshadripuram academy of business studies. Page 10

in SBI
Designing detailed Finance transaction processing and reporting processes including
business intelligence; and
Delivering programs for large-scale, multi-work stream transformational initiatives.
Meaning of Financial Management
The term “Financial Management” has a number of meanings including the administration
and maintenance of financial assets. The process of financial management may also include
identifying and trying to work around the various risks to which a particular project may be
exposed.
Definition of Financial Management
According to Prof. Bradley, "Financial management is the area of business management,
devoted to a judicious use of capital and a careful selection of sources of capital, in order to
enable a spending unit to move in the direction of reaching its goals."
According to Phillip hates: “FM is concerned with the managerial decisions that results in
acquisition and finance of long term and credit for the firm as such it deals with solution that
require selection of specific assets selection of liabilities as well as problems of size and
growth of enterprise. The analysis of these decisions is based on the expected inflow and
outflow of funds and their effect upon management function”.
Financial management is that part of management which is concerned mainly with raising
funds in the most economic and suitable manner, using these funds as profitable as possible,
planning future operations and controlling current performance and future development
through financial accountancy , cost accountancy , budgeting ,statistics and other means.
Financial Management provides the best guide for the future resources allocation of firm. It
provides relatively uniform yardstick for judging most of the enterprises operations and
projects.
In short Financial Management is the operational activity of a business that is responsible for
obtaining and effectively utilizing of funds
Seshadripuram academy of business studies. Page 11

in SBI
OBJECTIVES OF FINANCIAL MANAGEMENT
Profit maximization:
Profit earnings the main aim of every economic activity. A business being an
economic institution must earn profit to cover its cost and provide funds for
growth. No business can survive without earning profit. Profit is a measure of
efficiency of a business enterprise .Profit also serves as a protection against risk
which cannot be ensured. Thus, profit maximization is considered as the main
objective of the business.
Wealth maximization:
Wealth maximization is the appropriate objective of an enterprise.
Financial theory asserts that wealth maximization is a single substitute for a
stockholder’s utility. When the firm maximizes the stockholder’s wealth, the individual
stockholder’s can use this wealth to maximize his individual utility. It means that by
maximizing stockholder’s wealth the firm is operating consistently towards maximizing
stockholder’s utility.
1. Financial management is a distinct area of business management - i.e. financial
manager has a key role in overall business management.
2. To select the prudent or rational use of capital resources.
3. To make proper allocation and utilization of funds.
4. To have a careful selection of the source of capital.
5. To determining the debt equity ratio and designing a proper capital structure for the
corporate goal achievement.
6. To ensuring the achievement of business objectives viz. wealth or profit
Maximization.
7. To make fair returns to the investors.
8. Capital Budgeting.
Seshadripuram academy of business studies. Page 12
in SBI
IMPORTANCE OF FINANCIAL MANAGEMENT:
It is necessary for the smooth running of an Enterprise.
Financial management provides complete coordination between various functional
areas such as purchase, stores, production, marketing, etc.
Financial management helps the top management to evaluate the profitability of
operational activities of the organization.
Financial management is important to all level of management for decisions.
Financial management helps to determine the financial soundness of a firm.
Methods of financial analysis:
1. Comparative analysis.2. Common- size statement.3. Trend analysis.4. Ratio analysis.5. Fund flow analysis.6. Cash flow analysis.7. Cost volume profit analysis
1. Comparative Financial Statement:
The preparation of the comparative financial statement is based on the premise that a statement covering a period of number of years is more meaningful and significant than for a single year only and that the financial statement for one period represent only one phase of the long and continuous history of the firm. The comparative financial analyst in horizontal analysis of the firm seeks in establishing operations and conditional trend of the firm.
2. Common –size statement:
The common size statement represent the relationship of different items of financial statement with some common item by expressing each item as a percentage of the common items, in common size statement balance sheet and income statement are shown in analyzed percentage.
3. Trend analysis:
The financial statement may be analyzed by computing trend of series of information. This method evaluates the direction of upwards or down ward trend and involves the computation of the percentage relationship that each statement item bears to
Seshadripuram academy of business studies. Page 13

in SBI
the same item in base year. The information out of a number of years is taken up for one year. Generally the first year is considered as base year.
4. Fund Flow Analysis: This is a statement which show2s the movement of funds and is a report of financial operative of the business under taking. It indicates various means by which funds were obtained during a particular period and the ways in which those funds were employed.
5. Cash Flow Analysis: Cash flow analysis is a statement which describes the inflow and out flow of cash and cash equivalents in an enterprise during a specified period of time. Such a statement shows net effect of the various business transactions on cash and taken into account as receipts and disbursements of cash.
6. Cost-volume profit analysis: Cost volume profit analysis is a technique for studying the relationships, between cost, volume and profit. Profits of an undertaking depend upon a large number of factors.
7. Ratio analysis: This is an important mean of expressing the relationships between two elements. A ratio must be represented as a meaningful relationship, but use of ratio cannot take the place of studying the underlying data.
Limitations of financial statement analysis:
Financial Statement analysis is a powerful mechanism of determining financial strengths and weakness of a firm, but the analysis is based on the information available in the financial statement.
The financial statement analyses have few limitations which are shown here under:
1. Financial Statement Analysis is only a statement of interim reports.2. Financial statement Analysis is based only on monetary factors and non monetary
factors are ignored.3. Changes in accounting procedure by a firm may often make financial statement
analysis misleading.
TYPES OF RATIOS:
1. Liquidity ratios2. Leverage ratios3. Activity ratios
Seshadripuram academy of business studies. Page 14

in SBI
4. Profitability ratios
1. Liquidity ratios: These are the ratios which are calculated for the purpose of measuring the short term solvencies or liquidity of an organization. Liquidity refers to ability of an organization to meet its short term obligation out of its short term resources or assets. These ratios also indicate whether a firm has sufficient working capital to carry on its day today activities.
A. Current Ratio: This ratio is called by different names such as 2:1 ratio, working capital ratio, and solvency ratio. This ratio emerged out of the experience of the bankers who wanted compare the current assets to current liabilities before lending money to the commercial and corporate enterprises. This ratio helps to know the solvency and liquidity of the firm. The ratio is connected with the working capital and hence it is called “working capital ratio”
Current ratio is symbolically expressed as follows: Current AssetsCurrent Ratio= Current liabilities
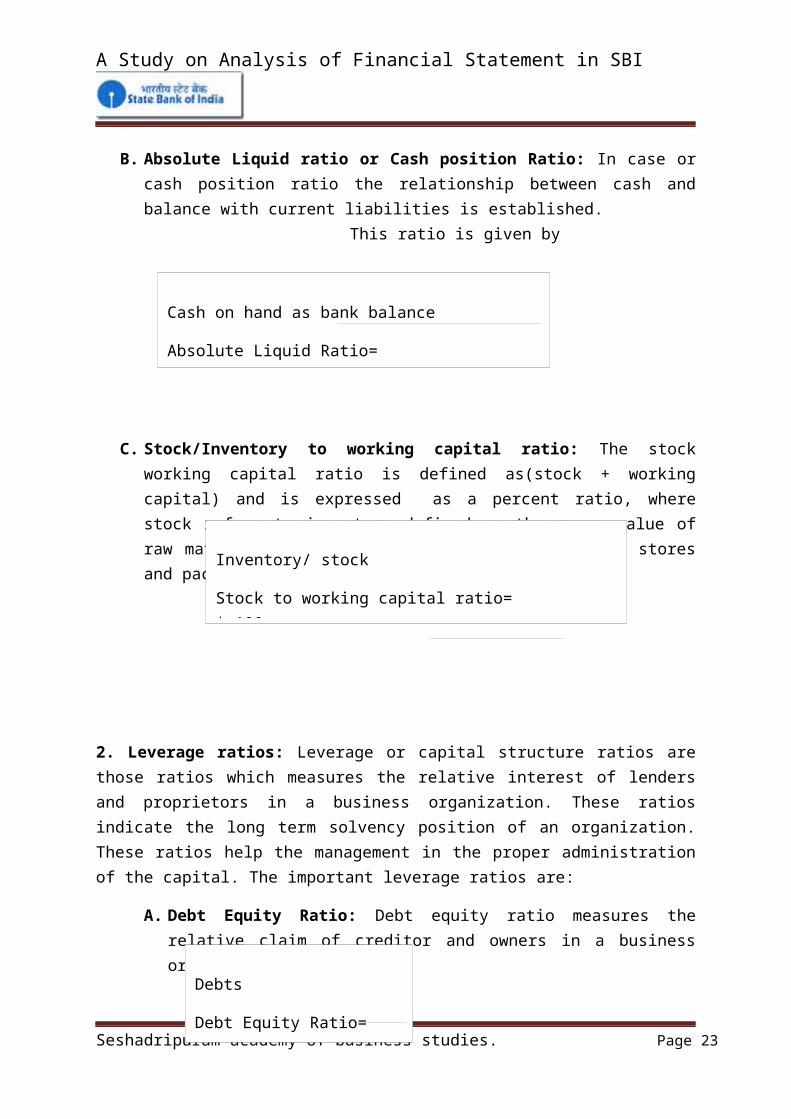
B. Absolute Liquid ratio or Cash position Ratio: In case or cash position ratio the relationship between cash and balance with current liabilities is established.
This ratio is given by
Absolute Liquidity Ratio
C. Stock/Inventory to working capital ratio: The stock working capital ratio is defined as(stock + working capital) and is expressed as a percent ratio, where stock refers to inventory defined as the rupee value of raw materials, work-in –progress, finished goods, stores and packing materials.
Seshadripuram academy of business studies. Page 15
Current Assets
Current Ratio=
Current Liabilities
Cash on hand as bank balance
Absolute Liquid Ratio=
Current liabilities
Inventory/ stock
Stock to working capital ratio= * 100
Working capital

in SBI
2. Leverage ratios: Leverage or capital structure ratios are those ratios which measures the relative interest of lenders and proprietors in a business organization. These ratios indicate the long term solvency position of an organization. These ratios help the management in the proper administration of the capital. The important leverage ratios are:
A. Debt Equity Ratio: Debt equity ratio measures the relative claim of creditor and owners in a business organization.
B. Proprietary Ratio: The proprietary ratio, also known as ‘owner fund ratio’ shareholder’s equity ratio, the relationship between the contributions of owners and the contributions of owners plus outsiders. The formula for this ratio may be written as follows
C. Fixed assets to net worth ratio: This ratio signifies the relationship between fixed assets and net worth.
4. Activity Ratios: These ratios are adopted to assess the effectiveness of the resources employed in the business activity. The company would like to have control over the fund employed in the business and these ratios tell the extent of control the firm has over the funds employed. If any gap is noticed by adopting these ratios, it can be immediately rectified. These ratios also analyze the use of resources and the utility of
Seshadripuram academy of business studies. Page 16
Debts
Debt Equity Ratio=
Equity
Net worth
Proprietary ratio=
Total assets
Fixed assets
Fixed assets to net worth=
Net worth

in SBI
each component of total assets. The profitability of the firm can be determined by activity ratios coupled with the degree of leverage.
A. Stock turnover ratio: This ratio shows the efficiency of the organization in managing its invention or stock. Inventory turnover ratio indicates the number of times the stock is turned over.
B. Debtor turnover ratios: this ratio is also known as ‘Receivables’. Turnover ratio is inter-statement ratio. The ratio is expressed as follows:
4. Profitability Ratios: Profitability of business organization shows how successfully the business is carried out during a period. These ratios measure the profitability of the business. These ratios are very important from the point of view of different set of people who are interested in the business organization likes owners, creditors, employee’s supplier’s government. Organization etc.
A. Gross profit ratio: The gross profit ratio is the relationship of gross profit on sales to net sales.
Seshadripuram academy of business studies. Page 17
Cost of goods sold
Stock turnover ratio=
Average stock of inventory.
Net credit sales
Debtor turnover ratios=
Net Debtors
Gross profit
Gross profit ratio= *100
Net sales

in SBI
B. Earnings per share: This is computed by dividing the net profit after tax and dividend to preference share holders. This avoids confusion and indicates the profit available to the ordinary shareholders on a “per share basis”. This computed as follows;
Seshadripuram academy of business studies. Page 18
Net profit after tax
Earnings per share=
Number of Equity shares

in SBI
ADVANTAGES OF RATIO ANLYSIS:
1. Useful in analysis of financial statement: It helps in analyzing the financial statement i.e. P and L account and balance sheet which is useful for all the stakeholders of the company.
2. Improving future performance: It identifies the weakness of the business and helps the management to overcome these weaknesses.
3. Judging the efficiency of the business: It evaluates the liquidity, solvency, and profitability position if the firm which helps in judging the overall efficiency of the firm.
4. Inter firm comparision: It helps in comparing the performance of one firm with that of another in the same industry.
5. Simplifies accounting figures: Complex accounting data presented in P and L account and balance sheet is simplified, summarized and systamised with the help of ratio analysis.
LIMITATIONS OF RATIO ANALYSIS:
1. Ratio computation is based on the financial statement of an organization. So, the ratios may not reflect the true and fair financial position if there are manipulation or window dressing in the basic data itself.
2. Ratio deals with quantitative aspects, hence does not reflect the qualitative aspects in its report.
3. Ratios are not decisions; it is the information to make effective decision.
4. Ratios are understandable by professional knowledge only; hence common people cannot use it.
5. Ratios are based on many assumptions and may mislead the decision maker’s.
5.
Seshadripuram academy of business studies. Page 19

in SBI
.
CHAPTER-2
RESEARCH DESIGN
Title of the study: A Study on Analysis of financial statement.
STATEMENT OF THE PROBLEM:
Financial statement reflects the financial position of any business. The primary aim of preparing financial statement is to make wise decision of the business. The financial efficiency managerial efficiency and probability can be justified with the help analysis of statement.
The focus of financial analysis on key figures in the financial statement and significant relationship that exist between them. The analysis of the financial statement is the process of evaluating the relationship between component part of financial statement to obtain a better understanding of the firms’ position and performance. In brief, financial analysis is the process of selection, relation evaluation.
Evaluated statement can be used as a tool to judge financial position operational efficiency profitability and managerial qualitative decision making power. The current study aims at ascertaining and analyzing the status of banks ability to meet its financial obligation performance.
OBJECTIVES:
1. To know overall operating efficiency and performance of bank.2. To analyses the financial statement of bank through past year.3. To determine the financial conditions and financial performance of the
bank.4. To know the process of utilization of funds.5. To through light on the areas where bank has to be more caution.
SCOPE OF THE STUDY: A detailed study on analysis of financial statement is highly the adequacy and optimum level of financial statement of bank.
1. Study on analysis of financial statement at STATE BANK OF INDIA is limited to a Raja Rajeshwari nagar only.
2. This study will be a source of information for further practical application of the bank.
Seshadripuram academy of business studies. Page 20

in SBI
3. The scope of the study comprises of various information from balance sheet and profit and loss account of bank for the 5 consecutive years.
LIMITATIONS:
1. A study is based on data provided by bank, truthfulness cannot be completely believed.2. Confidential data of bank are not revealed.3. Study is restricted only to past 5 years.
Nature of study:
The study is based on description and analytical study.
Tools:
Though there are many devices to analyze the financial statement ratio analysis, comparative financial statement analysis, common size statement and trend analysis are used.
Research instrument used:
Interpretation of the analyzed data computed using different statement is graphically represent through
Graphs. Tables.
Research Methodology:
Sources of Data: Primary source: The information is as it gathered from the personal interactions with the bank manager and accounting staffs of the bank.
Secondary sources: The study also done by using the following resources.
SBI Web site SBI Records Published articles Text books
Seshadripuram academy of business studies. Page 21

A Study on Analysis of Financial Statement
CHAPTER -3
COMPANY PROFILE
YEAR OF ESTABLISHMENT OF BRANCH: Bank has established in
30.7.1992 at Raja Rajeshwari nagar.
STATE BANK OF INDIA BRANCHES:
State bank of India branches span the country with a vast network to reach out to as many
customers as possible making full contribution to the status of India’s largest bank for SBI.
Each SBI branch is provided an identification code that is unique to each branch. The SBI
bank branches are categorized according to the banking services they provide.
These include SBI:
Core banking branch
Domestic Forex branch
Internet banking and
Personal banking (Real Time Gross Settlement) Branches.
State Bank of India being the largest bank provides specialized banking services in accordance
with the special requirement of a particular community or area. The SBI branch type there by
depends on the special banking services it aims to provide. These include:
Agricultural business and development branches
Commercial retail branches
Corporate accounts and mid corporate group branches
Main branches
Industrial finance branches
NRI banking branch
Seshadripuram academy of business studies. Page 22
A Study on Analysis of Financial Statement
Overseas branches
Personal banking branch
Rehabilitation and recovery branch
SSI and SIB branch
Services branches
VISION STATEMENT:
Premier India financial services group with global perspective, world class standing of
the efficiency and profession and core institution values
Retain its position in the country as a pioneer in developing countries.
Maximize shareholder value through high sustained earnings per share.
An institution with a culture of mutual care and commitment a satisfying and exciting.
Work environment and continuous learning opportunity.
MISSION STATEMENT:
To retain the banks position as the premise India financial services
Group with world class standards and significant global business commitment to
excellence in customer, shareholder and employee satisfaction and to play a leading role in the
expanding and diversifying financial services sector while continuing emphasis on its
development banking role.
VALUES:
Excellence in customer service
Profit orientation.
Belonging and commitment to the bank.
Seshadripuram academy of business studies. Page 23

A Study on Analysis of Financial Statement
Fairness in all dealing and relation.
Risk taking and innovation.
New business undertaking by SBI:
Due to completion from the private banks and in order to serve the customer’s needs as well
for the development of the economy state Banks of India has been entered into the new
market.
Recently SBI has started two new services providing area they are:
1. SBI LIFE INSURANCE
2. SBI MUTUAL FUNDS
3. SBI MEDICAL INSURANCE.
GOAL AND OBJECTIVES:
State Banks of India (SBI) is government-owned and is the largest banks in India it has its
own goal and objectives:
It traces its ancestry bank to the banks to Calcutta, which was established in 1806; this
makes SBI the oldest commercial banks in the Indian subcontinent.
SBI aims at providing regular services to its customer.
It aims at managing the nation’s largest ATM network.
SBI aims at providing various domestic, international and NRI products and services,
through its vast network in India and overseas for the sake of customer satisfaction.
In recent years the banks has focused on three priorities:
1. Reducing its huge staff through Golden handshake schemes know as the voluntary
Retirement scheme, which saw many of its best and brightest defect to the private sector.
2. Computerizing its operations.
Seshadripuram academy of business studies. Page 24

A Study on Analysis of Financial Statement
3. Trying to change the attitude of its largely rude staff through a program aptly named
‘parivartan’ or ‘change’.
SBI BRANCHES:
State Bank of India has 131 foreign offices in 32 countries across the globe.
SBI has about 21,000 ATMs; and SBI group (including associate banks) has about
45,000 ATMs.
SBI has 26,500 branches, including branches that belong to its associate banks.
SBI includes 99345 officers in our country.
SYMBOL AND SLOGAN:
The symbol of the State Bank of India is a circle and not key hole and a small man at
centre of the circle. A circle depicts perfection and the common man being the centre of the
bank’s business.
SLOGANS:
o With you all the way
o Pure banking nothing else
o The banker to every Indian
Trustees
SBI Mutual Fund Trustee Company Private Limited (the “Trustee”), through its Board of
Directors discharge its obligations as Trustee of the SBI Mutual Fund. The Board of Directors
of SBI Mutual Fund Trustee Company Private Limited are as under:
o Shri T.L. Palani Kumar
Independent
o Shri C.M. Dixit
Independent
Seshadripuram academy of business studies. Page 25

A Study on Analysis of Financial Statement
o Ms. Sandra Martyres
Associate
o Ms. Bharati Rao
Associate
Current Board of Directors
After the end of O. P. Bhatt's reign as SBI Chairman on 31st March, 2011, the post was taken
over by Pratip Chaudhuri, who is the former Deputy Managing Director of the International
Division of SBI. As on 4th August, 2011, there are twelve members in the SBI Board of
Directors, including Subir Gokarn, who is also one of the four Deputy Governors of the
Reserve Bank of India. The complete lists of the Board members are:
1. Pratip Chaudhuri (Chairman)
2. Hemant G. Contractor (Managing Director)
3. Diwakar Gupta (Managing Director)
4. A Krishna Kumar (Managing Director)
5. Dileep C Choksi (Director)
6. S. Venkatachalam (Director)
7. D. Sundaram (Director)
8. Parthasarathy Iyengar (Director)
9. G. D. Nadaf (Officer Employee Director)
10. Rashpal Malhotra (Director)
11. D. K. Mittal (Director)
12. Subir V. Gokarn (Director)
Associate banks:
Seshadripuram academy of business studies. Page 26

A Study on Analysis of Financial Statement
There are seven other associate banks that fall under SBI. They all use the and quote;
State Bank of India and quote; name followed by the regional headquarters name.
State Bank of Bikaner and Jaipur
State Bank of Hyderabad
State Bank of Indore
State banks of Mysore
State Bank of Patiala
State bank of Travancore
Seshadripuram academy of business studies. Page 27

A Study on Analysis of Financial Statement
The Main branch of SBI at Mumbai
Foreign offices:
State Banks of India is present in 32 countries, where it has 84 offices serving the
international needs of the bank’s foreign customers, and in some cases conducts retail
operations. The focus of these offices is India-related business.
SBI has branches in these countries:
Australia
Bahrain
Bangladesh
Belgium
Canada
Dubai
Seshadripuram academy of business studies. Page 28
A Study on Analysis of Financial Statement
France
Germany
Hong Kong
Japan
Israel
The Israeli branch of the State Bank of India located in Ramat Gan.
PRODUCTS:
Private Banking
Asset management
Pension
Mortgages
Credit Cards
State Bank of India- Financial and Strategic analysis review:
Summary:
Seshadripuram academy of business studies. Page 29

A Study on Analysis of Financial Statement
State bank of India (SBI) is a large financial services group operating in the banking industry.
The bank is engaged in providing trading services, international banking and traditional
banking and treasury operations. The Reserve bank of India holds more than half of SBI’s
equity capital. SBI has a network of over 10,000 branches. In addition, the seven associate
banks of SBI have more than 4900 branches. SBI along with its subsidiaries is engaged in
providing a wide range of financial services including Life Insurance, Merchant banking,
Mutual funds, credit card and factoring, security trading and primary dealership in the money
market.
Global Markets Direct, the leading business information provider, presents an in-depth
business, strategic and financial analysis of State Bank of India. The report provides a
comprehensive insight into the company, including business structure and operations,
executive biographies and key competitors. The hallmark of the report is the detailed strategic
analysis and Global Markets Directs views on the company
Scope:
-The company’s strengths and weaknesses and areas of development or decline are analyzed.
Financial, strategic and operation factors are considered.
-The opportunities open to the company are considered and its growth potential assessed
competitive or technological threats are highlighted.
-The report contains critical company information-business structure and operations, the
company history, major products and services, key competitors, key employees and executive
biographies, different locations and important subsidiaries.
-It provides detailed financial ratios for the past five years as well as interim ratios for the last
four quarters.
-Financial ratios include profitability, margins and returns, liquidity and leverage, financial
position and efficiency ratios.
PRODUCTS AND SERVICES:
Seshadripuram academy of business studies. Page 30

A Study on Analysis of Financial Statement
1. PERSONAL BANKING:
SBI Term deposits SBI loan for pensioners
SBI Recurring Deposits Loan Against Mortgage of Property
SBI Housing loan, Loan Against Share and Debentures
SBI Car Loan Rent Plus Scheme
SBI Educational loan Medi -Plus Scheme
2. NRI services
3. Agriculture/ Rural Banking
4. International Banking
5. Corporate Banking
6. Domestic Treasury
7. Services
8. Interest Rates
9. Safe Deposit Lockers
10. Other services:
ATM Services
Demat services
Internet Banking
Mobile banking
SME
RBIEFT
E-Pay
Seshadripuram academy of business studies. Page 31

A Study on Analysis of Financial Statement
E- Rail
SBI Vishwa yatra foreign Travel Card
Broking Services
Gift Cheques
New products and services:
Apart from restructuring, SBI launched several innovation, value-added products and
services to project a customer friendly image. It launched a special service for corporate
customers called ‘tele banking and remote login’ to support transactional requests.
SCHEMES:
Now new schemes introduced by State Bank of India are:
Equity Scheme
Debt Scheme
Balanced Scheme
Exchange Traded Scheme.
WORK FORCE STRENGTH:
Main Branch strength:
SBI through the central Reserve Bank of India-also operates the world’s largest network, with
more than 13,500 branch offices throughout India, staffed by nearly 2,20,000 employees.
Principal Competitors:
ICICI Bank
Vijaya bank
Seshadripuram academy of business studies. Page 32

A Study on Analysis of Financial Statement
Bank of Baroda
Canara Bank
Punjab National Bank
Bank of India
Union Bank of India
Central Bank of India
HDFC Bank
Oriental Bank of Commerce
SOCIAL RESPONSIBILITY:
SBI branch:
1. SBI provides loan to weaker sections.
2. It provides Home Loan, vehicle Loan, personal Loan, and Educational Loan.
State Bank of India: SBI has taken an initiative to encourage commercial workers to save their
earning. This project was implemented in sonagachi, one of Asia’s largest red light areas,
where residents were encouraged to open a saving bank (SBI) account. While this can be
called a social service, it also reflects a sharp business sense.
Awards
Seshadripuram academy of business studies. Page 33

A Study on Analysis of Financial Statement
At SBI Funds Management, we devote considerable resources to gain, maintain and sustain
our profitable insights into market movements. The trust reposed on us by millions of
investors is a genuine tribute to our expertise in Fund Management and dedication to our
singular focus. And this has resulted in various awards and accolades for us from the fund
industry, motivating us to do better. Some of the awards won by us are listed below.
2011
Readers Digest Awards 2011 for Trusted Brand in Fund Management Category
ICRA Mutual Fund Awards 2011 for Magnum Income Fund - Floating Rate Plan - Long Term
Plan
2010
ICRA Mutual Fund Awards 2010 for Magnum Global Fund
2009
ICRA Mutual Funds Awards 2009 for Magnum Tax Gain Scheme 1993
The Lipper India Fund Awards 2009 for Various Schemes
2008
Outlook Money NDTV Profit Awards 2008
The Lipper India Fund Awards 2008 for Magnum Balanced Fund – Dividend
ICRA Mutual Fund Awards 2008 for Various Schemes
2007
Seshadripuram academy of business studies. Page 34

A Study on Analysis of Financial Statement
Outlook Money NDTV Profit Awards 2007
CNBC Awaaz Consumer Awards 2007
The Lipper India Fund Awards 2007 for Various Schemes
ICRA Mutual Funds Awards 2007 for Various Schemes
CNBC TV18 - CRISIL Mutual Fund of the Year Award 2007 for Various Schemes
CHAPTER -4
Data Analysis and Interpretation
Table no: 4.1 CURRENT RATIO=CURRENT ASSETS/CURRENT LIABILITIES
In crores
PARTICULAR 2007-2008 2008-2009 2009-2010 2010-2011 2011-2012
CURRENT ASSETS
67466.34 104403.80 96183.11 122874.15 143365.10
/CURRENT LIABILITIES
83362.30 110697.57 80336.70 105248.39 115083.80
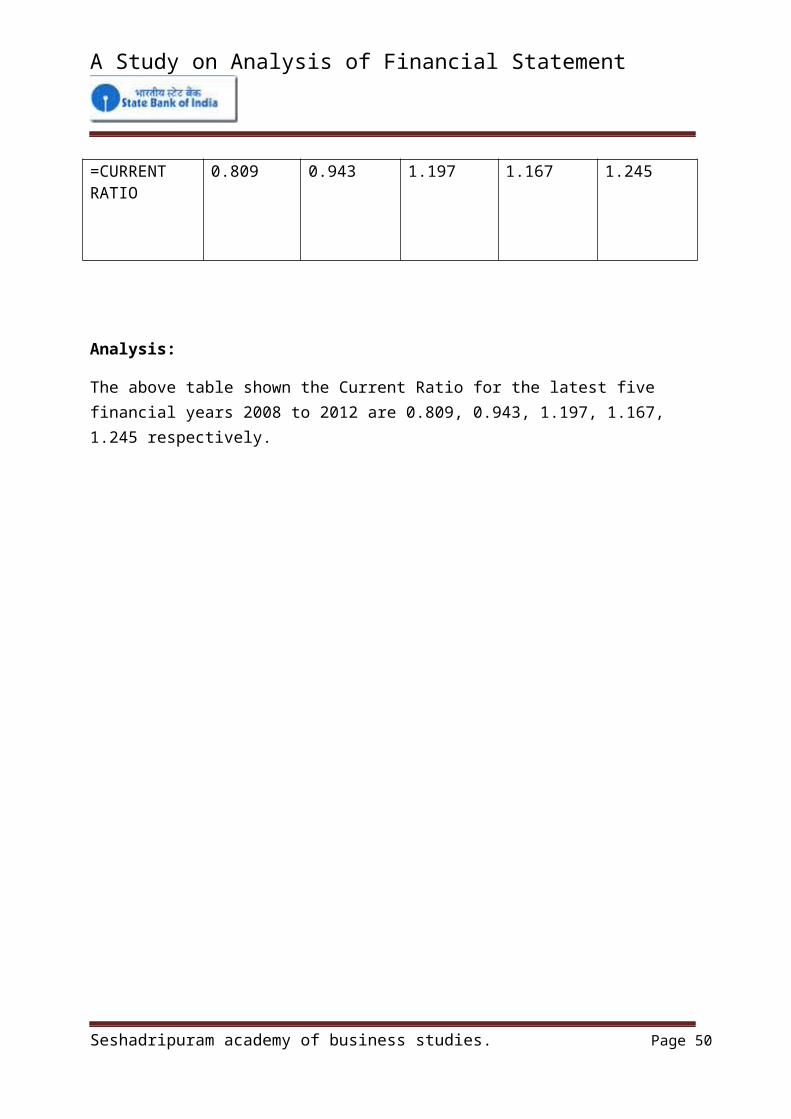
=CURRENT RATIO
0.809 0.943 1.197 1.167 1.245
Seshadripuram academy of business studies. Page 35
A Study on Analysis of Financial Statement
Analysis:
The above table shown the Current Ratio for the latest five financial years 2008 to 2012 are 0.809, 0.943, 1.197, 1.167, 1.245 respectively.
2007-2008 2008-2009 2009-2010 2010-2011 2011-20120
0.2
0.4
0.6
0.8
1
1.2
1.4
GRAPH 4.1 SHOWING THE CURRENT RATIO
CURRENT RATIO
years
in cro
res
Interpretation: From the above graph we can interpret that, in 2008 to 2010 slightly increases in the position of current ratio of the bank, where as in 2011 and 2012 fluctuate.
Seshadripuram academy of business studies. Page 36

A Study on Analysis of Financial Statement
Table no:4.2 RATIO OF LONG TERM DEBTS=FUND DEBT (LONG TERM LIABILITIES)*100/TOTAL CAPITATION
In crores
PARTICULAR 2007-2008 2008-2009 2009-2010 2010-2011 2011-2012
FUNDED DEBTS
51727.41 53713.68 103011.60 119568.96 126607.61
/TOTAL CAPITATION
49032.66 57947.70 65949.20 64986.04 66048.30
=LONG TERM DEBT RATIO
105.49 92.69 156.19 183.99 191.68
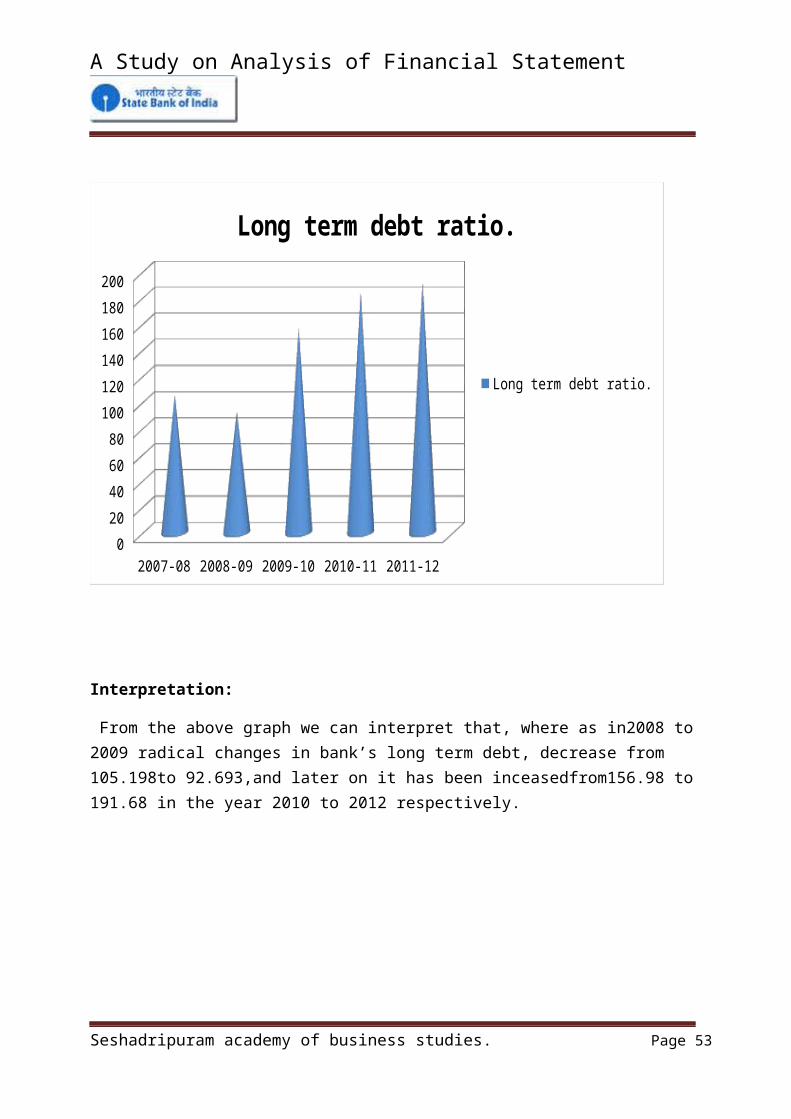
Analysis: The above table shown that the long term debt ratio is 105.49, 92.69, 156.19, 183.99and191.68 respectively.
Seshadripuram academy of business studies. Page 37
A Study on Analysis of Financial Statement
2007-08 2008-09 2009-10 2010-11 2011-120
20
40
60
80
100
120
140
160
180
200
Long term debt ratio.
Long term debt ratio.
Interpretation:
From the above graph we can interpret that, where as in2008 to 2009 radical changes in bank’s long term debt, decrease from 105.198to 92.693,and later on it has been inceasedfrom156.98 to 191.68 in the year 2010 to 2012 respectively.
Seshadripuram academy of business studies. Page 38
A Study on Analysis of Financial Statement
Table no 4.3 RATIO OF CURRENT ASSETS=CURRENT ASSETS/PROPREITORY FUNDS
In crores
PARTICULAR 2007-2008 2008-2009 2009-2010
2010-2011 2011-2012
CURRENT ASSETS
67466.34 104403.80 96183.85 122874.15 132508.50
PROPREITORY FUND
631.47 634.88 634.88 635.00 671.04
=RATIO OF CURRENT ASSETS
106.840 164.446 151.499 193.502 197.467
Analysis:
The above table shown the ratio of Current Asset for the last five financial years 2008to 2012 are 106.840, 164.446, 151.499, 193.502, 197.467.respectively.
Seshadripuram academy of business studies. Page 39

A Study on Analysis of Financial Statement
2007-2008
2008-2009
2009-2010
201 0-2011
2011-2012
0
50
100
150
200
250
4.3 GRAPH SHOWING RATIO OF CURRENT ASSETS
RATIO OF CURRENT ASSETS
years
in cr
ores
Interpretation:
From the above analysis we observe that the ratio of Current Assets has been increased in the year 2008 to 2009,106.840 to164.446 , it again decreased in 2010,here it has decreased to 151.499.againit has increased in 2011to 2012, from 193.502 to 197.467 respectively.
Seshadripuram academy of business studies. Page 40

A Study on Analysis of Financial Statement
Table no: 4.4 EQUITY OR PROPREITORY RATIO=SHARE HOLDER’S FUND/TOTAL ASSETS
In crores
PARTICULAR 2007-2008 2008-2009 2009-2010 2010-2011 2011-2012
SHARE HOLDER’S FUND
631.47 634.88 634.88 635.00 671.04
/TOTAL ASSETS
721526.32 964432.08 1053413.74 1223736.20 1335519.22
=EQUITY RATIO
0.0008 0.0006 0.0006 0.0005 0.0005
Analysis:
The above table shown the equity ratio for the latest five financial year 2008 to 2012 are 0.0008, 0.0006, 0.0006, 0.0005, 0.0005 respectively.
Seshadripuram academy of business studies. Page 41

A Study on Analysis of Financial Statement
2007-2008
2008-2009
2009-2010
2010-2011
2011-2012
0
0.0001
0.0002
0.0003
0.0004
0.0005
0.0006
0.0007
0.0008
0.0009
4.4 GRAPH SHOWING OF EQUITY RATIO
EQUITY RATIO
years
in cr
ores
Interpretation:
The efficiency of equity ratio decreased in 2008 to 2010, but in the year 2010 to 2012 it is 0.0005, in the same ratio position.
Seshadripuram academy of business studies. Page 42

A Study on Analysis of Financial Statement
4.5 SOLVENCY RATIO=TOTAL LIABILITIES-SHARE HOLDERS FUND/TOTAL ASSET
In crores
PARTICULAR 2007-2008 2008-2009 2009-2010 2010-2011 2011-2012
TOTAL LIABILITIES
721526.31 964432.08 1053413.73 1223736.20 1335519.22
-SHARE HOLDER’SFUND
631.47 634.88 634.88 635.00 671.04
/TOTAL ASSET 721526.32 964432.08 1053413.74 1223736.20 1335519.24
=SOLVENCY RATIO
0.9991 0.9993 0.9993 0.9994 0.9994
Analysis: The above table shown the Solvency Ratio is 0.9991, 0.9993, 0.9993, 0.9994, 0.9994 in the year 2008 to 2012 respectively.
Seshadripuram academy of business studies. Page 43
A Study on Analysis of Financial Statement
2007-2008 2008-2009 2009-2010 2010-2011 2011-20120.99895
0.999
0.99905
0.9991
0.99915
0.9992
0.99925
0.9993
0.99935
0.9994
4.5 GRAPH SHOWING THE SOLVENCY RATIO
SOLVENCY RATIO
years
in cr
ores
Interpretation: From the above graph we can identify that the bank has experienced the increased trend in solvency ratio from 2008 to 2012. Solvency ratio in the year 2009 is continued till the year 2010 as 0.9993.
Seshadripuram academy of business studies. Page 44

A Study on Analysis of Financial Statement
4.6 CURRENT ASSET TO TOTAL ASSET=CURRENT ASSET/TOTAL ASSET
In crores
PARTICULAR 2007-2008 2008-2009 2009-2010 2010-2011 2011-2012
CURRENT ASSET/
67466.34 104403.80 96183.11 122874.15 132508.50
TOTAL ASSET 721526.32 964432.8 1053413.74 12237620 1335519.24
=CURRENT ASSET TO TOTAL ASSET
0.0935 0.108 0.0913 0.0100 0.0992
Analysis: The above table shows the current asset to total asset is increase to year to year, but in 2011-2012 slitely decrease. It shows as follows 0.0935, 0.108, 0.0913, 0.0100, and 0.0992 respectively.
Seshadripuram academy of business studies. Page 45

A Study on Analysis of Financial Statement
2007-2008
2008-2009
2009-2010
2010-2011
2011-2012
0.08
0.085
0.09
0.095
0.1
0.105
0.11
4.6 GRAPH SHOWING CURRENT ASSET TO TOTAL ASSET
CURRENT ASSET TO TOTAL ASSET
years
in cro
res
Interpretation: the above graph shows current asset to total asset, it is fluctuating in compare to 2009- 2010 and fluctuates year to year.
Seshadripuram academy of business studies. Page 46

A Study on Analysis of Financial Statement
4.7 PRICE EARNING RATIO=RESERVES AND SURPLUS+EQUITY SHARE HOLDER/PREFERANCE SHARE
In crores
PARTICULAR 2007-2008 2008-2009 2009-2010 2010-2011 2011-2012
RESERVES AND SURPLUS+
48401.19 57312.82 65314.32 64351.04 83951.20
EQUITY SHARE HOLDER/
631.47 634.88 634.88 635 671.04
PREFERANCE SHARE
51727.41 53713.68 103011.60 119568.96 120840.68
=PRICE EARNING RATIO
0.947 1.078 0.640 0.543 0.700
Analysis: the price earnings ratio is 0.947, 1.078, 0.640, 0.543, and 0.700 for the year 2008 to 2012 respectively.
Seshadripuram academy of business studies. Page 47

A Study on Analysis of Financial Statement
2007-2008 2008-2009 2009-2010 2010-2011 2011-20120
0.2
0.4
0.6
0.8
1
1.2
4.7 GRAPH SHOWING OF PRICE EARNING RATIO(In crores)
PRICE EARNING RATIO
years
in cr
ores
Interpretation: The above graph shown in the year 2008 price earnings ratio has been increased from ,0.947 to1.078 but in the year 2010to 2012 suddenly it was decreased.
Seshadripuram academy of business studies. Page 48

A Study on Analysis of Financial Statement
4.8 EARNING PER SHARE=NET PROFIT AFTER TAX+PREFERANCE DIVIDEND/NUMBER OF EQUITY SHARE. In crores
PARTICULAR 2007-2008 2008-2009 2009-2010 2010-2011 2011-2012
NET PROFIT AFTER TAX+
6729.12 9121.23 9166.05 7370.35 11686.01
PREFERANCE DIVIDEND/
00 00 00 00 00
NUMBER OF EQUITY SHARE
631.47 634.88 634.88 635 671.04
=EARNING PER SHARE(in crores)
10.656 14.366 14.437 11.606 17.414
Analysis: The price earnings ratio is10.656, 14.366, 14.437, 11.606, 17.414 for the year 2008 to 2012 respectively.
Seshadripuram academy of business studies. Page 49
A Study on Analysis of Financial Statement
2007-2008
2008-2009
2009-2010
2010-2011
2011-2012
02468
1012141618
4.8 GRAPH SHOWING EARNING SHARE
EARNING PER SHARE(In crores)
years
in cr
ores
Interpretation: The above graph indicates the increased trend in earnings per share ratio year to year, but in the year 2011there is slightly decreased in earning per share ratio.
Seshadripuram academy of business studies. Page 50

A Study on Analysis of Financial Statement
4.9 DEBT EQUITY RATIO=OUT SIDER’S FUND (BORROWING)/SHARE HOLDER FUND
In crores
PARTICULAR 2007-2008 2008-2009 2009-2010 2010-2011 2011-2012
OUT SIDER’S FUND(BORROWING)
537403.94 742073.13 804116.26 933932.81 1043647.36
/SHARE HOLDERS FUND
631.47 634.88 634.88 635 671.04
=DEBT EQUITY RATIO
851.036 1168.839 1266.56 1470.760 1555.268
Analysis: The above table shows the debt equity ratio, it is increase year to year, likes 851.036, 1168.839, 1266.56, 1470.760, and 1555.268, respectively.
Seshadripuram academy of business studies. Page 51

A Study on Analysis of Financial Statement
2007-2008
2008-2009
2009-2010
2010-2011
2011-2012
0
200
400
600
800
1000
1200
1400
1600
4.9 GRAPH SHOWING DEBT EQUITY RATIO
4.9 GRAPH SHOWING DEBT EQUITY RATIO(In crores)
years
In cro
res
Interpretation: This graph shows the debt equity ratio, it is shown that it is increase year to year. The bank has good position in debt equity ratio.
Seshadripuram academy of business studies. Page 52
A Study on Analysis of Financial Statement
4.10 CURRENT LIABILITIES TO NET WORTH RATIO=CURRENT LIABILITIES/NET WORTH.
In crores
PARTICULAR 2007-2008 2008-2009 2009-2010 2010-2011 2011-2012
CURRENT LIABILITIES
83362.30 110697.57 80336.70 105248.39 115083.80
/NET WORTH 83951.20 64986.04 65949.20 57947.70 49032.66
=CURRENT LIABILITIES TO NET WORTH RATIO
0.992 1.703 1.218 1.816 2.347
Analysis: The above table shows that current liabilities to net worth ratio, it is slightly increase year to year, but in 2009 decrease. It shows as 0.992, 1.703, 1.218, 1.816, and 2.347 respectively.
Seshadripuram academy of business studies. Page 53

A Study on Analysis of Financial Statement
2007-2008 2008-2009 2009-2010 2010-2011 2011-20120
0.5
1
1.5
2
2.5
4.10 GRAPH SHOWING CURRENT LIABILITIES TO NET WORTH RATIO
years
in cro
res
Interpretation: The above graph shows the current liabilities to net worth ratio it fluctuate year to year.
Seshadripuram academy of business studies. Page 54

A Study on Analysis of Financial Statement
Table 4.11 shows TREND ANALYSIS OF 2008-2009.
PARTICULAR 2007-2008 (base year)
2008-2009 (current year)
Changes in percentage.% (Base year)
Changes in percentage. %(current year)
Assets1. Cash and balance with RBI.
51534.62 55546.17 100% 107.7%
2. Balance with banks, money at call.
15931.72 48857.63 100% 306.6%
3.Advances 416768.20 542503.20 100% 130.1%4.Investment 189501.27 275953.96 100% 145.6%5.Net block 3139.22 3574.41 100% 113.8%6.Capital working progress
234.26 263.44 100% 112.4%
7.Other assets 44417.03 37733.27 100% 84.9%8. Total assets 721526.32 964432.08 100% 133.6%CapitalandLiabilities1.Equity share capital
631.47 634.88 100% 100.5%
2.Reserves 48401.19 57312.82 100% 118.4%3.Net worth 49032.66 57947.70 100% 118.1%Long term Liabilities1.Deposits 537403.94 742073.13 100% 138.08%2.Borrowings 51727.41 53713.68 100% 103.85%3.Total debts 589131.35 795786.81 100% 135.0%4.Other Liabilities and provision
83362.30 110697.57 100% 132.7%
5.Total liabilities 721526.31 964432.08 100% 133.6%
Analysis:
Seshadripuram academy of business studies. Page 55

A Study on Analysis of Financial Statement
The cash and balance with RBI have been increased by 107.7%in the year 2009.
The money at call has been increased by 306.6% in the current year compare to base year.
The advances have been increased by 130.1% in year of 2009.
The investments of the bank have been increased by145.6% in the year 2009.
The net block balance of the bond has been slightly increased by 113.8% in the year 2009.
Capital work in progress has radically increased by112.4% in the year 2009.
Other assets have been decrease by 84.9% in the current year compare to base year.
The reserves have been increased by 118.4%in the year 2009.
The deposits have been increased by 138.08% in the year of 2009.
The borrowings of the bank have been increased by 103.85% in the year 2009.
The net block has been increased by 113.8% in the current year.
Equity shares have been increased by 100.5% in the current year.
Net worth has been increased by 118.1% in the year 2009.
Seshadripuram academy of business studies. Page 56

A Study on Analysis of Financial Statement
Cash and balance w
ith RBI
Balance w
ith banks, money a
t call
AdvancesNet b
lock
Capital workin
g progressInvest
ment
Other asset
s
Total asset
s
Equity share
capitalReserves
Net worth
Deposits
Borrowings
Total debts
Other liabilities
Total liabilitis
0
100
200
300
4.11 GRAPH SHOWING TREND ANALYSIS 2008 TO 2009.
4.11 GRAPH SHOWING TREND ANALYSIS 2008 TO 2009.
Seshadripuram academy of business studies. Page 57

A Study on Analysis of Financial Statement
Interpretation:
The Trend analysis of the financial statement made between the year 2008 and 2009, where 2008 has taken as base year.
The trend analysis financial statement analyzed clearly shows that the position of the statement in the year 2009.
The total assets have been increased in the year 2009, by 133.6%
The net worth has been increased by 118.1% in the current year compare to base year.
The total debts have been increased by 135% in the year 2009.
The other liabilities of the bank has been increased by 132.7%
The total liability of the bank has also been increased by 133.6% in the year 2009 as compare to that of 2008 as base year.
Seshadripuram academy of business studies. Page 58

A Study on Analysis of Financial Statement
Table 4.12 shows TREND ANALYSIS OF 2009-2010
PARTICULAR 2007-2008 (base year)
2009-2010 (current year)
Changes in percentage.% (Base year)
Changes in percentage% (current year)
Assets1. Cash and balance with RBI.
51534.62 61290.87 100% 118.9%
2. Balance with banks, money at call.
15931.72 34892.98 100% 219%
3.Advances 416768.20 631914.15 100% 151.6%4.Investment 189501.27 285790.07 100% 150.8%5.Net block 3139.22 4117.73 100% 131.1%6.Capital working progress
234.26 295.18 100% 126%
7.Other assets 44417.03 35112.76 100% 79.05%8. Total assets 721526.32 1053413.74 100% 145.9%Capital and Liabilities1.Equity share capital
631.47 634.88 100% 100.5%
2.Reserves 48401.19 65314.32 100% 134.9%3.Net worth 49032.66 65949.20 100% 134.5%Long term Liabilities1.Deposits 537403.94 804116.23 100% 149.6%2.Borrowings 51727.41 103011.60 100% 199.1%3.Total debts 589131.35 907127.83 100% 153.9%4.Other Liabilities and provision
83362.30 80336.70 100% 96.3%
5.Total liabilities 721526.31 1053413.73 100% 145.9%
Seshadripuram academy of business studies. Page 59

A Study on Analysis of Financial Statement
Analysis:
The cash and balance with RBI have been increased by 118.9%in the year 2010.
The money at call has been increased by 219% in the current year compare to base year.
The advances have been increased by 151.1% in year of 2010.
The investments of the bank have been increased by150.8% in the year 2010.
The net block balance of the bond has been slightly increased by 131.1% in the year 2010.
Capital work in progress has radically increased by126% in the year 2010.
Other assets have been decrease by 79.05% in the current year compare to base year.
The reserves have been increased by 134.9%in the year 2010.
The deposits have been increased by 149.6% in the year of 2010.
The borrowings of the bank have been increased by 199.1% in the year 2010.
The net block has been increased by 134.4% in the current year.
Equity shares have been increased by 100.5% in the current year.
Net worth has been increased by 118.9% in the year 2010.
Seshadripuram academy of business studies. Page 60

A Study on Analysis of Financial Statement
Cash and balance w
ith RBI
Balance w
ith banks, money at
call
Advances
Investments
Capital work in
progressOther as
setsTotal a
ssets
Equity share c
apitalReser
ves
Net worth
Deposits
BorrowingsTotal d
ebts
Other Liabilities
Total liabilitiesNet block
0
50
100
150
200
250
4.12 GRAPH SHOWS TREND ANALYSIS OF 2009-2010
Seshadripuram academy of business studies. Page 61

A Study on Analysis of Financial Statement
Interpretation:
The Trend analysis of the financial statement made between the year 2008 and 2010, where 2008 has taken as base year.
The trend analysis financial statement analyzed clearly shows that the position of the statement in the year 2010.
The total assets have been increased in the year 2010, by 145.5%
The net worth has been increased by 134.5% in the current year compare to base year.
The total debts have been increased by 153.9% in the year 2010.
The other liabilities of the bank has been increased by 196.3%
The total liability of the bank has also been increased by 145.9% in the year 2010 as compare to that of 2008 as base year.
Seshadripuram academy of business studies. Page 62

A Study on Analysis of Financial Statement
4.13 TABLE SHOWS TREND ANALYSIS OF 2010-2011
PARTICULAR 2007-2008 (Base year)
2010-2011 (Current year)
Changes in percentage.% (Base year)
Changes in percentage%(current year)
Assets1. Cash and balance with RBI.
51534.62 94395.5 100% 183.1%
2. Balance with banks, money at call.
15931.72 28478.65 100% 178.7%
3.Advances 416768.20 756719.45 100% 181.1%
4.Investment 189501.27 295600.57 100% 155.9%
5.Net block 3139.22 4413.95 100% 140.6%6.Capital working progress
234.26 332.23 100% 141.8%
7.Other assets 44417.03 43777.85 100% 98.5%
8. Total assets 721526.32 1223736.20 100% 169.6%
Capital and Liabilities
1.Equity share capital 631.47 635 100% 100.5%
2.Reserves 48401.19 64351.04 100% 132.9%
3.Net worth 49032.66 64986.04 100% 132.5%
Long term Liabilities1.Deposits 537403.94 933932.81 100% 173.7%
2.Borrowings 51727.41 119568.96 100% 231.1
3.Total debts 589131.35 1053501.77 100% 178.8%
4.Other Liabilities and provision
83362.30 105248.39 100% 126.6%
5.Total liabilities 721526.31 1223736.20 100% 169.6%
Seshadripuram academy of business studies. Page 63

A Study on Analysis of Financial Statement
Analysis:
The cash and balance with RBI have been increased by 183.1%in the year 2011.
The money at call has been increased by 178.7% in the current year compare to base year.
The advances have been increased by 181.1% in year of 2011.
The investments of the bank have been increased by155.5% in the year 2011.
The net block balance of the bond has been slightly increased by 140.6% in the year 2011.
Capital work in progress has radically increased by141.8% in the year 2011.
Other assets have been decrease by 98.5% in the current year compare to base year.
The reserves have been increased by 132.9%in the year 2011.
The deposits have been increased by 173.7% in the year of 2011.
The borrowings of the bank have been increased by 231.1% in the year 2011.
The net block has been increased by 140.6% in the current year.
Equity shares have been increased by 100.5% in the current year.
Net worth has been increased by 132.5% in the year 2011.
Seshadripuram academy of business studies. Page 64

A Study on Analysis of Financial Statement
Cash and balance w
ith RBI
Balance w
ith banks, money a
t callAdvances
Invest ment
Net block
Capital work in
progressOther a
ssets
Total asset
s
Equity share
capitalReserves
Net worth
Deposits
Borrowings
Total debts
Other Liabilities a
nd provisionTotal li
abilities
0
50
100
150
200
250
4.13 GRAPH SHOWS TREND ANALYSIS OF 2010-2011
Seshadripuram academy of business studies. Page 65

A Study on Analysis of Financial Statement
Interpretation:
The Trend analysis of the financial statement made between the year 2008 and 2011, where 2008 has taken as base year.
The trend analysis financial statement analyzed clearly shows that the position of the statement in the year 2011.
The total assets have been increased in the year 2011, by 169.6%
The net worth has been increased by 132.5% in the current year compare to base year.
The total debts have been increased by 178.8% in the year 2011.
The other liabilities of the bank has been increased by 126.6%
The total liability of the bank has also been increased by 169.6% in the year 2011 as compare to that of 2008 as base year.
Table no 4.14: Table shows Trend analysis of 2011-2012
Seshadripuram academy of business studies. Page 66

A Study on Analysis of Financial Statement
PARTICULAR 2007-2008 (Base year)
2011-2012 (current year)
Changes in percentage.% (Base year)
Changes in percentage%(current year)
Assets1. Cash and balance with RBI.
51534.62 54075.94 100% 104.9%
2. Balance with banks, money at call.
15931.72 43087.23 100% 270.4%
3.Advances 416768.20 867578.89 100% 208.1%4.Investment 189501.27 312197.61 100% 164.7%5.Net block 3139.22 5133.87 100% 163.3%6.Capital working progress
234.26 332.68 100% 142.0%
7.Other assets 44417.03 53113.02 100% 119.5%8. Total assets 721526.32 1335519.24 100% 185.0%
Capital and Liabilities1.Equity share capital
631.47 671.04 100% 106.2%
2.Reserves 48401.19 83280.16 100% 172.0%
3.Net worth 49032.66 83951.20 100% 171.2%
Long term Liabilities1.Deposits 537403.94 1043647.36 100% 194.2%
2.Borrowings 51727.41 127005.57 100% 245.5%
3.Total debts 589131.35 1170652.93 100% 198.7%
4.Other Liabilities and provision
83362.30 80915.09 100% 97.0%
5.Total liabilities 721526.31 1335519.22 100% 185.0%
Seshadripuram academy of business studies. Page 67

A Study on Analysis of Financial Statement
Analysis:
The cash and balance with RBI have been increased by 104.9%in the year 2012.
The money at call has been increased by 270.4% in the current year compare to base year.
The advances have been increased by 208.1% in year of 2012.
The investments of the bank have been increased by164.7% in the year 2012.
The net block balance of the bond has been slightly increased by 163.3% in the year 2012.
Capital work in progress has radically increased by142% in the year 2012.
Other assets have been decrease by 119.5% in the current year compare to base year.
The reserves have been increased by 172%in the year 2012.
The deposits have been increased by 194.2% in the year of 2012.
The borrowings of the bank have been increased by 245.5% in the year 2012.
The net block has been increased by 163.3% in the current year.
Equity shares have been increased by 106.2% in the current year.
Net worth has been increased by 171.2% in the year 2012.
Seshadripuram academy of business studies. Page 68

A Study on Analysis of Financial Statement
Cash and balance w
ith RBI
Balance w
ith banks, money a
t call
Advances
Investment
Net block
Capital work in
progressOther a
ssets
Total asset
s
Equity share
capitalReserves
Net worth
Deposits
Borrowings
Total debts
Other Liabilities a
nd provisionTotal li
abilities
0.00%50.00%
100.00%150.00%200.00%250.00%300.00%
4.14 GRAPH SHOWS TREND ANALYSIS OF 2011-2012
Seshadripuram academy of business studies. Page 69

A Study on Analysis of Financial Statement
Interpretation:
The Trend analysis of the financial statement made between the year 2008 and 2012, where 2008 has taken as base year.
The trend analysis financial statement analyzed clearly shows that the position of the statement in the year 2012.
The total assets have been increased in the year 2012, by 185%
The net worth has been increased by 171.2% in the current year compare to base year.
The total debts have been increased by 198.7% in the year 2012.
The other liabilities of the bank has been increased by 97.00%
The total liability of the bank has also been increased by 185% in the year 2012 as compare to that of 2008 as base year.
Seshadripuram academy of business studies. Page 70

A Study on Analysis of Financial Statement
4.15 Table shows: COMPARATIVE FINANCIAL STATEMENT ANALYSIS.
Particular 2008 2009 Increase/decrease in (rs)
Increase/decrease in(%)
Assets1. Cash and balance with RBI.
51534.62 55546.17 4011.55 7.78%
2. Balance with banks, money at call.
15931.72 48857.63 32926.06 206.66%
3.Advances 416768.20 542503.20 12735 30.16%4.Investment 189501.27 275953.96 86452.69 45.62%5.Net block 3139.22 3574.41 435.19 13.86%6.Capital work in progress
234.26 263.44 29.18 12.45%
7.Other assets 44417.03 37733.27 -6684.03 -15.04%8. Total assets 721526.32 964432.08 242905.76 33.66%Capital and Liabilities1.Equity share capital
631.47 634.88 3.41 0.54%
2.Reserves 48401.19 57312.82 8911.63 18.41%3.Net worth 49032.66 57947.70 8915.04 18.18%Long term Liabilities1.Deposits 537403.94 742073.13 204669.19 38.08%2.Borrowings 51727.41 53713.68 1986.27 3.83%3.Total debts 589131.35 795786.81 206655.46 35.07%4.Other Liabilities and provision
83362.30 110697.57 27335.27 32.79%
5.Total liabilities
721526.31 964432.08 242905.77 33.66%
Seshadripuram academy of business studies. Page 71

A Study on Analysis of Financial Statement
Analysis:
The cash and balance with RBI have been increased 7.78% in the year 2008 The money at call have been increased by 206.6% in the year 2009 The advances have been increased by 30.16 %in the year 2009 The investment of the bank have been increased by 45.62% in the year 2009 Capital work in progress has radically increased by 12.45% when compared to
past year Other assets have also been decreased -15.04% The equity share capital have been increased by 054% in the year 2008 and
2009 The reserves have been increased by 18.41% in the year 2009 The net block balance of the bank has been slightly increased by 38.08% in the
year 2009 The borrowings of the bank has also been increased by 3.83 % in the year 2009
as compared with that of 2008
Interpretation:
The comparative statement made between the years 2008 and 2009 has shown many increased and decreased percentage.
The statement analyzed clearly shows that the position of the statement in 2008 has radically changed in the year 2009
The total assets have been increased by 14.71% in the year 2009 The net worth have been increased by 18.18% in the year 2009 The total debt have been increased by 35.075 in the year 2009 as compared
with that of 2008 The other liabilities of the bank also been increased by 32.79% in the year 2009 The total liabilities of the bank also been increased by 33.66% in the year 2009
as compared with that of 2008.
Seshadripuram academy of business studies. Page 72

A Study on Analysis of Financial Statement
1. Cash an
d balance w
ith RBI.
2. Balance w
ith banks, money a
t call.3.Advan
ces
4.Investment
5.Net block
6.Capital work i
n progress
7.Other asse
ts
8. Total
assets
1.Equity
share cap
ital2.Rese
rves
3.Net worth
1.Deposits
2.Borrowings
3.Total
debts
4.Other Liab
ilities a
nd provision
5.Total
liabiliti
es-50.00%
0.00%
50.00%
100.00%
150.00%
200.00%
250.00%
Comparative balance sheet of 2008-2009
Seshadripuram academy of business studies. Page 73

A Study on Analysis of Financial Statement
4.16 Table shows that COMPARATIVE BALANCE SHEET OF 2009-2010
Particular 2009 2010 Increase/ Decrease in (rs)
Increase/Decrease in (%)
Assets1. Cash and balance with RBI.
55546.17 61290.87 5744.7 10.34%
2. Balance with banks, money at call.
48857.63 34892.98 -13964.65 -28.58%
3.Advances 542503.20 631914.15 89410.95 16.48%4.Investment 275953.96 285790.07 9836.11 3.56%5.Net block 3574.41 4117.73 543.32 15.20%6.Capital work in progress
263.44 295.18 31.74 12.04%
7.Other assets 37733.27 35112.76 -2620.51 -6.94%8. Total assets 964432.08 1053413.74 88981.7 9.22%Capital and Liabilities1.Equity share capital
634.88 634.88 000 00%
2.Reserves 57312.82 65314.32 8001.5 13.96%3.Net worth 57947.70 65949.20 8001.5 13.80%Long term Liabilities1.Deposits 742073.13 804116.23 62043.1 8.36%2.Borrowings 53713.68 103011.60 49297.92 91.773.Total debts 795786.81 907127.83 111341.02 13.99%4.Other Liabilities and provision
110697.57 80336.70 -30360.87 -27.42%
5.Total liabilities
964432.08 1053413.73 88981.7 9.22%
Seshadripuram academy of business studies. Page 74

A Study on Analysis of Financial Statement
Analysis:
The cash and balance with RBI have been increased 10.38% in the year 2010 The money at call have been increased by -28.58% in the year 2010 The advances have been increased by 16.48%in the year 2010 The investment of the bank have been increased by 3.56% in the year 2010 Capital work in progress has radically increased by 12.04% when compared to
past year Other assets have also been decreased -6.94% The equity share capital have been increased by 00% in the year 2009 and 2010 The reserves have been increased by 13.96% in the year 2010 The net block balance of the bank has been slightly increased by 15.20% in the
year 2010 The borrowings of the bank has also been increased by 91.77 % in the year
2010 as compared with that of 2009
Interpretation:
The comparative statement made between the years 2009 and 2010 has shown many increased and decreased percentage.
The statement analyzed clearly shows that the position of the statement in 2009 has radically changed in the year 2010
The total assets have been increased by 9.22% in the year 2010 The net worth have been increased by 13.80% in the year 2010 The total debt have been increased by 13.99%in the year 2010 as compared
with that of 2009 The other liabilities of the bank also been decreased by -27.42% in the year
2010 The total liabilities of the bank also been increased by 9.22% in the year 2010
as compared with that of 2009.
Seshadripuram academy of business studies. Page 75
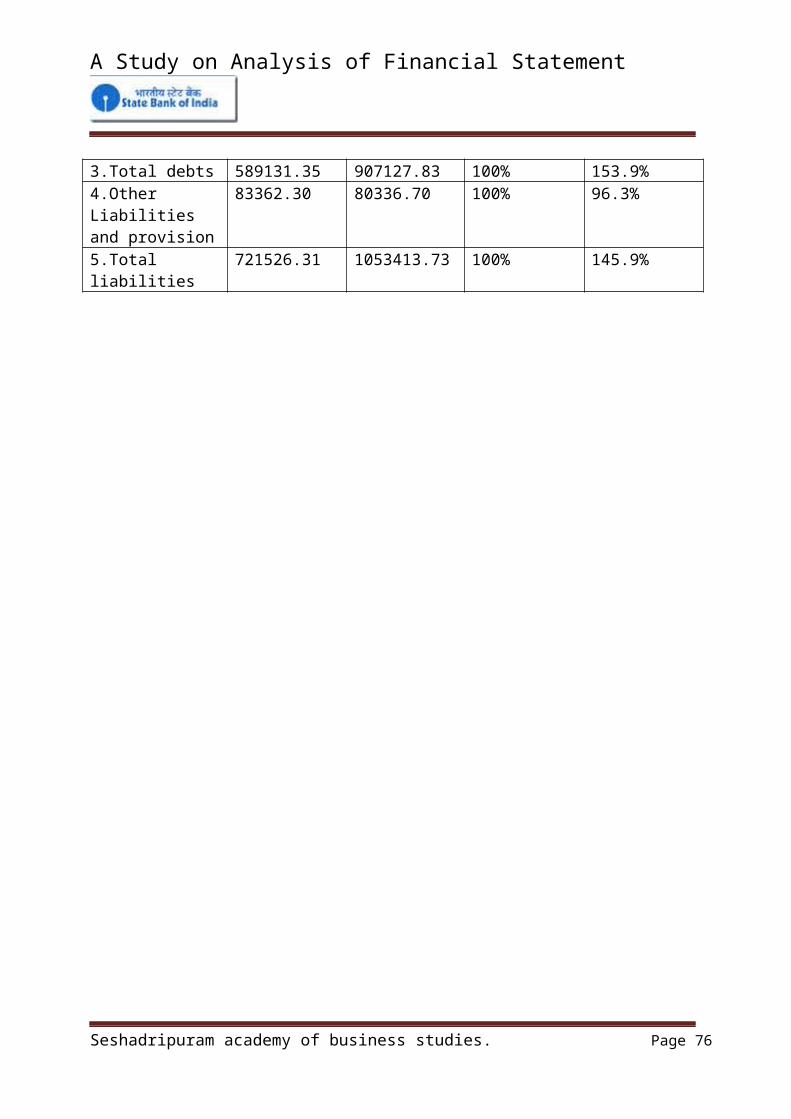
A Study on Analysis of Financial Statement
1. Cash and balan
ce with RBI.
2. Balance w
ith banks, money a
t call.3.Advan
ces
4.Investment
5.Net block
6.Capital work i
n progress
7.Other asset
s
8. Total a
ssets
1.Equity share
capital2.Rese
rves
3.Net worth
1.Deposits
2.Borrowings
3.Total debts
4.Other Liabilities a
nd provision
5.Total liabilities-40
-200
20406080
100
4.16 Graph shows that comparative balance sheet
Axis Title
Axis Title
Seshadripuram academy of business studies. Page 76

A Study on Analysis of Financial Statement
4.17 Table shows that COMPARATIVE BALANCE SHEET OF 2010-2011
Particular 2010 2011 Increase/ decrease in(rs)
Increase/decrease in(%)
Assets1. Cash and balance with RBI.
61290.87 94395.5 33104.63 54.01%
2. Balance with banks, money at call.
34892.98 28478.65 -6414.33 -18.38%
3.Advances 631914.15 756719.45 124805.3 19.75%4.Investment 285790.07 295600.57 9810.5 3.43%5.Net block 4117.73 4413.95 296.22 7.19%6.Capital working progress
295.18 332.23 37.05 12.55%
7.Other assets 35112.76 43777.85 8665.09 24.67%8. Total assets 1053413.74 1223736.20 170322..5 16.16%Capital and Liabilities1.Equity share capital
634.88 635 0.12 0.018%
2.Reserves 65314.32 64351.04 -963.28 -1.47%3.Net worth 65949.20 64986.04 -963.16 -1.46%Long term Liabilities1.Deposits 804116.23 933932.81 129816.58 16.14%2.Borrowings 103011.60 119568.96 16557.36 16.07%3.Total debts 907127.83 1053501.77 146373.9 16.13%4.Other Liabilities and provision
80336.70 105248.39 24911.69 31.09%
5.Total liabilities
1053413.73 1223736.20 170322.5 16.16%
Seshadripuram academy of business studies. Page 77

A Study on Analysis of Financial Statement
Analysis:
The cash and balance with RBI have been increased 54.04% in the year 2011 The money at call have been decreased by -18.38% in the year 2011 The advances have been increased by 19.75%in the year 2011 The investment of the bank have been increased by 3.47% in the year 2011 Capital work in progress has radically increased by 12.55% when compared to
past year Other assets have also been decreased 24.67% The equity share capital have been increased by 0.018% in the year 2010 and
2011 The reserves have been increased by 7.19% in the year 2011 The net block balance of the bank has been slightly increased by -1.46% in the
year 2011 The borrowings of the bank has also been increased by 91.77 % in the year
2011 as compared with that of 2010
Interpretation:
The comparative statement made between the years 2010 and 2011 has shown many increased and decreased percentage.
The statement analyzed clearly shows that the position of the statement in 2010 has radically changed in the year 2011
The total assets have been increased by 16.16% in the year 2011 The net worth have been increased by -1.46% in the year 2011 The total debt have been increased by 16.13%in the year 2011 as compared
with that of 2010 The other liabilities of the bank also been decreased by 31.09% in the year
2011 The total liabilities of the bank also been increased by 16.16% in the year
2011as compared with that of 2010.
Seshadripuram academy of business studies. Page 78

A Study on Analysis of Financial Statement
1. Cash an
d balance w
ith RBI.
2. Balance w
ith banks, money a
t call.3.Advan
ces
4.Investment
5.Net block
6.Capital workin
g progre
ss
7.Other asse
ts
8. Total
assets
1.Equity
share cap
ital2.Rese
rves
3.Net worth
1.Deposits
2.Borrowings
3.Total
debts
4.Other Liab
ilities a
nd provision
5.Total
liabiliti
es-20.00%-10.00%
0.00%10.00%20.00%30.00%40.00%50.00%60.00%
4.17 Graph shows that comparative balance sheet
Seshadripuram academy of business studies. Page 79

A Study on Analysis of Financial Statement
4.18 Table show that COMPARATIVE BALANCE SHEET OF 2011-2012
Particular 2011 2012 Increase/Decrease in(rs)
Increase/Decrease in (%)
Assets1. Cash and balance with RBI.
94395.5 54075.94 -40319.56 -42.71%
2. Balance with banks, money at call.
28478.65 43087.23 1408.58 51.29%
3.Advances 756719.45 867578.89 110859.44 14.65%4.Investment 295600.57 312197.61 16597.04 5.61%5.Net block 4413.95 5133.87 719.92 16.31%6.Capital working progress
332.23 332.68 0.45 0.13%
7.Other assets 43777.85 53113.02 9335.17 21.32%8. Total assets 1223736.20 1335519.24 111783 9.13%Capital and Liabilities1.Equity share capital
635 671.04 36.04 5.67%
2.Reserves 64351.04 83280.16 18929.12 29.41%3.Net worth 64986.04 83951.20 18965.16 29.18%Long term Liabilities1.Deposits 933932.81 1043647.36 109714.5 11.74%2.Borrowings 119568.96 127005.57 7436.61 6.21%3.Total debts 1053501.77 1170652.93 117151.2 11.12%4.Other Liabilities and provision
105248.39 80915.09 -24333.3 -23.11%
5.Total liabilities
1223736.20 1335519.22 111783 9.13%
Seshadripuram academy of business studies. Page 80

A Study on Analysis of Financial Statement
Analysis:
The cash and balance with RBI have been decreased -42.71% in the year 2012 The money at call have been decreased by 51.29% in the year 2012 The advances have been increased by 14.65%in the year 2012 The investment of the bank have been increased by 5.61% in the year 2012 Capital work in progress has radically increased by 0.13% when compared to
past year Other assets have also been decreased 21.32% The equity share capital have been increased by 5.67% in the year 2011 and
2012 The reserves have been increased by 29.41% in the year 2012 The net block balance of the bank has been slightly increased by 16.31% in the
year 2012 The borrowings of the bank has also been increased by 6.21% in the year 2012
as compared with that of 2011
Interpretation:
The comparative statement made between the years 2011 and 2012 has shown many increased and decreased percentage.
The statement analyzed clearly shows that the position of the statement in 2011 has radically changed in the year 2012
The total assets have been increased by 9.13% in the year 2012 The net worth have been increased by 29.18% in the year 2012 The total debt have been increased by 11.12%in the year 2012 as compared
with that of 2011 The other liabilities of the bank also been decreased by -23.11% in the year
2012 The total liabilities of the bank also been increased by 9.13% in the year 2012as
compared with that of 2011.
Seshadripuram academy of business studies. Page 81

A Study on Analysis of Financial Statement
1. Cash an
d balance w
ith RBI.
2. Balance w
ith banks, money a
t call.3.Advan
ces
4.Investment
5.Net block
6.Capital workin
g progre
ss
7.Other asse
ts
8. Total
assets
1.Equity
share cap
ital2.Rese
rves
3.Net worth
1.Deposits
2.Borrowings
3.Total
debts
4.Other Liab
ilities a
nd provision
5.Total
liabiliti
es
-60.00%
-40.00%
-20.00%
0.00%
20.00%
40.00%
60.00%
4.18 Graph shows that comparative balance sheet
Axis Title
Axis Title
Seshadripuram academy of business studies. Page 82

A Study on Analysis of Financial Statement
4.18 Table show that COMMON SIZE STATEMENT OF 2008
Particular 2008 Increase/decrease in %Owners fundShare capital 631.47 0.08%Reserve 48401.19 6.70%Deposits 537403.94 74.48%Borrowings 51727.41 7.16%Total (a) 638164.01 88.44%Current liabilitiesOther liabilities 83362.30 11.55%Total (b) 83362.30 11.55%Total (a+b) 721526.31 100%AssetsCurrent assetsCash and balances 51534.62 7.14%Balance with bank, money at call
15931.72 2.20%
Advances 416768.20 57.76%Other assets 44417.03 6.15%Total(a) 528651.57 73.26%Fixed assetsInvestment 189501.27 26.26%Net block 3139.22 0.43%Capital work in progress 234.26 0.032%
Total(b) 192874.75 26.73%Total (a+b) 721526.32 100%
Seshadripuram academy of business studies. Page 83
A Study on Analysis of Financial Statement
Owners fund(a)
Share cap
italReserve
Deposits
Borrowings
Current lia
bilities(b)
Other liabilities
Total (a+b
)Asset
s
Current as
sets(a)
Cash and balan
ces
Balance w
ith bank, money a
t callAdvan
ces
Other asset
s
Fixed ass
ets(b)
Investment
Net block
Capital work i
n progressTotal (
a+b)
0.00%
20.00%
40.00%
60.00%
80.00%
100.00%
4.18 Graph shows that common size balance sheet
Seshadripuram academy of business studies. Page 84

A Study on Analysis of Financial Statement
4.19 table shows that COMMON SIZE BALANCE SHEET OF 2009
Particular 2009 Increase/decrease in %Owners fundShare capital 634.88 0.065%Reserve 57312.82 5.94%Deposits 742073.13 76.94%Borrowings 53713.68 5.56%Total (a) 853734.51 88.52%Current liabilitiesOther liabilities 110697.57 11.47%Total (b) 110697.57 11.47%Total (a+b) 964432.08 100%AssetsCurrent assetsCash and balances 55546.17 5.71%Balance with bank, money at call
48857.03 5.03%
Advances 542503.20 55.86%Other assets 37733.27 3.88%Total(a) 684639.67 70.50%Fixed assetsInvestment 275953.96 28.41%Net block 3574.41 0.36%Capital work in progress 263.44 0.027%Total(b) 279791.81 28.81%Total (a+b) 971115.84 100%
4.20
Seshadripuram academy of business studies. Page 85

A Study on Analysis of Financial Statement
Owners fund(a)
Share capitalReser
veDeposits
Borrowings
Current liab
ilities(b)
Other liabilities
Total (a+b)
Assets
Current ass
ets(a)
Cash and balances
Balance w
ith bank, money a
t call
Advances
Other asset
s
Fixed asse
ts(b)
Investment
Net block
Capital work in
progressTotal (
a+b)
020406080
100
4.19 Graph shows that common size balance sheet
Seshadripuram academy of business studies. Page 86
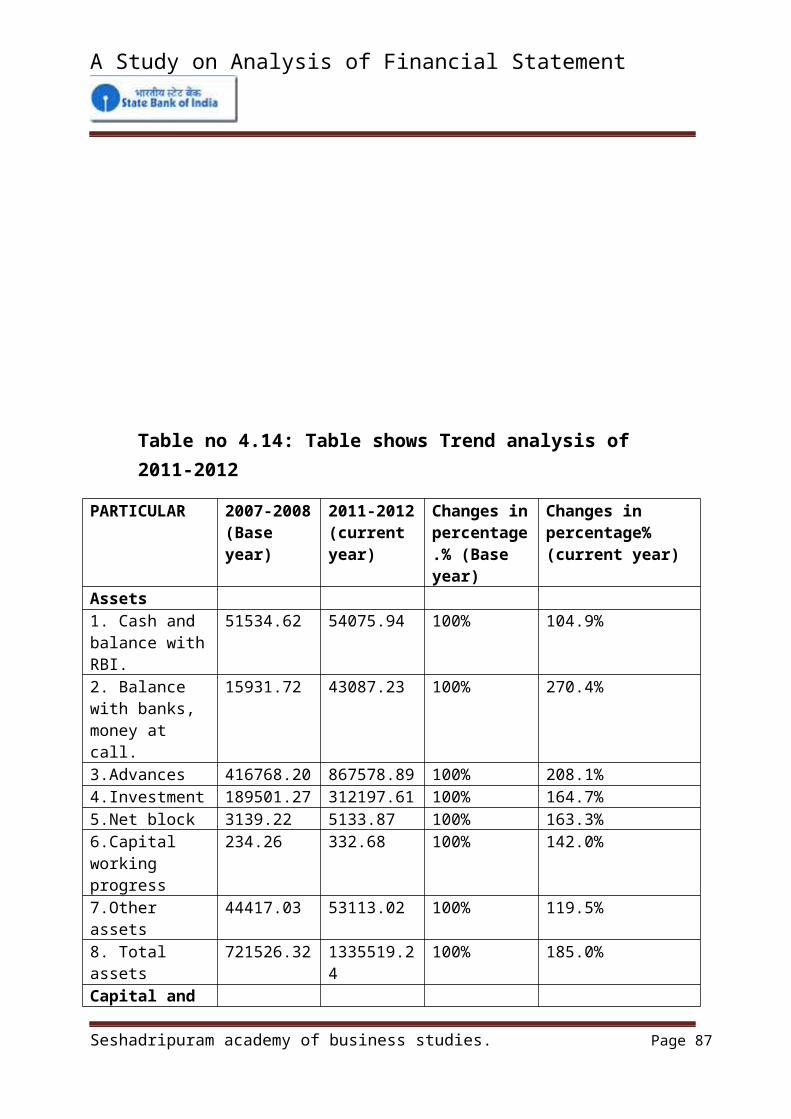
A Study on Analysis of Financial Statement
4.20 table shows that COMMON SIZE BALANCE SHEET OF 2010
Particular 2010 Increase/decrease in %Owners fundShare capital 634.88 0.060%Reserve 65314.32 6.20%Deposits 804116.23 76.33%Borrowings 103011.60 9.77%Total (a) 973077.03 92.37%Current liabilitiesOther liabilities 80336.70 7.62%Total (b) 80336.70 7.62%Total (a+b) 1053413.7 100%AssetsCurrent assetsCash and balances 61290.87 5.81%Balance with bank, money at call
34892.98 3.31%
Advances 631914.15 59.98%Other assets 35112.76 3.33%Total(a) 763210.76 72.45%Fixed assetsInvestment 285790.07 2.71%Net block 4117.73 0.39%
Capital work in progress 295.18 0.028%Total(b) 290202.98 27.54%Total (a+b) 1053413.7 100%
5
Seshadripuram academy of business studies. Page 87

A Study on Analysis of Financial Statement
Owners fund(a) Reser
ve
Borrowings
Current lia
bilities(b)
Total (a+b
)
Current as
sets(a)
Balance w
ith bank, money a
t callOther a
ssets
Investment
Capital work in
progress
0.00%20.00%40.00%60.00%80.00%
100.00%
4.20 Graph shows that common size balance sheet
Axis Title
Axis Title
Seshadripuram academy of business studies. Page 88
A Study on Analysis of Financial Statement
4.21 table shows that COMMON SIZE BALANCE SHEET OF 2011
Particular 2011 Increase/decrease in%Owners fundShare capital 635 0.051%Reserve 64351.04 5.25%Deposits 933932.81 76.31%Borrowings 119568.96 9.77%Total (a) 1118487.8 91.39%Current liabilitiesOther liabilities 105248.39 8.60%Total (b) 105248.39 8.60%Total (a+b) 1223736.1 100%AssetsCurrent assetsCash and balances 94395.5 7.71%Balance with bank, money at call
28478.65 2.32%
Advances 756719.45 61.83%Other assets 43777.85 3.57%Total(a) 923371.45 75.45%Fixed assetsInvestment 295600.57 24.15%Net block 4413.95 0.36%Capital work in progress 332.23 0.027%Total(b) 300346.75 24.54%Total (a+b) 1223718.2 100%
Seshadripuram academy of business studies. Page 89

A Study on Analysis of Financial Statement
Owners fund
Share cap
italReserveDeposits
Borrowings
Current lia
bilities
Other liabilities
Total (a+b
)Assets
Current as
sets
Cash and balan
ces
Balance w
ith bank, money a
t call
Advances
Other asset
s
Fixed ass
ets
Investment
Net block
Capital work in
progressTotal (
a+b)
0.00%
20.00%
40.00%
60.00%
80.00%
100.00%
4.21 Graph shows that common size balance sheet
Seshadripuram academy of business studies. Page 90

A Study on Analysis of Financial Statement
4.22 table shows that COMMON SIZE BALANCE SHEET OF 2012
Particular 2012 Increase/decrease in %Owners fundShare capital 671.04 0.05%Reserve 83280.16 6.23%Deposits 1043647.36 78.14%Borrowings 127005.57 9.50%Total (a) 1254604 93.94%Current liabilitiesOther liabilities 80915.09 6.05%Total (b) 80915.09 6.05%Total (a+b) 1335519 100%AssetsCurrent assetsCash and balances 54075.94 4.04%Balance with bank, money at call
43087.23 3.22%
Advances 867578.89 64.96%Other assets 53113.02 3.97%Total(a) 1017855 76.21%Fixed assetsInvestment 312197.61 23.37%Net block 5133.87 0.38%Capital work in progress 332.68 0.024%Total(b) 317664.16 23.78%Total (a+b) 1335519.1 100%
Seshadripuram academy of business studies. Page 91

A Study on Analysis of Financial Statement
Seshadripuram academy of business studies. Page 92

A Study on Analysis of Financial Statement
Owners fund
Share cap
italRese
rve
Deposits
Borrowings
Current lia
bilities
Other liab
ilities
Total (a+
b)
Current as
sets
Cash an
d balances
Balance w
ith bank, money a
t callAdvan
ces
Other asse
ts
Fixed ass
ets
Investment
Net block
Capital work i
n progress
Total (a+
b)0.00%
20.00%40.00%60.00%80.00%
100.00%
4.22 Graph shows that common size balance sheet
Series 1
CHAPTER-5
FINDINGS AND SUMMERIZING.
The working capital position of the bank is good because it is maintaining more current assets than current liabilities. Current ratio for the year 2008, 2009, 2010, 2011, 2012 are0.809, 0.943, 1.197, 1.167, and 1.245 respectively. It is the standard level of 2:1.
The bank has maintained good current assets.
Overall analyzed statement clearly shows that the banks financial position in yearly wise it has been increased year to year.
The investments of the bank have been gradually increased year to year.
The negative statement helps the bank to improve its future position.
The profitability position of the bank is very good.
The net worth of the bank has been gradually increased.
Seshadripuram academy of business studies. Page 93

A Study on Analysis of Financial Statement
The overall total assets have been increase year to year.
The net profit has gradually increased year to year but it has slightly decreased in the year 2011.
The total income is increase year to year. When compared to total expenses. Which declares that the bank is in good position
Current liabilities to net worth ratio for the year 2008, 2009,2010,2011,2012 are 0.992, 1.703, 1.218, 1.816, 2.347.respectivly.
SUGGESTIONS:
The overall performance of the bank is satisfactory; particularly the last three trading profit is good.
Reduce the excessive expenses incurred in the bank to increase for net profit.
The bank has to achieve the stability in its profitability.
The management must think over new policies to generate income by sufficient utilization of exisisting assets.
The other assets of bank is decreased in year to year, in order to do so, it has to adopt proper strategies to overcome it.
The bank has to formulate proper strategies to increase its cash position.
Seshadripuram academy of business studies. Page 94

A Study on Analysis of Financial Statement
It is suggested that to maintain the money at call position.
Compared to the deposits borrowings of the bank is increase year to year, bank has to take some measure to control it.
Seshadripuram academy of business studies. Page 95

A Study on Analysis of Financial Statement
CHAPTER-6
Conclusion
The project “Analysis of the financial statement” in SBI has been under taken with the objectives to analyze and interpret the bank’s financial performance. The analyze was undertaken with the help of financial tools such as Ratios, trend percentages.
After having solved the ratios, trend percentages and analyzing the financial data, we can conclude that the bank has gradually improved its financial position year to year.
Thus, Ratios, Trend percentage have been a very useful technique, which has highlighted the performance of STATE BANK OF INDIA. To conclude that the bank’financial position is satisfactory.
Seshadripuram academy of business studies. Page 96

A Study on Analysis of Financial Statement
ANEXTURES
BALANCE SHEET OF THE SBI BANK
In crores
Particular 2008 2009 2010 2011 2012Assets1. Cash and balance with RBI.
51534.62 55546.17 61290.87 94395.5 54075.94
2. Balance with banks, money at call.
15931.72 48857.63 34892.98 28478.65 43087.23
3.Advances 416768.20 542503.20 631914.15 756719.45 867578.894.Investment 189501.27 275953.96 285790.07 295600.57 312197.615.Net block 3139.22 3574.41 4117.73 4413.95 5133.876.Capital working progress
234.26 263.44 295.18 332.23 332.68
7.Other assets
44417.03 37733.27 35112.76 43777.85 53113.02
8. Total assets
721526.32 964432.08 1053413.74 1223736.20 1335519.24
Capital and Liabilities1.Equity share capital
631.47 634.88 634.88 635 671.04
2.Reserves 48401.19 57312.82 65314.32 64351.04 83280.163.Net worth 49032.66 57947.70 65949.20 64986.04 83951.20Long term Liabilities1.Deposits 537403.94 742073.13 804116.23 933932.81 1043647.36
2.Borrowings 51727.41 53713.68 103011.60 119568.96 127005.57
3.Total debts 589131.35 795786.81 907127.83 1053501.77 1170652.93
4.Other Liabilities and provision
83362.30 110697.57 80336.70 105248.39 80915.09
5.Total liabilities
721526.31 964432.08 1053413.73 1223736.20 1335519.22
Seshadripuram academy of business studies. Page 97

A Study on Analysis of Financial Statement
Profit and loss account of state bank of India.
years 2008 2009 2010 2011 2012IncomesInterest earned 48950.31 63788.43 70993.92 81394.36 106521.45Other income 9398.43 12691.35 14968.15 14935.09 14351.45Total income 58348.74 76479.78 85962.07 96329.45 120872.90ExpenditureInterest expended 31929.08 42915.29 47322.48 48867.96 63230.37Employee cost 7785.87 9747.31 12754.65 14480.17 16974.04Selling and admin expenses
4165.94 5122.06 7898.23 12141.19 15625.18
Depreciation 679.98 763.14 932.66 990.50 1007.17Miscellaneous expenses
7058.75 8810.75 7888.00 12479.30 12350.13
Preoperative expences capitalized
0.00 0.00 0.00 0.00 0.00
Operating expenses
14609.55 18123.66 24941.01 31430.88 37563.09
Provisions & Contingencies
5080.99 6319.60 4532.53 8660.28 8393.43
Total expenses 51619.62 67358.55 76796.02 88959.12 109186.89Net profit for the year
6729.12 9121.23 9166.05 7370.35 11686.01
Extraordinary items
0.00 0.00 0.00 0.00 21.28
Profit brought forward
0.34 0.34 0.34 0.34 6.05
Total 6729.46 9121.39 9166.39 7370.69 11713.34Preference dividend
0.00 0.00 0.00 0.00 0.00
Equity dividend 1357.66 1841.15 1904.65 1905.00 2348.66Corporate dividend tax
165.87 248.03 236.76 246.52 296.49
Per share data(annualized)Earnings per share(rs)
106.56 143.67 144.37 116.07 174.15
Equity dividend(%)
215.00 290.00 300.00 300.00 350.00
Book value(rs) 776.48 912.73 1038.76 1023.40 1251.05
Seshadripuram academy of business studies. Page 98
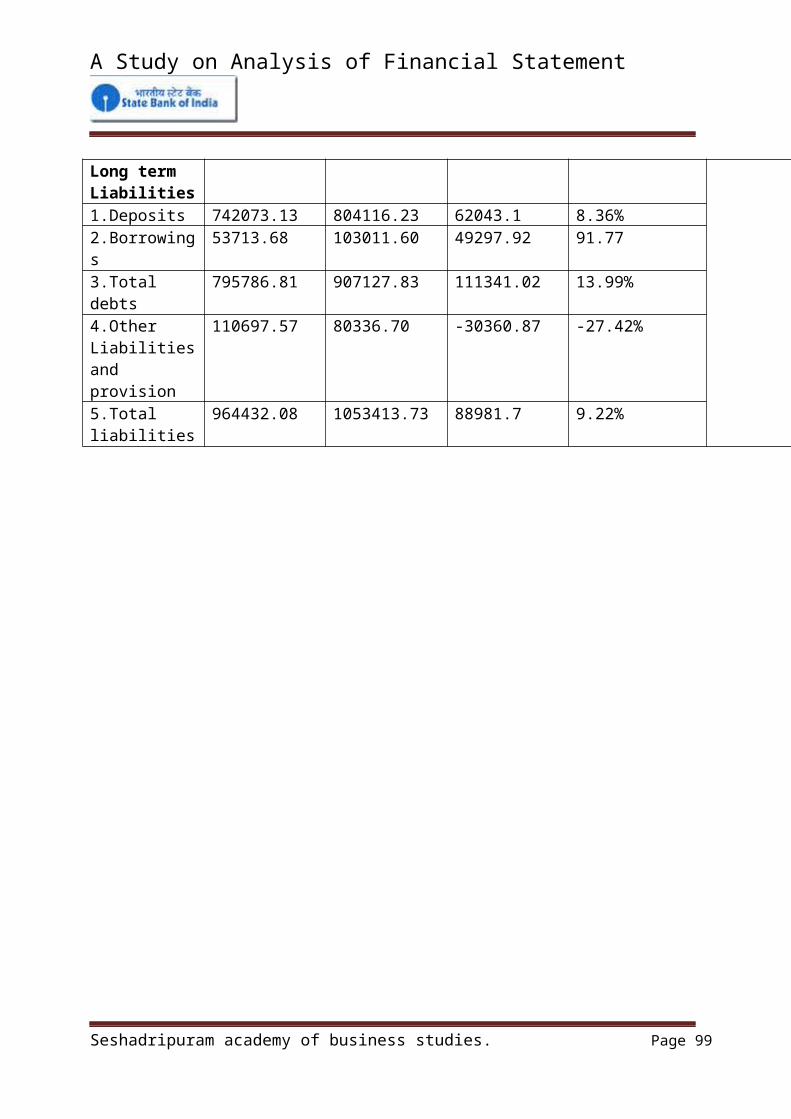
A Study on Analysis of Financial Statement
appropriations
Transfers to statutory reserves
5205.69 6725.14 6495.14 2488.96 3531.35
Transfers to other reserves
-0.10 306.90 529.50 2729.87 5536.50
Proposed dividend
1523.53 2089.18 2141.41 2151.52 2645.15
Balance c/f to balance sheet
0.34 0.34 0.34 0.34 0.34
Total 6729.46 9121.57 9166.39 7370.69 11713.34
Seshadripuram academy of business studies. Page 99