Embed Size (px)
Citation preview
SR[670] 1 © Seafish
SR670; Ecological Risk Assessment of the effects of fishing for South West fisheries; ICES Divisions VII e,f,g & h
Author; Seafish
May 2014; Revised October 2014
ISBN No: 978-1-906634-76-6
SR[670] i © Seafish
This report should be referred to as; Seafish (2014) Ecological Risk Assessment of the effects of fishing for South West fisheries; ICES Divisions VII e,f,g & h Seafish Report SR 670 There are two other linked documents; Seafish (2014) SR671 Ecological Risk Assessment of the effects of fishing for South West fisheries; ICES Divisions VII e,f,g & h ; Assessment spreadsheet Seafish Report SR 671 www.seafish.org/media/publications/SR671ERAEF_Assessment_spreadsheet.xlsx Seafish (2014) SR672 Ecological Risk Assessment of the effects of fishing for South West fisheries; ICES Divisions VII e,f,g & h ;Supporting information Seafish Report SR 672 www.seafish.org/media/publications/SR672ERAEFSupporting_information.pdf Principle contact William Lart; [email protected] + 44 1472 252323 see page iii The method used has been published in the ICES Journal of Marine Science; Cotter, J., Lart, W., de Rozarieux, N., Kingston, A., Caslake, R., Le Quesne, W., Jennings, S., Caveen, A., and Brown, M. A development of ecological risk screening with an application to fisheries off SW England. – ICES Journal of Marine Science, doi: 10.1093/icesjms/fsu167
http://icesjms.oxfordjournals.org/cgi/content/full/fsu167? ijkey=kcWA59J92D7XGtB&keytype=ref
SR[670] i © Seafish
Seafish: Responsible Sourcing Date: 21/10/2014 Ecological Risk Assessment of the effects of fishing for South West fisheries; ICES Divisions VII e,f,g & h Author: Seafish
Executive summary
This report describes an exercise to assess the ecological effects of commercial fish-ing in waters off Southwest England (ICES Divisions VII e,f,g & h). We used the an Ecological Risk Screening (ERS) technique, which uses the available information about the effects of fishing on different ecological components; species or groups of species, habitats and ecological communities, to make an assessment of and pro-vide advice on the relative risks to each component in relation to a pre-agreed set of principles and goals.
The ERS technique allows an informed judgement to be made about the potential risks from fishing to a wide range of ecosystem components and clearly, therefore, has some potential to help industry (and by association, society) move towards achieving the general goals of the ecosystem approach.
This analysis is intended to highlight the components most likely to have a higher risk from fisheries in the SW region. In this context, there is potential for ERS to be of value for regional fisheries management (i.e. at the Regional Advisory Council (RACs) or Inshore Fishery and Conservation Authority (IFCA) level), either to help the fishing industry reduce the ecological risks of fishing by identifying new and/or improving existing voluntary measures, or through more formal management chan-nels by the development of appropriate regulations (i.e. by the IFCAs/ Marine Man-agement Organisation (MMO)/European Union (EU)). Currently, fisheries management is largely reactive to top-down implemented legisla-tion (e.g. the management of European Marine Sites, Marine Conservation Zones etc), and the use of evidence to support decision-making in management is often patchy, can lack transparency, is of varying degrees of quality, and can be costly to generate. Conversely, ERS provides a systematic process which allows for the pri-oritization of risks for management (i.e. it is strategic), it is transparent in that the ra-tionale for scoring is accounted for, and it can be used by managers to justify why they are taking certain actions over others. It is also a relatively cost-effective way of bringing experts, managers and other stakeholders together to actively discuss the ecosystem effects of fishing.
We envisage the ERS method being employed for focused risk assessments as re-quired, and it could be repeated periodically (maybe every 5 years) as a process to facilitate adaptive management. For example, if the same risks are flagged up at the end of a 5-year period, management may be failing in some aspect. So, as well as
.
. Ecological Risk Assessment of the effects of fishing for South West fisheries
SR[670] ii © Seafish
making the decision-making process transparent, the ERS approach could also be used to make management accountable.
Method
The method adopted for this risk assessment was Ecological Risk Screening: de-scribed in Cotter et al (2014). The method assesses ecological risks in relation to a set of pre agreed principles and goals; in this case as agreed with the industry de-velopment and training organisation Seafood Cornwall. This method enables expert knowledge to be translated into scores describing the relative impact of fishing activi-ty. The resulting scores can then be used to rank the importance of further investiga-tions, and hence further work as described below.
The essence of this approach is that it identifies the most sensitive attribute of an
ecological sub-component, that is a habitat type, ecological community, fish or bird population, with which to estimate the risk from fishing or other activities in relation to that sub-component’s survival, for example impacts on its abundance or food supply.
The resulting Relative Impact Score (RIS) provide an assessment of the effects
of the fishing activity in the SW area judged to be most harmful to each ecological sub-component (where feasible) in relation to the operational objectives (where available) drawn from the principles and goals described in Section 3. The scoring of the activities’ effect on a unit of analysis is carried out in relation to four potential elements; the spatial and temporal overlaps and the relative intensity and duration of the interaction between units and the fishing activities in the SW ar-ea. The resulting scores are tabulated and discussed in Section 6.
Further work
During this exercise, which aimed to identify the most sensitive elements of each ecosystem sub component to fishing in the SW area, a number of actions and some further work were identified. Communities and Habitats The status of demersal fish communities is monitored data from Research Vessel Surveys using indices relating to the quantities of certain species (Large Species In-dicator; LSI) and of large fish (Large Fish Indicator; LFI) in the catches. The idea is to understand changes in the structure of the fish communities over time. These indices have been monitored in the past although there are breaks in the time series. They will be monitored in the future under the EU Data Collection Framework, so it will be possible to track changes in them over the coming years. However, we noted that there are no reference points for these indictors for the SW area and these will need to be developed if these indicators are to be useful management tools. Potentially, increases in LSI and LFI can only be achieved through reducing fishing mortality and/or by improving the selectivity of fishing gears (so more fish survive to
.
. Ecological Risk Assessment of the effects of fishing for South West fisheries
SR[670] iii © Seafish
be large). Improvements’ in the status of sole, cod, hake and plaice stocks (for ex-ample) have accompanied a reduction in fishing effort over the past decade, which suggests that the underlying fish community is sufficiently stable to respond to management efforts.
Improvements to data and assessments are a priority for a number of teleost species (monkfish, megrim, red mullet, brill, turbot, and lemon sole), so that scientific advice can be usefully applied to management aimed at MSY.
Indicators to score the effect of fishing on pelagic fish communities are lacking and it was difficult to obtain a robust basis for scoring effects on plankton communities, because they are strongly influenced by physical oceanographic effects and it may be difficult to detect the effects of fisheries even if such effects occur. Information on the distribution, sensitivity and status of benthic communities is val-uable in managing them in relation to the Marine Strategy Framework Directive and Marine Spatial Management. Whilst the location of some benthic communities is fairly well described (maerl beds, for example), improving our knowledge of the loca-tion of benthic habitats and the level of fishing intensity on them is clearly a basic re-quirement for ensuring their protection.
Fishing vessels are often equipped with advanced echo sounders and OlexTM systems, which could provide information that might improve mapping or ground- truthing of benthic communities. The Seafish guide to good practice for scallop fishing1 encourages fishermen to avoid reefs and patches of hard ground in order to conserve biodiversity, and it also encourages fishermen to make information from their echo sounder records available for scientific research. High resolution spatial information from vessels of less than 15 m would also help to improve knowledge and hence management and conservation of the inshore (inside 12 nm) environment (see Caslake 20092).
Teleost fish species The most widely studied component in the SW area is teleost fish (particularly com-mercial species), and there are already numerous management initiatives in place to improve sustainability including: TACs and quotas; effort controls; Minimum Landing Sizes (MLS), species management plans; the Trevose box to protect spawning are-as for cod; protection of nursery areas, mesh size controls and the upcoming EU landings obligation (“discard ban”). Some stocks, however, are considered to re-quire further work:
There is a need for improved assessments of the monkfish and megrim stocks, for which data have been of insufficient quality for a full assessment in recent years, due to difficulties in ageing monkfish and poor quality data for megrim.
1 www.seafish.org/media/Publications/UK_Scallop_Industry_Good_Practice_Guide_for_consult.pdf
2 www.seafish.org/media/Publications/SR617_VMSFinal.pdf
.
. Ecological Risk Assessment of the effects of fishing for South West fisheries
SR[670] iv © Seafish
Data-limited, or higher level, assessments should be considered for stocks of brill, turbot, red mullet and lemon sole.
Pilchard (sardine) and sea bass stocks would benefit from management measures that enabled them to be exploited a rate corresponding to MSY.
Efforts should continue to reduce discards and improve selectivity, particularly for cod, haddock and plaice. One approach is to use 120 mm cod end mesh, rather than the 100 mm allowed under EU rules when targeting gadoids, which would help select against juvenile cod, haddock and plaice and would presumably also reduce mortali-ty on other commercial and non-commercial species.
Elasmobranch species Many elasmobranch species are well known to be at high risk from fishing because of their vulnerability to several gears and they mature at a relatively late age and have low fecundity (few young). Our risk screening method highlighted many species of this group as requiring further investigation and developments in management.
ICES has advised on management measures for individual elasmobranch species, other than TACs, which include: spatial management (taking advantage of the patchy distribution of these species); minimum and maximum landing sizes to conserve juvenile and/or breeding stock and gear modifications either to reduce abrasion (which can lead to post-release mortality) and/or excluded certain size groups from the catches.
ICES also noted that there is a need to use local knowledge to develop and imple-ment viable measures in the context of the overall management of skate and ray stocks in the region. Shephard et al., (2012)3 provide an example of how scientific and fishermen’s data can be brought together to improve knowledge on the spatial distribution of these stocks.
Defra is currently progressing the shark, skate and ray plan, which includes a number of collaborative initiatives between fishers and scientists designed to improve knowledge of skate and ray stocks. Further information can be found at; https://www.gov.uk/government/uploads/system/uploads/attachment_data/file/224294/pb14006-shark-plan-review-20130719.pdf
http://webarchive.nationalarchives.gov.uk/20130505040140/http://archive.defra.gov.uk/environment/marine/documents/interim2/shark-conservation-plan.pdf Shellfish A number of requirements relevant to shellfish management were noted. A research project (CRESH4), carried out by the Marine Biological Association of the UK and the University of Caen in France, has investigated aspects of cuttlefish spawning, the effects of environmental conditions on recruitment, and provides an
3 http://www.plosone.org/article/info%3Adoi%2F10.1371%2Fjournal.pone.0049307
4 www.unicaen.fr/ufr/ibfa/cresh/?lang=en
.
. Ecological Risk Assessment of the effects of fishing for South West fisheries
SR[670] v © Seafish
opportunity to develop assessment and management methods. Because cuttlefish and squid grow rapidly and die after spawning (at age 2 and 1 respectively), it is im-portant to ensure that sufficient adults survive to produce enough eggs for the next generation to develop properly. Consequently, setting appropriate TACs would need a shorter timescale than for teleosts. Improving the assessment of scallop stocks is an important challenge, and a study5 by the University of Bangor in collaboration with CEFAS and the industry seeks to develop an assessment methodology, together with an investigation of the environmental effects of scallop dredging in the English Channel.
Consideration should be given to a whelk MLS which is related to length at maturity. Most of the current management of edible crab and lobster stocks is designed to conserve spawning stock through technical measures, but modelling studies suggest that small changes in effort levels can be as important with respect to stock sustain-ability. The ACRUNET6 project is investigating possible international management strategies for edible crab fisheries.
International and local measures are required to improve management of crawfish stocks.
Seabirds Further work would be to examine the possible effects of fisheries on food availability for foraging terns.
Sea turtles Following the turtle code7 and avoiding littering should be adequate mitigation measures for the very small number of turtles encountered.
Marine mammals Although bycatch of Bottlenose dolphins is known to occur in the SW, there is not currently enough data to produce robust mortality estimates. Furthermore it is not known whether bycaught animals originate from the larger offshore population or from the smaller inshore group (or both) and ideally this should be determined so that observed bycatch rates can be placed in the correct context. The behaviour of bottlenose dolphins in relation to the presence of pingers is inconclusive, so it is questionable at this time if the use of pingers is a suitable approach for mitigating bycatch of this species.
The routine use of pingers by the offshore (>12m) fleet will reduce the bycatch rates of harbour porpoises (and probably common dolphins) in these fisheries. Howev-
5 www.seafish.org/about-seafish/news-and-events/news/phd-student-tackles-scallop-habitat-survey-
in-english-channel
6 http://www.acrunet.eu/
7 www.mcsuk.org/sightings/turtles.php
.
. Ecological Risk Assessment of the effects of fishing for South West fisheries
SR[670] vi © Seafish
er, bycatch of both these species is known to occur in some inshore static net fisher-ies as well and efforts could be made in collaboration with industry to devise suitable targeted mitigation approaches for those particular fisheries. For grey and common seals monitoring of fisheries’ interactions with this species should be continued.
Collaboration One other important outcome from this exercise is that an improvement in communi-cation of scientific and technical knowledge obtained by CEFAS and others in rela-tion to the ecological effects of SW fisheries should be encouraged. Such an out-come would enable:
A better understanding of the mitigation measures that are already imple-mented in SW fisheries and their efficacy.
Priorities to be set for further investigations and actions concerning identified ecological risks. Such actions could include setting up task groups to tackle specific risks.
With this information, buyers will have greater knowledge of the ecological risks as-sociated with the fisheries in the SW region from which they source fish, and could potentially participate in further investigations and initiatives to mitigate such risks.
.
. Ecological Risk Assessment of the effects of fishing for South West fisheries
SR[670] vii © Seafish
Acknowledgments This work was carried out as collaboration between a number of personnel at
Seafish, Cefas and independent consultants. Several other individuals and organisa-tions provided information and input. Name Organisation Role William (Bill) Lart Seafish Project Coordinator John Cotter FishWorld Science Derived Ecological Risk Screen-
ing assessment method Sam Lambourn Seafood Cornwall Provided Principles and goals Andy Matchett
The assessment working group was convened at Cefas, Lowestoft in October 2013
Name Organisation Role Dr Mike Pawson Independent Fisher-
ies Consultant Chair of Assessment Working Group
Dr John Cotter FishWorld Science Drafted the Assessment spread-sheet
William (Bill) Lart Seafish Project Co-ordinator Nathan de Rozarieux Tegen Mor Fisheries
Consultants Fisheries Expertise
Prof Simon Jennings Cefas Biodiversity, fisheries and envi-ronmental management
Dr Will Le Quesne Cefas Fisheries and environmental management
Dr Alex Caveen Seafish Fisheries and Marine Protected Areas
Richard Caslake Seafish Fisheries Expertise Al Kingston Sea Mammal Re-
search Unit Sea Mammal and Fisheries Ex-pertise
The results of this working group are presented here as the collective view of the group, and are not necessarily the view of the organisations to which the individuals belonged. Correspondence should be addressed to the Project Co-ordinator; William (Bill) Lart Sustainability and Data Advisor Seafish | Origin Way, Europarc, Grimsby DN37 9TZ T: +44 (0) 1472 252 323 [email protected]
.
. Ecological Risk Assessment of the effects of fishing for South West fisheries
SR[670] viii © Seafish
Advice on ecological components (see Table 1) was obtained from the following ex-perts Name Organisation Mary Brown managed the advice from Cefas. Cefas Ewen Bell, David Palmer, Beatriz Roel, Alan Walker, Jim Ellis, Steve Milligan, Alexander Koch, John Pinnegar, Robert Thorpe, Sara Pacitto, Tom Catchpole, Stefan Bolam, Will Le Quense
Cefas
Mike Pawson Independent Fisheries Con-sultant
Lucas Mander Institute of Coastal and Estua-rine Studies, University of Hull
Isobel Bloor and Emma Jackson Marine Biological Association, Plymouth
Al Kingston, Sophie Smout & Simon Northridge Sea Mammal Research Unit Rod Penrose UK Cetaceans strandings In-
vestigation Programme Nick Tregenza Chelonia Ltd
.
. Ecological Risk Assessment of the effects of fishing for South West fisheries
SR[670] ix © Seafish
Table of Contents 1. Introduction ......................................................................................................... 1
2. Project background ............................................................................................. 2
3. Principles and goals ............................................................................................ 3
4. Ecosystem and fisheries ..................................................................................... 4
Geographic region covered by the risk assessment ...................................... 4 4.1. Ecosystem components ................................................................................ 5 4.2. Conservation areas ....................................................................................... 6 4.3. Fisheries’ activities assessed ........................................................................ 8 4.4. Distribution of fishing effort in the SW area ................................................... 8 4.5. Fishing effort over time .................................................................................. 9 4.6. Catch information ........................................................................................ 12 4.7. Review of the effects of gear on benthic habitats and communities ............ 15 4.8.
5. Risk assessment : Ecological Risk Screening ................................................... 17
6. Results and discussion of the ecological risk screening (ERS) outcome .......... 21
Communities and habitats (Table 5) ........................................................... 21 6.1. Fish stocks .................................................................................................. 24 6.2.
6.2.1 Teleosts (Table 6) ........................................................................................ 24
6.2.2 Elasmobranchs (Table 7) ............................................................................ 26 Shellfish ...................................................................................................... 26 6.3.
6.3.1.Molluscs (Table 8) ....................................................................................... 26
6.3.2 Crustaceans (Table 9) ............................................................................... 28 Seabirds (Table 10) .................................................................................... 28 6.4. Sea Turtles (Table 11) ............................................................................... 29 6.5. Marine Mammals (Table 13) ....................................................................... 29 6.6.
7. The ERS approach and the Marine Strategy Framework Directive (MSFD; EU 56/2008) ................................................................................................................... 31
8. Further action and work .................................................................................... 33
9. References ........................................................................................................ 55
Appendix 1. Detailed descriptions of the main gear types used in the SW fisheries 59
Otter trawl ............................................................................................................. 59
Operations and gear ............................................................................................. 59
Scallop Dredge ..................................................................................................... 60
Fixed nets ............................................................................................................. 61
Pots ...................................................................................................................... 63
Appendix 2 Ecological risk screening jargon ............................................................ 67
SR[670] 1 © Seafish
1. Introduction The main source of information on responsible sourcing of fish products is
currently based on scientific advice on the stock status of the more important com-mercial species, chiefly derived from ICES stock assessments. However, not all spe-cies that are exploited by fisheries in the South West region are subject to regular assessments, and an approach that focuses purely on the most important commer-cial species does not provide a full picture of the total effects of fishing in this area.
There are strong pressures from the supply chain for information that would
enable buyers to identify fish from ‘sustainable’ sources, or at least be able to evalu-ate the “risks” involved with particular fishery operations. The options currently available range from information obtained from ICES stock advice and derivatives such as the Seafish Responsible Sourcing Guides, the Sustainable Fisheries Part-nership8, the Marine Conservation Society9 and others, through to full assessments against the Marine Stewardship Council10 (MSC) standard and consequent certifica-tion (which covers commercial stock status, wider impacts on the environment and the efficacy of existing management measures).
However, some fisheries may not perform well in these schemes because rel-
evant information may be lacking or associated management does not fall within a particular scheme’s criteria. A “failure” or withdrawal of an assessment means that there is no publicly available risk assessment. For responsible sourcing, where knowledge of the risks within a pre-agreed framework is required, the imperative is to try to find information that will fill these gaps.
Where information is lacking, or a fishery does not satisfy MSC assessment
criteria (for example), an Ecological Risk Assessment (ERA) framework can be used to assess the risks that a fishery poses to the ecosystem, including both exploited (i.e. commercially important) and non-exploited components. These frameworks are discussed at length in Cotter and Lart (2011). The ERA framework used for this analysis was developed by the CSIRO11 (Hobday et al., 2011).
The ERA methodology includes an initial risk screening analysis termed Eco-
logical Risk Screening (ERS). This semi-quantitative approach considers the ef-fects of fishing on all ecological components of a system and helps to prioritise is-sues worthy of more detailed analysis and/or possible management action.
The ERA process is designed to reveal which ecological components are
most at risk from a fishery’s activities in relation to a pre-agreed set of principles and goals relating to fisheries management, ecosystem structure and biodiversity.
8 www.sustainablefish.org
9 www.fishonline.org/
10 www.msc.org/
11 Commonwealth Scientific and Industrial Research Organisation; Australian Government body
charged with carrying out scientific research and development
.
. Ecological Risk Assessment of the effects of fishing for South West fisheries
SR[670] 2 © Seafish
This report describes the implementation and outcome of the use of the ERS
methodology to risk–assess the ecosystem effects of fisheries’ activities in the South West of England. It provides a description of the results of the assessment, with suitable caveats where knowledge is lacking, and descriptions of individual fisheries and mitigating factors that can be used for responsible sourcing.
It also discusses the results of the ERS in relation to the European Union’s
Marine Strategy Framework Directive, which aims to bring Europe’s entire marine environment within ‘good environmental status’ by the year 2020.
This information can be used by fishers, buyers, suppliers and customers in
communications concerning responsible sourcing, and/or to help make improve-ments in their operating practices.
2. Project background This project was initiated by Seafish in response to requests by major proces-
sors in the South West (SW) region for a more comprehensive assessment of the sustainability (in both commercial stock and wider ecosystem terms) of SW fisheries. Seafood Cornwall12 (an industry training and development body) was initially con-sulted to steer the project and provide the principles and goals against which to as-sess the risks to various ecological components from fisheries’ activities (see below), although it became clear from discussions at the Seafish South West conference held in Brixham in November 2012 that a broader representation should be sought.
A number of retailers had expressed an interest, and this project was dis-
cussed during a meeting held in March 2013 at the initiative of the Sustainable Fish-eries Partnership Organisation, following which the information required to conduct an ERS for SW fisheries was compiled. The risk screening was carried out by tech-nical experts on fisheries and fisheries science (see Acknowledgments) at a meeting in CEFAS Lowestoft during October 2013.
12
http://www.seafoodcornwall.org.uk/
.
. Ecological Risk Assessment of the effects of fishing for South West fisheries
SR[670] 3 © Seafish
3. Principles and goals In order to carry out a successful Ecological Risk Assessment, it is necessary
to define the fisheries and ecosystem which are being assessed, and also to de-scribe the overarching principles and goals against which the ERA is being made. After discussion with personnel from Seafood Cornwall, the following were agreed.
Principle: To leave for future generations the same or better opportunities to
benefit from the marine environment around the South West peninsula as the pre-sent generation has enjoyed.
Goals:
1. To maintain an economically viable and regionally diverse fishing industry in South West England. 2. To maintain and protect essential ecological processes and food webs. 3. To avoid taking more fish from a stock than can naturally be replenished. 4. To protect biodiversity including vulnerable marine species and special types of habitat not specifically covered by legislation. 5. To minimise pollution as a consequence of fishing so far as practical and economical. 6. To comply with all legislation applicable to SW fisheries and fish products. Operational Objectives The principle and goals were used as guidance to derive operational objectives for the various components assessed (see Table 5 to Table 13). Some were based on external reference points. For example, operational objectives for commercial re-source stocks were related to their status in relation to Maximum Sustainable Yield (MSY). Operational objectives for certain components, such as cetaceans, are sub-ject to international agreement ASCOBANS13 and these were used where available. For other components, the technical group agreed objectives consistent with the above. However, for many components the absence of agreed reference points means that these remain provisional, as discussed in the text. It was possible to score components (Section 5, page 17) where operational objectives were not de-fined, but the presence of operational objectives helped to define further work where appropriate.
13
Agreement on the Conservation of small cetaceans of the Baltic, North East Atlantic, Irish and North Seas www.ascobans.org/
.
. Ecological Risk Assessment of the effects of fishing for South West fisheries
SR[670] 4 © Seafish
4. Ecosystem and fisheries
Geographic region covered by the risk assessment 4.1.
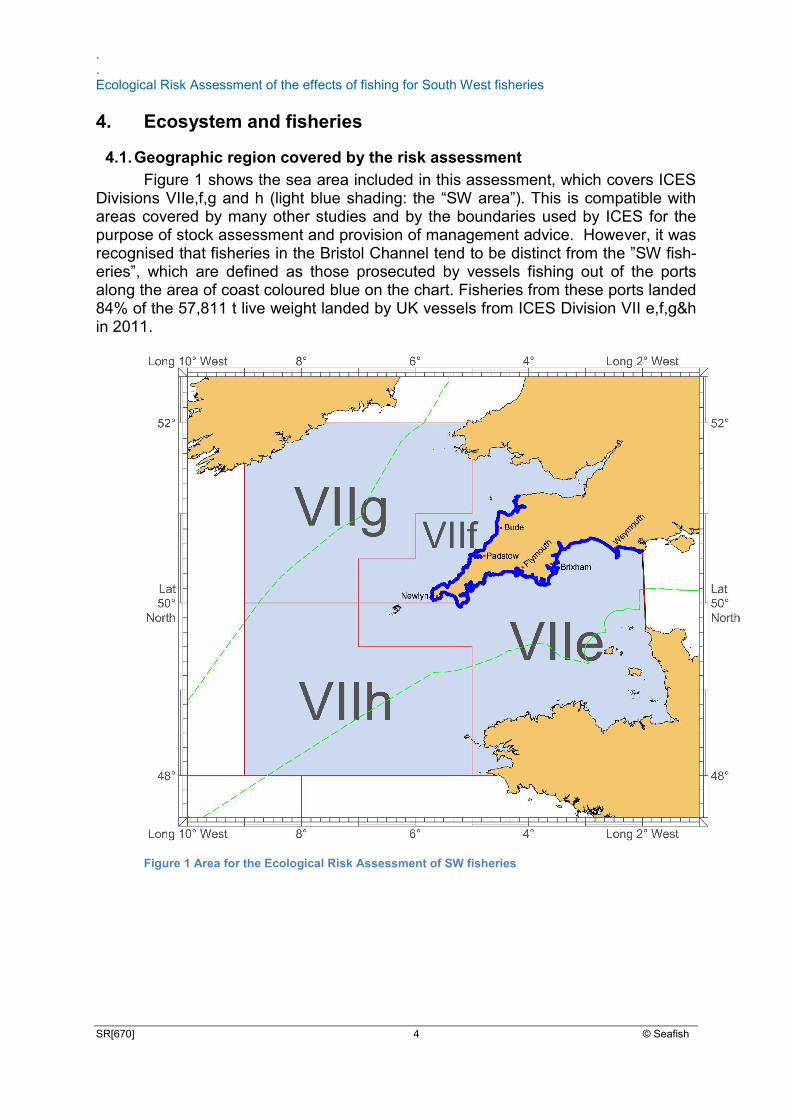
Figure 1 shows the sea area included in this assessment, which covers ICES Divisions VIIe,f,g and h (light blue shading: the “SW area”). This is compatible with areas covered by many other studies and by the boundaries used by ICES for the purpose of stock assessment and provision of management advice. However, it was recognised that fisheries in the Bristol Channel tend to be distinct from the ”SW fish-eries”, which are defined as those prosecuted by vessels fishing out of the ports along the area of coast coloured blue on the chart. Fisheries from these ports landed 84% of the 57,811 t live weight landed by UK vessels from ICES Division VII e,f,g&h in 2011.
Figure 1 Area for the Ecological Risk Assessment of SW fisheries
.
. Ecological Risk Assessment of the effects of fishing for South West fisheries
SR[670] 5 © Seafish
Ecosystem components 4.2.
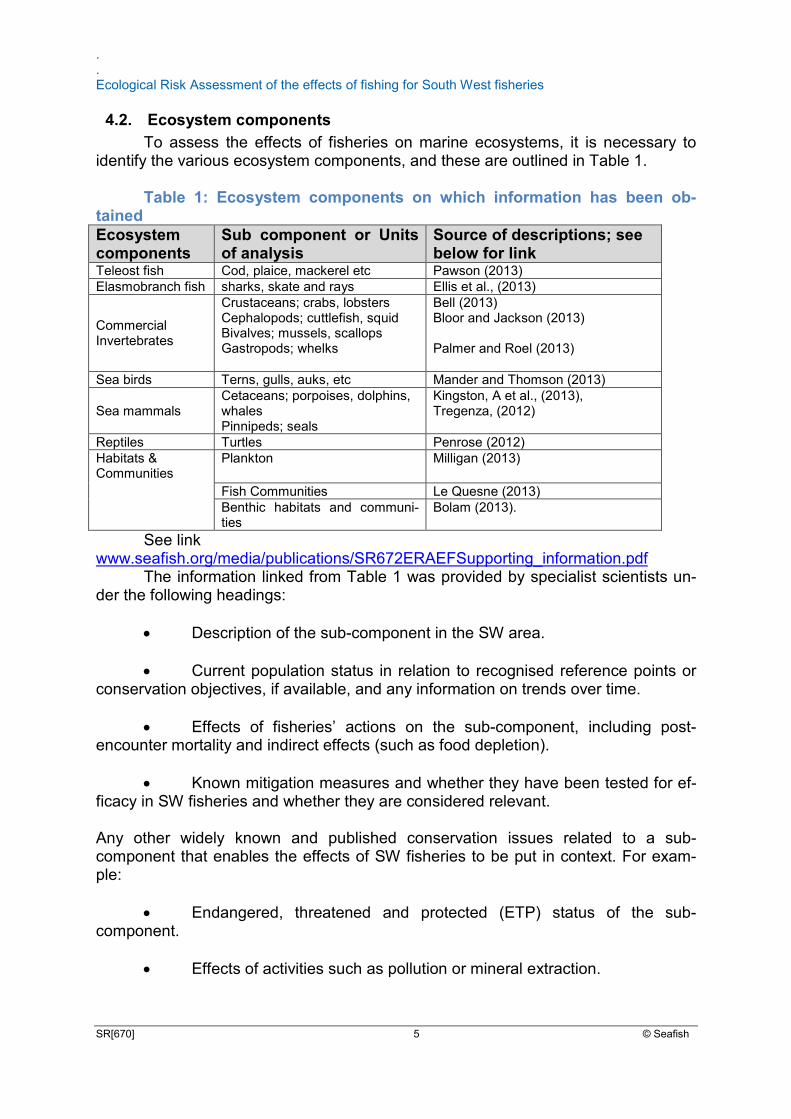
To assess the effects of fisheries on marine ecosystems, it is necessary to identify the various ecosystem components, and these are outlined in Table 1.
Table 1: Ecosystem components on which information has been ob-
tained Ecosystem components
Sub component or Units of analysis
Source of descriptions; see below for link
Teleost fish Cod, plaice, mackerel etc Pawson (2013) Elasmobranch fish sharks, skate and rays Ellis et al., (2013)
Commercial Invertebrates
Crustaceans; crabs, lobsters Cephalopods; cuttlefish, squid Bivalves; mussels, scallops Gastropods; whelks
Bell (2013) Bloor and Jackson (2013) Palmer and Roel (2013)
Sea birds Terns, gulls, auks, etc Mander and Thomson (2013)
Sea mammals Cetaceans; porpoises, dolphins, whales Pinnipeds; seals
Kingston, A et al., (2013), Tregenza, (2012)
Reptiles Turtles Penrose (2012) Habitats & Communities
Plankton Milligan (2013)
Fish Communities Le Quesne (2013) Benthic habitats and communi-ties
Bolam (2013).
See link www.seafish.org/media/publications/SR672ERAEFSupporting_information.pdf
The information linked from Table 1 was provided by specialist scientists un-der the following headings:
Description of the sub-component in the SW area. Current population status in relation to recognised reference points or
conservation objectives, if available, and any information on trends over time. Effects of fisheries’ actions on the sub-component, including post-
encounter mortality and indirect effects (such as food depletion). Known mitigation measures and whether they have been tested for ef-
ficacy in SW fisheries and whether they are considered relevant.
Any other widely known and published conservation issues related to a sub-component that enables the effects of SW fisheries to be put in context. For exam-ple:
Endangered, threatened and protected (ETP) status of the sub-
component. Effects of activities such as pollution or mineral extraction.
.
. Ecological Risk Assessment of the effects of fishing for South West fisheries
SR[670] 6 © Seafish
Ocean warming and cyclical climate phenomena such as the North At-lantic Oscillation, Russell Cycle.
Conservation areas 4.3.
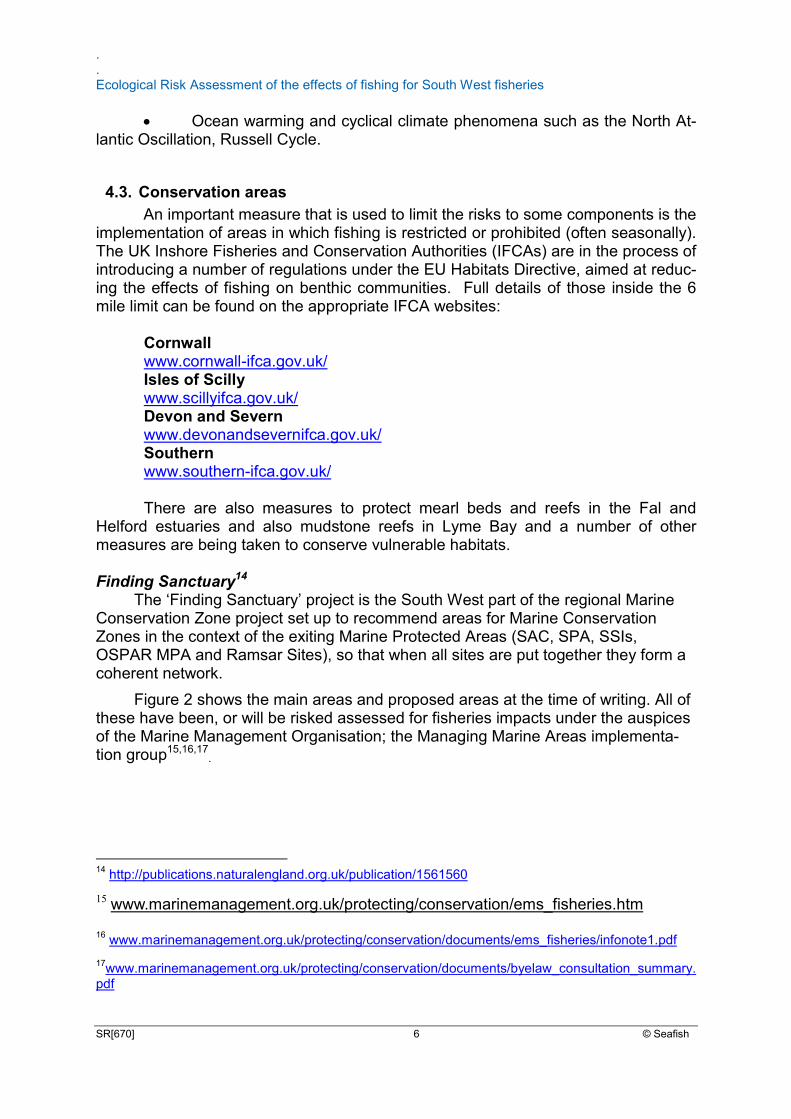
An important measure that is used to limit the risks to some components is the implementation of areas in which fishing is restricted or prohibited (often seasonally). The UK Inshore Fisheries and Conservation Authorities (IFCAs) are in the process of introducing a number of regulations under the EU Habitats Directive, aimed at reduc-ing the effects of fishing on benthic communities. Full details of those inside the 6 mile limit can be found on the appropriate IFCA websites:
Cornwall www.cornwall-ifca.gov.uk/ Isles of Scilly www.scillyifca.gov.uk/ Devon and Severn www.devonandsevernifca.gov.uk/ Southern www.southern-ifca.gov.uk/ There are also measures to protect mearl beds and reefs in the Fal and
Helford estuaries and also mudstone reefs in Lyme Bay and a number of other measures are being taken to conserve vulnerable habitats. Finding Sanctuary14
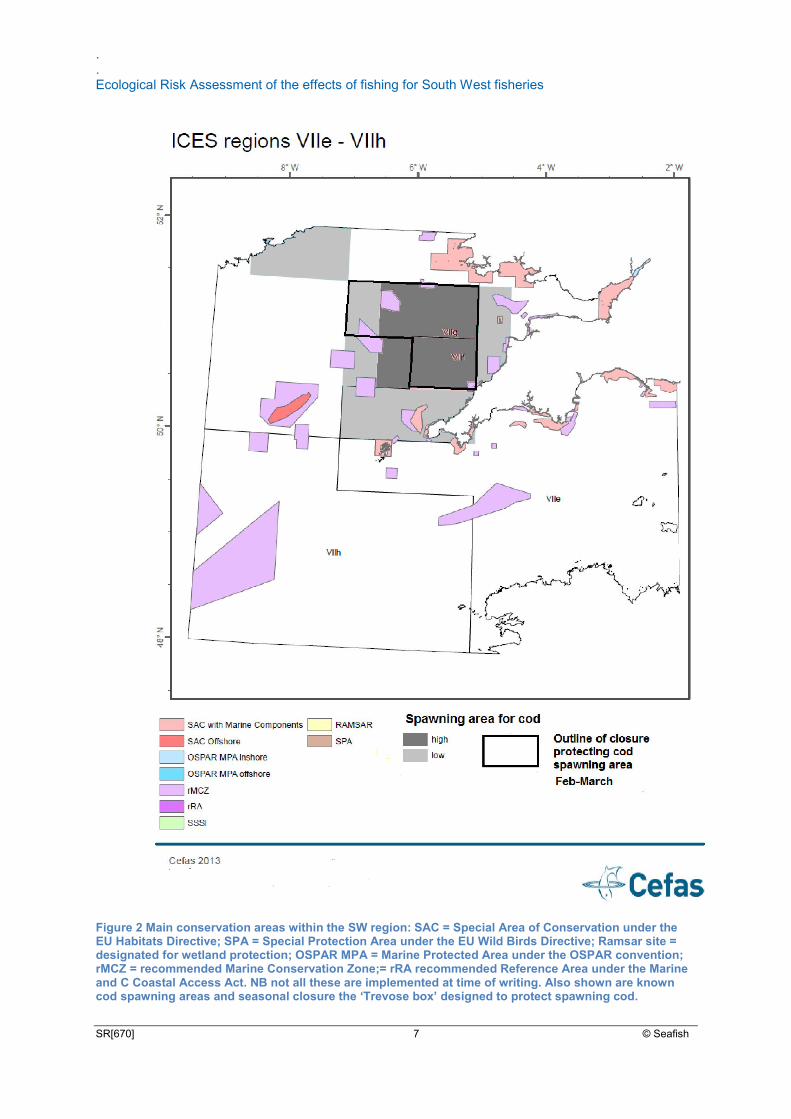
The ‘Finding Sanctuary’ project is the South West part of the regional Marine Conservation Zone project set up to recommend areas for Marine Conservation Zones in the context of the exiting Marine Protected Areas (SAC, SPA, SSIs, OSPAR MPA and Ramsar Sites), so that when all sites are put together they form a coherent network.
Figure 2 shows the main areas and proposed areas at the time of writing. All of these have been, or will be risked assessed for fisheries impacts under the auspices of the Marine Management Organisation; the Managing Marine Areas implementa-tion group15,16,17
.
14
http://publications.naturalengland.org.uk/publication/1561560
15 www.marinemanagement.org.uk/protecting/conservation/ems_fisheries.htm 16
www.marinemanagement.org.uk/protecting/conservation/documents/ems_fisheries/infonote1.pdf
17www.marinemanagement.org.uk/protecting/conservation/documents/byelaw_consultation_summary.
.
. Ecological Risk Assessment of the effects of fishing for South West fisheries
SR[670] 7 © Seafish
Figure 2 Main conservation areas within the SW region: SAC = Special Area of Conservation under the EU Habitats Directive; SPA = Special Protection Area under the EU Wild Birds Directive; Ramsar site = designated for wetland protection; OSPAR MPA = Marine Protected Area under the OSPAR convention; rMCZ = recommended Marine Conservation Zone;= rRA recommended Reference Area under the Marine and C Coastal Access Act. NB not all these are implemented at time of writing. Also shown are known cod spawning areas and seasonal closure the ‘Trevose box’ designed to protect spawning cod.
.
. Ecological Risk Assessment of the effects of fishing for South West fisheries
SR[670] 8 © Seafish
Fisheries’ activities assessed 4.4.Prior to the risk assessment, a description of each of the relevant fisheries,
the gear used and fishing activities, was obtained from NFFO’s Annual Fisheries Report and Project Inshore18, and data on effort, catches and discarding held by the Marine Management Organisation (MMO), the Centre for Environment Fisheries and Aquaculture Science (CEFAS) and the EU Scientific, Technical and Economic Committee for Fisheries (STECF).
Vessels from a number of nations operate in fisheries in the SW area and
their effects on ecosystems should ideally be taken into account in the ERA. Though this assessment mainly concerns UK fisheries (for which good information is gener-ally available), the effects of all fisheries (including those by non UK vessels) were analysed together, unless there was good reason not to do so. The following gear types were considered:
Beam trawl (for sole in the Channel, megrim in the SW approaches) Otter trawl (from many ports) Scallop dredge (mostly highly mobile) Enmeshing (mostly static) gear (inshore and offshore) Pots (mostly inshore) Hand line (including anglers) Ring nets; pelagic seines Pelagic trawls
Descriptions of the operations of the main gear types, their target and main
bycatch species, and the distribution of their fishing effort in 2007 from offshore VMS data, can be found in Appendix 1.
Distribution of fishing effort in the SW area 4.5.
Information on the distribution of fishing effort shown in Figure 3 below and maps provided in Appendix 1 is based on VMS data that cover the over 15 m fleet. This does not reveal the true extent of inshore effort, most of which is conducted by boats under 15m. Nevertheless, it is apparent that beam trawling and fishing with static nets have the widest geographical distribution in the SW area, whilst potting and dredging are more concentrated in the near-shore regions in Divisions VIIe and VIIf. Demersal seine netting only occurs in a limited area in the eastern part of the SW waters. Fishing activity within the 12-nautical mile zone is mostly described as low intensity throughout the SW area (Koch and Pacitto 2013).
18
http://www.seafish.org/industry-support/fishing/project-inshore
.
. Ecological Risk Assessment of the effects of fishing for South West fisheries
SR[670] 9 © Seafish
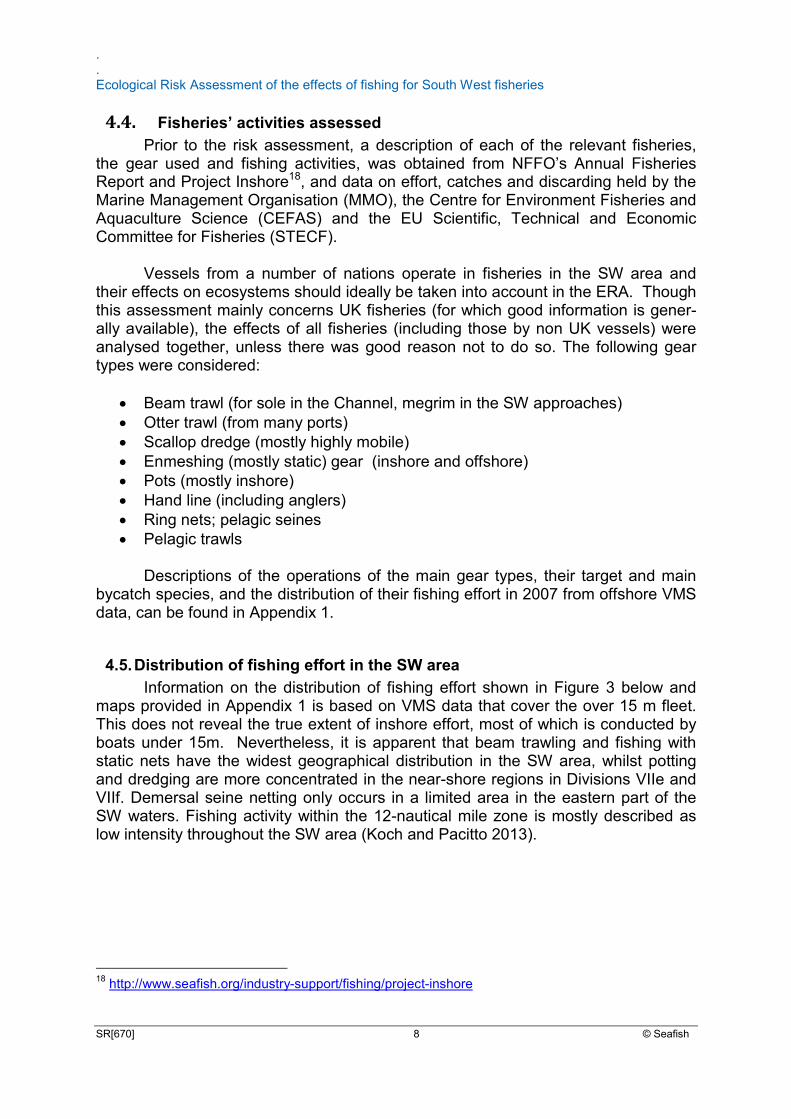
Figure 3: Spatial extent of proportions of fishing activity for vessels using the main gear types covered by VMS data (2006-2009 combined). Gear codes: B, beam trawls; D, dredges; N, nets; O, otter trawls; P, pots; All, all gears combined. From Jennings & Lee (2012).
The majority of effort by a particular fishery in the SW area is conducted within fishing grounds occupying a relatively small proportion of the total area available. This means that extensive parts of the SW area are relatively lightly fished (i.e. only 10% of the effort is spread across 50% of the total fishery area; Jennings & Lee, 2012).
Fishing effort over time 4.6.
The effort trends (annual hours fished) by vessels of all nations fishing in IC-ES Divisions VIIe,f,g&h between 2003 and 2011 are shown in the following three fig-ures (source STECF). Note that only hours fishing (i.e not fishing power) is present-ed in these graphs.
.
. Ecological Risk Assessment of the effects of fishing for South West fisheries
SR[670] 10 © Seafish
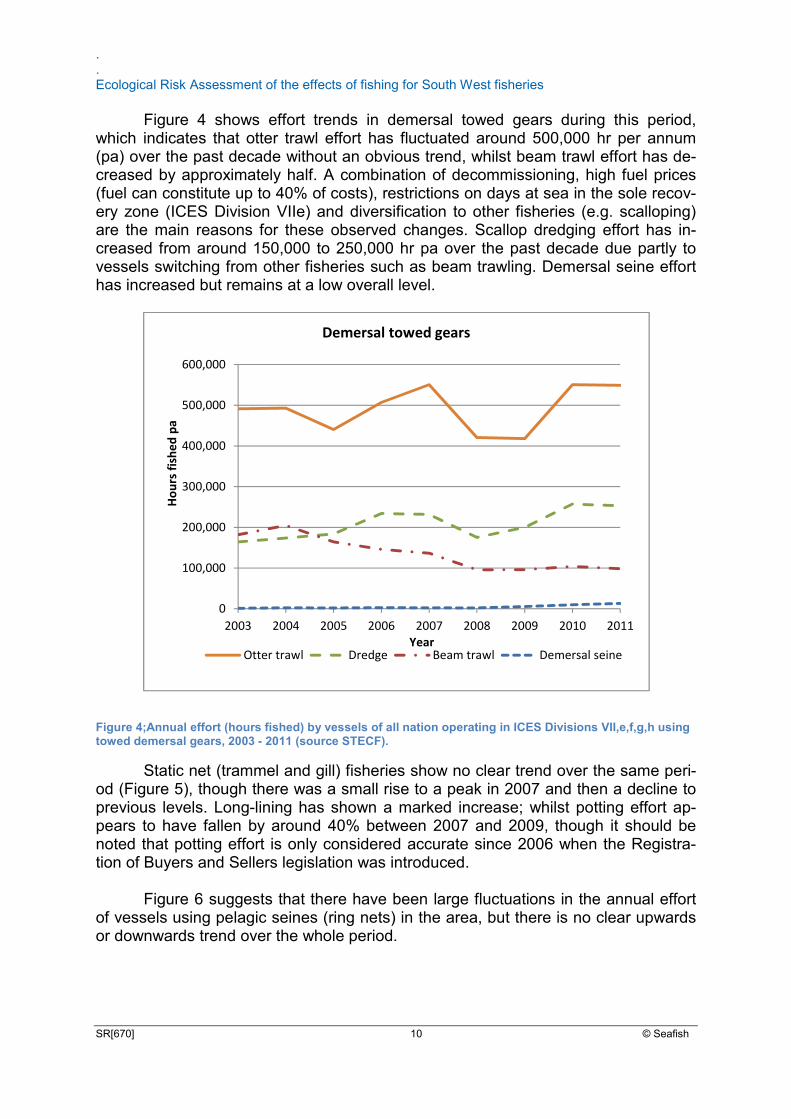
Figure 4 shows effort trends in demersal towed gears during this period, which indicates that otter trawl effort has fluctuated around 500,000 hr per annum (pa) over the past decade without an obvious trend, whilst beam trawl effort has de-creased by approximately half. A combination of decommissioning, high fuel prices (fuel can constitute up to 40% of costs), restrictions on days at sea in the sole recov-ery zone (ICES Division VIIe) and diversification to other fisheries (e.g. scalloping) are the main reasons for these observed changes. Scallop dredging effort has in-creased from around 150,000 to 250,000 hr pa over the past decade due partly to vessels switching from other fisheries such as beam trawling. Demersal seine effort has increased but remains at a low overall level.
Figure 4;Annual effort (hours fished) by vessels of all nation operating in ICES Divisions VII,e,f,g,h using towed demersal gears, 2003 - 2011 (source STECF).
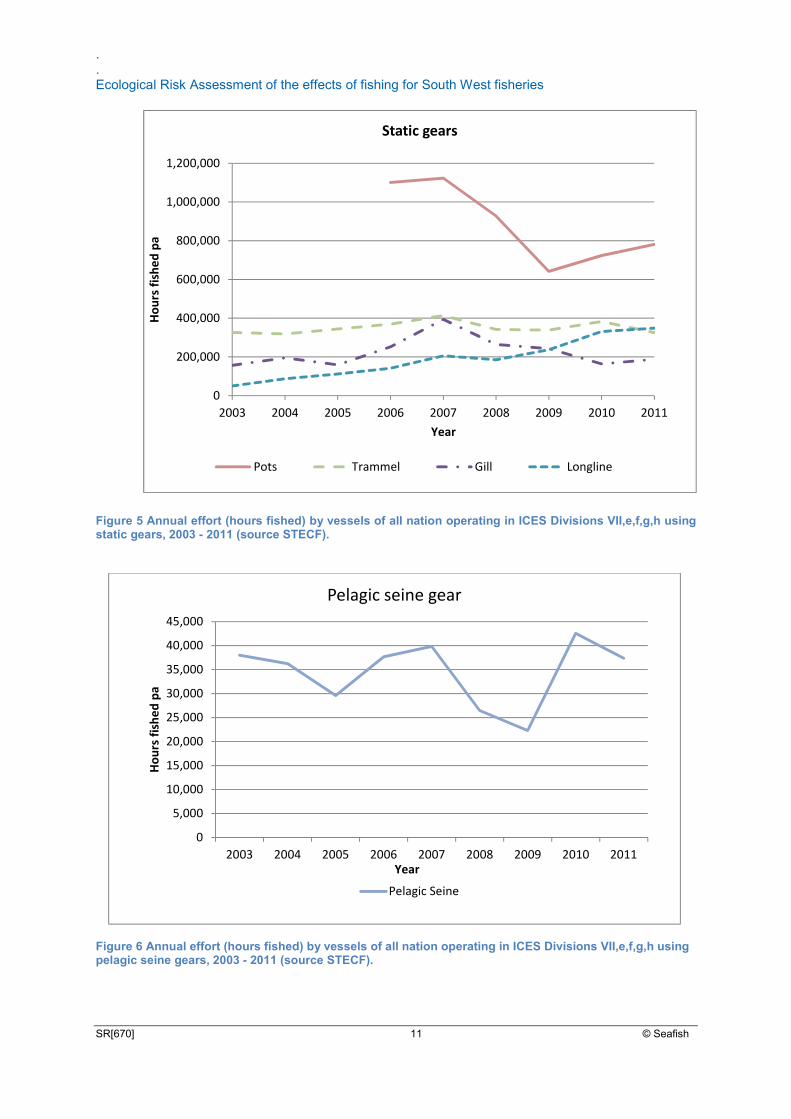
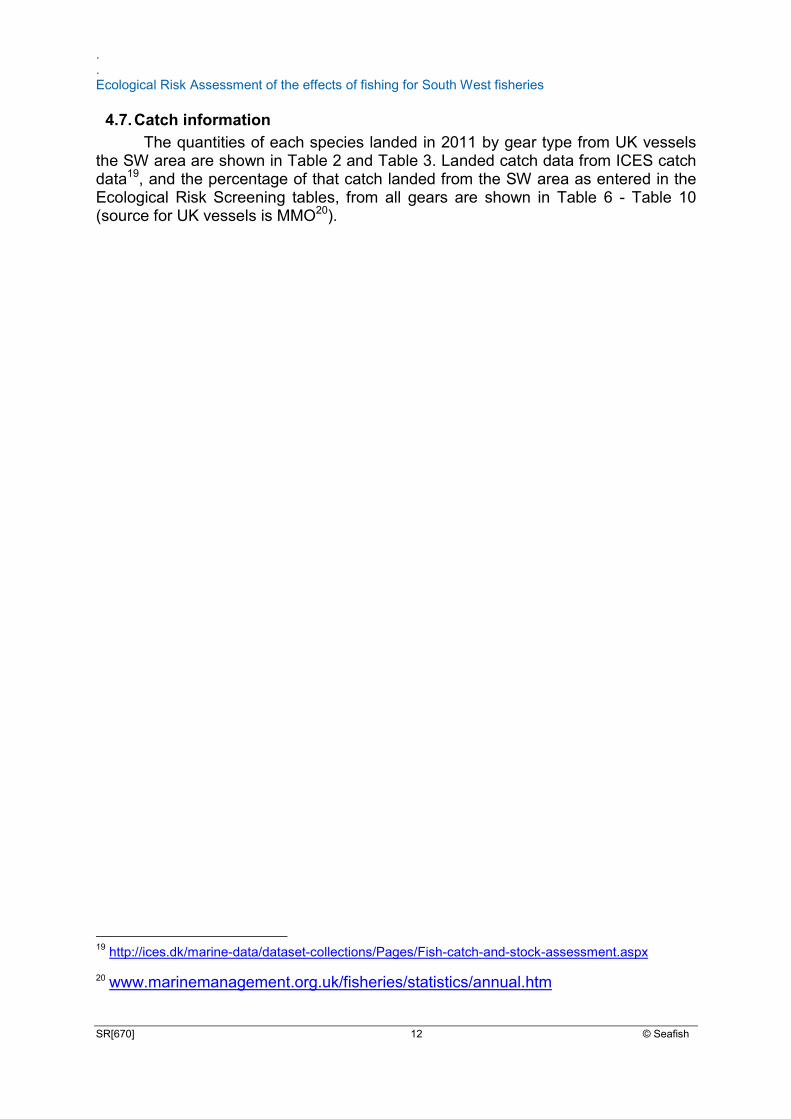
Static net (trammel and gill) fisheries show no clear trend over the same peri-od (Figure 5), though there was a small rise to a peak in 2007 and then a decline to previous levels. Long-lining has shown a marked increase; whilst potting effort ap-pears to have fallen by around 40% between 2007 and 2009, though it should be noted that potting effort is only considered accurate since 2006 when the Registra-tion of Buyers and Sellers legislation was introduced.
Figure 6 suggests that there have been large fluctuations in the annual effort
of vessels using pelagic seines (ring nets) in the area, but there is no clear upwards or downwards trend over the whole period.
0
100,000
200,000
300,000
400,000
500,000
600,000
2003 2004 2005 2006 2007 2008 2009 2010 2011
Ho
urs
fis
he
d p
a
Year
Demersal towed gears
Otter trawl Dredge Beam trawl Demersal seine
.
. Ecological Risk Assessment of the effects of fishing for South West fisheries
SR[670] 11 © Seafish
Figure 5 Annual effort (hours fished) by vessels of all nation operating in ICES Divisions VII,e,f,g,h using static gears, 2003 - 2011 (source STECF).
Figure 6 Annual effort (hours fished) by vessels of all nation operating in ICES Divisions VII,e,f,g,h using pelagic seine gears, 2003 - 2011 (source STECF).
0
200,000
400,000
600,000
800,000
1,000,000
1,200,000
2003 2004 2005 2006 2007 2008 2009 2010 2011
Ho
urs
fis
he
d p
a
Year
Static gears
Pots Trammel Gill Longline
0
5,000
10,000
15,000
20,000
25,000
30,000
35,000
40,000
45,000
2003 2004 2005 2006 2007 2008 2009 2010 2011
Ho
urs
fis
he
d p
a
Year
Pelagic seine gear
Pelagic Seine
.
. Ecological Risk Assessment of the effects of fishing for South West fisheries
SR[670] 12 © Seafish
Catch information 4.7.
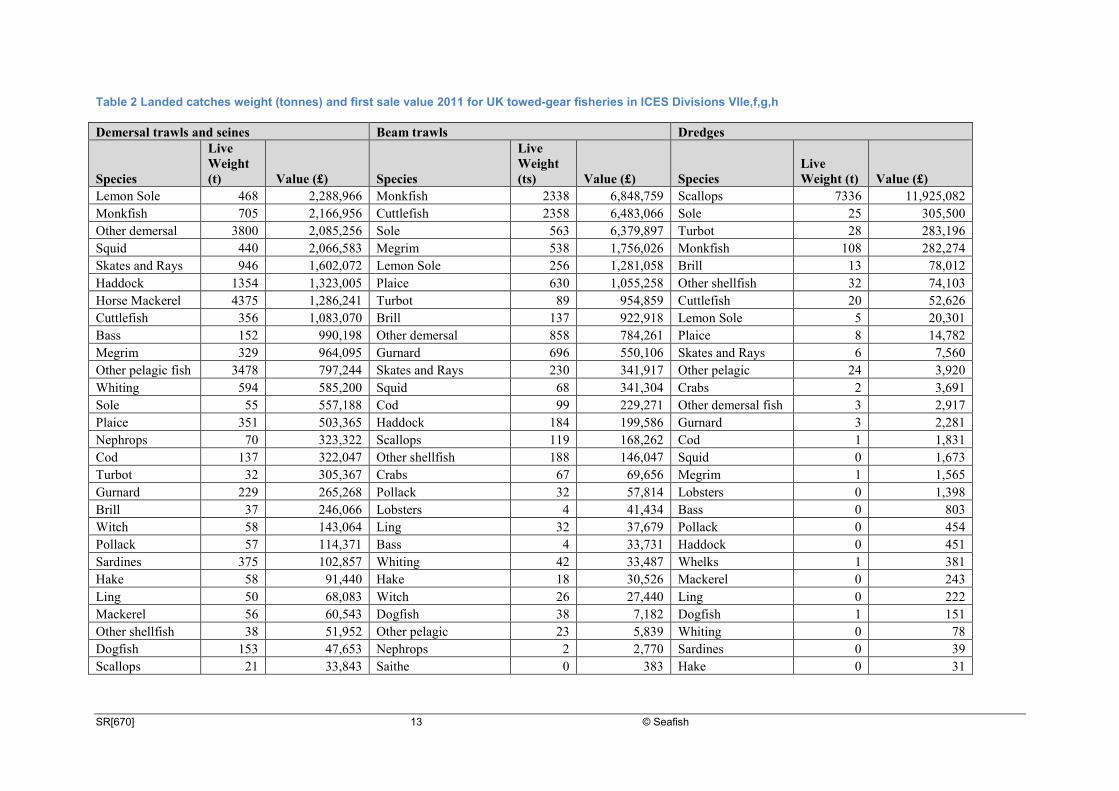
The quantities of each species landed in 2011 by gear type from UK vessels the SW area are shown in Table 2 and Table 3. Landed catch data from ICES catch data19, and the percentage of that catch landed from the SW area as entered in the Ecological Risk Screening tables, from all gears are shown in Table 6 - Table 10 (source for UK vessels is MMO20).
19
http://ices.dk/marine-data/dataset-collections/Pages/Fish-catch-and-stock-assessment.aspx
20 www.marinemanagement.org.uk/fisheries/statistics/annual.htm
SR[670] 13 © Seafish
Table 2 Landed catches weight (tonnes) and first sale value 2011 for UK towed-gear fisheries in ICES Divisions Vlle,f,g,h
Demersal trawls and seines Beam trawls Dredges
Species
Live Weight (t) Value (£) Species
Live Weight (ts) Value (£) Species
Live Weight (t) Value (£)
Lemon Sole 468 2,288,966 Monkfish 2338 6,848,759 Scallops 7336 11,925,082
Monkfish 705 2,166,956 Cuttlefish 2358 6,483,066 Sole 25 305,500
Other demersal 3800 2,085,256 Sole 563 6,379,897 Turbot 28 283,196
Squid 440 2,066,583 Megrim 538 1,756,026 Monkfish 108 282,274
Skates and Rays 946 1,602,072 Lemon Sole 256 1,281,058 Brill 13 78,012
Haddock 1354 1,323,005 Plaice 630 1,055,258 Other shellfish 32 74,103
Horse Mackerel 4375 1,286,241 Turbot 89 954,859 Cuttlefish 20 52,626
Cuttlefish 356 1,083,070 Brill 137 922,918 Lemon Sole 5 20,301
Bass 152 990,198 Other demersal 858 784,261 Plaice 8 14,782
Megrim 329 964,095 Gurnard 696 550,106 Skates and Rays 6 7,560
Other pelagic fish 3478 797,244 Skates and Rays 230 341,917 Other pelagic 24 3,920
Whiting 594 585,200 Squid 68 341,304 Crabs 2 3,691
Sole 55 557,188 Cod 99 229,271 Other demersal fish 3 2,917
Plaice 351 503,365 Haddock 184 199,586 Gurnard 3 2,281
Nephrops 70 323,322 Scallops 119 168,262 Cod 1 1,831
Cod 137 322,047 Other shellfish 188 146,047 Squid 0 1,673
Turbot 32 305,367 Crabs 67 69,656 Megrim 1 1,565
Gurnard 229 265,268 Pollack 32 57,814 Lobsters 0 1,398
Brill 37 246,066 Lobsters 4 41,434 Bass 0 803
Witch 58 143,064 Ling 32 37,679 Pollack 0 454
Pollack 57 114,371 Bass 4 33,731 Haddock 0 451
Sardines 375 102,857 Whiting 42 33,487 Whelks 1 381
Hake 58 91,440 Hake 18 30,526 Mackerel 0 243
Ling 50 68,083 Witch 26 27,440 Ling 0 222
Mackerel 56 60,543 Dogfish 38 7,182 Dogfish 1 151
Other shellfish 38 51,952 Other pelagic 23 5,839 Whiting 0 78
Dogfish 153 47,653 Nephrops 2 2,770 Sardines 0 39
Scallops 21 33,843 Saithe 0 383 Hake 0 31
.
. Ecological Risk Assessment of the effects of fishing for South West fisheries
SR[670] 14 © Seafish
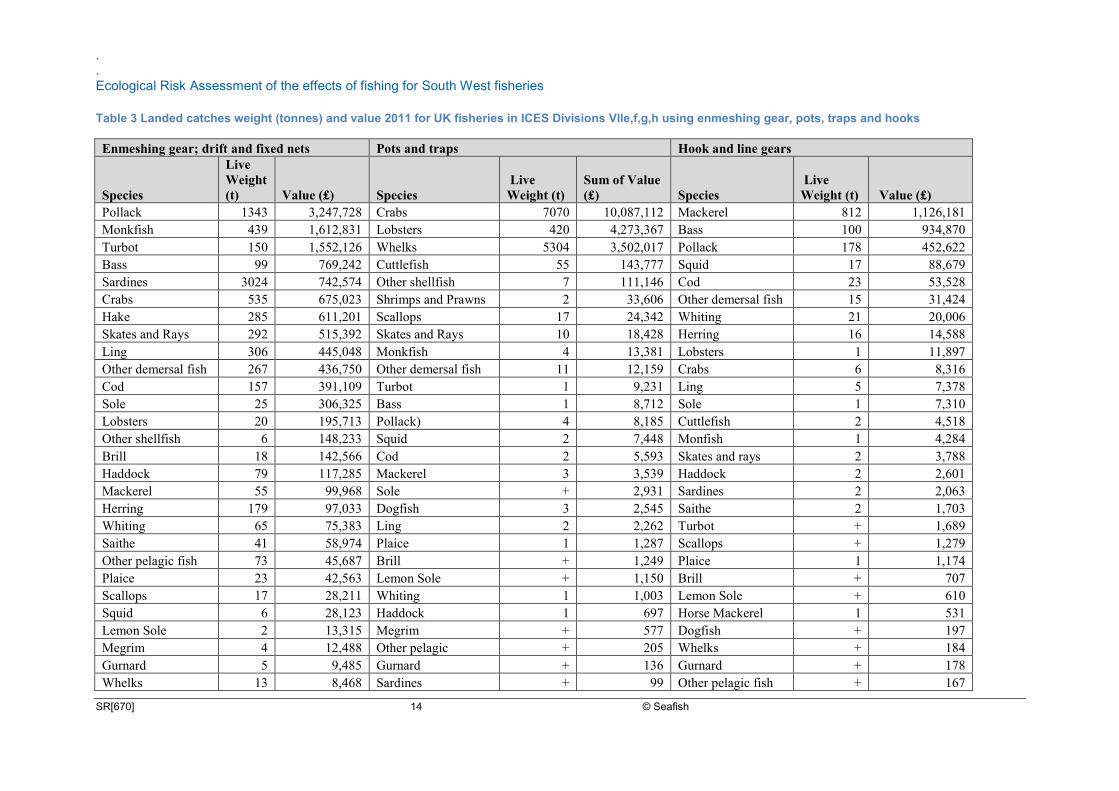
Table 3 Landed catches weight (tonnes) and value 2011 for UK fisheries in ICES Divisions Vlle,f,g,h using enmeshing gear, pots, traps and hooks
Enmeshing gear; drift and fixed nets Pots and traps Hook and line gears
Species
Live Weight (t) Value (£) Species
Live Weight (t)
Sum of Value (£) Species
Live Weight (t) Value (£)
Pollack 1343 3,247,728 Crabs 7070 10,087,112 Mackerel 812 1,126,181
Monkfish 439 1,612,831 Lobsters 420 4,273,367 Bass 100 934,870
Turbot 150 1,552,126 Whelks 5304 3,502,017 Pollack 178 452,622
Bass 99 769,242 Cuttlefish 55 143,777 Squid 17 88,679
Sardines 3024 742,574 Other shellfish 7 111,146 Cod 23 53,528
Crabs 535 675,023 Shrimps and Prawns 2 33,606 Other demersal fish 15 31,424
Hake 285 611,201 Scallops 17 24,342 Whiting 21 20,006
Skates and Rays 292 515,392 Skates and Rays 10 18,428 Herring 16 14,588
Ling 306 445,048 Monkfish 4 13,381 Lobsters 1 11,897
Other demersal fish 267 436,750 Other demersal fish 11 12,159 Crabs 6 8,316
Cod 157 391,109 Turbot 1 9,231 Ling 5 7,378
Sole 25 306,325 Bass 1 8,712 Sole 1 7,310
Lobsters 20 195,713 Pollack) 4 8,185 Cuttlefish 2 4,518
Other shellfish 6 148,233 Squid 2 7,448 Monfish 1 4,284
Brill 18 142,566 Cod 2 5,593 Skates and rays 2 3,788
Haddock 79 117,285 Mackerel 3 3,539 Haddock 2 2,601
Mackerel 55 99,968 Sole + 2,931 Sardines 2 2,063
Herring 179 97,033 Dogfish 3 2,545 Saithe 2 1,703
Whiting 65 75,383 Ling 2 2,262 Turbot + 1,689
Saithe 41 58,974 Plaice 1 1,287 Scallops + 1,279
Other pelagic fish 73 45,687 Brill + 1,249 Plaice 1 1,174
Plaice 23 42,563 Lemon Sole + 1,150 Brill + 707
Scallops 17 28,211 Whiting 1 1,003 Lemon Sole + 610
Squid 6 28,123 Haddock 1 697 Horse Mackerel 1 531
Lemon Sole 2 13,315 Megrim + 577 Dogfish + 197
Megrim 4 12,488 Other pelagic + 205 Whelks + 184
Gurnard 5 9,485 Gurnard + 136 Gurnard + 178
Whelks 13 8,468 Sardines + 99 Other pelagic fish + 167
SR[670] 15 © Seafish
Review of the effects of gear on benthic habitats and communities 4.8.
The various gear types discussed are known to have differing physical effects on different habitats, which themselves have varying susceptibilities to physical dis-turbance. Below is a brief review of the effects of different gears (generally) and where available what is known about their effects specifically in the SW area. Mobile demersal gear; otter trawling, beam trawling and scallop dredging
In ICES Division VIIe, where much of the trawling in the SW is carried out, two approaches have been used to evaluate the effects of mobile gear on benthic eco-systems in recent years;
1. Surveys of benthic communities have been carried out in areas which have been subject to differing levels of beam trawling activity as ascertained from VMS (Vessel Monitoring System) data (Defra, 2013). The resulting data were analysed to find out whether there was a detectable effect of beam trawling on the biomass and size composition of benthic communities. The results showed that the variation in biomass was more closely linked to environmental variables, (levels of chlorophyll, organic carbon, nitrogen and sediment type) than to the previous year’s fishing effort. Although an effect of fishing was detected, it was considered insufficient to be a limiting factor for benthic biomass. When the same approach was used in the North Sea (Jennings et al., 2001, Jennings et al., 2002) more significant effects on benthic biomass have been attributable to beam trawling. Here there was a reduction in sea urchins and bivalves with no decrease in the quantity of polycheates in the heavily trawled areas. Interestingly, in the North Sea, the total reductions in benthic biomass due to beam trawling were estimated to be of a greater magnitude outside the core areas where most fishing occurred. The dominance of smaller infaunal spe-cies such as polycheates, relatively unaffected by beam trawling, in the core areas may account for this effect. Outside the core areas, beam trawling would be expected to have an effect on sea urchins and bivalve populations previously less affected by trawling.
2. The effects of fishing disturbance by beam trawling, otter trawling and scallop dredging combined, were compared with natural disturbance due to tidal and wave action (Diesing et al., 2013). Also assessed was the sensitivity of the communities; that is the likely physical interaction with gear and their likely re-covery rate after disturbance (Bolam et al., 2014). Both of these studies cov-ered the UK waters of the ‘Greater North Sea’, which includes the Western English Channel (VIIe) and extends through the northern North Sea to around 56oN. The results suggest that communities in shallow sandy habitats where natural disturbance was high are less sensitive to trawl disturbance. Commu-nities in deeper areas containing gravel or mud habitats were considered to be more sensitive.
.
. Ecological Risk Assessment of the effects of fishing for South West fisheries
SR[670] 16 © Seafish
Therefore it is possible to detect and assess the effects of mobile gears on benthic communities and this is the subject of ongoing work. However, no reference points have been developed to judge what intensity of fishing is appropriate to maintain “good environmental status” under the Marine Strategy Framework Directive (MSFD) see Section 7. Static gears potting, gill and trammel nets
Several studies have found no detectable effect of the standard processes of setting and hauling pots upon the immediate ecosystem assemblage (Eno et al., 2001, Blythe et al., 2004, Coleman et al., 2013).
Fixed nets are considered to have relatively little impact upon the sea-bed it-
self and have mainly been studied in relation to protected species bycatch and in the context of lost nets that may carry on fishing (so-called “ghost fishing” Pawson (2003)). In areas of high wave and tidal action, lost nets are likely to entangle and bundle up, effectively ceasing to fish within a few weeks (Revill and Dunlin 2003). In deeper waters or areas less affected by hydrodynamic action, lost gear tends to fish for longer (Sancho et al., 2003). EU regulations (EC 227/2013) have recently been introduced stipulating measures which vessels should take to avoid losing these types of gears, especially in deep waters on the continental slope.
.
. Ecological Risk Assessment of the effects of fishing for South West fisheries
SR[670] 17 © Seafish
5. Risk assessment : Ecological Risk Screening The method adopted for this risk assessment was Ecological Risk Screening: de-
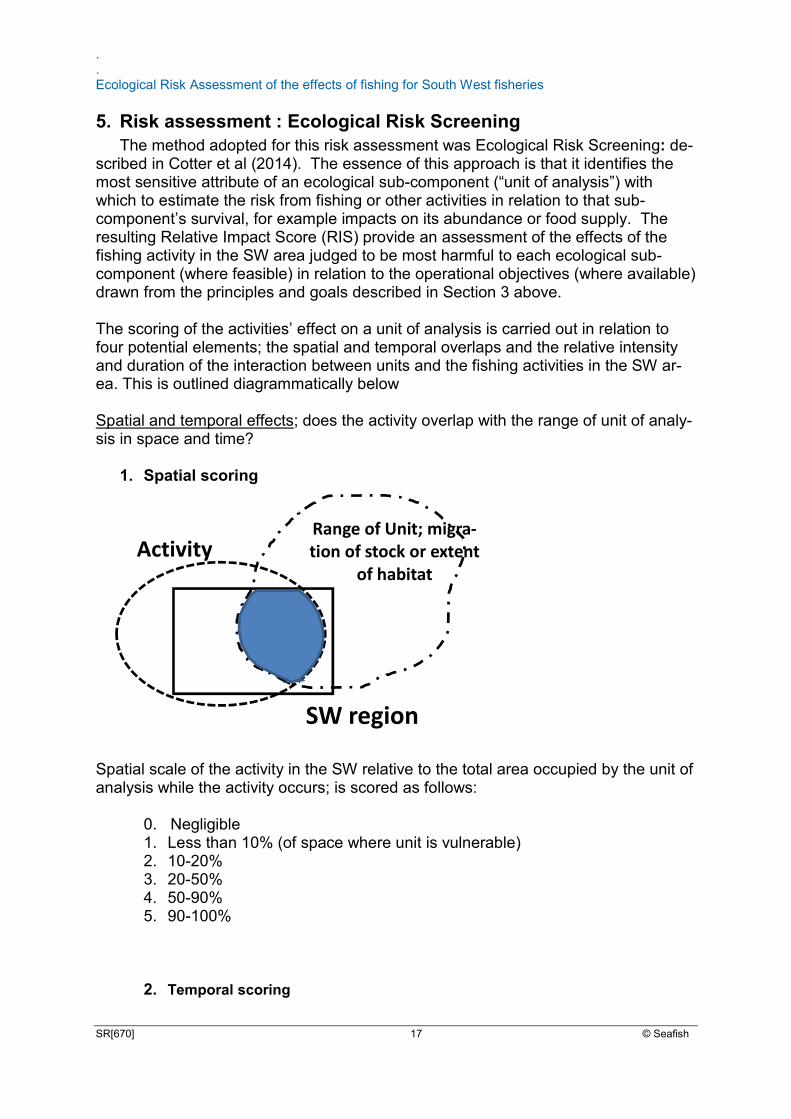
scribed in Cotter et al (2014). The essence of this approach is that it identifies the most sensitive attribute of an ecological sub-component (“unit of analysis”) with which to estimate the risk from fishing or other activities in relation to that sub-component’s survival, for example impacts on its abundance or food supply. The resulting Relative Impact Score (RIS) provide an assessment of the effects of the fishing activity in the SW area judged to be most harmful to each ecological sub-component (where feasible) in relation to the operational objectives (where available) drawn from the principles and goals described in Section 3 above. The scoring of the activities’ effect on a unit of analysis is carried out in relation to four potential elements; the spatial and temporal overlaps and the relative intensity and duration of the interaction between units and the fishing activities in the SW ar-ea. This is outlined diagrammatically below Spatial and temporal effects; does the activity overlap with the range of unit of analy-sis in space and time?
1. Spatial scoring
Spatial scale of the activity in the SW relative to the total area occupied by the unit of analysis while the activity occurs; is scored as follows: 0. Negligible
1. Less than 10% (of space where unit is vulnerable) 2. 10-20% 3. 20-50% 4. 50-90% 5. 90-100%
2. Temporal scoring
SW region
Range of Unit; migra-tion of stock or extent
of habitat
Activity
.
. Ecological Risk Assessment of the effects of fishing for South West fisheries
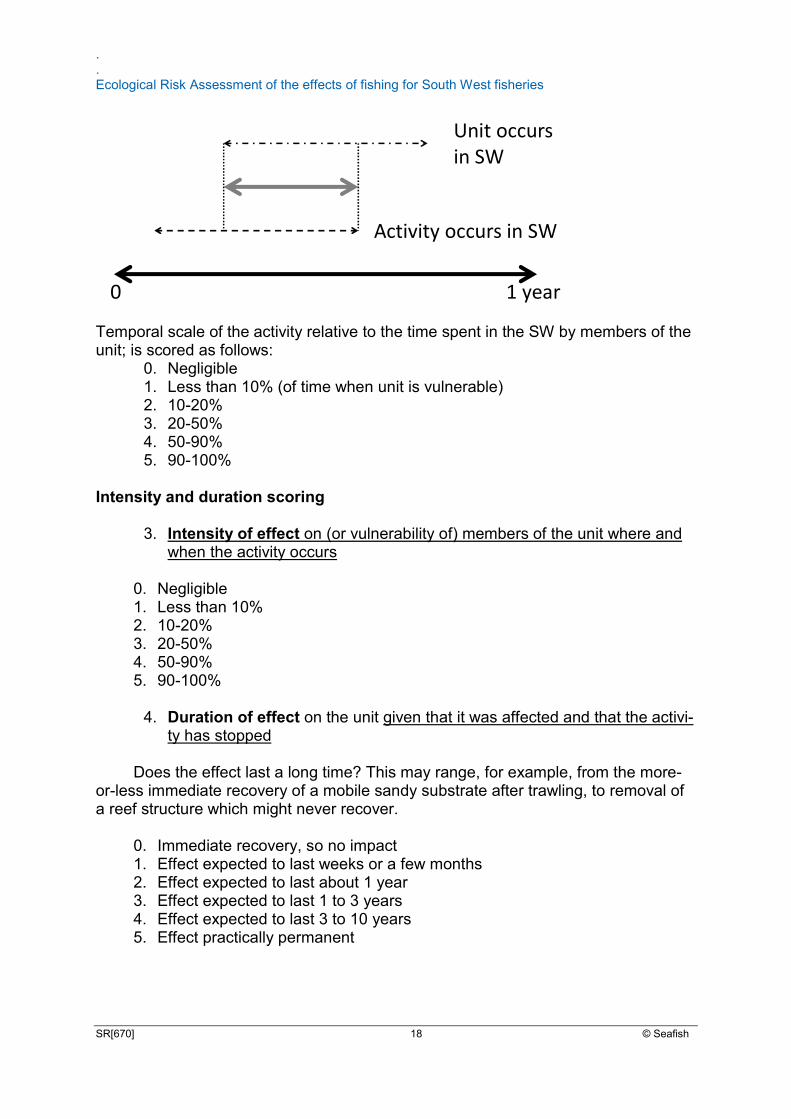
SR[670] 18 © Seafish
Temporal scale of the activity relative to the time spent in the SW by members of the unit; is scored as follows:
0. Negligible 1. Less than 10% (of time when unit is vulnerable) 2. 10-20% 3. 20-50% 4. 50-90% 5. 90-100%
Intensity and duration scoring
3. Intensity of effect on (or vulnerability of) members of the unit where and when the activity occurs
0. Negligible 1. Less than 10% 2. 10-20% 3. 20-50% 4. 50-90% 5. 90-100%
4. Duration of effect on the unit given that it was affected and that the activi-
ty has stopped
Does the effect last a long time? This may range, for example, from the more-or-less immediate recovery of a mobile sandy substrate after trawling, to removal of a reef structure which might never recover.
0. Immediate recovery, so no impact 1. Effect expected to last weeks or a few months 2. Effect expected to last about 1 year 3. Effect expected to last 1 to 3 years 4. Effect expected to last 3 to 10 years 5. Effect practically permanent
0
Unit occurs in SW
Activity occurs in SW
1 year
.
. Ecological Risk Assessment of the effects of fishing for South West fisheries
SR[670] 19 © Seafish
The scores used to assess these four effects, based on the expert opinion of the group, are then averaged (using a geometric mean; see Appendix 2) for each “unit” to produce a relative impact score. Note that:
• All scores range from 0 to 5
• Risk is zero if any one score is zero
• Risk is only 5 (the maximum) if all four scores are 5. Following this approach, the ERS relative impact score provides a comparative measure of those effects which occur due to fishing activities in the SW area, and ranks them so that a decision can be made on whether further action is warranted within the area. Some units of analysis, for example mackerel, have a widespread distribution and a very low intensity of interaction with SW fishing gears, so have a very low relative impact score. Conversely, cuttlefish have a more localised distribu-tion mainly within the SW area and a relatively intense interaction so end up with a high relative impact score.
It is important to understand that an ERS analysis provides a semi-quantitative (es-sentially qualitative) assessment of the potential impacts of an anthropogenic activity (fishing, in this case) on an ecosystem or environment and forms the first stage of an ERA. The ERS is deliberately broad ranging, and is conducted as an initial screen-ing which helps to identify the predominant impacts of fisheries which can then be considered by more detailed assessments. In the context of the present exercise, ERS identifies those impacts that can be screened out at an early stage as being less significant (in an ecological sense) and can potentially be ignored. This is based on the assumption that nothing is likely to rapidly change that may influence the rela-tive impact scores, and that there was sufficient understanding of all possible im-pacts within the assessment group. Some units with a low spatial overlap with the SW area therefore have a relatively low relative impact score in relation to fishing activities within the SW area. For ex-ample, Leatherback turtles are endangered at the population scale (across the Atlan-tic Ocean, and globally), but the risks of fishing in the SW area for the survival of leatherback turtle populations is low when compared with fisheries effects elsewhere or the disruption of nesting beaches. For such units, which are widely distributed but vulnerable outside the SW region, we provide a discussion of relevant aspects of management and mitigating measures. Mitigation scoring If the assessment group considered that there is effective mitigation in place for spe-cific impacts, 0.5 points was subtracted from the relative impact score. Conversely, if mitigation was not considered effective, 0.5 points was added to the relative impact score. These mitigation scores are shown in Table 5 to Table 13.
.
. Ecological Risk Assessment of the effects of fishing for South West fisheries
SR[670] 20 © Seafish
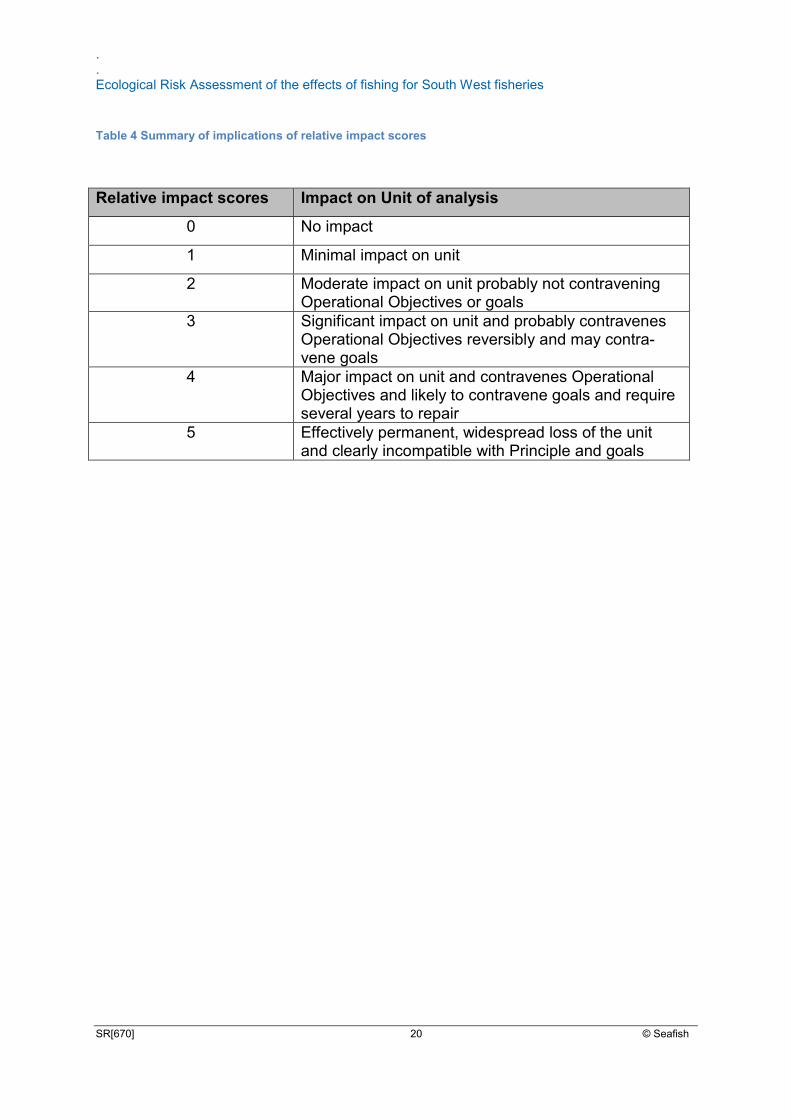
Table 4 Summary of implications of relative impact scores
Relative impact scores Impact on Unit of analysis
0 No impact
1 Minimal impact on unit
2 Moderate impact on unit probably not contravening Operational Objectives or goals
3 Significant impact on unit and probably contravenes Operational Objectives reversibly and may contra-vene goals
4 Major impact on unit and contravenes Operational Objectives and likely to contravene goals and require several years to repair
5 Effectively permanent, widespread loss of the unit and clearly incompatible with Principle and goals
.
. Ecological Risk Assessment of the effects of fishing for South West fisheries
SR[670] 21 © Seafish
6. Results and discussion of the ecological risk screening (ERS) outcome The spreadsheet containing the full scores is available at this link21. A summary
of the scores is shown in Table 5 to Table 13 (pages 37- 54). In presenting the re-sults of the ERS, we have focussed on three main outcome categories for individual units or components:
those meeting their operational objectives; but with a relative impact score of at least 3
those not meeting their operational objective and with a relative impact score of at least 3
those where operational objectives are not defined and with a impact score of at least 3
In components where all units score below 3, e.g. seabirds, only the highest rank-ing unit of that component is discussed.
The results of the ERS have been discussed only for (a selection of) those units that have a relative impact score of at least 3, which occurs when the spatial, tem-poral and intensity scores are 20-50% and the duration is expected to last 1-3 years. The intention is to demonstrate how ERS can be used to indicate components or in-dividual units that have a level of risk or sensitivity which would suggest further work. However, some units that scored low have been discussed in order to explain why they were not regarded as particularly sensitive using ERS.
We have not compared one score against another because a) it is essentially a ranking exercise and the scores are not quantitatively based and b) it is important to focus on the units with the highest risk and consider what further work or manage-ment measures are required to mitigate those risks, rather than fixate on the actual resulting scores.
During the exercise, a number of management or mitigation actions were identi-fied that are already helping to ameliorate these effects and which were taken into account in the ERS.
Communities and habitats (Table 5) 6.1.
Of 16 types of ecological community that were considered for risks arising from fishing, 6 indicator- or activity-community combinations were given ERS scores of 3.
Demersal fish communities
Three demersal fish community indicators were scored, based on time series of catch rates of fish in research vessel surveys;
21
www.seafish.org/media/publications/SR671ERAEF_Assessment_spreadsheet.xls
.
. Ecological Risk Assessment of the effects of fishing for South West fisheries
SR[670] 22 © Seafish
the Large Species Indicator (LSI); this tracks the proportion of fish by weight from species with a maximum potential length larger than a specified reference size, taking no account of the sizes of individual fish.
the Large Fish Indicator (LFI); this tracks the proportion of individuals larger than that size, taking no account of species.
the biodiversity indicator species richness: this tracks the number of species present in standard survey samples.
High levels of fishing would be expected to reduce the numbers of large fish in populations, potentially affecting the stability of the fish community, and these indicators have been proposed as robust indicators of the effects of fishing on community and foodweb structure as recognised in the European Community’s Marine Strategy Framework Directive (Le Quesne, 2013).
Of these community indicators, the LSI and the LFI were considered likely to be most affected by fishing activity, whereas the biodiversity indicator is driven more by climate change effects. Time series results (from Le Quense 2013) indicate that both LSI and LFI decreased over the period 1988-2004, although there were signs of increase in the LFI from 2000 (the LSI has not been analysed after 2004). Species richness was reported to have increased since the 1980s, possibly in response to ocean warming.
Potentially, increases in LSI and LFI can only be achieved through reducing fish-ing effort and improving selectivity of fishing gears (so more fish survive to be large). Improvements in the status of sole, cod, hake and plaice stocks (for example) have accompanied a reduction in fishing activity over the past decade, which suggests that the fish community is stable enough to respond to management.
From observations on the improvement in these stocks, the ERS assessment group. decided that changes in the demersal fish communties had not reached the stage of disrupting ecological processes or the food-web. This is effectively the operational objective for fish communities, since other defined reference points for the LSI and LFI were not available for the SW area.
No management action additional to that already taking place under the CFP was indicated, though there is a need to develop indicators for pelagic fish communities (for which LSI and LFI, are less informative) see below.
Pelagic fish communities There were no indicators available to score the effect of fishing on pelagic fish
communities per se, so it was not possible to obtain a robust basis for scoring this effect. The status and effects of fishing on the various pelagic species was scored as individual species’ stock units (see below). Plankton communities
It is possible to envisage changes in the plankton community induced by the effects that changes in the fish and benthos community (due to fishing) have on lar-val production and grazing pressure (such effects have been observed in the Black Sea, Daskalov, 2007). However, it was difficult to obtain a robust basis for scoring these effects. It is known that plankton communities in the SW area are strongly in-
.
. Ecological Risk Assessment of the effects of fishing for South West fisheries
SR[670] 23 © Seafish
fluenced by physical oceanographic effects, such as the North Atlantic Oscillation (NAO) (Edwards et al., 2013), so it may be difficult to discern the effects of fisheries per se.
A high relative impact score for zooplankton communities was not thought jus-
tified, given the open aspect of SW waters to the Atlantic. Similarly, though phyto-plankton communities can be vulnerable to coastal nutrient enrichment, possibly leading to increased frequencies of algal blooms, these are rare in the SW region. Communities consisting of planktonic fish larvae (Ichthyoplankton) were thought to be at risk from fishing because reductions in the numbers and sizes of spawning adults would reduce the quantity of larvae produced. Improvements in fish stock demography (increased numbers of larger spawning fish) would help to counter this risk. Benthic habitats and communities (see also section 4.8)
Benthic habitats in the SW are at risk, not just from fishing, but from aggre-gate extraction and waste disposal, either by discharges from pipes or by dumping and other activities licensable under the Marine and Coastal Access Act 2009. How-ever, part of the licencing procedure requires a risk assessment process (see Koch and Paccito 2013). A general problem with benthic habitats in the region is to know the extent and distributions of each type, given that available studies were restricted in geographic scope, objectives, or by sampling difficulties. Therefore scores ob-tained for effects of fishing on benthic habitats were considered to be indicative only.
Certain habitats, designated as ‘Features of Conservation Importance’ under the Oslo-Paris Convention and also present on the list of Priority Species and Habi-tats under the UK Biodiversity Action Plan, are potential issues with regard to fisher-ies management. Other benthic communities which occur sporadically: pink seafan colonies, ocean quahog, and fan mussel dominated systems; are fragile and readily damaged by fishing gear. These communities, and also biogenic habitats such as maerl beds, ross worm (Sabillaria species), and blue mussel beds, listed under the Habitats Directive and are to be risk assessed individually; see below. Therefore, these habitats were considered to be beyond the scope of this assessment. A suita-ble operational objective relevant to biodiversity of benthic communities could be that the key species in these communities and habitats are not depleted to the point that those habitats’ survival is compromised.
Epibenthic assemblages in three categories: inner (30 to 130m) and outer (49
to 175m) shelf, and Celtic Sea deep mud, were thought to be vulnerable to alteration by trawling and dredging (noting that these communities may have historically been strongly modified by demersal fishing see Section 4.8). The integrity of epibenthic communities is relevant for maintaining biodiversity and ecological processes and, for some species, for sheltering juveniles and foraging.
All 4 units of analysis considered for Infaunal communities were assigned rel-ative impact scores close to 3 in response to trawling and dredging activities, and disruption of ecological processes and foodwebs were considered not to have oc-curred significantly, though these results must remain tentative.
.
. Ecological Risk Assessment of the effects of fishing for South West fisheries
SR[670] 24 © Seafish
It is worth noting that the recent improvements in stocks of sole and plaice,
which have occurred as beam trawl effort levels (
Figure 4) have reduced, suggests that the any cumulative effects of beam trawl fishing on the potential productivity of the SW area has not significantly inhibit-ed the recovery of these stocks. At the same time there has been an increase in the hours fished per annum by scallopers, which would be expected to have a different pattern of fishing activity and hence a different impact from beam trawlers.
Although CEFAS (Koch and Paccito, 2013) estimated the distribution of
fishing relative to the European Nature Information System22 (EUNIS) habitats in the SW area, it was considered that the accuracy of the information on EUNIS habitats is insufficiently accurate to determine risk scores.
Clearly, different fishing gears have different physical and ecological effects and hence risk levels. The ‘Finding Sanctuary’ and subsequent risk assessment pro-cess being carried out by MMO (section 0) as part of the MCZ process is intended to make an assessment of the effects of the various gears on these habitats. There have been a number of risk assessments for benthic habitats and gears, for exam-ple Anon (2011) and Eno et al., (2013) which could be used for these focussed risk assessments.
Fish stocks 6.2.
The main policy goals identified to be at risk from fishing were maintenance of viable fisheries and replenishment of stocks, and protection of ecological processes and biodiversity, though few ecological issues were raised. As for other ecosystem components, spatial scores were increased by considering local stocks rather than total species as the units of analysis.
6.2.1 Teleosts (Table 6)
Seven fish stocks in the SW area: cod (VII e-k); plaice (VIIe); Dover sole (VIIe and VIIfg); whiting (VII e-k); hake (Northern stock) and haddock (VIIb-k) have full an-alytical assessments, of which five, cod, whiting, both stocks of Dover sole and hake are considered by ICES to be close to maximum sustainable yield (MSY), whilst the remainder are inside safe biological limits (that is, their reproductive potential is not impaired). However, 14 of the 24 species-activity pairings for teleost fish received relative impact scores 3 . Since they are all marketable species and therefore the focus of commercial fishing effort, this result is not surprising, and is reflected in recent advice from ICES.
Discards (caught fish that are returned to the sea either because they are un-dersized, unmarketable or outside quotas) are a source of risk (to cod, haddock and plaice in particular) because they not only reduce yields to the fishery but they also degrade the information on the total catch used for stock assessments. However, considerable effort is being made to reduce discarding (e.g. Catchpole 2013).
22
http://eunis.eea.europa.eu/index.jsp
.
. Ecological Risk Assessment of the effects of fishing for South West fisheries
SR[670] 25 © Seafish
Factors identified as ameliorating the effects of fishing on teleost fish in the SW were management of the fishery as a whole under the EU’s common fisheries policy (CFP; EU 1380/2013); local measures such the seasonal restriction on fishing in an area off North Cornwall (the Trevose box; Figure 2) to protect spawning cod and a number of restrictions on trawling under local bylaws; management plans for TACs on Dover sole in the Channel (ICES Div VIIe); allowing selective fishing by lo-cality; voluntary use of large mesh nets by trawlers to reduce discarding of gadoids and plaice in particular, though this may be accomplished by the upcoming landing obligation (discards ban) under the CFP.
The main spatial management measure applying to beam trawls is a re-striction on combined beam length to less than 9 m inside the 12 mile limit, and there is a sole recovery zone in operation which restricts fishing effort on vessels using beam-trawl gear in ICES Division VIIe.
Megrim and monkfish are assessed using abundance indices from research vessel surveys, which cannot be used to provide advice for management at MSY. On the positive side, there has been a reduction in fishing effort in the fisheries which catch monkfish and megrim in offshore areas, and a recent law has tightened up control of tangle net fishing on the shelf edge which should reduce risks to monkfish stocks (EU 227/2013).
Of the data-limited stocks, turbot and brill were considered to be of higher consequence because of the lack of assessment and management measures. However, the risk to these stocks is reduced because growth is rapid and takes place outside the main area of the fishery. Sea bass are considered a higher risk than previously because of a reduction in stock biomass in the past 8 years, following a general increase from 1991 to 2005.
Pilchards (sardines) are an important stock in this area which supports a local (Cornwall) ring net fishery. Although ICES has assessed the stock as being at MSY, it is highly likely that environmental conditions affect production and availability to SW fisheries (Edwards et al., 2013). A lack of management for pilchard fishery was raised as an issue.
The stocks of hake and mackerel have a wide geographical distribution and have been the subject of considerable management attention in recent years. How-ever, the fisheries which exploit them in the SW area are relatively small and there-fore receive a relatively low score. A similar situation exists for John dory for which stock structure is unknown, there is no assessment, but the available data give no cause for immediate concern (ICES WGNEW).
Of the remaining stocks, lemon sole (VIIe,f,g,h), sprat (VIId,e) and black bream (VIId,e) are relatively localised and were considered lower risk due to the ap-parently low vulnerability of juveniles in the case of lemon sole, limits on vessel entry to the fishery in the case of sprat, and protection of the spawning habitat for black bream.
Other issues identified were the poorly known biology of megrim and lemon sole; the poorly known trophic role of pilchards in transferring primary production energy to higher trophic levels in the SW; and the influence of climate change on the distribution and abundance of red mullet.
.
. Ecological Risk Assessment of the effects of fishing for South West fisheries
SR[670] 26 © Seafish
Note that several teleost species including relative rarities, some of which are highly protected, such as the Atlantic sturgeon, Allis and Twaite shad, sea-horses or gobies were not scored.
6.2.2 Elasmobranchs (Table 7)
Of the 35 species-activity pairings for elasmobranchs that received relative impact scores, 20 were 3 . Many elasmobranch species are well known to be at high risk from fishing because of their vulnerability to several gears and they mature at a relatively late age and have low fecundity (few young). This is reflected in their high duration and hence high relative impact scores. The ERS identified conserva-tion concerns for the angel shark; common, white and long-nosed skates; the sting-ray, marbled and dark electric rays, plus 9 other ray species; the lesser-spotted dog-fish, nursehound, spurdog and tope. Several of these species are widely distributed globally but received high spatial scores because of the importance of local stocks or groupings for local biodiversity and, possibly, food webs. Some species have re-duced in numbers and/or range, or have (naturally) patchy distributions in the SW area. These include common skate, white skate, angel shark, stingray, electric ray, undulate ray and spurdog.
The more abundant and commercially important blonde, cuckoo and thorn-back rays appear to have higher recovery rates, and this is reflected in their lower relative impact scores. There are data limited assessments on these stocks which suggest that thornback rays are increasing in abundance, but numbers of blond and cuckoo rays and some other ray species are decreasing. However, the survey catch rates upon which these assessments are based are highly variable, and the surveys are not designed to sample these species, which appear to have centres of popula-tion outside the main trawling areas. Shepard et al., (2012) suggest that areas of low effort in the Celtic Sea, which are lightly fished because they are unsuited to fishing, may act as refugia for these species.
Operational objectives that can be monitored easily and will reliably indicate the viability of elasmobranch stocks were difficult to find because some species seldom occur in either Research Vessel (RV) surveys or under observer pro-grammes, and there are no formal stock assessments. It is apparent that elasmobranchs may require special protection, and this is the focus of work by ICES, CEFAS, Defra and industry. Examples include agreeing Minimum Landing Sizes (MLS) and exploring possible spatial management measures.
However, several measures are already in place to protect elasmobranchs, including listing by the International Union for the Conservation of Nature (IUCN) and European conservation legislation, MLS and landing limits, e.g. for tope. An attribute of many elasmobranch species that helps to protect them is that they often survive being caught and discarded (Enever et al., 2009).
Shellfish 6.3.
6.3.1. Molluscs (Table 8)
Of the 11 species-activity combinations considered for marketable molluscs, three were given an adjusted relative impact score 3 , namely whelks, cuttlefish and scallops. The main concern was the declining viability of the fisheries, and notable
.
. Ecological Risk Assessment of the effects of fishing for South West fisheries
SR[670] 27 © Seafish
issues were that operational objectives suitable for measuring stock status other than by using basic fisheries data were difficult to find, and the ecological importance of the scallop, as a filter feeder, was unknown.
Whelks are targeted using pots in eastern parts of Division Vlle. There is no planktonic phase in the lifecycle so recruitment is dependent on the level of local parent stock; hence the stock is allocated a high spatial score. The high intensity score is due to the perceived high catchability and low selectivity of pots/traps; the MLS is considered too small compared with the size at first maturity; and these fac-tors result in a high relative impact score.
The Cuttlefish stock unit occurs within Divisions Vlld & e and is subject to tar-geted fisheries, so it has high spatial and intensity scores. The beam trawl fishery targets the overwintering stock in the deeper waters of VIIe, catching smaller cuttle-fish, whereas the trap fishery catches the adults inshore at or just before spawning in the spring and summer. Cephalopods have a short lifecycle and no stock assess-ments are carried out. Apart from measures controlling cod-end mesh size of trawls under EU Reg. 850/98 that affords a limited protection for small cuttlefish, there are no other specific management measures in place.
Scallops are present on mixed and gravelly substrate predominantly in Division VIIe. UK inshore fisheries and international offshore fisheries are relatively lightly regulated compared with the French coastal fisheries, which are tightly managed and have shown improved yields over recent decades. Assessment of scallop stocks is difficult because of their patchy distribution meaning some beds may be fully exploit-ed whilst others are relatively lightly fished.
A combination of factors helps to mitigate the effects of fishing on scallops. The English scallop order regulates the design of scallop dredges (effectively 75 mm rings and 9 teeth to the bar), and allows the use of more than 8 dredges a side only outside the 12 mile limit. These management zones, are intended to protect inshore stocks from larger vessels. Although dredges have a relatively heavy physical effect, resulting in damage to some scallops (3-15%, the damage rate has been observed to vary between beds and is related to shell strength, Brand pers. com), those scal-lops not caught or discarded below the MLS survive well. There are also local ves-sel size and seasonal restrictions within 6 miles of the coast, and areas closed to scallop dredging in Falmouth and Lyme bays to protect maerl beds and mudstone reef communities respectively.
Fishermen tend to target scallop beds until they are fished down to an uneco-nomic catch rate, and then move on to other beds effectively leaving recently fished beds to replenish. This results in a rotational harvesting regime that is considered to help scallop stock sustainability. Though there has been an upward trend in effort in the scallop fishery, scallop dredging effort by UK vessels over 15 m in the SW area is subject to a ceiling on effort (in kw days) under the EU Western Waters effort re-gime, though this is not related to the status of scallop stocks.
Stocks of blue mussels and native oysters occur predominantly within estua-rine areas and are tightly regulated by IFCA regulations.
.
. Ecological Risk Assessment of the effects of fishing for South West fisheries
SR[670] 28 © Seafish
6.3.2 Crustaceans (Table 9)
Of the 14 species-activity combinations considered for marketable crusta-ceans, 4 were given adjusted relative impact scores 3 , namely the crawfish, lob-ster, edible crab, and spider crab. The main perceived risk of fishing activities was that the fisheries might lose economic viability and diversity. Issues arising were; incomplete knowledge of the biology of these species; poor or inconsistent reporting of landings; and the difficulty of finding an easily monitored and reliable indicator of stock status that could be used as an operational objective. As is the case for mol-luscs, better knowledge of these species’ biology might alleviate concerns about the perceived consequences of fisheries.
With the exception of crawfish, which are thought to recruit to SW waters from the Iberian Peninsula, these stocks are considered to be local stocks although edible crab are known to migrate considerable distances. Intensively targeted fisheries, which are localised and of lengthy duration, contribute to the relatively high relative impact scores.
In the most recent assessment (2011), the two main stocks (edible crab and lobster) are considered at or close to MSY with which the relatively high relative im-pact scores are congruent. Most of the management measures are designed to conserve spawning stock through regulation of minimum landing size (MLS), use of escape gaps for undersized crabs or lobsters, and protecting parent stocks of lobsters through V-notching and return of egg-bearing (“berried”) female lobsters (Bell 2013). Whilst these regulations are expected to be of benefit, the more stringent ones only apply within the IFCA waters (inside 6 miles). Although there are no controls on pot numbers, effort by the larger vessels (> 15 m) are regulated under the Western Waters effort regime, and there are licensing and other restrictions which are likely to constrain effort. Effort in the pot fishery (including for whelks) has decreased in terms of hours fished since 2006.
Seabirds (Table 10) 6.4.
There have been both direct (negative) effects on seabirds due to interactions with fishing gear, and indirect effects: some positive, where food supplies have in-creased due to offal availability and discarded fish and some negative, where indus-trial fisheries have diminished food supplies for seabird populations (see Mander and Thomson 2013).
Of the 24 seabird-activity pairs subject to ERS scoring, three species, the sandwich, little and common terns were thought to be most at risk (relative impact score 2.6) indirectly from fisheries because of a possible reduction in small, surface-living fish (sprat) available for raising chicks within foraging range of nesting sites. Foraging ranges of these species are relatively small, making them vulnerable to lo-calised depletions. This is not a proven causal effect and is an area for further inves-tigation.
Whilst other assessed species were thought to be most at risk from interac-tions with the various types of fishing gear, none of the seabird-activity pairs gener-
.
. Ecological Risk Assessment of the effects of fishing for South West fisheries
SR[670] 29 © Seafish
ated a relative impact score above 2.6 in view of the relatively few observations of significant mortalities of seabirds during fishing operations in the SW region. Some species, such as fulmars, kittiwakes, gulls and gannet benefit from discarding. There is a considerable amount of quantitative data on seabirds, which might allow opera-tional objectives to be set for monitoring the success of seabirds in the SW region.
The direct effect of gillnets on diving birds in St Ives’ Bay is well documented and this fishery is subject to legislation designed to protect birds from bycatch. This legislation has only been used to control fishing activity once in its 10 year history (Cadman pers com.) suggesting that the relatively low relative impact scores for these species are appropriate
Sea Turtles (Table 11) 6.5.
All five species of sea turtle that are sighted within the SW region, the leather-back, Kemp’s Ridley, hawksbill, loggerhead and green turtles, are listed as endan-gered or critically endangered species by the IUCN and are therefore relevant pri-marily to the policy goal of biodiversity. The ERS indicated that all types of fishing put sea turtles at additional risk when present in the SW, either directly through en-tanglement in static gear buoy ropes or possible interactions with other gear types, and/or indirectly due to fisheries being a potential source of polythene litter which the leatherback is known to ingest.
All species had relative impact scores < 3 except for the leatherback which
had an initial score of 2.8 which was adjusted upwards to 3.3 on account of its ex-treme rarity and the threats to its existence throughout its global range.
Because of the sporadic presence and observations of turtles in the SW, it is difficult to set a useful operational objective, though one possibility could be ‘to avoid increasing the risk to global populations’ which might be implemented with policies designed to minimise turtle bycatches and discharges of polythene.
Marine Mammals (Table 13) 6.6.
Effects on marine mammal populations broadly divide into ecological effects, where there is competition for food supplies or habitats are affected by fishing, and direct or operational effects where there is incidental bycatch. Ecological effects discussed by Kingston et al., (2013) show that the size and species composition of fish targeted by fisheries may be an important factor in relation to their role as prey for marine mammals. However, such interactions are difficult to score in the ERS, and are probably not the most critical interaction.
Of the 10 cetacean or seal species assigned ERS scores, only bottlenose dolphin and harbour porpoise were 3 . The main risk of fishing to both species was considered to be entanglement in static nets. It is worth mentioning that the common dolphin (which scored <3) is also taken by some static net and pelagic trawl fisheries in the region. These risks are relevant to policy goals biodiversity and protection of ecological processes, since marine mammals are top predators that may play a sig-nificant role in regulating population sizes at lower trophic levels.
.
. Ecological Risk Assessment of the effects of fishing for South West fisheries
SR[670] 30 © Seafish
As with turtles, it is difficult to set a useful operational objective for those ma-rine mammal species that only occasionally appear in the SW. However, because there are population surveys and bycatch estimates for harbour porpoise and com-mon dolphin, it is possible to estimate the magnitude of mortalities due to fisheries, and relate these to the operational objective of a maximum “unacceptable interac-tion” being the total anthropogenic removal above 1.7 % of the population set by ASCOBANS (the Agreement on the Conservation of Small Cetaceans of the Baltic and North Seas), to which the UK is a signatory. These operational effects are scored under the ERS where adequate information is available.
Bottlenose dolphins live in large offshore populations (estimated at some 30,000 for ICES Subareas VII and VIII) and also in small “family” groups numbering a few individuals which inhabit coastal waters of the south west (and elsewhere). If these inshore populations are relatively self-contained and live in SW waters year round, they attract high spatial and temporal scores which are reflected in their rela-tive impact score.
Considerable research and development effort over the past 10 years to reduce harbour porpoise bycatch in static nets has led to the routine use of acoustic deter-rent devices (pingers) by static net vessels larger than 12 m operating in most of Subarea VII under the requirements of EU Regulation 812/2004. The effectiveness of pingers on fixed nets to reduce common dolphin bycatch has not yet been fully quantified, though there is some evidence from SW fisheries of a mitigation effect for this species. The efficacy of pingers to reduce bottlenose dolphin bycatch is un-known at present and there are conflicting reports about this species’ behaviour in relation to pingers from different parts of the EU.
Grey seals (and harbour seals to a lesser extent) are present in the southwest in relatively low numbers compared with other parts of Britain. They are considered to interact with fishing activity at a relatively low intensity hence their relatively low rela-tive impact scores. That said, direct interactions with fishing gears by grey seals, both in terms of bycatch and depredation have been documented in the SW and are seal interactions are monitored under the UK bycatch programme.
.
. Ecological Risk Assessment of the effects of fishing for South West fisheries
SR[670] 31 © Seafish
7. The ERS approach and the Marine Strategy Framework Directive (MSFD; EU 56/2008)
The two main advantages of the ERS approach are that it enables all
components to be judged on a similar scale, and that it utilises expert knowledge from a variety of backgrounds to produce the relative impact scores. The main weakness lies in its subjectivity; particularly when scoring the intensity of effect. ERS scores should not be judged on an absolute basis, they are simply a means to rank the effects and to help prioritise future action on the most sensitive issues.
This section considers the ERS approach and how it could be relevant to the implementation of the EU MSFD. It then looks at possible actions arising from the ERS and how those highlighted could be taken forward.
The MSFD ‘………. establishes a framework within which member states take all the necessary measures to achieve or maintain good environmental status in the marine environment by the year 2020.’
The MSFD has a number of operational objectives, of which the following de-scriptors are relevant to this assessment:
Descriptor 1 requires maintenance of biological diversity, in the sense that the objectives for most of the effects on the non-exploited species were to keep these populations at a level of at least a presence in the South West, or avoid any deleterious effects of fishing. Whilst it was possible to assess changes in biodiversity on fish communities, it was more difficult to assess the effects on habitats and benthic communities.
Descriptor 2 is not relevant here because non-indigenous species were not considered in the ERS.
Descriptor 3, which requires that all commercially exploited populations are within safe biological limits and exhibit population age and size structures that repre-sent a healthy stock, was examined for most exploited stocks. Many assessed stocks met this descriptor and some also met the primary indicator of fishing mortality being at or below FMSY. However, a number of stocks had no assessment (e.g. cuttlefish, brill and turbot) or there was a ‘data limited’ assessment for which the management aim is to keep the biomass stable until the assessment is improved such that MSY reference points can be defined (e.g. monkfish and megrim).
Descriptor 4 relates to good environmental status in terms of maintaining the function of food webs. In this case, we were able to use the large fish indicator (LFI) in the sense that, if this measure is considered satisfactory then the food web should be functioning well. There is also empirical evidence that the system as a whole is relatively intact and able to recover from the effects of fishing, based on the observation that many of the main stocks in the area have improved in recent years as effort has fallen or other management measures have been introduced.
Descriptor 6 concerns sea-floor integrity, and the MSFD highlights some of the difficulties that were encountered during this assessment. Though the locations of some features such as maerl beds have been identified, and protected, the ERS highlighted a number of potentially important sea floor habitats and species (that
.
. Ecological Risk Assessment of the effects of fishing for South West fisheries
SR[670] 32 © Seafish
form biogenic reefs, for example) that still have to be mapped and assessed against fishing pressures.
The main conclusion of this exercise was that the ERS method has utility in highlighting progress towards ‘good environmental status’ and can help prioritise actions aimed at working towards this goal.
.
. Ecological Risk Assessment of the effects of fishing for South West fisheries
SR[670] 33 © Seafish
8. Further action and work
During this exercise, which aimed to identify the most sensitive elements of each ecosystem sub component to fishing in the SW area, a number of actions and some further work were identified.
With respect to demersal fish communities, it was apparent that the indica-tors LSI, LFI and species richness should be monitored into the future. The LFI was monitored up to 2008, but the LSI has not been analysed since 2004. There is a break in the time series in 2004 for some surveys (Le Quense 2013), though the sur-veys have been undertaken and it should be possible to calculate the indices. These indicators will be monitored under the EU Data Collection Framework, so it will be possible to track changes in them over the coming years. However, we noted that there are no reference points for these indictors for the SW area and these will need to be developed if these indicators are to be useful management tools.
Potentially, increases in LSI and LFI can only be achieved through reducing fishing mortality and/or by improving the selectivity of fishing gears (so more fish sur-vive to be large). Improvements’ in the status of sole, cod, hake and plaice stocks (for example) have accompanied a reduction in fishing effort over the past decade, which suggests that the underlying fish community is sufficiently stable to respond to management efforts.
Improvements to data and assessments are a priority for a number of teleost species (monkfish, megrim, red mullet, brill, turbot, and lemon sole), so that scientific advice can be usefully applied to management aimed at MSY.
Indicators to score the effect of fishing on pelagic fish communities are lack-
ing.
It was difficult to obtain a robust basis for scoring effects on plankton com-munities, because they are strongly influenced by physical oceanographic effects and it may be difficult to detect the effects of fisheries even if such effects occur.
Information on the distribution, sensitivity and status of benthic communities is valuable in managing them in relation to the MSFD and Marine Spatial Manage-ment. Whilst the location of some benthic communities is fairly well described (maerl beds, for example), improving our knowledge of the location of benthic habitats and the level of fishing intensity on them is clearly a basic requirement for ensuring their protection. A suitable operational objective relevant to biodiversity of benthic com-munities could be that the key species in these communities and habitats are not depleted to the point that those habitats’ survival is compromised.
Fishing vessels are often equipped with advanced echo sounders and OlexTM systems, which could provide information that might improve mapping or ground- truthing of benthic communities. The Seafish guide to good practice for scallop
.
. Ecological Risk Assessment of the effects of fishing for South West fisheries
SR[670] 34 © Seafish
fishing23 encourages fishermen to avoid reefs and patches of hard ground in order to conserve biodiversity, and it also encourages fishermen to make information from their echo sounder records available for scientific research. High resolution spatial information from vessels of less than 15 m would also help to improve knowledge and hence management and conservation of the inshore (inside 12 nm) environment (see Caslake 2009).
The most widely studied component in the SW area is teleost fish (particularly commercial species), and there are already numerous management initiatives in place to improve sustainability including: TACs and quotas; effort controls; Minimum Landing Sizes (MLS), species management plans; the Trevose box; protection of nursery areas, mesh size controls and the upcoming EU landings obligation (“discard ban”). Some stocks, however, are considered to require further work:
There is a need for improved assessments of the monkfish and megrim stocks, for which data have been of insufficient quality for a full assessment in recent years, due to difficulties in ageing monkfish and poor quality data for megrim.
Data-limited, or higher level, assessments should be considered for stocks of brill, turbot, red mullet and lemon sole.
Pilchard (sardine) and sea bass stocks would benefit from management measures that enabled them to be exploited a rate corresponding to MSY.
Efforts should continue to reduce discards and improve selectivity, particularly for cod, haddock and plaice. One approach is to use 120 mm cod end mesh, rather than the 100 mm allowed under EU rules when targeting gadoids, which would help select against juvenile cod, haddock and plaice and would presumably also reduce mortali-ty on other commercial and non-commercial species.
ICES has advised on management measures for individual elasmobranch species, other than TACs, which include: spatial management (taking advantage of the refugia effects noted previously); minimum and maximum landing sizes to conserve juvenile and/or breeding stock and gear modifications either to reduce abrasion (which can lead to post-release mortality) and/or excluded certain size groups from the catches.
ICES also noted that there is a need to use local knowledge to develop and im-plement viable measures in the context of the overall management of skate and ray stocks in the region. Shephard et al., (2012) provide an example of how scientific and fishermen’s data can be brought together to improve knowledge on the spatial distribution of these stocks.
23
www.seafish.org/media/Publications/UK_Scallop_Industry_Good_Practice_Guide_for_consult.pdf
.
. Ecological Risk Assessment of the effects of fishing for South West fisheries
SR[670] 35 © Seafish
Defra is currently progressing the shark, skate and ray plan, which includes a number of collaborative initiatives between fishers and scientists designed to improve knowledge of skate and ray stocks. Further information can be found at;
https://www.gov.uk/government/uploads/system/uploads/attachment_data/file/224294/pb14006-shark-plan-review-20130719.pdf http://webarchive.nationalarchives.gov.uk/20130505040140/http://archive.defra.gov.uk/environment/marine/documents/interim2/shark-conservation-plan.pdf A number of requirements relevant to shellfish management were noted.
Consideration should be given to a whelk MLS which is related to length at maturity.
A research project (CRESH24), carried out by the Marine Biological Associa-tion of the UK and the University of Caen in France, has investigated aspects of cut-tlefish spawning, the effects of environmental conditions on recruitment, and pro-vides an opportunity to develop assessment and management methods. Because cuttlefish and squid grow rapidly and die after spawning (at age 2 and 1 respective-ly), it is important to ensure that sufficient adults survive to produce enough eggs for the next generation to develop properly. Consequently, setting appropriate TACs would need a shorter timescale than for teleosts.
Improving the assessment of scallop stocks is an important challenge, and a study25 by the University of Bangor in collaboration with CEFAS and the industry seeks to develop an assessment methodology, together with an investigation of the environmental effects of scallop dredging in the English Channel.
Most of the current management of edible crab and lobster stocks is
designed to conserve spawning stock through technical measures, but modelling studies suggest that small changes in effort levels can be as important with respect to stock sustainability (Bell, 2013). The ACRUNET26 project is investigating possible international management strategies for edible crab fisheries.
International and local measures are required to improve management of crawfish stocks.
Seabirds: Further work would be to examine the possible effects of fisheries on food availability for foraging terns.
Sea turtles: Following the turtle code27 and avoiding littering should be adequate mitigation measures for the very small number of turtles encountered
24
www.unicaen.fr/ufr/ibfa/cresh/?lang=en
25 www.seafish.org/about-seafish/news-and-events/news/phd-student-tackles-scallop-habitat-survey-
in-english-channel
26 http://www.acrunet.eu/
27 www.mcsuk.org/sightings/turtles.php
.
. Ecological Risk Assessment of the effects of fishing for South West fisheries
SR[670] 36 © Seafish
Marine mammals: Although bycatch of Bottlenose dolphins is known to oc-cur in the SW, there is not currently enough data to produce robust mortality esti-mates. Furthermore it is not known whether bycaught animals originate from the larger offshore population or from the smaller inshore group (or both) and ideally this should be determined so that observed bycatch rates can be placed in the correct context. The behaviour of bottlenose dolphins in relation to the presence of pingers is inconclusive, so it is questionable at this time if the use of pingers is a suitable ap-proach for mitigating bycatch of this species.
The routine use of pingers by the offshore (>12m) fleet will reduce the bycatch rates of harbour porpoises (and probably common dolphins) in these fisheries. However, bycatch of both these species is known to occur in some inshore static net fisheries as well and efforts could be made in collaboration with industry to devise suitable targeted mitigation approaches for those particular fisheries. For grey and common seals monitoring of fisheries’ interactions with this species should be continued.
Collaboration
One other important outcome from this exercise is that an improvement in com-munication of scientific and technical knowledge obtained by CEFAS and others in relation to the ecological effects of SW fisheries should be encouraged. Such an out-come would enable:
A better understanding of the mitigation measures that are already imple-mented in SW fisheries and their efficacy.
Priorities to be set for further investigations and actions concerning identified ecological risks. Such actions could include setting up task groups to tackle specific risks.
With this information, buyers will have greater knowledge of the ecological risks
associated with the fisheries in the SW region from which they source fish, and could potentially participate in further investigations and initiatives to mitigate such risks.
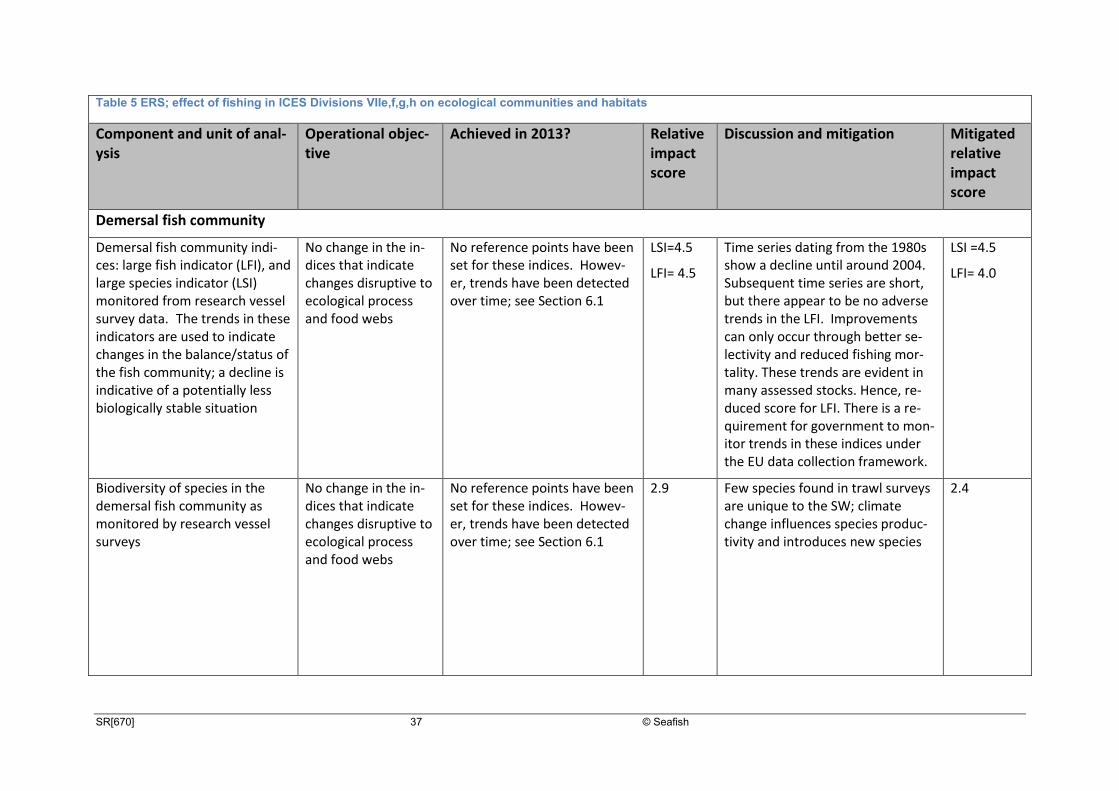
SR[670] 37 © Seafish
Table 5 ERS; effect of fishing in ICES Divisions VIIe,f,g,h on ecological communities and habitats
Component and unit of anal-ysis
Operational objec-tive
Achieved in 2013? Relative impact score
Discussion and mitigation Mitigated relative impact score
Demersal fish community
Demersal fish community indi-ces: large fish indicator (LFI), and large species indicator (LSI) monitored from research vessel survey data. The trends in these indicators are used to indicate changes in the balance/status of the fish community; a decline is indicative of a potentially less biologically stable situation
No change in the in-dices that indicate changes disruptive to ecological process and food webs
No reference points have been set for these indices. Howev-er, trends have been detected over time; see Section 6.1
LSI=4.5
LFI= 4.5
Time series dating from the 1980s show a decline until around 2004. Subsequent time series are short, but there appear to be no adverse trends in the LFI. Improvements can only occur through better se-lectivity and reduced fishing mor-tality. These trends are evident in many assessed stocks. Hence, re-duced score for LFI. There is a re-quirement for government to mon-itor trends in these indices under the EU data collection framework.
LSI =4.5
LFI= 4.0
Biodiversity of species in the demersal fish community as monitored by research vessel surveys
No change in the in-dices that indicate changes disruptive to ecological process and food webs
No reference points have been set for these indices. Howev-er, trends have been detected over time; see Section 6.1
2.9 Few species found in trawl surveys are unique to the SW; climate change influences species produc-tivity and introduces new species
2.4
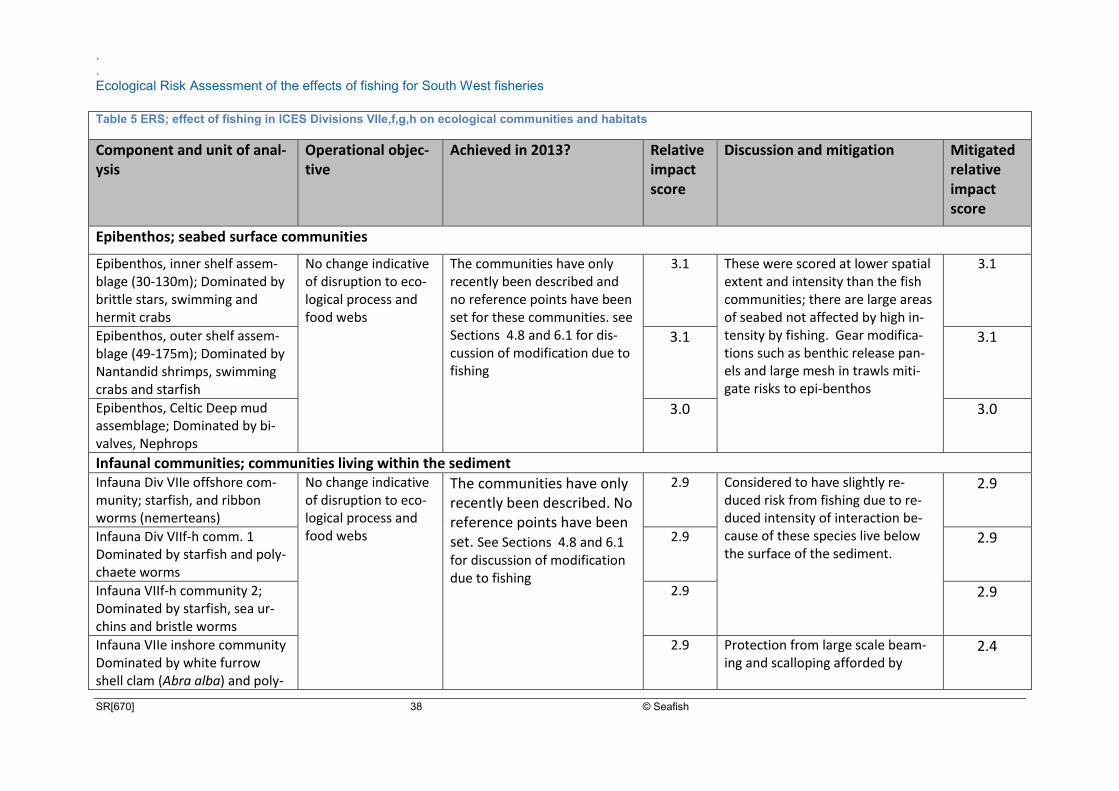
.
. Ecological Risk Assessment of the effects of fishing for South West fisheries
SR[670] 38 © Seafish
Table 5 ERS; effect of fishing in ICES Divisions VIIe,f,g,h on ecological communities and habitats
Component and unit of anal-ysis
Operational objec-tive
Achieved in 2013? Relative impact score
Discussion and mitigation Mitigated relative impact score
Epibenthos; seabed surface communities
Epibenthos, inner shelf assem-blage (30-130m); Dominated by brittle stars, swimming and hermit crabs
No change indicative of disruption to eco-logical process and food webs
The communities have only recently been described and no reference points have been set for these communities. see Sections 4.8 and 6.1 for dis-cussion of modification due to fishing
3.1 These were scored at lower spatial extent and intensity than the fish communities; there are large areas of seabed not affected by high in-tensity by fishing. Gear modifica-tions such as benthic release pan-els and large mesh in trawls miti-gate risks to epi-benthos
3.1
Epibenthos, outer shelf assem-blage (49-175m); Dominated by Nantandid shrimps, swimming crabs and starfish
3.1 3.1
Epibenthos, Celtic Deep mud assemblage; Dominated by bi-valves, Nephrops
3.0 3.0
Infaunal communities; communities living within the sediment Infauna Div VIIe offshore com-munity; starfish, and ribbon worms (nemerteans)
No change indicative of disruption to eco-logical process and food webs
The communities have only recently been described. No reference points have been set. See Sections 4.8 and 6.1 for discussion of modification due to fishing
2.9 Considered to have slightly re-duced risk from fishing due to re-duced intensity of interaction be-cause of these species live below the surface of the sediment.
2.9
Infauna Div VIIf-h comm. 1 Dominated by starfish and poly-chaete worms
2.9 2.9
Infauna VIIf-h community 2; Dominated by starfish, sea ur-chins and bristle worms
2.9 2.9
Infauna VIIe inshore community Dominated by white furrow shell clam (Abra alba) and poly-
2.9 Protection from large scale beam-ing and scalloping afforded by
2.4
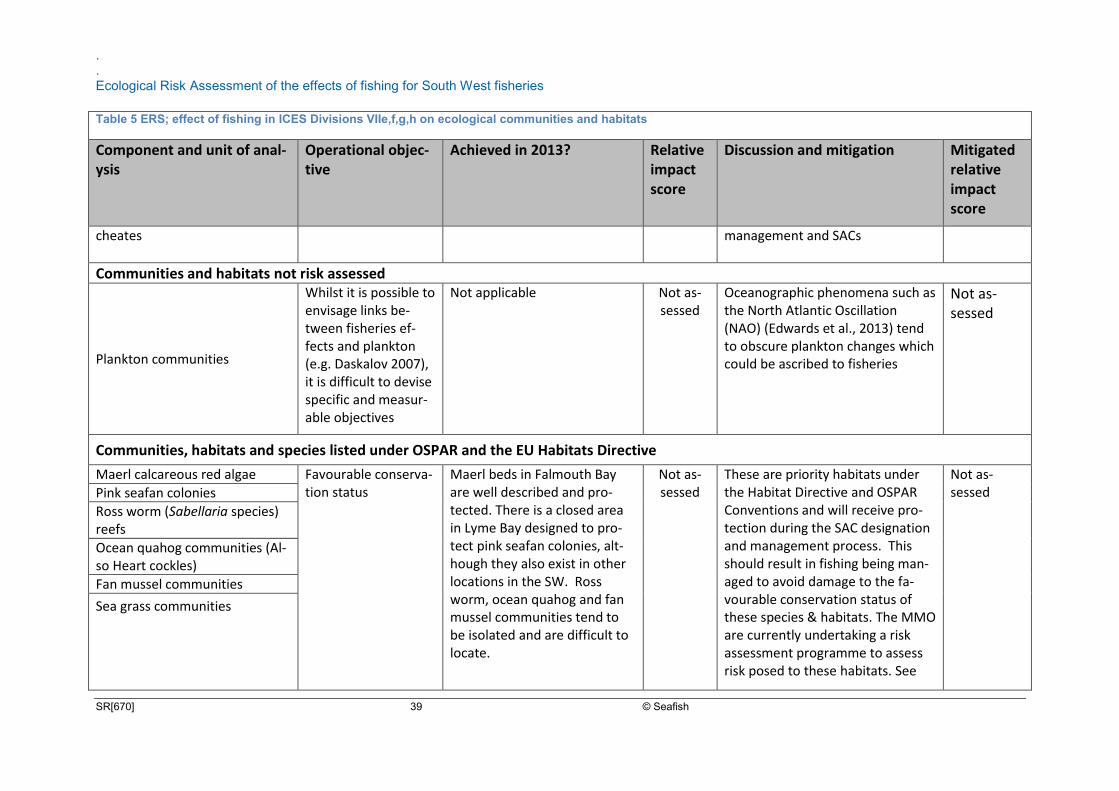
.
. Ecological Risk Assessment of the effects of fishing for South West fisheries
SR[670] 39 © Seafish
Table 5 ERS; effect of fishing in ICES Divisions VIIe,f,g,h on ecological communities and habitats
Component and unit of anal-ysis
Operational objec-tive
Achieved in 2013? Relative impact score
Discussion and mitigation Mitigated relative impact score
cheates management and SACs
Communities and habitats not risk assessed
Plankton communities
Whilst it is possible to envisage links be-tween fisheries ef-fects and plankton (e.g. Daskalov 2007), it is difficult to devise specific and measur-able objectives
Not applicable Not as-sessed
Oceanographic phenomena such as the North Atlantic Oscillation (NAO) (Edwards et al., 2013) tend to obscure plankton changes which could be ascribed to fisheries
Not as-sessed
Communities, habitats and species listed under OSPAR and the EU Habitats Directive
Maerl calcareous red algae Favourable conserva-tion status
Maerl beds in Falmouth Bay are well described and pro-tected. There is a closed area in Lyme Bay designed to pro-tect pink seafan colonies, alt-hough they also exist in other locations in the SW. Ross worm, ocean quahog and fan mussel communities tend to be isolated and are difficult to locate.
Not as-sessed
These are priority habitats under the Habitat Directive and OSPAR Conventions and will receive pro-tection during the SAC designation and management process. This should result in fishing being man-aged to avoid damage to the fa-vourable conservation status of these species & habitats. The MMO are currently undertaking a risk assessment programme to assess risk posed to these habitats. See
Not as-sessed
Pink seafan colonies
Ross worm (Sabellaria species) reefs
Ocean quahog communities (Al-so Heart cockles)
Fan mussel communities
Sea grass communities
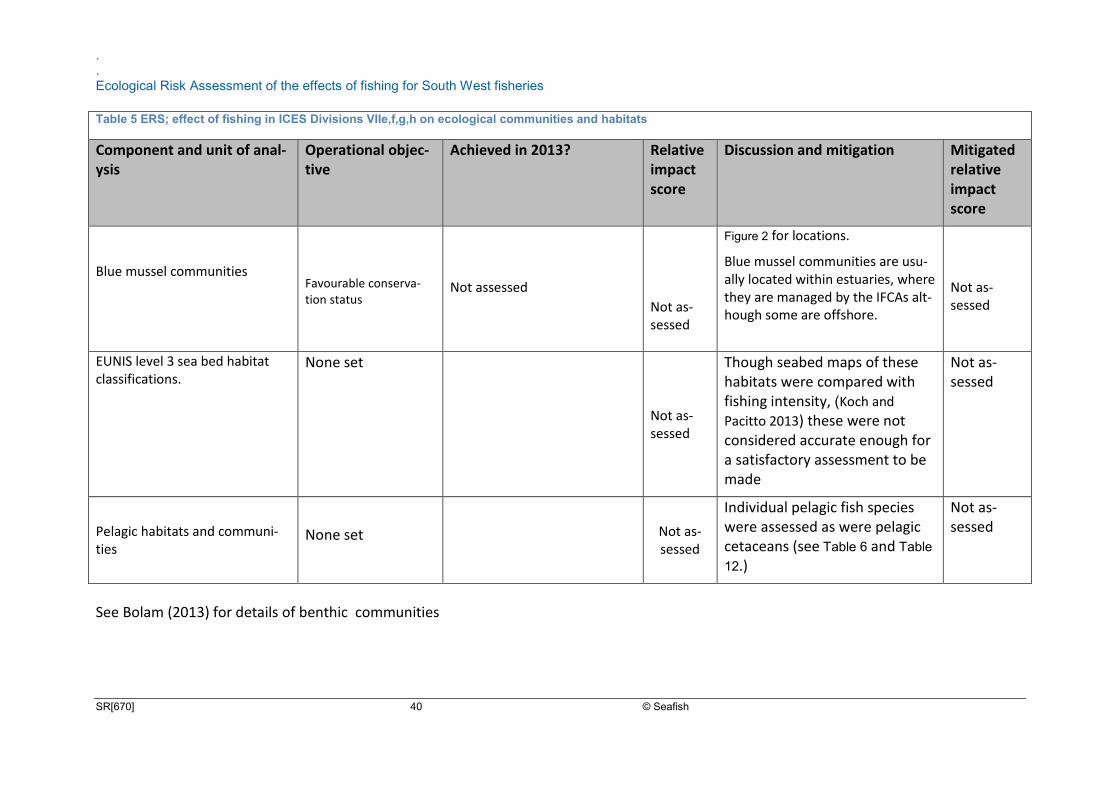
.
. Ecological Risk Assessment of the effects of fishing for South West fisheries
SR[670] 40 © Seafish
Table 5 ERS; effect of fishing in ICES Divisions VIIe,f,g,h on ecological communities and habitats
Component and unit of anal-ysis
Operational objec-tive
Achieved in 2013? Relative impact score
Discussion and mitigation Mitigated relative impact score
Blue mussel communities
Favourable conserva-tion status
Not assessed
Not as-sessed
Figure 2 for locations.
Blue mussel communities are usu-ally located within estuaries, where they are managed by the IFCAs alt-hough some are offshore.
Not as-sessed
EUNIS level 3 sea bed habitat classifications.
None set
Not as-sessed
Though seabed maps of these habitats were compared with fishing intensity, (Koch and
Pacitto 2013) these were not considered accurate enough for a satisfactory assessment to be made
Not as-sessed
Pelagic habitats and communi-ties
None set
Not as-sessed
Individual pelagic fish species were assessed as were pelagic cetaceans (see Table 6 and Table
12.)
Not as-sessed
See Bolam (2013) for details of benthic communities
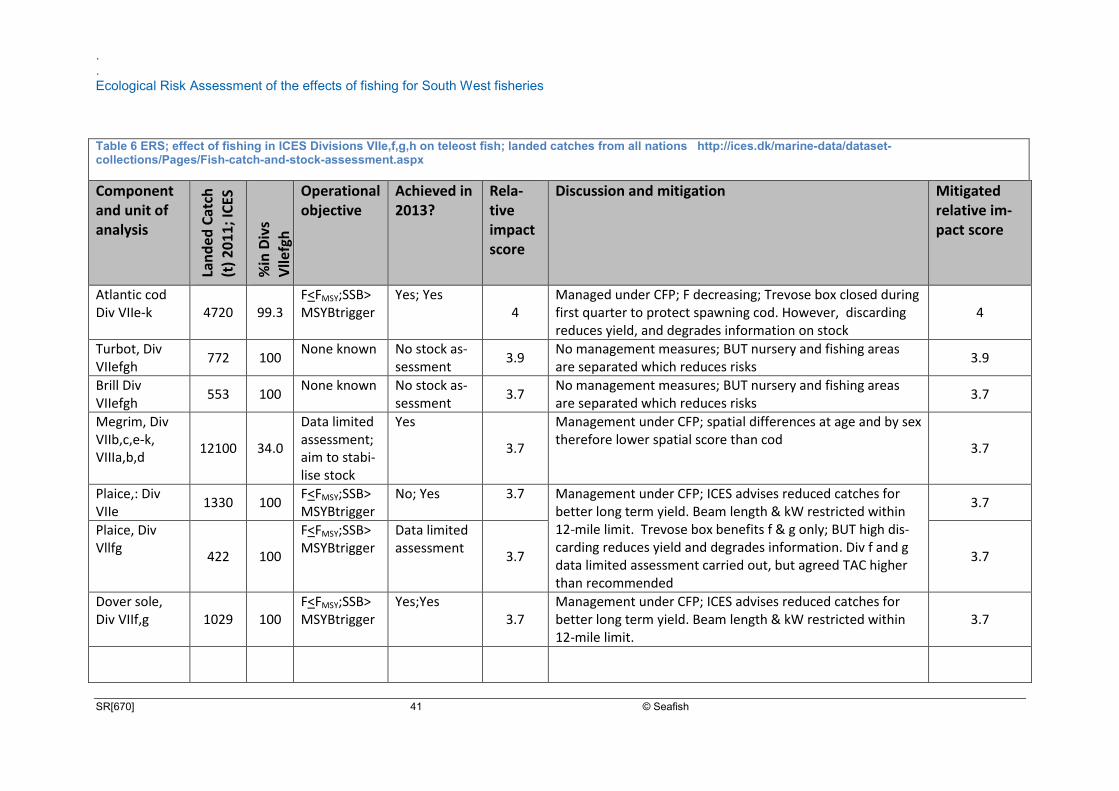
.
. Ecological Risk Assessment of the effects of fishing for South West fisheries
SR[670] 41 © Seafish
Table 6 ERS; effect of fishing in ICES Divisions VIIe,f,g,h on teleost fish; landed catches from all nations http://ices.dk/marine-data/dataset-collections/Pages/Fish-catch-and-stock-assessment.aspx
Component and unit of analysis
Lan
de
d C
atch
(t)
20
11; I
CES
%in
Div
s V
llefg
h
Operational objective
Achieved in 2013?
Rela-tive impact score
Discussion and mitigation Mitigated relative im-pact score
Atlantic cod Div VIIe-k 4720 99.3
F<FMSY;SSB>MSYBtrigger
Yes; Yes 4
Managed under CFP; F decreasing; Trevose box closed during first quarter to protect spawning cod. However, discarding reduces yield, and degrades information on stock
4
Turbot, Div VIIefgh
772 100 None known No stock as-
sessment 3.9
No management measures; BUT nursery and fishing areas are separated which reduces risks
3.9
Brill Div VIIefgh
553 100 None known No stock as-
sessment 3.7
No management measures; BUT nursery and fishing areas are separated which reduces risks
3.7
Megrim, Div VIIb,c,e-k, VIIIa,b,d
12100 34.0
Data limited assessment; aim to stabi-lise stock
Yes
3.7
Management under CFP; spatial differences at age and by sex therefore lower spatial score than cod
3.7
Plaice,: Div VIIe
1330 100 F<FMSY;SSB>MSYBtrigger
No; Yes 3.7 Management under CFP; ICES advises reduced catches for better long term yield. Beam length & kW restricted within 12-mile limit. Trevose box benefits f & g only; BUT high dis-carding reduces yield and degrades information. Div f and g data limited assessment carried out, but agreed TAC higher than recommended
3.7
Plaice, Div Vllfg
422 100
F<FMSY;SSB>MSYBtrigger
Data limited assessment
3.7 3.7
Dover sole, Div VIIf,g 1029 100
F<FMSY;SSB>MSYBtrigger
Yes;Yes 3.7
Management under CFP; ICES advises reduced catches for better long term yield. Beam length & kW restricted within 12-mile limit.
3.7
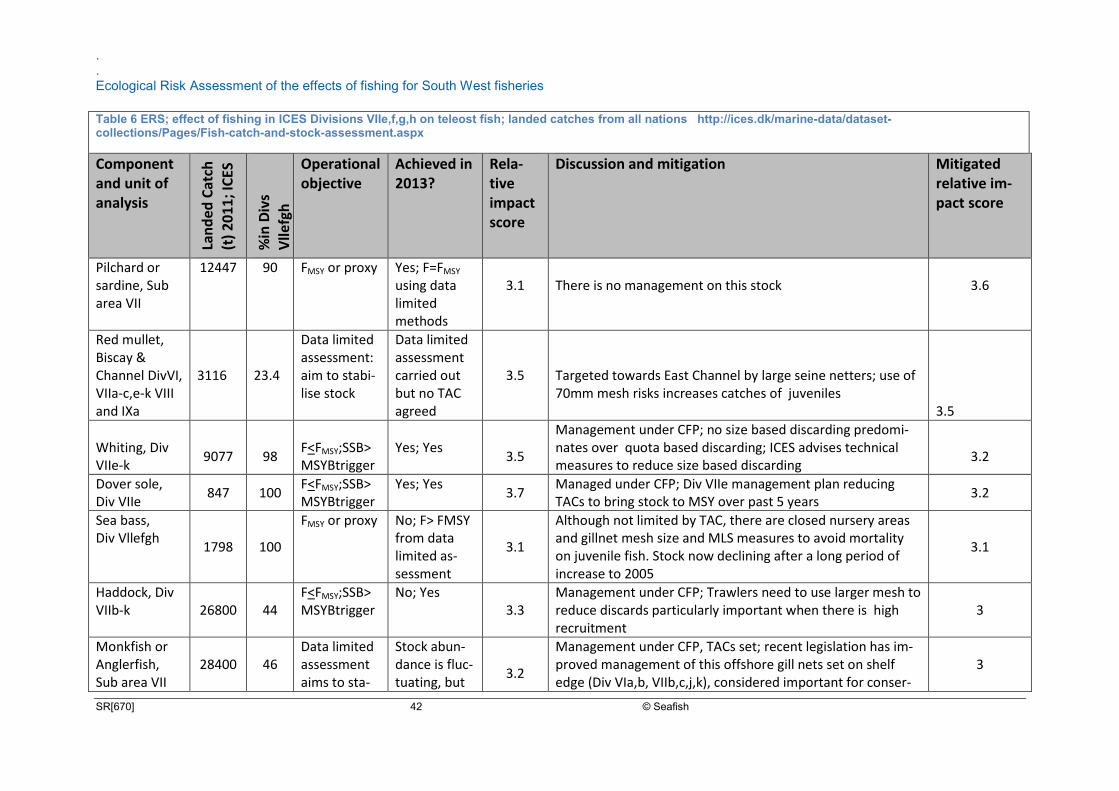
.
. Ecological Risk Assessment of the effects of fishing for South West fisheries
SR[670] 42 © Seafish
Table 6 ERS; effect of fishing in ICES Divisions VIIe,f,g,h on teleost fish; landed catches from all nations http://ices.dk/marine-data/dataset-collections/Pages/Fish-catch-and-stock-assessment.aspx
Component and unit of analysis
Lan
de
d C
atch
(t)
20
11; I
CES
%in
Div
s V
llefg
h
Operational objective
Achieved in 2013?
Rela-tive impact score
Discussion and mitigation Mitigated relative im-pact score
Pilchard or sardine, Sub area VII
12447 90 FMSY or proxy Yes; F=FMSY using data limited methods
3.1
There is no management on this stock
3.6
Red mullet, Biscay & Channel DivVI, VIIa-c,e-k VIII and IXa
3116 23.4
Data limited assessment: aim to stabi-lise stock
Data limited assessment carried out but no TAC agreed
3.5
Targeted towards East Channel by large seine netters; use of 70mm mesh risks increases catches of juveniles
3.5
Whiting, Div VIIe-k
9077
98
F<FMSY;SSB>MSYBtrigger
Yes; Yes
3.5
Management under CFP; no size based discarding predomi-nates over quota based discarding; ICES advises technical measures to reduce size based discarding
3.2
Dover sole, Div VIIe
847 100 F<FMSY;SSB>MSYBtrigger
Yes; Yes 3.7
Managed under CFP; Div VIIe management plan reducing TACs to bring stock to MSY over past 5 years
3.2
Sea bass, Div Vllefgh
1798
100
FMSY or proxy
No; F> FMSY from data limited as-sessment
3.1
Although not limited by TAC, there are closed nursery areas and gillnet mesh size and MLS measures to avoid mortality on juvenile fish. Stock now declining after a long period of increase to 2005
3.1
Haddock, Div VIIb-k 26800 44
F<FMSY;SSB>MSYBtrigger
No; Yes 3.3
Management under CFP; Trawlers need to use larger mesh to reduce discards particularly important when there is high recruitment
3
Monkfish or Anglerfish, Sub area VII
28400 46 Data limited assessment aims to sta-
Stock abun-dance is fluc-tuating, but
3.2
Management under CFP, TACs set; recent legislation has im-proved management of this offshore gill nets set on shelf edge (Div VIa,b, VIIb,c,j,k), considered important for conser-
3
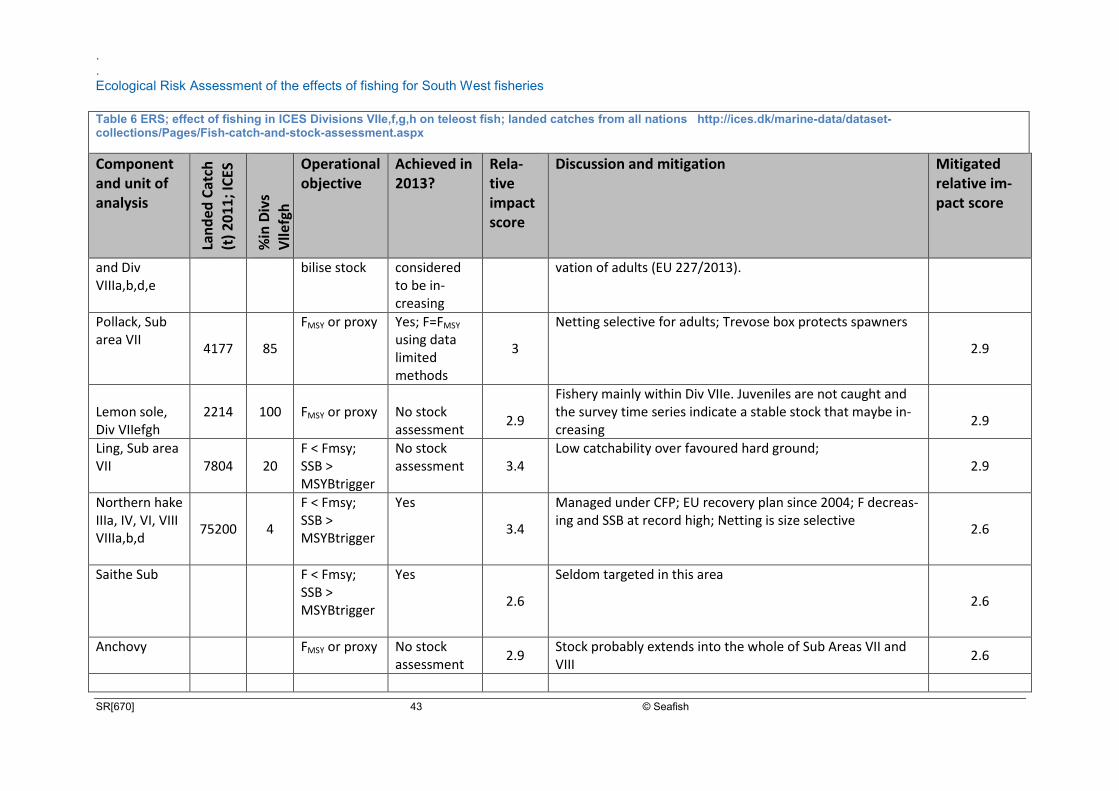
.
. Ecological Risk Assessment of the effects of fishing for South West fisheries
SR[670] 43 © Seafish
Table 6 ERS; effect of fishing in ICES Divisions VIIe,f,g,h on teleost fish; landed catches from all nations http://ices.dk/marine-data/dataset-collections/Pages/Fish-catch-and-stock-assessment.aspx
Component and unit of analysis
Lan
de
d C
atch
(t)
20
11; I
CES
%in
Div
s V
llefg
h
Operational objective
Achieved in 2013?
Rela-tive impact score
Discussion and mitigation Mitigated relative im-pact score
and Div VIIIa,b,d,e
bilise stock considered to be in-creasing
vation of adults (EU 227/2013).
Pollack, Sub area VII
4177 85
FMSY or proxy Yes; F=FMSY using data limited methods
3
Netting selective for adults; Trevose box protects spawners
2.9
Lemon sole, Div VIIefgh
2214 100 FMSY or proxy
No stock assessment
2.9
Fishery mainly within Div VIIe. Juveniles are not caught and the survey time series indicate a stable stock that maybe in-creasing
2.9
Ling, Sub area VII 7804 20
F < Fmsy; SSB > MSYBtrigger
No stock assessment 3.4
Low catchability over favoured hard ground; 2.9
Northern hake IIIa, IV, VI, VIII VIIIa,b,d
75200 4
F < Fmsy; SSB > MSYBtrigger
Yes
3.4
Managed under CFP; EU recovery plan since 2004; F decreas-ing and SSB at record high; Netting is size selective
2.6
Saithe Sub
F < Fmsy; SSB > MSYBtrigger
Yes
2.6
Seldom targeted in this area
2.6
Anchovy
FMSY or proxy No stock assessment
2.9 Stock probably extends into the whole of Sub Areas VII and VIII
2.6
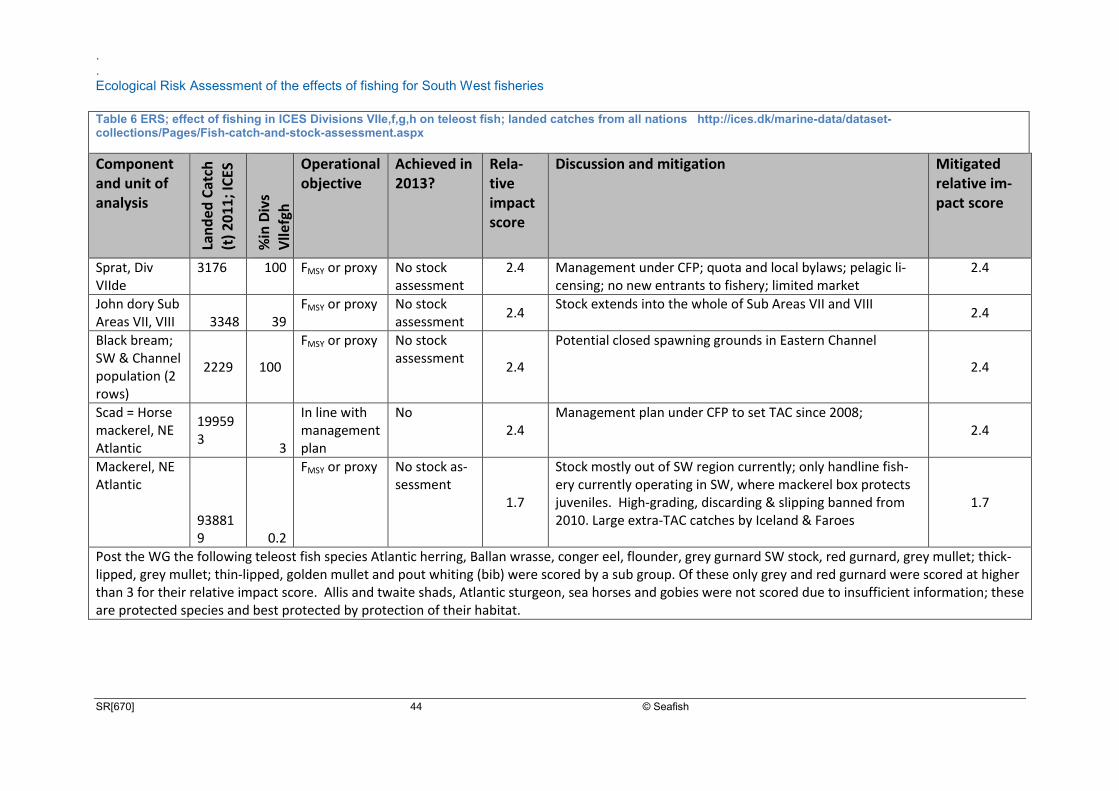
.
. Ecological Risk Assessment of the effects of fishing for South West fisheries
SR[670] 44 © Seafish
Table 6 ERS; effect of fishing in ICES Divisions VIIe,f,g,h on teleost fish; landed catches from all nations http://ices.dk/marine-data/dataset-collections/Pages/Fish-catch-and-stock-assessment.aspx
Component and unit of analysis
Lan
de
d C
atch
(t)
20
11; I
CES
%in
Div
s V
llefg
h
Operational objective
Achieved in 2013?
Rela-tive impact score
Discussion and mitigation Mitigated relative im-pact score
Sprat, Div VIIde
3176 100 FMSY or proxy No stock assessment
2.4 Management under CFP; quota and local bylaws; pelagic li-censing; no new entrants to fishery; limited market
2.4
John dory Sub Areas VII, VIII 3348 39
FMSY or proxy No stock assessment
2.4 Stock extends into the whole of Sub Areas VII and VIII
2.4
Black bream; SW & Channel population (2 rows)
2229 100
FMSY or proxy No stock assessment
2.4
Potential closed spawning grounds in Eastern Channel
2.4
Scad = Horse mackerel, NE Atlantic
199593
3
In line with management plan
No 2.4
Management plan under CFP to set TAC since 2008; 2.4
Mackerel, NE Atlantic
938819 0.2
FMSY or proxy No stock as-sessment
1.7
Stock mostly out of SW region currently; only handline fish-ery currently operating in SW, where mackerel box protects juveniles. High-grading, discarding & slipping banned from 2010. Large extra-TAC catches by Iceland & Faroes
1.7
Post the WG the following teleost fish species Atlantic herring, Ballan wrasse, conger eel, flounder, grey gurnard SW stock, red gurnard, grey mullet; thick-lipped, grey mullet; thin-lipped, golden mullet and pout whiting (bib) were scored by a sub group. Of these only grey and red gurnard were scored at higher than 3 for their relative impact score. Allis and twaite shads, Atlantic sturgeon, sea horses and gobies were not scored due to insufficient information; these are protected species and best protected by protection of their habitat.
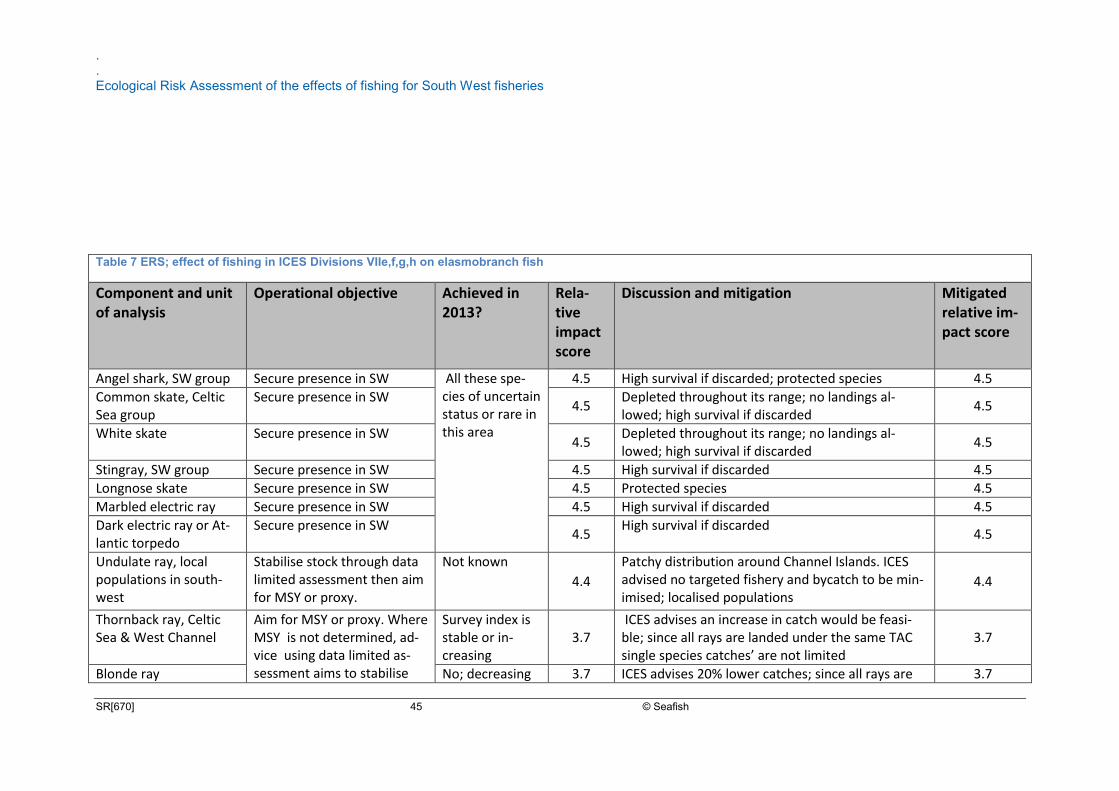
.
. Ecological Risk Assessment of the effects of fishing for South West fisheries
SR[670] 45 © Seafish
Table 7 ERS; effect of fishing in ICES Divisions VIIe,f,g,h on elasmobranch fish
Component and unit of analysis
Operational objective Achieved in 2013?
Rela-tive impact score
Discussion and mitigation Mitigated relative im-pact score
Angel shark, SW group Secure presence in SW All these spe-cies of uncertain status or rare in this area
4.5 High survival if discarded; protected species 4.5
Common skate, Celtic Sea group
Secure presence in SW 4.5
Depleted throughout its range; no landings al-lowed; high survival if discarded
4.5
White skate Secure presence in SW 4.5
Depleted throughout its range; no landings al-lowed; high survival if discarded
4.5
Stingray, SW group Secure presence in SW 4.5 High survival if discarded 4.5
Longnose skate Secure presence in SW 4.5 Protected species 4.5
Marbled electric ray Secure presence in SW 4.5 High survival if discarded 4.5
Dark electric ray or At-lantic torpedo
Secure presence in SW 4.5
High survival if discarded 4.5
Undulate ray, local populations in south-west
Stabilise stock through data limited assessment then aim for MSY or proxy.
Not known
4.4
Patchy distribution around Channel Islands. ICES advised no targeted fishery and bycatch to be min-imised; localised populations
4.4
Thornback ray, Celtic Sea & West Channel
Aim for MSY or proxy. Where MSY is not determined, ad-vice using data limited as-sessment aims to stabilise
Survey index is stable or in-creasing
3.7 ICES advises an increase in catch would be feasi-ble; since all rays are landed under the same TAC single species catches’ are not limited
3.7
Blonde ray No; decreasing 3.7 ICES advises 20% lower catches; since all rays are 3.7
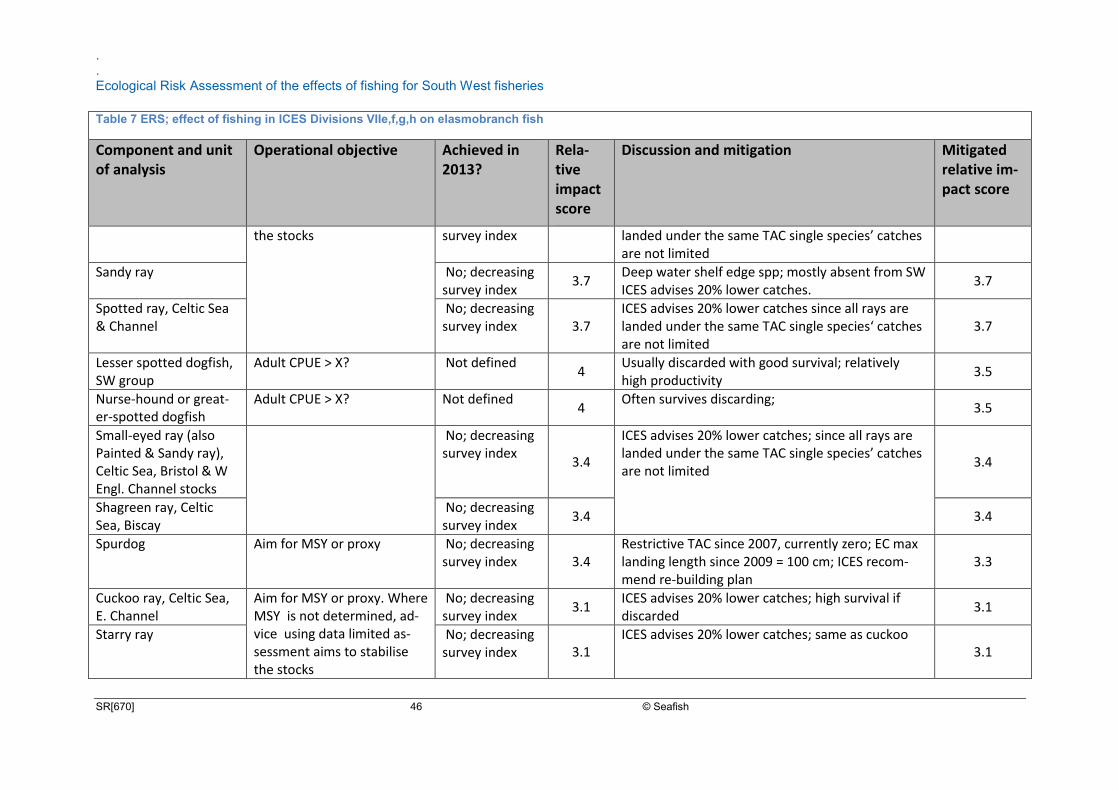
.
. Ecological Risk Assessment of the effects of fishing for South West fisheries
SR[670] 46 © Seafish
Table 7 ERS; effect of fishing in ICES Divisions VIIe,f,g,h on elasmobranch fish
Component and unit of analysis
Operational objective Achieved in 2013?
Rela-tive impact score
Discussion and mitigation Mitigated relative im-pact score
the stocks
survey index landed under the same TAC single species’ catches are not limited
Sandy ray No; decreasing survey index
3.7 Deep water shelf edge spp; mostly absent from SW ICES advises 20% lower catches.
3.7
Spotted ray, Celtic Sea & Channel
No; decreasing survey index 3.7
ICES advises 20% lower catches since all rays are landed under the same TAC single species‘ catches are not limited
3.7
Lesser spotted dogfish, SW group
Adult CPUE > X? Not defined 4
Usually discarded with good survival; relatively high productivity
3.5
Nurse-hound or great-er-spotted dogfish
Adult CPUE > X? Not defined 4
Often survives discarding; 3.5
Small-eyed ray (also Painted & Sandy ray), Celtic Sea, Bristol & W Engl. Channel stocks
No; decreasing survey index
3.4
ICES advises 20% lower catches; since all rays are landed under the same TAC single species’ catches are not limited
3.4
Shagreen ray, Celtic Sea, Biscay
No; decreasing survey index
3.4 3.4
Spurdog Aim for MSY or proxy No; decreasing survey index 3.4
Restrictive TAC since 2007, currently zero; EC max landing length since 2009 = 100 cm; ICES recom-mend re-building plan
3.3
Cuckoo ray, Celtic Sea, E. Channel
Aim for MSY or proxy. Where MSY is not determined, ad-vice using data limited as-sessment aims to stabilise the stocks
No; decreasing survey index
3.1 ICES advises 20% lower catches; high survival if discarded
3.1
Starry ray No; decreasing survey index 3.1
ICES advises 20% lower catches; same as cuckoo 3.1
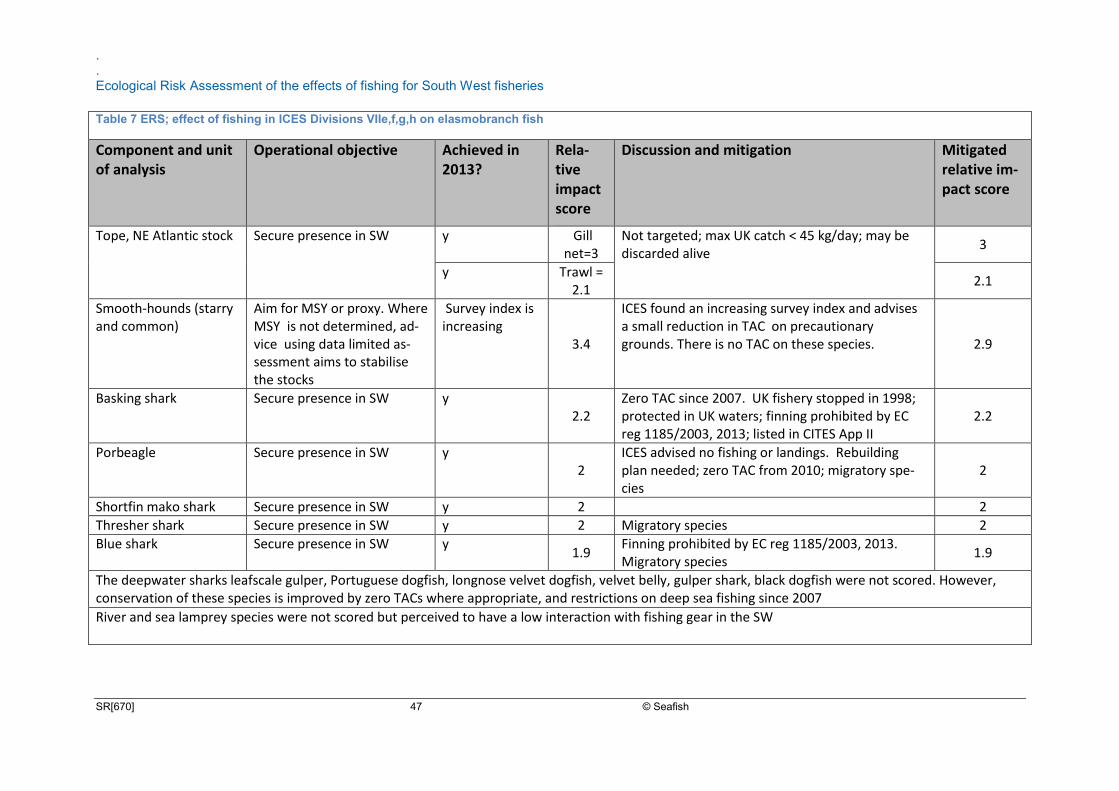
.
. Ecological Risk Assessment of the effects of fishing for South West fisheries
SR[670] 47 © Seafish
Table 7 ERS; effect of fishing in ICES Divisions VIIe,f,g,h on elasmobranch fish
Component and unit of analysis
Operational objective Achieved in 2013?
Rela-tive impact score
Discussion and mitigation Mitigated relative im-pact score
Tope, NE Atlantic stock Secure presence in SW y Gill net=3
Not targeted; max UK catch < 45 kg/day; may be discarded alive
3
y Trawl = 2.1
2.1
Smooth-hounds (starry and common)
Aim for MSY or proxy. Where MSY is not determined, ad-vice using data limited as-sessment aims to stabilise the stocks
Survey index is increasing
3.4
ICES found an increasing survey index and advises a small reduction in TAC on precautionary grounds. There is no TAC on these species. 2.9
Basking shark Secure presence in SW y 2.2
Zero TAC since 2007. UK fishery stopped in 1998; protected in UK waters; finning prohibited by EC reg 1185/2003, 2013; listed in CITES App II
2.2
Porbeagle Secure presence in SW y 2
ICES advised no fishing or landings. Rebuilding plan needed; zero TAC from 2010; migratory spe-cies
2
Shortfin mako shark Secure presence in SW y 2 2
Thresher shark Secure presence in SW y 2 Migratory species 2
Blue shark Secure presence in SW y 1.9
Finning prohibited by EC reg 1185/2003, 2013. Migratory species
1.9
The deepwater sharks leafscale gulper, Portuguese dogfish, longnose velvet dogfish, velvet belly, gulper shark, black dogfish were not scored. However, conservation of these species is improved by zero TACs where appropriate, and restrictions on deep sea fishing since 2007
River and sea lamprey species were not scored but perceived to have a low interaction with fishing gear in the SW
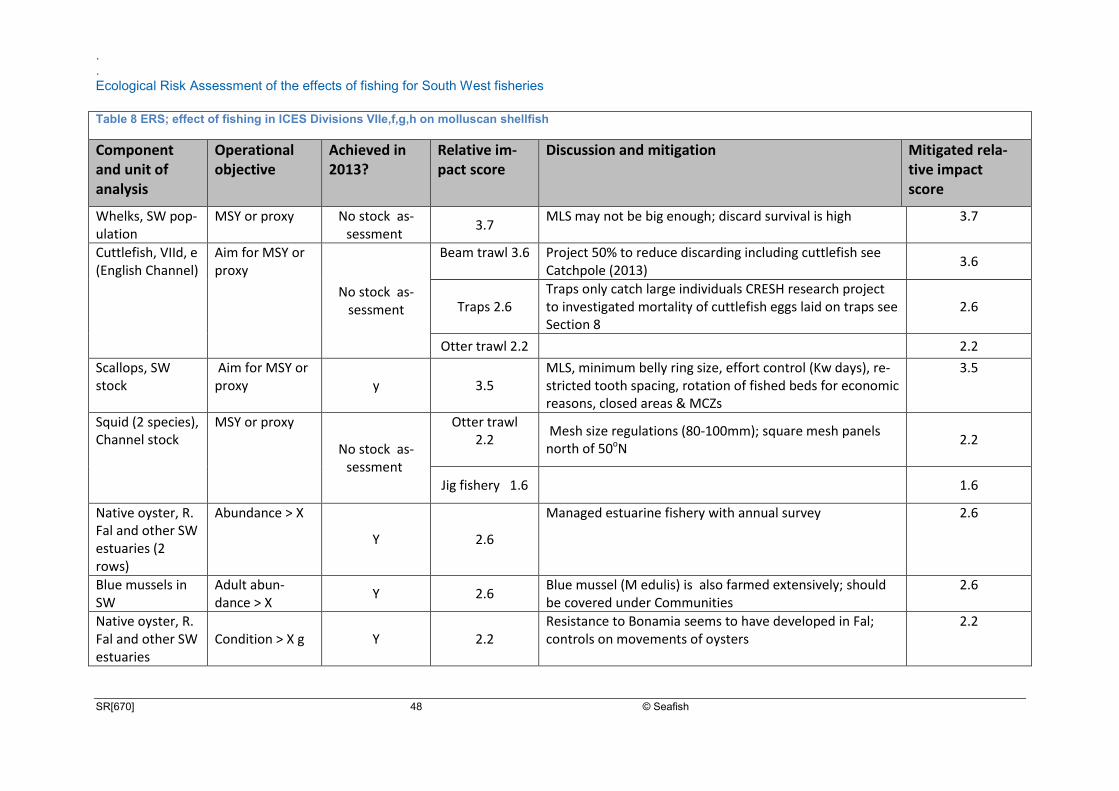
.
. Ecological Risk Assessment of the effects of fishing for South West fisheries
SR[670] 48 © Seafish
Table 8 ERS; effect of fishing in ICES Divisions VIIe,f,g,h on molluscan shellfish
Component and unit of analysis
Operational objective
Achieved in 2013?
Relative im-pact score
Discussion and mitigation Mitigated rela-tive impact score
Whelks, SW pop-ulation
MSY or proxy No stock as-sessment
3.7 MLS may not be big enough; discard survival is high 3.7
Cuttlefish, VIId, e (English Channel)
Aim for MSY or proxy
No stock as-sessment
Beam trawl 3.6
Project 50% to reduce discarding including cuttlefish see Catchpole (2013)
3.6
Traps 2.6 Traps only catch large individuals CRESH research project to investigated mortality of cuttlefish eggs laid on traps see Section 8
2.6
Otter trawl 2.2 2.2
Scallops, SW stock
Aim for MSY or proxy y 3.5
MLS, minimum belly ring size, effort control (Kw days), re-stricted tooth spacing, rotation of fished beds for economic reasons, closed areas & MCZs
3.5
Squid (2 species), Channel stock
MSY or proxy
No stock as-sessment
Otter trawl 2.2
Mesh size regulations (80-100mm); square mesh panels north of 50oN
2.2
Jig fishery 1.6 1.6
Native oyster, R. Fal and other SW estuaries (2 rows)
Abundance > X
Y 2.6
Managed estuarine fishery with annual survey 2.6
Blue mussels in SW
Adult abun-dance > X
Y 2.6 Blue mussel (M edulis) is also farmed extensively; should be covered under Communities
2.6
Native oyster, R. Fal and other SW estuaries
Condition > X g Y 2.2
Resistance to Bonamia seems to have developed in Fal; controls on movements of oysters
2.2
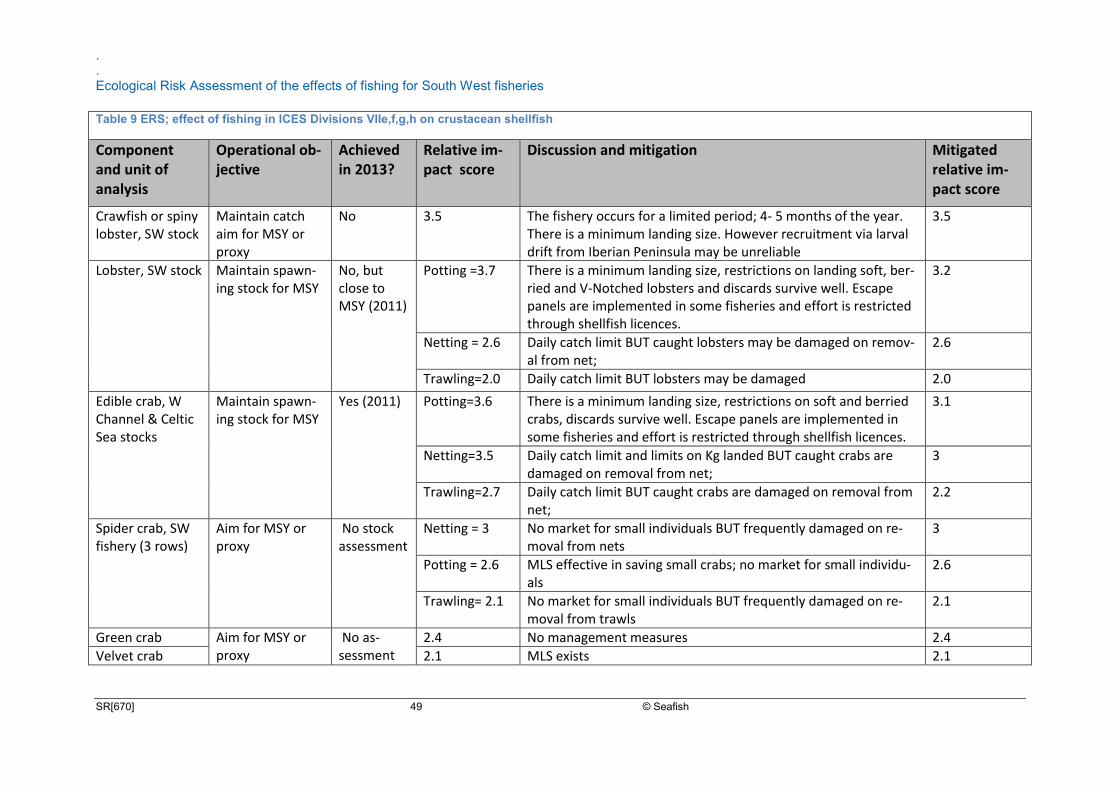
.
. Ecological Risk Assessment of the effects of fishing for South West fisheries
SR[670] 49 © Seafish
Table 9 ERS; effect of fishing in ICES Divisions VIIe,f,g,h on crustacean shellfish
Component and unit of analysis
Operational ob-jective
Achieved in 2013?
Relative im-pact score
Discussion and mitigation Mitigated relative im-pact score
Crawfish or spiny lobster, SW stock
Maintain catch aim for MSY or proxy
No 3.5 The fishery occurs for a limited period; 4- 5 months of the year. There is a minimum landing size. However recruitment via larval drift from Iberian Peninsula may be unreliable
3.5
Lobster, SW stock Maintain spawn-ing stock for MSY
No, but close to MSY (2011)
Potting =3.7
There is a minimum landing size, restrictions on landing soft, ber-ried and V-Notched lobsters and discards survive well. Escape panels are implemented in some fisheries and effort is restricted through shellfish licences.
3.2
Netting = 2.6 Daily catch limit BUT caught lobsters may be damaged on remov-al from net;
2.6
Trawling=2.0 Daily catch limit BUT lobsters may be damaged 2.0
Edible crab, W Channel & Celtic Sea stocks
Maintain spawn-ing stock for MSY
Yes (2011) Potting=3.6 There is a minimum landing size, restrictions on soft and berried crabs, discards survive well. Escape panels are implemented in some fisheries and effort is restricted through shellfish licences.
3.1
Netting=3.5 Daily catch limit and limits on Kg landed BUT caught crabs are damaged on removal from net;
3
Trawling=2.7 Daily catch limit BUT caught crabs are damaged on removal from net;
2.2
Spider crab, SW fishery (3 rows)
Aim for MSY or proxy
No stock assessment
Netting = 3 No market for small individuals BUT frequently damaged on re-moval from nets
3
Potting = 2.6 MLS effective in saving small crabs; no market for small individu-als
2.6
Trawling= 2.1 No market for small individuals BUT frequently damaged on re-moval from trawls
2.1
Green crab Aim for MSY or proxy
No as-sessment
2.4 No management measures 2.4
Velvet crab 2.1 MLS exists 2.1
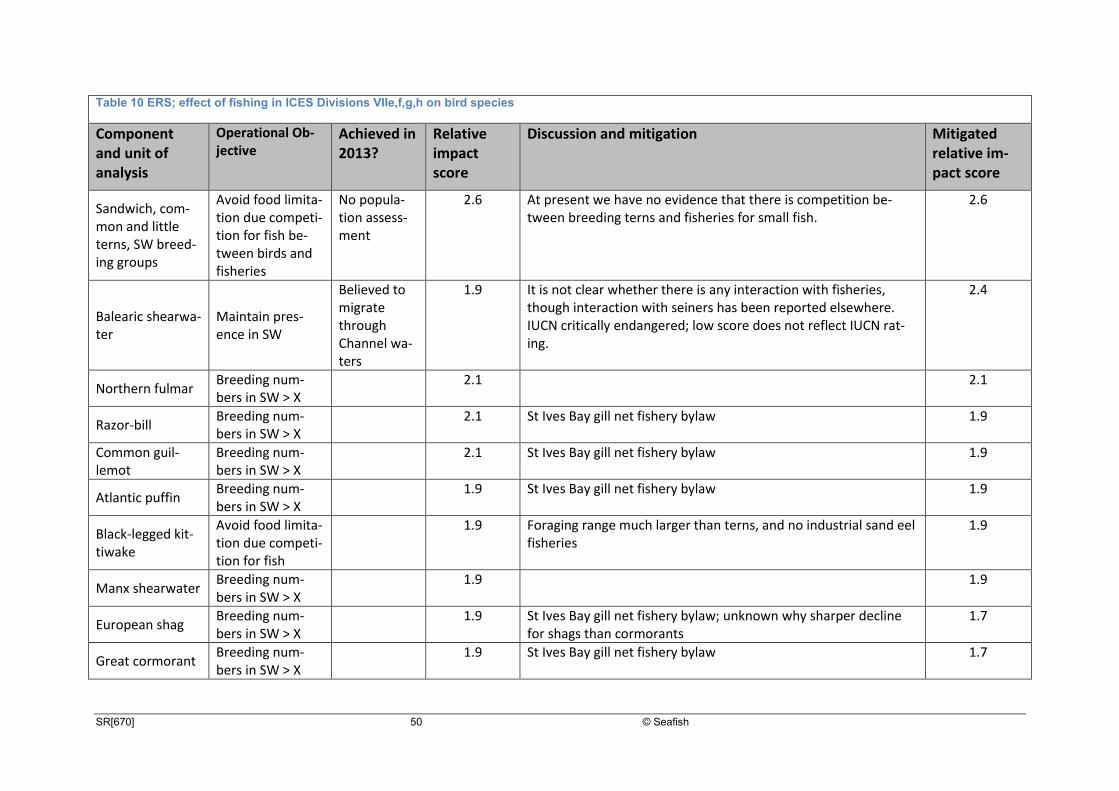
SR[670] 50 © Seafish
Table 10 ERS; effect of fishing in ICES Divisions VIIe,f,g,h on bird species
Component and unit of analysis
Operational Ob-jective
Achieved in 2013?
Relative impact score
Discussion and mitigation Mitigated relative im-pact score
Sandwich, com-mon and little terns, SW breed-ing groups
Avoid food limita-tion due competi-tion for fish be-tween birds and fisheries
No popula-tion assess-ment
2.6 At present we have no evidence that there is competition be-tween breeding terns and fisheries for small fish.
2.6
Balearic shearwa-ter
Maintain pres-ence in SW
Believed to migrate through Channel wa-ters
1.9 It is not clear whether there is any interaction with fisheries, though interaction with seiners has been reported elsewhere. IUCN critically endangered; low score does not reflect IUCN rat-ing.
2.4
Northern fulmar Breeding num-bers in SW > X
2.1 2.1
Razor-bill Breeding num-bers in SW > X
2.1 St Ives Bay gill net fishery bylaw 1.9
Common guil-lemot
Breeding num-bers in SW > X
2.1 St Ives Bay gill net fishery bylaw 1.9
Atlantic puffin Breeding num-bers in SW > X
1.9 St Ives Bay gill net fishery bylaw 1.9
Black-legged kit-tiwake
Avoid food limita-tion due competi-tion for fish
1.9 Foraging range much larger than terns, and no industrial sand eel fisheries
1.9
Manx shearwater Breeding num-bers in SW > X
1.9 1.9
European shag Breeding num-bers in SW > X
1.9 St Ives Bay gill net fishery bylaw; unknown why sharper decline for shags than cormorants
1.7
Great cormorant Breeding num-bers in SW > X
1.9 St Ives Bay gill net fishery bylaw 1.7
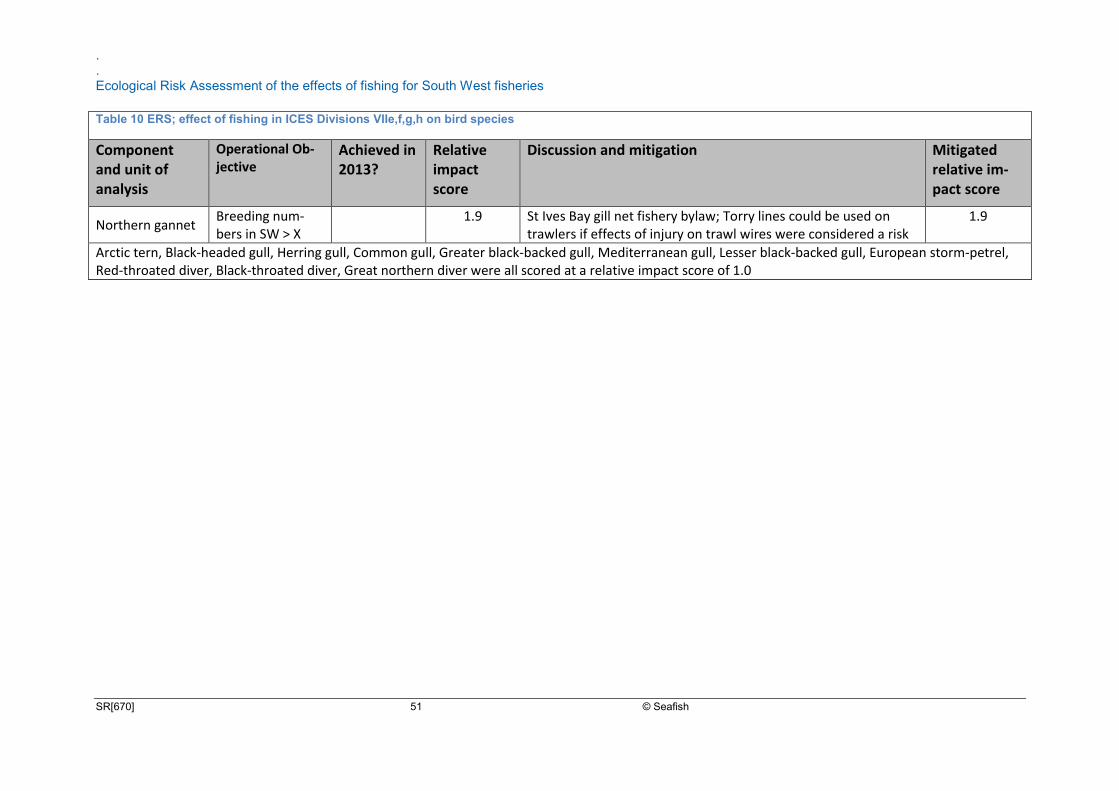
.
. Ecological Risk Assessment of the effects of fishing for South West fisheries
SR[670] 51 © Seafish
Table 10 ERS; effect of fishing in ICES Divisions VIIe,f,g,h on bird species
Component and unit of analysis
Operational Ob-jective
Achieved in 2013?
Relative impact score
Discussion and mitigation Mitigated relative im-pact score
Northern gannet Breeding num-bers in SW > X
1.9 St Ives Bay gill net fishery bylaw; Torry lines could be used on trawlers if effects of injury on trawl wires were considered a risk
1.9
Arctic tern, Black-headed gull, Herring gull, Common gull, Greater black-backed gull, Mediterranean gull, Lesser black-backed gull, European storm-petrel, Red-throated diver, Black-throated diver, Great northern diver were all scored at a relative impact score of 1.0
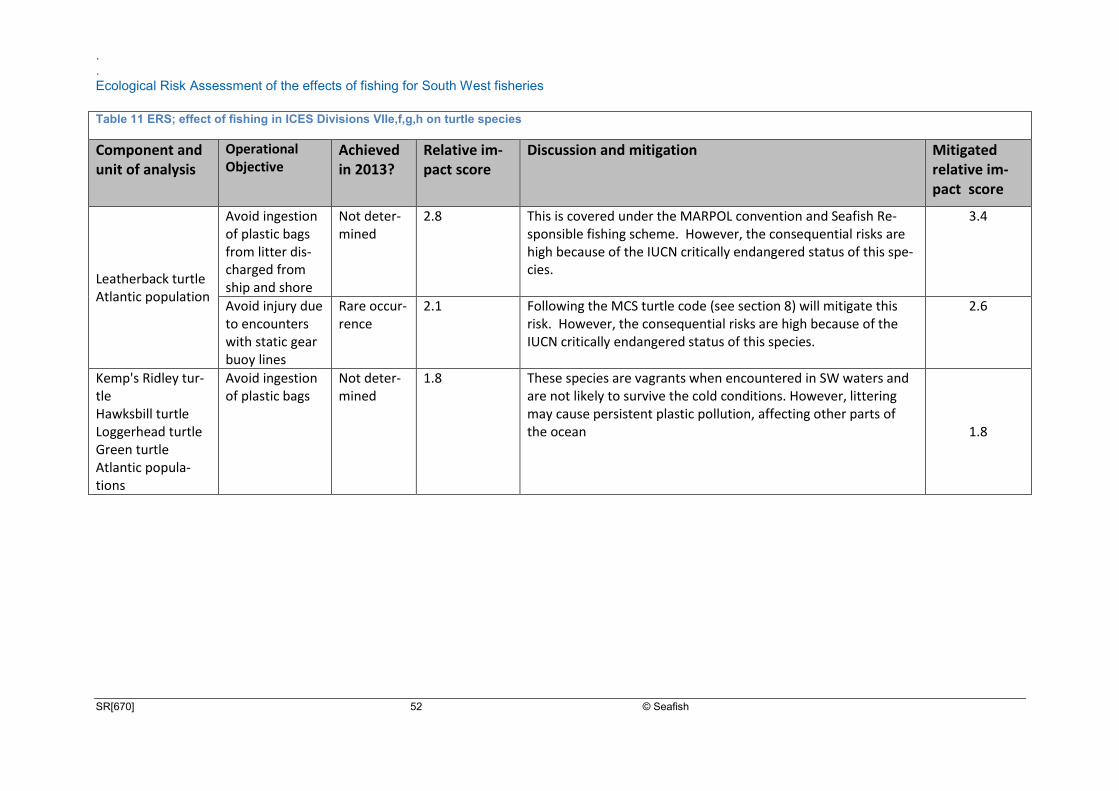
.
. Ecological Risk Assessment of the effects of fishing for South West fisheries
SR[670] 52 © Seafish
Table 11 ERS; effect of fishing in ICES Divisions VIIe,f,g,h on turtle species
Component and unit of analysis
Operational Objective
Achieved in 2013?
Relative im-pact score
Discussion and mitigation Mitigated relative im-pact score
Leatherback turtle Atlantic population
Avoid ingestion of plastic bags from litter dis-charged from ship and shore
Not deter-mined
2.8 This is covered under the MARPOL convention and Seafish Re-sponsible fishing scheme. However, the consequential risks are high because of the IUCN critically endangered status of this spe-cies.
3.4
Avoid injury due to encounters with static gear buoy lines
Rare occur-rence
2.1 Following the MCS turtle code (see section 8) will mitigate this risk. However, the consequential risks are high because of the IUCN critically endangered status of this species.
2.6
Kemp's Ridley tur-tle Hawksbill turtle Loggerhead turtle Green turtle Atlantic popula-tions
Avoid ingestion of plastic bags
Not deter-mined
1.8 These species are vagrants when encountered in SW waters and are not likely to survive the cold conditions. However, littering may cause persistent plastic pollution, affecting other parts of the ocean 1.8
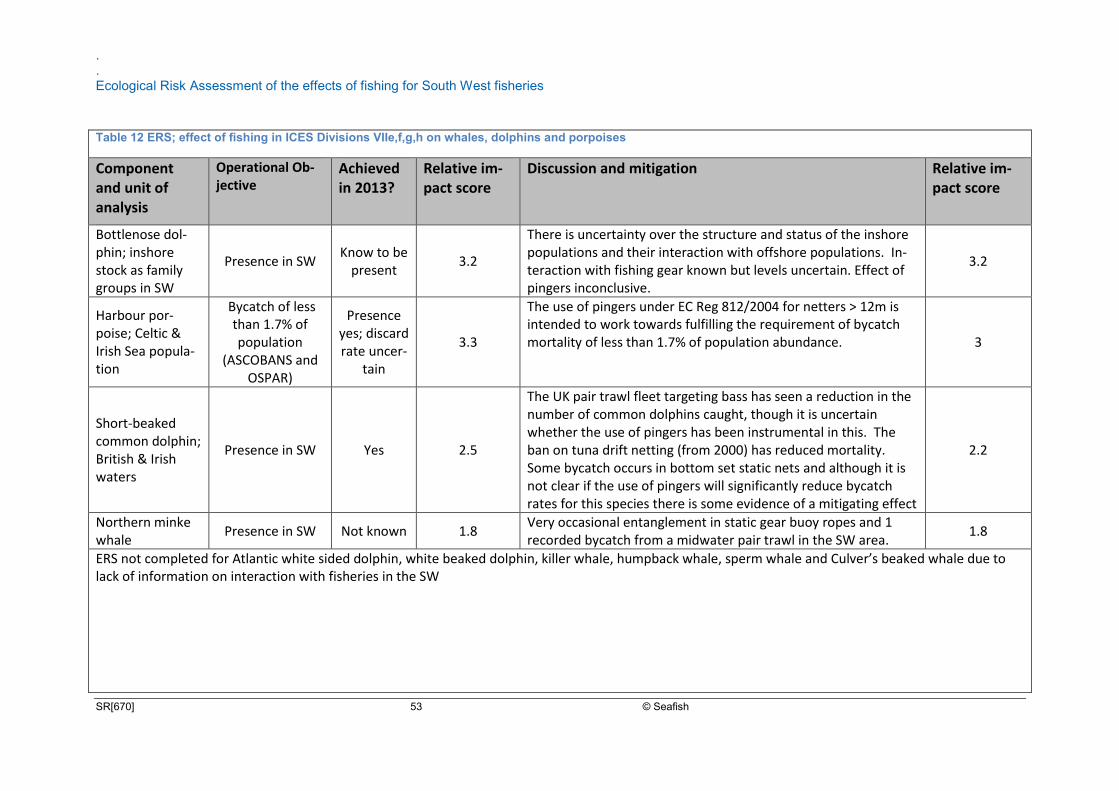
.
. Ecological Risk Assessment of the effects of fishing for South West fisheries
SR[670] 53 © Seafish
Table 12 ERS; effect of fishing in ICES Divisions VIIe,f,g,h on whales, dolphins and porpoises
Component and unit of analysis
Operational Ob-jective
Achieved in 2013?
Relative im-pact score
Discussion and mitigation Relative im-pact score
Bottlenose dol-phin; inshore stock as family groups in SW
Presence in SW Know to be
present 3.2
There is uncertainty over the structure and status of the inshore populations and their interaction with offshore populations. In-teraction with fishing gear known but levels uncertain. Effect of pingers inconclusive.
3.2
Harbour por-poise; Celtic & Irish Sea popula-tion
Bycatch of less than 1.7% of population
(ASCOBANS and OSPAR)
Presence yes; discard rate uncer-
tain
3.3
The use of pingers under EC Reg 812/2004 for netters > 12m is intended to work towards fulfilling the requirement of bycatch mortality of less than 1.7% of population abundance. 3
Short-beaked common dolphin; British & Irish waters
Presence in SW Yes 2.5
The UK pair trawl fleet targeting bass has seen a reduction in the number of common dolphins caught, though it is uncertain whether the use of pingers has been instrumental in this. The ban on tuna drift netting (from 2000) has reduced mortality. Some bycatch occurs in bottom set static nets and although it is not clear if the use of pingers will significantly reduce bycatch rates for this species there is some evidence of a mitigating effect
2.2
Northern minke whale
Presence in SW Not known 1.8 Very occasional entanglement in static gear buoy ropes and 1 recorded bycatch from a midwater pair trawl in the SW area.
1.8
ERS not completed for Atlantic white sided dolphin, white beaked dolphin, killer whale, humpback whale, sperm whale and Culver’s beaked whale due to lack of information on interaction with fisheries in the SW
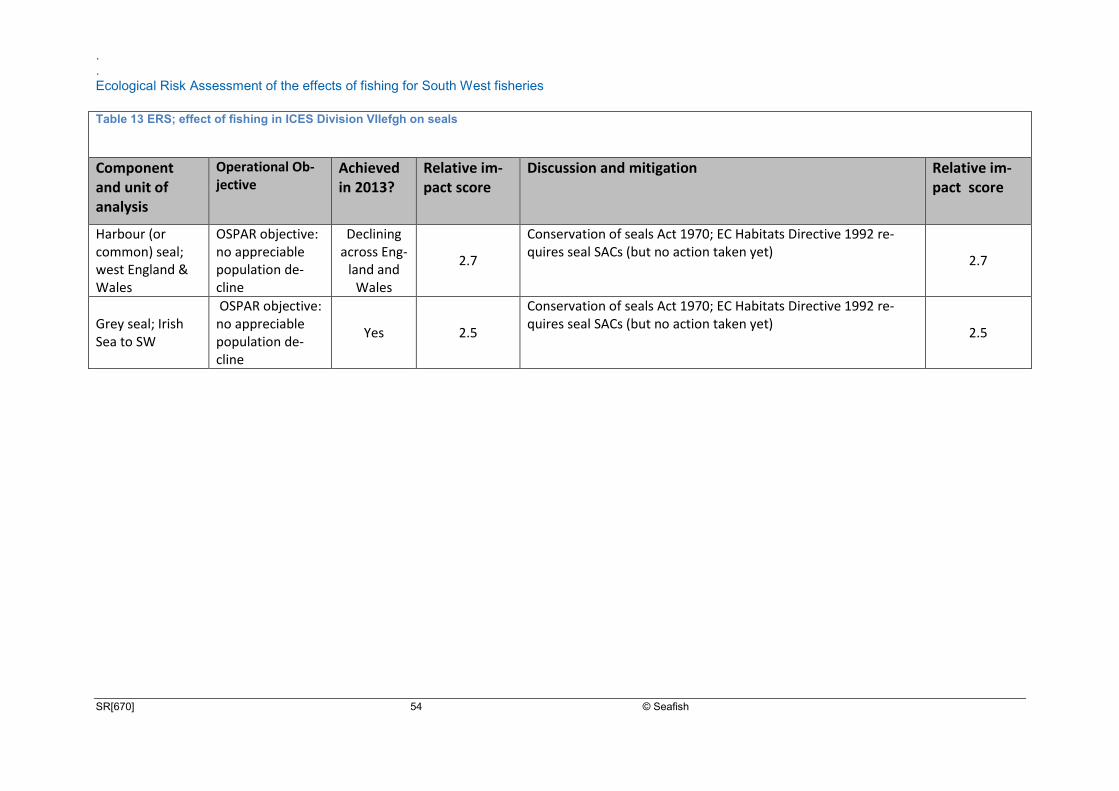
.
. Ecological Risk Assessment of the effects of fishing for South West fisheries
SR[670] 54 © Seafish
Table 13 ERS; effect of fishing in ICES Division VIIefgh on seals
Component and unit of analysis
Operational Ob-jective
Achieved in 2013?
Relative im-pact score
Discussion and mitigation Relative im-pact score
Harbour (or common) seal; west England & Wales
OSPAR objective: no appreciable population de-cline
Declining across Eng-
land and Wales
2.7
Conservation of seals Act 1970; EC Habitats Directive 1992 re-quires seal SACs (but no action taken yet)
2.7
Grey seal; Irish Sea to SW
OSPAR objective: no appreciable population de-cline
Yes 2.5
Conservation of seals Act 1970; EC Habitats Directive 1992 re-quires seal SACs (but no action taken yet)
2.5
Ecological Risk Assessment of the effects of fishing for South West fisheries. .
55
9. References Those marked * are available at www.seafish.org/media/publications/SR672ERAEFSupporting_information.pdf Anon (2011). Advice from the Joint Nature Conservation Committee and Natural England with regard to fisheries impacts on Marine Conservation Zone habitat features. JNCC and Natural England: 113. *Bell, E. (2013). Advice to Seafish on input to ecological risk assessment of the effects of fish-ing in the southwest marine ecosystem; commercial crustacea; crabs, lobsters, crawfish and spider crabs. Blythe, R. E., Kaiser, M. J., Edwards-Jones, G. and Hart, P. J. B. (2004), Implications of a zoned fishery management system for marine benthic communities. Journal of Applied Ecolo-gy, 41: 951–961
*Bloor, I, and Jackson, E 2013 Seafish Ecological risk assessment of South West fisheries: Cephalopod ecosystem component Marine Biological Association of the UK *Bolam, S. (2013). Advice to Seafish on input to ecological risk assessment of the effects of fishing in the southwest marine ecosystem; benthic habitats and communities including mobile epifauna. Bolam SG, Coggan R.C., Eggleton J., Diesing M., Stephens D. (2014) Sensitivity of macroben-thic secondary production to trawling in the English sector of the Greater North Sea: A biologi-cal trait approach
Journal of Sea Research Volume 85, Pages 162–177 Caslake, R (2009) SR617_Seafish Inshore VMS Pilot Project_SFA003 www.seafish.org/media/Publications/SR617_VMSFinal.pdf *Catchpole, T. (2013). Advice to Seafish on input to ecological risk assessment of the effects of fishing in the southwest marine ecosystem; discarding in the south west. Coleman R.A., Hoskin M.G., von Carlshausen E. and , Davis C.M. (2013) Using a no-take zone to assess the impacts of fishing: Sessile epifauna appear insensitive to environmental disturbances from commercial potting. Journal of Experimental Marine Biology and Ecology 440 (2013) 100–107
Cotter, J., and Lart, W. (2011). A guide for ecological risk assessment of the effects of com-mercial fishing (ERAEF). (Grimsby, UK: Sea Fish Industry Authority). www.seafish.org/media/Publications/SR644_A_Guide_to_ERAEF_March_2011.pdf
Ecological Risk Assessment of the effects of fishing for South West fisheries. .
56
Cotter, J., Lart, W., de Rozarieux, N., Kingston, A., Caslake, R., Le Quesne, W., Jennings, S., Caveen, A., and Brown, M. A development of ecological risk screening with an application to fisheries off SW England. – ICES Journal of Marine Science, doi: 10.1093/icesjms/fsu167
http://icesjms.oxfordjournals.org/cgi/content/full/fsu167? ijkey=kcWA59J92D7XGtB&keytype=ref
Daskalov, G.M (2007) Overfishing Affects More than Fish Populations: Trophic Cascades and Regime Shifts in the Black Sea. In; Advances in Fisheries Science: 50 years on from Beverton and Holt. Editors Andy Payne, John Cotter, Ted Potter Chapt 17; p 418-433 Defra, (2012) Ecosystem approach to fisheries Project MF 1001 Evidence Project Final Report Diesing M, D Stephens, J Aldridge (2013). A proposed method for assessing the extent of the seabed significantly affected by demersal fishing in the Greater North Sea ICES Jounal of Marine Science Vol 70 (6): 1085-1096. *Edwards M, Beaugrand G, Helaoue¨ t P, Alheit J, Coombs S (2013). Marine Ecosystem Re-sponse to the Atlantic Multidecadal Oscillation. PLoS ONE 8(2): e57212. doi:10.1371/journal.pone.0057212 *Ellis J, Walker, A and Pawson, M (2013) Advice to Seafish on input to ecological risk asse-ment of the effects of fishing in the southwest marine ecosystem; Component 3: Additional ad-vice on lampreys, elasmobranchs and endangered fish species Enever, R Catchpole, T.L., Ellis, J.R., Grant., A (2009) The survival of skates (Rajidae) caught by demersal trawlers fishing in UK waters Fisheries Research 97 (2009) 72–76 Eno, N.C., Frid, C.L.J., Hall, K., Ramsay,, K., Sharp, R.A.M., Brazier, D.P., Hearn, S., Dernie, K.M., Robinson, K.A., Paramor, O.A.L., et al. (2013). Assessing the sensitivity of habitats to fishing: from seabed maps to sensitivity maps. J. Fish Biol. 83, 826–846. Eno, N. C., MacDonald, D. S., Kinnear, J. A. M., Amos, C. S., Chapman, C. J., Clark, R. A., Bunker, F. St P. D., and Munro, C. 2001. Effects of crustacean traps on benthic fauna. – ICES Journal of Marine Science, 58: 11–20.
Hobday, AJ, A. D. M. Smith, I.C. Stobutzki, C. Bulman, R. Daley, J.M. Dambacher, R.A. Deng J. Dowdney, M. Fuller, D. Furlani, S.P. Griffiths, D. Johnson, R. Kenyon, I.A. Knuckey, S.D. Ling, R. Pitcher, K.J. Sainsbury, M. Sporcic, T. Smith, C. Turnbull, T.I. Walker, S.E. Wayte, H. Webb, A. Williams, B.S. Wise, S. Zhou (2011). Ecological risk assessment for the effects of fishing Fisheries Research 108; 372-384 Jennings, S. and Lee, J. 2012. Defining fishing grounds with vessel monitoring system data. ICES Journal of Marine Science (2012), 69(1), 51–63. Jennings, S., M.D. Nicholson, T.A. Dinmore & J. Lancaster, (2002). Effects of chronic trawling disturbance on the production of infaunal communities. Marine Ecology Progress Series 243: 251–260.
Ecological Risk Assessment of the effects of fishing for South West fisheries. .
57
Jennings, S., J.K. Pinnegar, N.V C. Polunin & K.J. Warr, (2001). Impacts of trawling disturbance on the trophic structure of benthic invertebrate communities. Marine Ecology Progress Series 213: 127–142. *Kingston, A., Smout, S., & Northridge, S (2013) Ecological Risk Assessment of Southwest Fisheries: Marine Mammal Ecosystem Component Sea Mammal Research Unit (SMRU), University of St Andrews. *Koch, A., and Pacitto, S. (2013). Advice to Seafish on input to ecological risk assessment of the effects of fishing in the southwest marine ecosystem; benthic habitat, nursery and spawn-ing areas and human activities relating to the area. *Mander, L., and Thomson, N.D. (2013). Ecological risk assessment of south west fisheries - summary of knowledge on the seabird ecosystem component. Institute of Estuarine and Coastal studies *Milligan, S (2013). Advice to Seafish on input to ecological risk assessment of the effects of fishing in the southwest marine ecosystem Component 6: Ichthyo, Zoo and phytoplankton *Palmer, D and Roel, B (2013) Advice to Seafish on input to ecological risk assessment of the effects of fishing in the southwest marine ecosystem Component 2: Commercial molluscs; scallops, oysters, mussels, whelks and squid Pawson, M. G (2003) The catching capacity of lost static fishing gears: introduction Fisheries Research Volume 64, Issues 2–3, November 2003, Pages 101–105 *Pawson, M. (2013) Information on marine teleost fish ecosystem component for Seafish Eco-logical risk assessment of South West fisheries. *Penrose, R 2012 Fisheries Turtle Interaction; Advice to the Sea Fish Industry Authority *Le Quesne, W. (2013). Advice to Seafish on input to ecological risk assessment of the effects of fishing in the southwest marine ecosystem; fish community structure. Revill, A,S and Dunlin, G (2003) The fishing capacity of gillnets lost on wrecks and on open ground in UK coastal waters Fisheries Research Volume 64, Issues 2–3, November 2003 107-113 Shephard S, Gerritsen H, Kaiser MJ, Reid DG (2012) Spatial Heterogeneity in Fishing Creates de facto Refugia for Endangered Celtic Sea Elasmobranchs. PLoS ONE 7(11): e49307. doi:10.1371/journal.pone.0049307 Sancho, G, Puente E, Bilbao A, Gomez, E, Arreg, L (2003) Catch rates of monkfish (Lophius spp.) by lost tangle nets in the Cantabrian Sea (northern Spain) Fisheries Research Volume 64, Issues 2–3, November 2003, Pages 129–139
Ecological Risk Assessment of the effects of fishing for South West fisheries. .
58
*Tregenza N (2012) Cetaceans and South West Fisheries; Advice to the Sea Fish Industry Au-thority
Ecological Risk Assessment of the effects of fishing for South West fisheries. .
59
Appendix 1. Detailed descriptions of the main gear types used in the SW fisheries
Beam trawl Operations and gear This fishery operates throughout the SW area. The main target species are Dover sole, plaice, megrim, anglerfish (monkfish) and cuttlefish. Most beam trawlers in the SW fleet are between 25-30 m in length. Echo sounders and OlexTM, together with historical information, are used to identify suitable fishing locations and tow paths. The trip lengths are mostly up to 7 days and the vessels store the fish on ice (Caslake, pers comm). As sole, megrim, and anglerfish are quite sparsely distributed, the economics of beam trawling depend on covering large amounts of ground at speed. Most fishing is carried out at 6 knots or higher and tow duration varies between 30 min on grounds with high benthos and debris to 2 – 3 hr on clean ground. The port and starboard nets are hauled alternately, rapidly emptied into pounds on the deck and lowered back over the side to start fishing while the crew sort the catch. In this way beam trawlers can fish almost continuously whilst on the fishing grounds.
There are seasonal differences in grounds fished and mesh-size used in beam trawls, depend-ing on the target species: cod-end mesh sizes vary from 80-90 mm (for sole) to 100-119 mm (anglerfish, plaice). The majority of vessels use chain matrix gear, but some use ‘open’ or tick-ler chain gear on softer seabed. In order to reduce fuel costs while maintaining high sole catches, there has been a progressive reduction in the size and weight of materials used in the beam trawl, especially in the chains that have ground contact.
Otter trawl
Operations and gear
This gear is used inshore and offshore throughout the Channel to catch a mix of flatfish (plaice, sole, lemon sole, dab) and gadoids (cod, whiting, pout, pollack, hake, ling), with an-glerfish, gurnads, rays, squid and cuttlefish at the appropriate season. Vessels vary between <10 m and 25 m in length. Small vessels undertake 1-3 day trips and larger vessels 4 – 7 day trips. They will steam to the grounds and locate suitable tows using echo sounder and/or OlexTM ground discrimination systems and historical knowledge. Tows are likely to last 4-5 hours. Monitoring systems utilising sonic communication from gear mounted transducers are used to ensure correct gear geometry. The spatial distribution of ef-fort in 2007 is shown in Figure A1 with relative intensity for all beam and otter trawls.
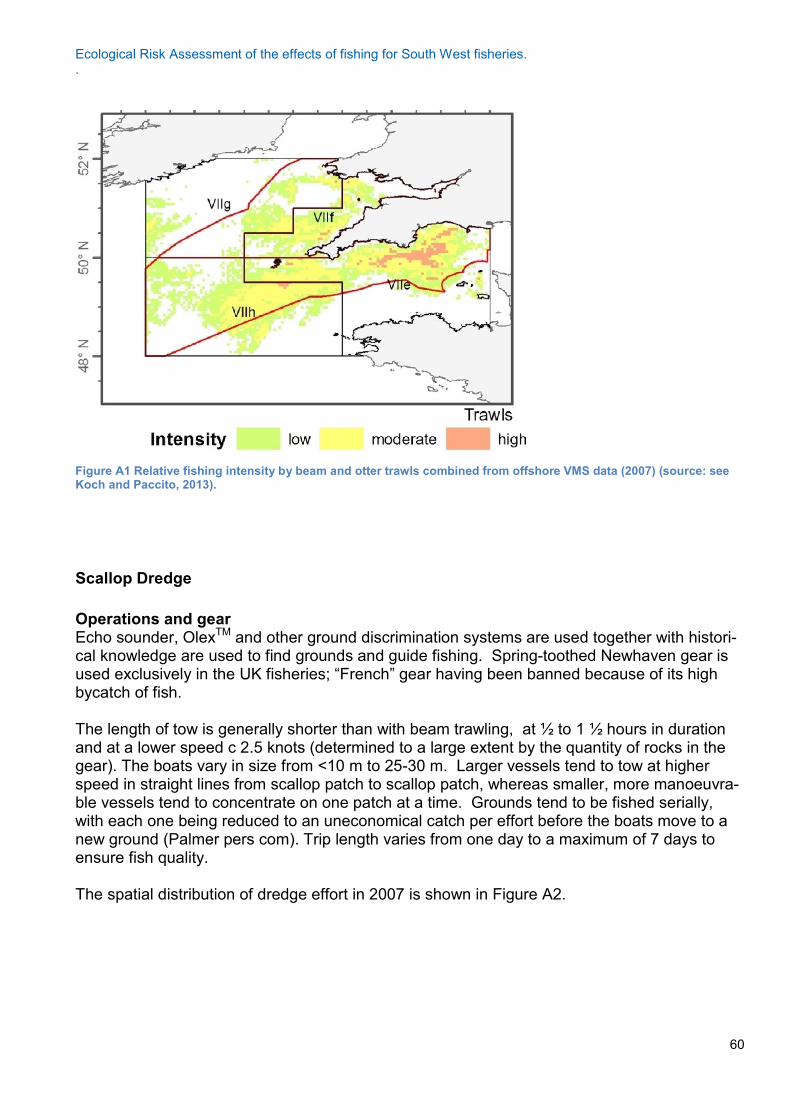
Ecological Risk Assessment of the effects of fishing for South West fisheries. .
60
Figure A1 Relative fishing intensity by beam and otter trawls combined from offshore VMS data (2007) (source: see Koch and Paccito, 2013).
Scallop Dredge
Operations and gear Echo sounder, OlexTM and other ground discrimination systems are used together with histori-cal knowledge are used to find grounds and guide fishing. Spring-toothed Newhaven gear is used exclusively in the UK fisheries; “French” gear having been banned because of its high bycatch of fish. The length of tow is generally shorter than with beam trawling, at ½ to 1 ½ hours in duration and at a lower speed c 2.5 knots (determined to a large extent by the quantity of rocks in the gear). The boats vary in size from <10 m to 25-30 m. Larger vessels tend to tow at higher speed in straight lines from scallop patch to scallop patch, whereas smaller, more manoeuvra-ble vessels tend to concentrate on one patch at a time. Grounds tend to be fished serially, with each one being reduced to an uneconomical catch per effort before the boats move to a new ground (Palmer pers com). Trip length varies from one day to a maximum of 7 days to ensure fish quality. The spatial distribution of dredge effort in 2007 is shown in Figure A2.
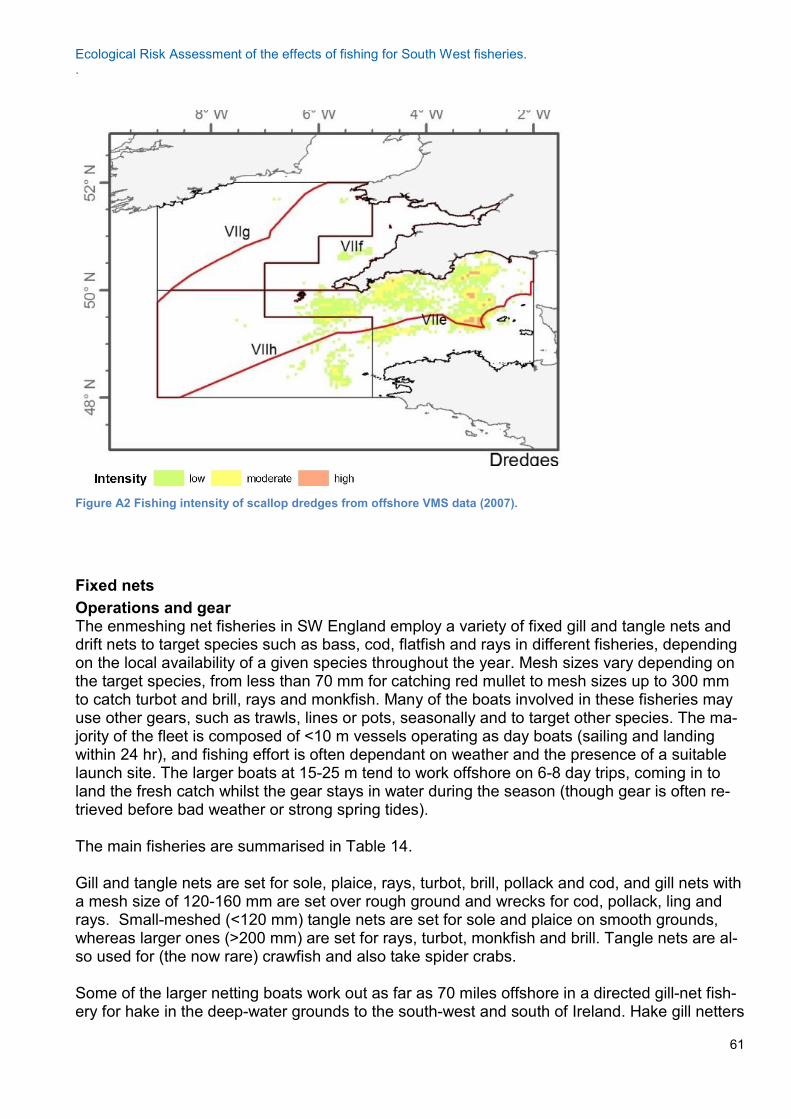
Ecological Risk Assessment of the effects of fishing for South West fisheries. .
61
Figure A2 Fishing intensity of scallop dredges from offshore VMS data (2007).
Fixed nets
Operations and gear The enmeshing net fisheries in SW England employ a variety of fixed gill and tangle nets and drift nets to target species such as bass, cod, flatfish and rays in different fisheries, depending on the local availability of a given species throughout the year. Mesh sizes vary depending on the target species, from less than 70 mm for catching red mullet to mesh sizes up to 300 mm to catch turbot and brill, rays and monkfish. Many of the boats involved in these fisheries may use other gears, such as trawls, lines or pots, seasonally and to target other species. The ma-jority of the fleet is composed of <10 m vessels operating as day boats (sailing and landing within 24 hr), and fishing effort is often dependant on weather and the presence of a suitable launch site. The larger boats at 15-25 m tend to work offshore on 6-8 day trips, coming in to land the fresh catch whilst the gear stays in water during the season (though gear is often re-trieved before bad weather or strong spring tides). The main fisheries are summarised in Table 14. Gill and tangle nets are set for sole, plaice, rays, turbot, brill, pollack and cod, and gill nets with a mesh size of 120-160 mm are set over rough ground and wrecks for cod, pollack, ling and rays. Small-meshed (<120 mm) tangle nets are set for sole and plaice on smooth grounds, whereas larger ones (>200 mm) are set for rays, turbot, monkfish and brill. Tangle nets are al-so used for (the now rare) crawfish and also take spider crabs. Some of the larger netting boats work out as far as 70 miles offshore in a directed gill-net fish-ery for hake in the deep-water grounds to the south-west and south of Ireland. Hake gill netters
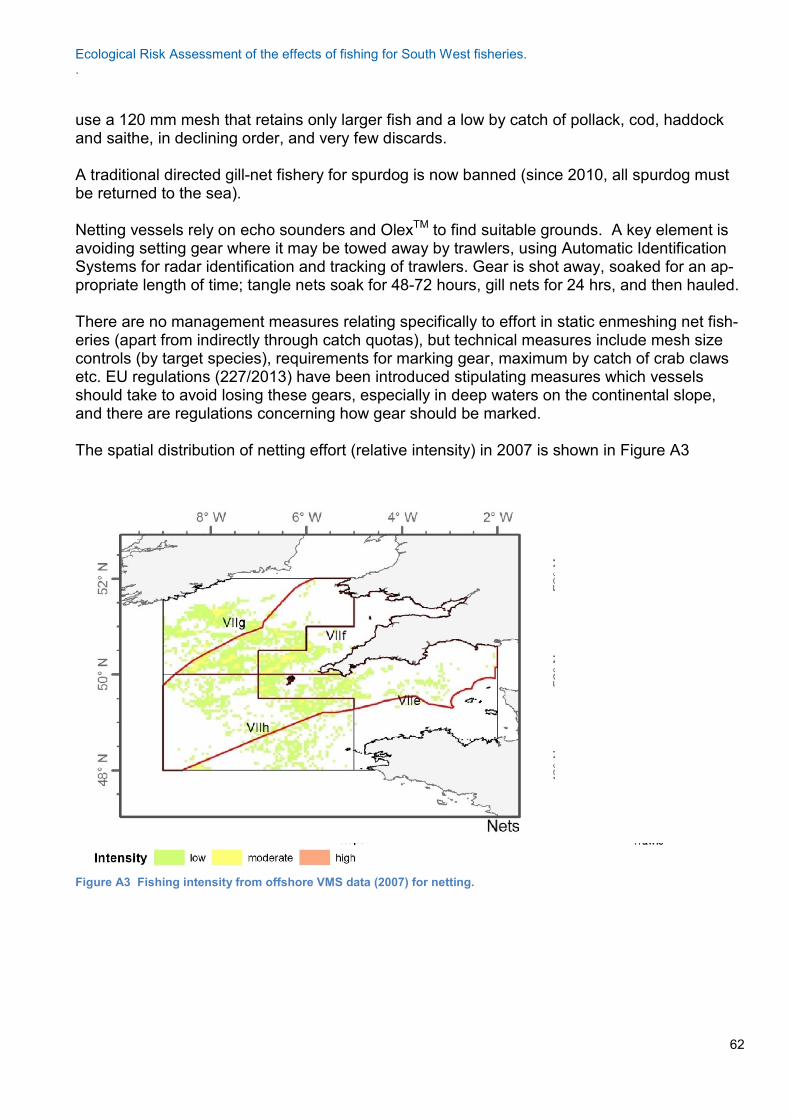
Ecological Risk Assessment of the effects of fishing for South West fisheries. .
62
use a 120 mm mesh that retains only larger fish and a low by catch of pollack, cod, haddock and saithe, in declining order, and very few discards. A traditional directed gill-net fishery for spurdog is now banned (since 2010, all spurdog must be returned to the sea). Netting vessels rely on echo sounders and OlexTM to find suitable grounds. A key element is avoiding setting gear where it may be towed away by trawlers, using Automatic Identification Systems for radar identification and tracking of trawlers. Gear is shot away, soaked for an ap-propriate length of time; tangle nets soak for 48-72 hours, gill nets for 24 hrs, and then hauled. There are no management measures relating specifically to effort in static enmeshing net fish-eries (apart from indirectly through catch quotas), but technical measures include mesh size controls (by target species), requirements for marking gear, maximum by catch of crab claws etc. EU regulations (227/2013) have been introduced stipulating measures which vessels should take to avoid losing these gears, especially in deep waters on the continental slope, and there are regulations concerning how gear should be marked. The spatial distribution of netting effort (relative intensity) in 2007 is shown in Figure A3
Figure A3 Fishing intensity from offshore VMS data (2007) for netting.
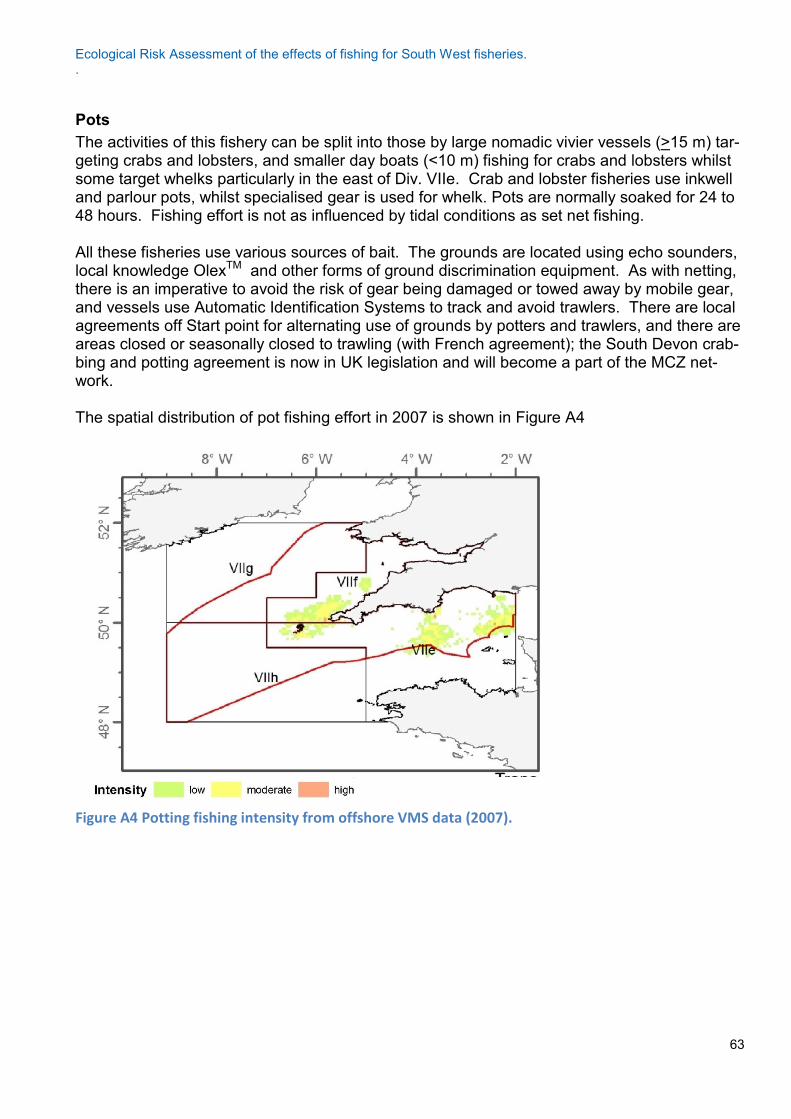
Ecological Risk Assessment of the effects of fishing for South West fisheries. .
63
Pots
The activities of this fishery can be split into those by large nomadic vivier vessels (>15 m) tar-geting crabs and lobsters, and smaller day boats (<10 m) fishing for crabs and lobsters whilst some target whelks particularly in the east of Div. VIIe. Crab and lobster fisheries use inkwell and parlour pots, whilst specialised gear is used for whelk. Pots are normally soaked for 24 to 48 hours. Fishing effort is not as influenced by tidal conditions as set net fishing. All these fisheries use various sources of bait. The grounds are located using echo sounders, local knowledge OlexTM and other forms of ground discrimination equipment. As with netting, there is an imperative to avoid the risk of gear being damaged or towed away by mobile gear, and vessels use Automatic Identification Systems to track and avoid trawlers. There are local agreements off Start point for alternating use of grounds by potters and trawlers, and there are areas closed or seasonally closed to trawling (with French agreement); the South Devon crab-bing and potting agreement is now in UK legislation and will become a part of the MCZ net-work. The spatial distribution of pot fishing effort in 2007 is shown in Figure A4
Figure A4 Potting fishing intensity from offshore VMS data (2007).
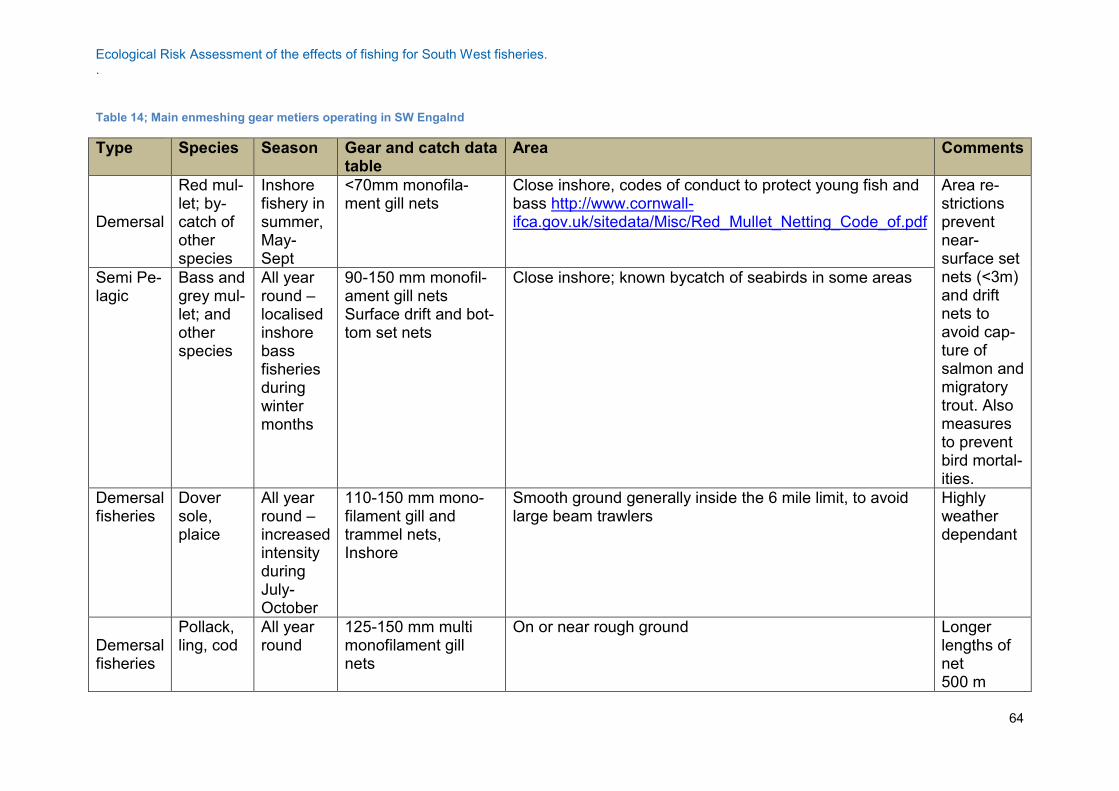
Ecological Risk Assessment of the effects of fishing for South West fisheries. .
64
Table 14; Main enmeshing gear metiers operating in SW Engalnd
Type Species Season Gear and catch data table
Area Comments
Demersal
Red mul-let; by-catch of other species
Inshore fishery in summer, May- Sept
<70mm monofila-ment gill nets
Close inshore, codes of conduct to protect young fish and bass http://www.cornwall-ifca.gov.uk/sitedata/Misc/Red_Mullet_Netting_Code_of.pdf
Area re-strictions prevent near-surface set nets (<3m) and drift nets to avoid cap-ture of salmon and migratory trout. Also measures to prevent bird mortal-ities.
Semi Pe-lagic
Bass and grey mul-let; and other species
All year round – localised inshore bass fisheries during winter months
90-150 mm monofil-ament gill nets Surface drift and bot-tom set nets
Close inshore; known bycatch of seabirds in some areas
Demersal fisheries
Dover sole, plaice
All year round – increased intensity during July-October
110-150 mm mono-filament gill and trammel nets, Inshore
Smooth ground generally inside the 6 mile limit, to avoid large beam trawlers
Highly weather dependant
Demersal fisheries
Pollack, ling, cod
All year round
125-150 mm multi monofilament gill nets
On or near rough ground Longer lengths of net 500 m
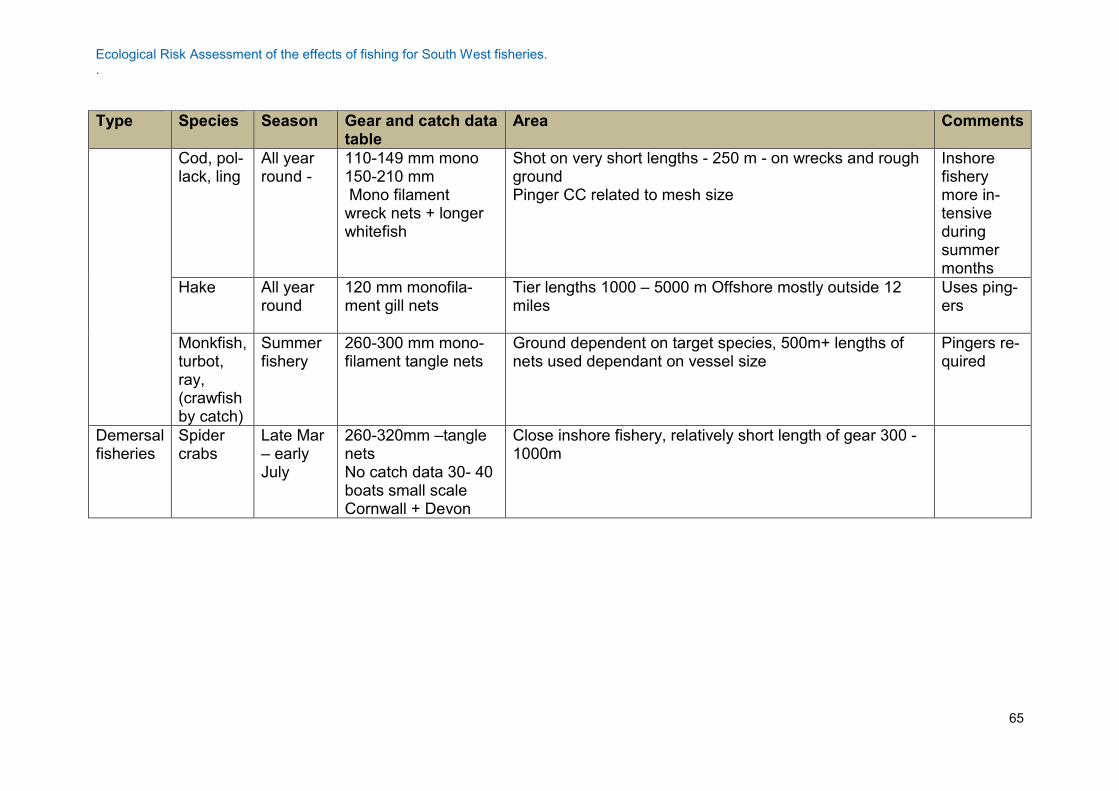
Ecological Risk Assessment of the effects of fishing for South West fisheries. .
65
Type Species Season Gear and catch data table
Area Comments
Cod, pol-lack, ling
All year round -
110-149 mm mono 150-210 mm Mono filament wreck nets + longer whitefish
Shot on very short lengths - 250 m - on wrecks and rough ground Pinger CC related to mesh size
Inshore fishery more in-tensive during summer months
Hake All year round
120 mm monofila-ment gill nets
Tier lengths 1000 – 5000 m Offshore mostly outside 12 miles
Uses ping-ers
Monkfish, turbot, ray, (crawfish by catch)
Summer fishery
260-300 mm mono-filament tangle nets
Ground dependent on target species, 500m+ lengths of nets used dependant on vessel size
Pingers re-quired
Demersal fisheries
Spider crabs
Late Mar – early July
260-320mm –tangle nets No catch data 30- 40 boats small scale Cornwall + Devon
Close inshore fishery, relatively short length of gear 300 - 1000m
Ecological Risk Assessment of the effects of fishing for South West fisheries. .
66
Ecological Risk Assessment of the effects of fishing for South West fisheries. .
67
Appendix 2 Ecological risk screening jargon Activity = one of the activities of the agent, e.g. towing a trawl Agent of change (abbreviated to ‘agent’) = anything likely to be causing changes in the ecosystem, e.g. a fishery. Analysis; analysis of data or scores to obtain an estimate of relative risk or as part of a modelling process. E.g. Virtual Population Analysis for populations; Risk screening analysis for ecological components. Assessment; using the results of an analysis to judge outcome against some sort of operational objective. Attribute = Feature of a unit beneficial to survival, e.g. abundance Component = colloquial grouping of units, e.g. 'sharks Effect = change to an attribute of a unit resulting from an activity Unit of analysis (abbreviated to ‘unit’) = a stock, a species, a habitat, a functional group, or a community Operational Objective set pursuant to Goals; intended to control the effect of an ac-tivity. Member of a unit = a single stock, an individual organism, a single instance or part of a habitat or community (as appropriate) Calculation of geometric mean score The calculation of the relative impact score is carried out as follows Relative impact score = 4√Spatial score*Temporal score*Intensity score * Duration Effectively this means that if a score is 0 the relative impact is zero, whilst an arith-metic mean would have resulted in a positive score.

Ecological Risk Assessment of the effects of fishing for South West fisheries. .
68