Embed Size (px)
Citation preview
SR654
Review of polyphosphates as additives and
testing methods for them in scallops and
prawns
Campden BRI
April 2012
ISBN no 978-1-906634-60-5
Review of polyphosphates as additives and testing methods for them in scallops and prawns
Campden BRI Report: BC-REP-125846-01
Executive summary
Phosphates, including polyphosphates, occur naturally in all forms of life and are therefore
present in almost all food. Naturally occurring phosphates range from single phosphate
groups (orthophosphates) to differing lengths of chains of phosphates; 2 phosphate groups
(pyrophosphates), 3 phosphate groups (tripolyphosphates) and chains of 4 or more phosphate
groups (polyphosphates). In cells phosphates are involved in metabolic functions, including
acting as an energy source.
Phosphates can also be used as food additives; when added to seafood they have legitimate
functional aims including retention of natural moisture, inhibition of flavour and lipid
oxidation, aiding emulsification and removal of shell fish shells and offering cryoprotection.
The actual mechanism of the action of added phosphates on proteins is not well understood.
It is thought that one of the effects of adding phosphates is to alter the conformation
(structural arrangement) of proteins, which increases the space between muscle fibres,
creating more capacity for water holding. Phosphates have also been shown to stabilise the
protein structure of meat, form a surface layer of coagulated (solid) protein around meat,
swell muscle fibres and solubilise muscle proteins.
However, because phosphates can be used to retain moisture there are concerns that they
could be misused to retain ‘added water’, thus increasing the size and weight of products
resulting in unfair trade practices. Legislation pertaining to added phosphates differs around
the world. In the EU, phosphates can be added to frozen and deep-frozen molluscs and
crustaceans to a level of 5g/kg (0.5%), while the USA has no limit on their use. In the EU
phosphates are not permitted in fresh/chilled molluscs and crustaceans; however those
products which have previously been frozen but later defrosted and supplied chilled are
permitted to contain phosphates.
The measurement of ‘added’ phosphates in seafood products is not straight-forward. There is
the need to distinguish between naturally occurring levels of phosphates, which are not well
defined, and the level of added phosphates. Attempts to use measurements of moisture
content or phosphates (as phosphorus) have been found to be unsuitable to show that
phosphates have been added to products, due to their large natural variation.
An additional complication is that added polyphosphates are broken down into
pyrophosphates and eventually into orthophosphates in uncooked products due to the activity
of naturally occurring enzymes called phosphatases. The rate of this break down increases
with increasing temperature, but even occurs at 0˚C. In contrast, very little polyphosphate
breakdown occurs in cooked products stored frozen even up to 11 months. This is thought to
be due to phosphatases being inactivated during cooking.
Work has been conducted to show that ratios of moisture:protein and free-phosphate:protein-
bound phosphate can provide valuable information on ‘added’ phosphates in seafood. These
calculations however, rely on the use of interim nitrogen factors for the estimation of protein
in scallops and prawns. More recently, chromatographic and capillary electrophoretic
methods have been routinely used to determine levels of phosphates in seafoods; each
method has inherent advantages and disadvantages, and different sensitivities. Although
other methods are available to measure polyphosphates (nuclear magnetic resonance, thermo-
differential-photometry and microwave dielectric spectroscopy) these are currently
predominantly used in research settings rather than for routine analysis.
Review of polyphosphates as additives and testing methods for them in scallops and prawns
Campden BRI Report: BC-REP-125846-01
Contents 1. Introduction ........................................................................................................................ 1
1.1 The issue ...................................................................................................................... 1 1.2 Objective of this document ......................................................................................... 3
2. Glossary ............................................................................................................................. 4
3. Polyphosphates review of literature ................................................................................... 5 3.1 The chemistry of polyphosphates ................................................................................ 5
3.1.1 Summary .............................................................................................................. 7 3.2 The role of naturally occurring polyphosphates .......................................................... 8
3.2.1 Summary .............................................................................................................. 9
3.3 Presence and levels of naturally occurring polyphosphates in scallops and prawns 10
3.3.1 Summary ............................................................................................................ 13
3.4 How polyphosphates interact with the product ......................................................... 14 3.4.1 Summary ............................................................................................................ 18
3.5 How polyphosphates breakdown over time and their breakdown products .............. 19 3.5.1 Summary ............................................................................................................ 21
4. Review of testing methods for polyphosphates ............................................................... 22
4.1 Classical methods ...................................................................................................... 22
4.1.1 Moisture content ................................................................................................ 22 4.1.2 Protein content ................................................................................................... 23 4.1.3 Quantification of phosphorus ............................................................................. 24
4.1.4 Calculation of ratios ........................................................................................... 24 4.2 Chromatographic methods ........................................................................................ 25
4.2.1 Thin layer chromatography (TLC) ..................................................................... 25 4.2.2 Ion chromatography (IC) ................................................................................... 29
4.3 Capillary electrophoresis ........................................................................................... 33 4.3.1 Capillary isotachophoresis (CITP) ..................................................................... 33
4.4 Research methods ...................................................................................................... 36
4.4.1 Nuclear magnetic resonance (NMR) ................................................................. 36 4.4.2 Thermo-differential-photometry (TDF) ............................................................. 37
4.4.3 Microwave dielectric spectroscopy.................................................................... 37 4.5 Summary ................................................................................................................... 38
5. References ........................................................................................................................ 39
Review of polyphosphates as additives and testing methods for them in scallops and prawns
Campden BRI Report: BC-REP-125846-01 1
1. Introduction Phosphates are a naturally occurring component of all living things and are therefore present
in almost all food. Phosphates can also be used as food additives in foods such as processed
cheese and meat, and may be added to seafood with the legitimate functional aim to;
retain natural moisture, i.e. reduce drip losses through the freeze/thaw cycle during
processing and storage
inhibit fluid losses of fresh shipments
inhibit the oxidation of flavours and lipids
aid emulsification
aid loosening the shell of shell fish ready for peeling
offer cryoprotection
There are concerns though that as phosphates can be used to help retain moisture, then by
application of excess phosphates the retention of “added water” can lead to unfair trade
practices resulting in economic fraud.
1.1 The issue
Sea Fish Industry Authority is interested in the use of polyphosphates in scallops and prawns
in particular, as excess levels of polyphosphates could be added to these products, which are
difficult to detect. Further to this there are restrictions on what can be used in seafood
products; the European Community Directive 95/2/EC "Food Additives Other Than Colours
and Sweeteners" (which continues to apply, until 1 June 2013, under the transitional
provisions of Regulation (EC) No 1333/2008) states in Annex IV that a maximum level of
5g/kg of additives E338-E452 (which includes phosphates, see Table 1) can be added to
frozen and deep-frozen molluscs and crustaceans (please note the controls on phosphates in
seafood are exactly the same in Directive 95/2/EC and Regulation 1333/2008). Food
Standards Agency (FSA) guidance notes relating to the additives legislation state that “It is
recognised that certain substances, for example phosphates and glutamates, are naturally
present in certain foods. The quantitative limits set by these Regulations in nearly all cases
relate only to the amount of additive added” (Food Standards Agency, 2002a). No
information however is provided in the guidance on what those naturally present levels of
phosphates are. Based on interpretation of the EC Directive, phosphates are not permitted in
fresh/chilled molluscs and crustaceans; the FSA has however commented that “scallops
which were previously frozen but later defrosted and supplied chilled are permitted to contain
phosphates so long as the product is labelled as ‘Previously frozen’” (Stephen Johnson, FSA
Food Additives Branch, Email to stakeholders, 20/07/11). The legislation also differs around
the world, for example in Japan only sodium pyrophosphate is allowed in scallops, in the
United States phosphate compounds are “Generally Recognised as Safe “ (GRAS) with no
limitations for use, whilst in Canada phosphates are not permitted in raw scallops (Codex
Alimentarius Commission, 2003).
To summarise, the main issues that the Sea Fish Industry Authority are interested in are:
1. Excess levels of phosphates in products that are added for fraudulent gain.
2. Phosphates that are used in products which are not permitted to contain them.
3. The lack of labelling on imported treated products.
Review of polyphosphates as additives and testing methods for them in scallops and prawns
Campden BRI Report: BC-REP-125846-01 2
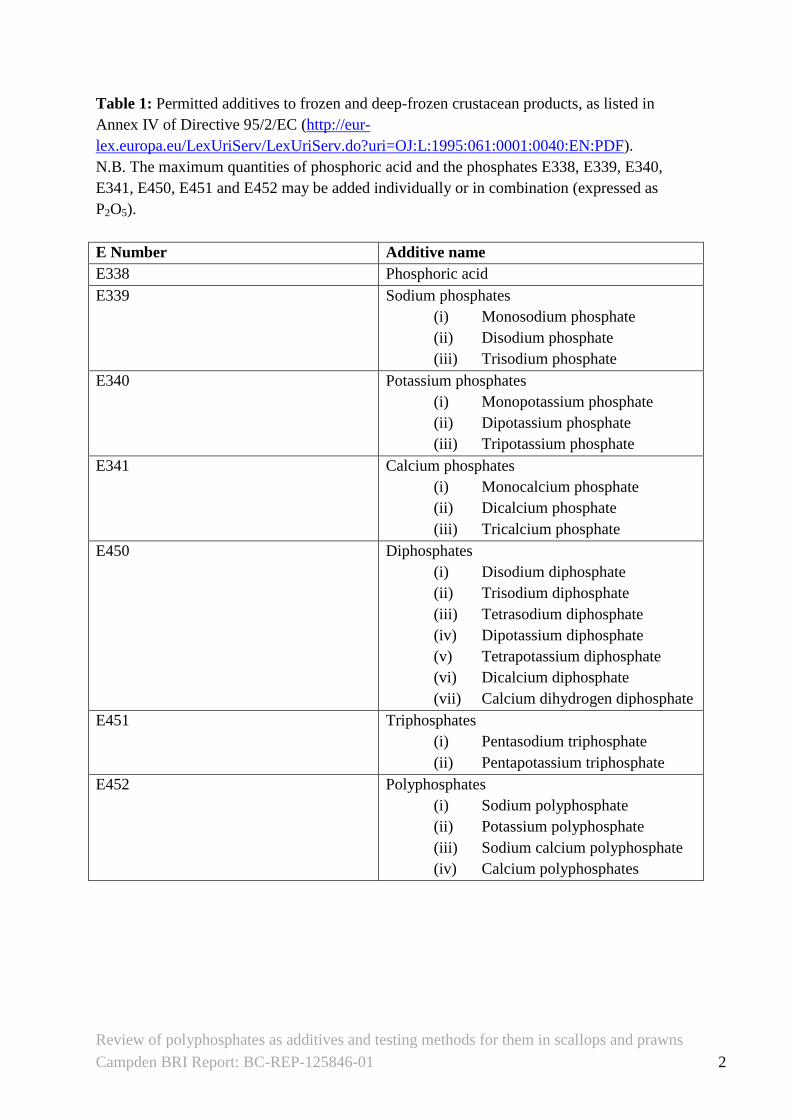
Table 1: Permitted additives to frozen and deep-frozen crustacean products, as listed in
Annex IV of Directive 95/2/EC (http://eur-
lex.europa.eu/LexUriServ/LexUriServ.do?uri=OJ:L:1995:061:0001:0040:EN:PDF).
N.B. The maximum quantities of phosphoric acid and the phosphates E338, E339, E340,
E341, E450, E451 and E452 may be added individually or in combination (expressed as
P2O5).
E Number Additive name
E338 Phosphoric acid
E339 Sodium phosphates
(i) Monosodium phosphate
(ii) Disodium phosphate
(iii) Trisodium phosphate
E340 Potassium phosphates
(i) Monopotassium phosphate
(ii) Dipotassium phosphate
(iii) Tripotassium phosphate
E341 Calcium phosphates
(i) Monocalcium phosphate
(ii) Dicalcium phosphate
(iii) Tricalcium phosphate
E450 Diphosphates
(i) Disodium diphosphate
(ii) Trisodium diphosphate
(iii) Tetrasodium diphosphate
(iv) Dipotassium diphosphate
(v) Tetrapotassium diphosphate
(vi) Dicalcium diphosphate
(vii) Calcium dihydrogen diphosphate
E451 Triphosphates
(i) Pentasodium triphosphate
(ii) Pentapotassium triphosphate
E452 Polyphosphates
(i) Sodium polyphosphate
(ii) Potassium polyphosphate
(iii) Sodium calcium polyphosphate
(iv) Calcium polyphosphates
Review of polyphosphates as additives and testing methods for them in scallops and prawns
Campden BRI Report: BC-REP-125846-01 3
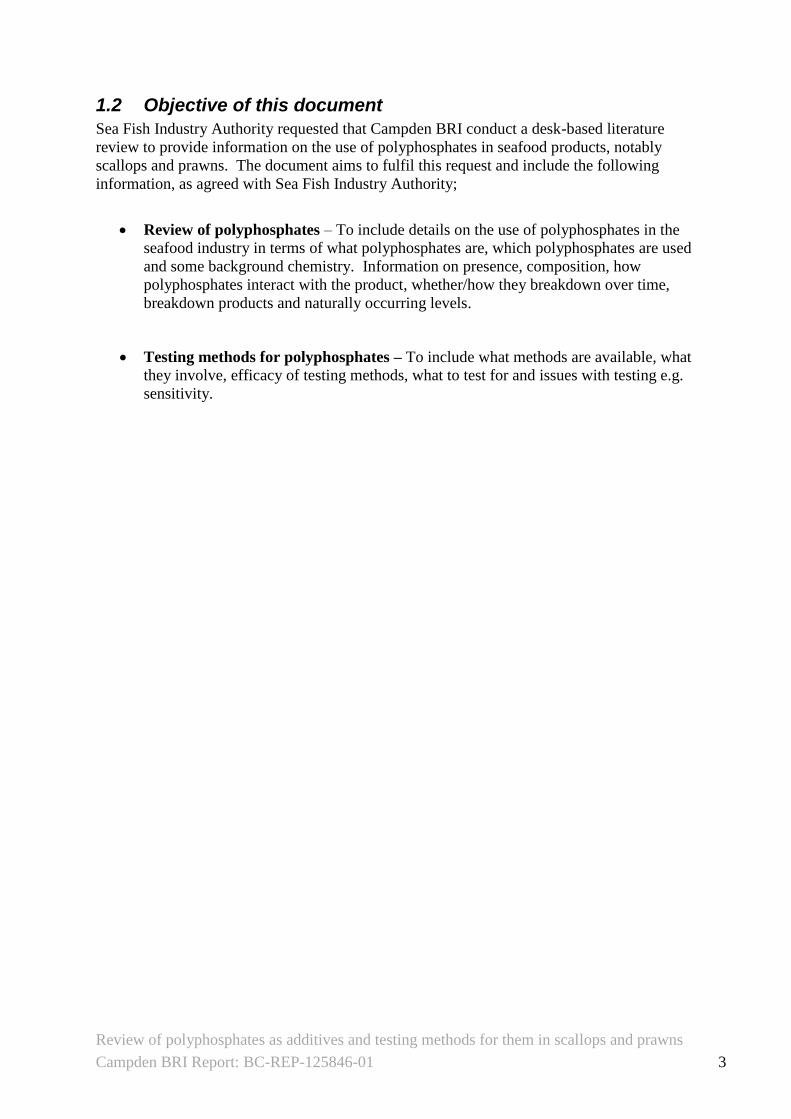
1.2 Objective of this document
Sea Fish Industry Authority requested that Campden BRI conduct a desk-based literature
review to provide information on the use of polyphosphates in seafood products, notably
scallops and prawns. The document aims to fulfil this request and include the following
information, as agreed with Sea Fish Industry Authority;
Review of polyphosphates – To include details on the use of polyphosphates in the
seafood industry in terms of what polyphosphates are, which polyphosphates are used
and some background chemistry. Information on presence, composition, how
polyphosphates interact with the product, whether/how they breakdown over time,
breakdown products and naturally occurring levels.
Testing methods for polyphosphates – To include what methods are available, what
they involve, efficacy of testing methods, what to test for and issues with testing e.g.
sensitivity.
Review of polyphosphates as additives and testing methods for them in scallops and prawns
Campden BRI Report: BC-REP-125846-01 4
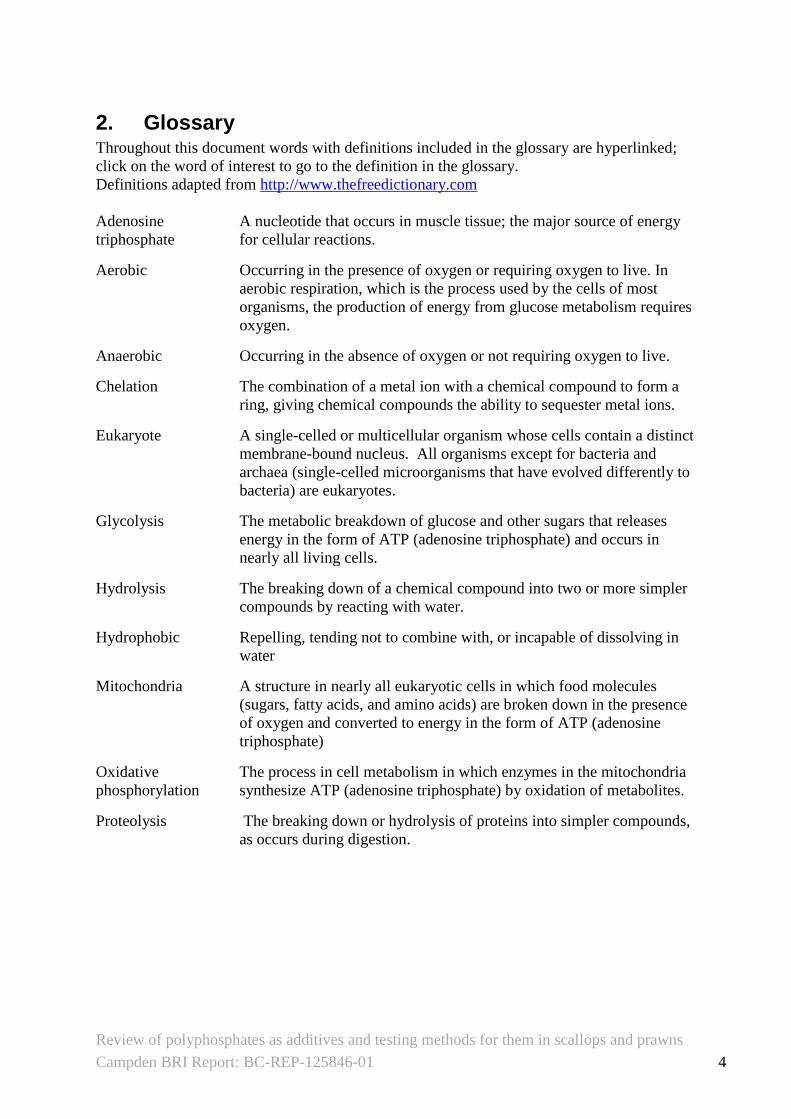
2. Glossary Throughout this document words with definitions included in the glossary are hyperlinked;
click on the word of interest to go to the definition in the glossary.
Definitions adapted from http://www.thefreedictionary.com
Adenosine A nucleotide that occurs in muscle tissue; the major source of energy
triphosphate for cellular reactions.
Aerobic Occurring in the presence of oxygen or requiring oxygen to live. In
aerobic respiration, which is the process used by the cells of most
organisms, the production of energy from glucose metabolism requires
oxygen.
Anaerobic Occurring in the absence of oxygen or not requiring oxygen to live.
Chelation The combination of a metal ion with a chemical compound to form a
ring, giving chemical compounds the ability to sequester metal ions.
Eukaryote A single-celled or multicellular organism whose cells contain a distinct
membrane-bound nucleus. All organisms except for bacteria and
archaea (single-celled microorganisms that have evolved differently to
bacteria) are eukaryotes.
Glycolysis The metabolic breakdown of glucose and other sugars that releases
energy in the form of ATP (adenosine triphosphate) and occurs in
nearly all living cells.
Hydrolysis The breaking down of a chemical compound into two or more simpler
compounds by reacting with water.
Hydrophobic Repelling, tending not to combine with, or incapable of dissolving in
water
Mitochondria A structure in nearly all eukaryotic cells in which food molecules
(sugars, fatty acids, and amino acids) are broken down in the presence
of oxygen and converted to energy in the form of ATP (adenosine
triphosphate)
Oxidative The process in cell metabolism in which enzymes in the mitochondria
phosphorylation synthesize ATP (adenosine triphosphate) by oxidation of metabolites.
Proteolysis The breaking down or hydrolysis of proteins into simpler compounds,
as occurs during digestion.
Review of polyphosphates as additives and testing methods for them in scallops and prawns
Campden BRI Report: BC-REP-125846-01 5
Torry Research Station (2001) Polyphosphates in Fish Processing. FAO Corporate
Document Repository. (31).
URL: http://www.fao.org/wairdocs/tan/x5909E/x5909e01.htm
Accessed: January 2012.
3. Polyphosphates review of literature
A review of literature has been undertaken to provide information on polyphosphates. The
review is presented as a list of references (in boxes), with relevant information extracted
beneath. The list of publications is divided into sections according to area of interest;
the chemistry of polyphosphates
the role of naturally occurring polyphosphates
presence and levels of naturally occurring polyphosphates in scallops and prawns
how polyphosphates interact with the product
how polyphosphates breakdown over time and their breakdown products
Each section also includes a summary, which draws together key information for each subject
area.
A list of sources of additional information is provided at the end of the document.
3.1 The chemistry of polyphosphates
The terms phosphate and polyphosphate, used in this review, are defined in the following
documents.
“A phosphate is a salt of phosphoric acid; when a number of simple phosphate units are
linked to form a more complex structure, this is known as a polyphosphate. Phosphates fall
into several categories depending on the length of the phosphate chain:
- Simple phosphates (orthophosphates) - 1 phosphate group
- Pyrophosphates - 2 phosphate groups
- Tripolyphosphates - 3 phosphate groups
- Polyphosphates - 4 or more phosphate groups
Phosphates are additives which are used to improve the quality of many foodstuffs, but
specifically meat and seafood. In regards to seafood it is the longer polyphosphate chains,
tripolyphosphates and polyphosphates, which prove useful in increasing the quality and shelf
life of the product. Most processors use proprietary mixtures containing appropriate
pyrophosphate, triplyphosphate and polyphosphate compounds”.
Review of polyphosphates as additives and testing methods for them in scallops and prawns
Campden BRI Report: BC-REP-125846-01 6
Chen, K.Y. (1999). Study of polyphosphate metabolism in intact cells by 31-P nuclear
magnetic resonance spectroscopy. Progress in Molecular and Subcellular Biology (23)
p253-273.
Lampilla, L.E. (1993). Polyphosphates: Rationale for use and functionality in seafood and
seafood products. Conference Proceedings from the Annual Tropical and Subtropical
Fisheries Technological Conference of the Americas (August 29 - September 1, 1993,
Williamsburg, Virginia, U.S.A.), p13-20
Polyphosphates are naturally occurring polymers (chains) of orthophosphate monomers and
are found in the majority of living things including microorganisms, animals and lower
eukaryotes (e.g. yeast).
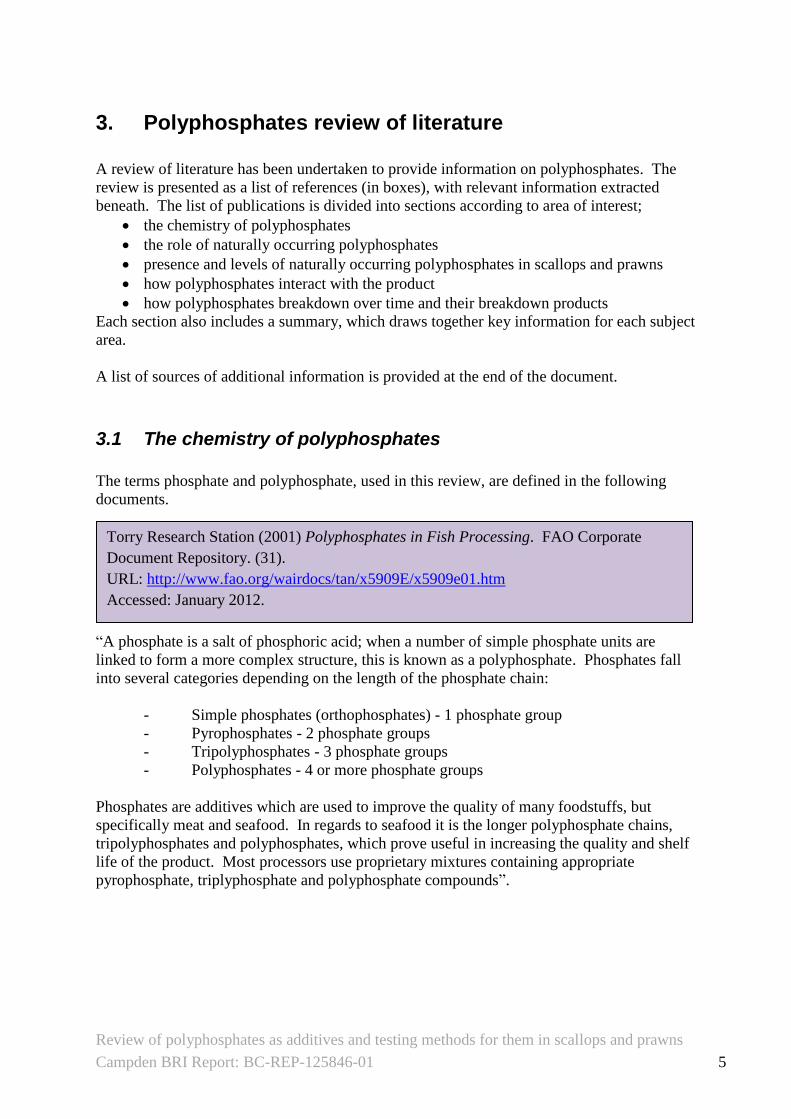
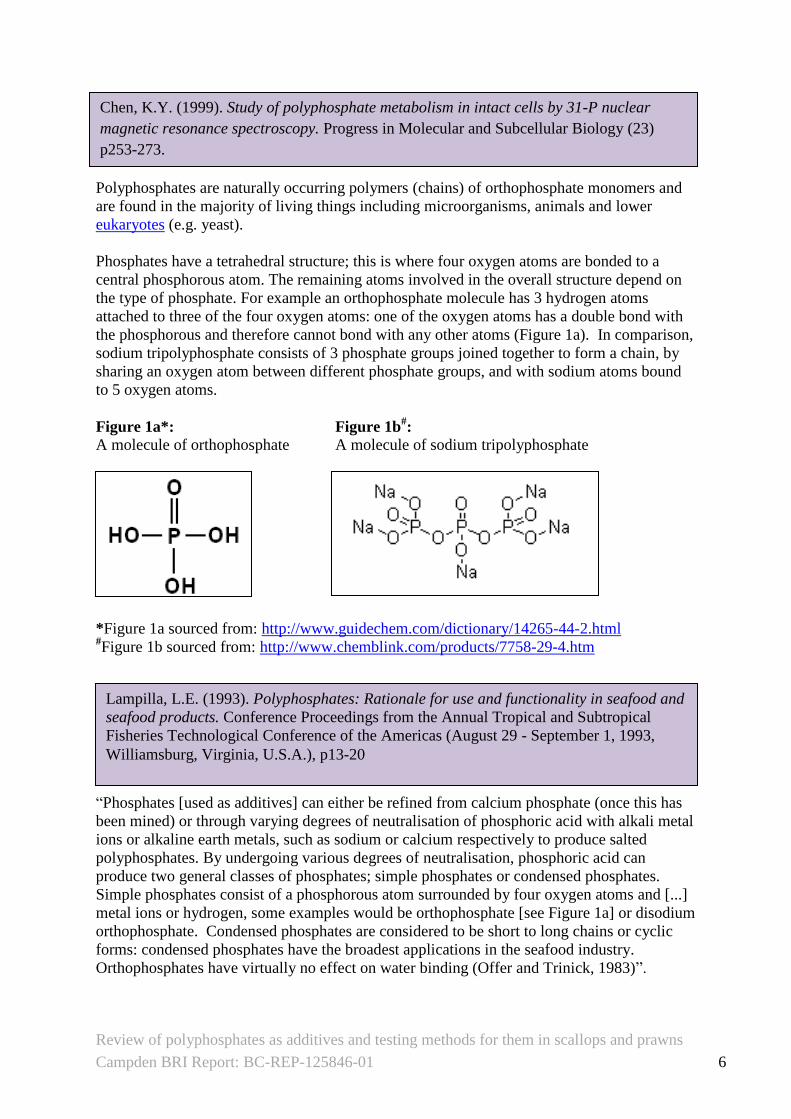
Phosphates have a tetrahedral structure; this is where four oxygen atoms are bonded to a
central phosphorous atom. The remaining atoms involved in the overall structure depend on
the type of phosphate. For example an orthophosphate molecule has 3 hydrogen atoms
attached to three of the four oxygen atoms: one of the oxygen atoms has a double bond with
the phosphorous and therefore cannot bond with any other atoms (Figure 1a). In comparison,
sodium tripolyphosphate consists of 3 phosphate groups joined together to form a chain, by
sharing an oxygen atom between different phosphate groups, and with sodium atoms bound
to 5 oxygen atoms.
Figure 1a*: Figure 1b#:
A molecule of orthophosphate A molecule of sodium tripolyphosphate
*Figure 1a sourced from: http://www.guidechem.com/dictionary/14265-44-2.html #Figure 1b sourced from: http://www.chemblink.com/products/7758-29-4.htm
“Phosphates [used as additives] can either be refined from calcium phosphate (once this has
been mined) or through varying degrees of neutralisation of phosphoric acid with alkali metal
ions or alkaline earth metals, such as sodium or calcium respectively to produce salted
polyphosphates. By undergoing various degrees of neutralisation, phosphoric acid can
produce two general classes of phosphates; simple phosphates or condensed phosphates.
Simple phosphates consist of a phosphorous atom surrounded by four oxygen atoms and [...]
metal ions or hydrogen, some examples would be orthophosphate [see Figure 1a] or disodium
orthophosphate. Condensed phosphates are considered to be short to long chains or cyclic
forms: condensed phosphates have the broadest applications in the seafood industry.
Orthophosphates have virtually no effect on water binding (Offer and Trinick, 1983)”.
Review of polyphosphates as additives and testing methods for them in scallops and prawns
Campden BRI Report: BC-REP-125846-01 7
Gonçalves, A.A. and Ribiero, J.L.D. (2008). Do phosphates improve the seafood quality?
Reality and legislation. Pan-American Journal of Aquatic Sciences. 3(3). p237-247.
Polyphosphates as additives help muscular protein solubilisation and increase the pH (reduce
acidity). Phosphates commonly used as additives are sodium tripolyphosphate alone or in
mixtures with sodium hexametaphosphate or sodium acid pyrophosphate and/or tetrasodium
pyrophosphate. These phosphate compounds have a combination of properties, such as
solubility, chelation of metal ions (which inhibits oxidative processes) and pH adjustment.
3.1.1 Summary
Phosphates occur naturally in all forms of life, and range from orthophosphates (with 1
phosphate group) to polyphosphates (consisting of chains of 4 or more phosphate groups).
Polyphosphates may also include other elements, such as sodium, potassium and calcium to
form compounds such as sodium polyphosphate, potassium polyphosphate and calcium
polyphosphate.
Generally mixtures containing pyrophosphate, tripolyphosphate and polyphosphates are used
as additives in the seafood industry.
Review of polyphosphates as additives and testing methods for them in scallops and prawns
Campden BRI Report: BC-REP-125846-01 8
Wood, H.G. and Clark, J.E. (1988). Biological aspects of inorganic polyphosphates.
Annual Review of Biochemistry. 57. p235-260.
Huss, H.H. (1995). FAO Fisheries Technical Paper 348: Quality changes in fresh fish.
Available at: http://www.fao.org/DOCREP/V7180E/V7180E00.HTM
Accessed: April 2012
3.2 The role of naturally occurring polyphosphates
Chen, K.Y. (1999). Study of polyphosphate metabolism in intact cells by 31-P nuclear
magnetic resonance spectroscopy. Progress in Molecular and Subcellular Biology (23) p253-
273.
"The ubiquitous occurrence, the wide range of content in different organisms, and the
subcellular distribution of polyphosphates all suggest that polyphosphates may have diverse
functions depending on the cell types, organisms, and environments.” Polyphosphates have
been reported to function as an energy storage source, a phosphate reserve, a substrate for
enzymes, a buffer against pH stress, a counter ion to neutralize cationic species in the
vacuole, a component of specific membrane channels for DNA entry and a regulator in
response to environmental stress.
Polyphosphates also play an important role in the regulation of levels of adenosine
triphosphate (ATP), which transports chemical energy within cells for metabolism. ATP
cannot be stored but is continuously recycled (broken down and synthesised) in organisms. It
has been difficult to study the metabolism, regulation and function of polyphosphates for
several reasons, one of which is because they may exist as a mixture of polymers with
varying chain lengths which are constantly broken down and produced during metabolism.
A universal role for polyphosphates in all the organisms in which they are found (including
bacteria, fungi, plants, insects and mammals) has not been demonstrated. Several biological
functions have been proposed, although evidence is largely circumstantial. Part of the
problem has been inadequate methods for studying these polymers, and poor knowledge of
the enzymes involved in polyphosphate metabolism.
Phosphates that are naturally present in muscle tissue play an important role in rigor mortis of
meat and fish. Following death of an animal the degradation of ATP causes a contraction and
stiffening of muscle tissues, which also results in the release of enclosed water from the
muscle tissue.
Review of polyphosphates as additives and testing methods for them in scallops and prawns
Campden BRI Report: BC-REP-125846-01 9
Storey, K.B. (2004). Oxygen Limitation and Metabolic Rate Depression. Functional
Metabolism: Regulation and Adaption. Wiley-Liss, New Jersey. p416-417.
Bailey, D.M., Peck, L.S., Bock, C. and Pörtner, H-O. (2003). High-Energy Phosphate
Metabolism during Exercise and Recovery in Temperate and Antarctic Scallops: An In
Vivo 31P-NMR Study. Physiological and Biochemical Zoology. 76 (5) p622-633.
During low level or sustained medium level intensity exercise ATP is made in the
mitochondria by a process called oxidative phosphorylation. When high intensity or "burst"
exercise is required e.g. when animals escape predators, then oxidative phosphorylation is not
sufficient. There are 2 mechanisms that can be employed to produce enough energy for this
high intensity activity;
o the rapid gathering of muscle phosphate reserves to produce an instant supply of ATP
o by increasing glycolysis, where glucose is broken down to produce ATP
Both of these routes produce sufficient energy to provide a short (usually only a few seconds)
burst of energy which will allow the animal to evade capture. However, by performing these
bursts of energy the amount of end product increases, in scallops the end-product is an opine
called octopine. Octopine is formed from the breakdown of arginine phosphate. The
resulting excess of octopine is not necessarily a bad thing, as an increased amount of octopine
can cause the cellular balance to shift towards the production of ATP: hence giving more
energy to the scallop.
Metabolism involving arginine phosphate degradation and octopine production is generally
only seen in marine life, such as crustaceans and molluscs, while other forms of phosphate
and opine metabolism are used by other species.
Scallops use ATP as an energy source, like all other living organisms. The breaking of bonds
in ATP releases a large amount of energy. There are two different types of metabolism in
scallops, anaerobic (not requiring oxygen) and aerobic (requiring oxygen). In scallops, the
ATP used during muscular activity is initially regenerated by the breakdown of phospho-L-
arginine (PLA) followed by anaerobic and aerobic production of ATP. In anaerobic
metabolism, octopine is formed from pyruvate, arginine and NADH; this is equivalent to the
pyruvate to lactate pathway of vertebrates.
3.2.1 Summary
Polyphosphates play an active role in metabolism, in particular adenosine triphosphate (ATP)
which is used as cellular energy, as a large amount of energy is released when it is broken
down. In crustaceans and molluscs ATP can be generated in a pathway particular to these
species, involving phospho-L-arginine, octopine and pyruvate. The study of polyphosphates
has been difficult as they may exist as a mixture of polymers with varying chain lengths
which are constantly broken down and produced during metabolism.
Review of polyphosphates as additives and testing methods for them in scallops and prawns
Campden BRI Report: BC-REP-125846-01 10
Canadian Food Inspection Agency (2011). Appendix 3 Canadian Guidelines for Chemical
Contaminants and Toxins in Fish and Fish Products. Product Inspection of Fish and
Seafood. (online) Available at :
http://www.inspection.gc.ca/english/fssa/fispoi/man/samnem/app3e.shtml
Accessed: January 2012.
3.3 Presence and levels of naturally occurring polyphosphates in scallops and prawns
Little information is available in the literature about the naturally occurring levels of
phosphates in crustaceans and molluscs; this is because levels change rapidly depending on
temperature, pH, storage conditions and/or enzyme activity. There are also differences
between levels in different species, between individuals of the same species (Gibson and
Murray, 1973) and between the same species but in different geographical locations.
Differences can additionally occur depending on how the animals have been caught and
handled.
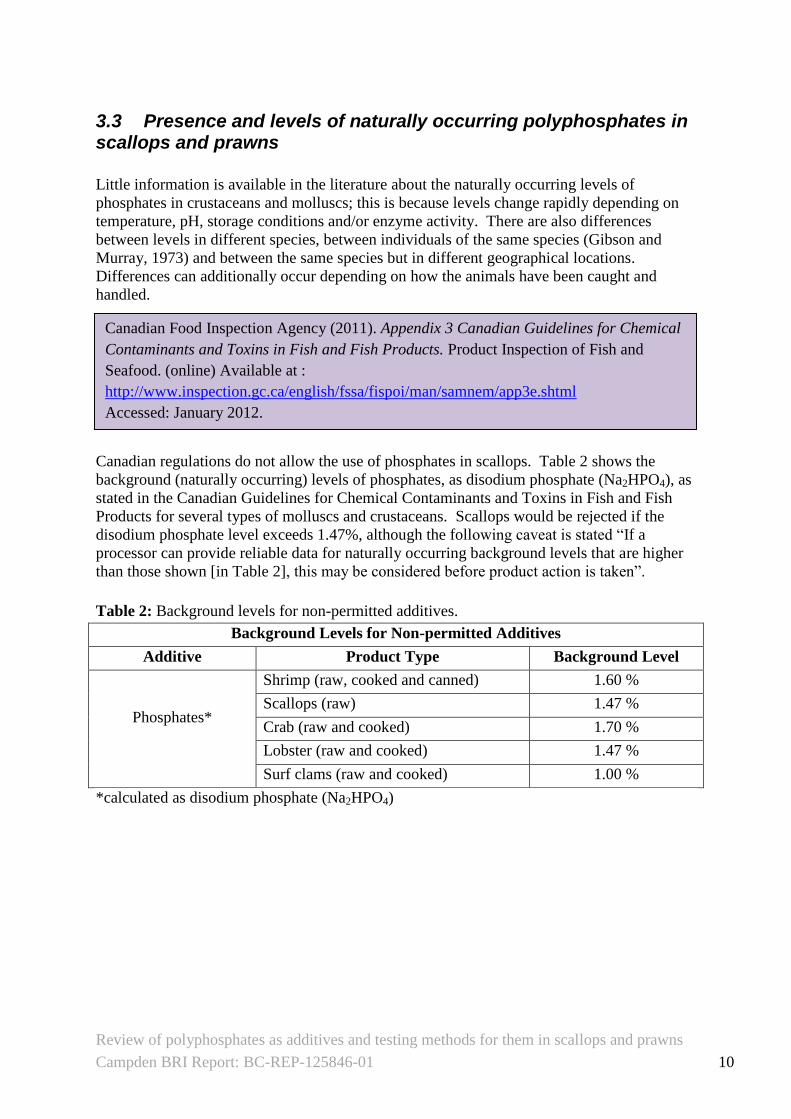
Canadian regulations do not allow the use of phosphates in scallops. Table 2 shows the
background (naturally occurring) levels of phosphates, as disodium phosphate (Na2HPO4), as
stated in the Canadian Guidelines for Chemical Contaminants and Toxins in Fish and Fish
Products for several types of molluscs and crustaceans. Scallops would be rejected if the
disodium phosphate level exceeds 1.47%, although the following caveat is stated “If a
processor can provide reliable data for naturally occurring background levels that are higher
than those shown [in Table 2], this may be considered before product action is taken”.
Table 2: Background levels for non-permitted additives.
Background Levels for Non-permitted Additives
Additive Product Type Background Level
Phosphates*
Shrimp (raw, cooked and canned) 1.60 %
Scallops (raw) 1.47 %
Crab (raw and cooked) 1.70 %
Lobster (raw and cooked) 1.47 %
Surf clams (raw and cooked) 1.00 %
*calculated as disodium phosphate (Na2HPO4)
Review of polyphosphates as additives and testing methods for them in scallops and prawns
Campden BRI Report: BC-REP-125846-01 11
National Oceanic and Atmospheric Administration. (2011). Inspection Manual 25:
Seafood Inspection Programme, Chapter 4: Policies, Procedures, and Requirements for the
Audit of Fisheries Products on a Lot by Lot Basis: Product (Lot) Inspection Procedures –
Scallop moisture determination.
Available at:
http://www.seafood.nmfs.noaa.gov/NOAA%20Handbook25/Scallop_Moisture.html
Accessed: April 2012.
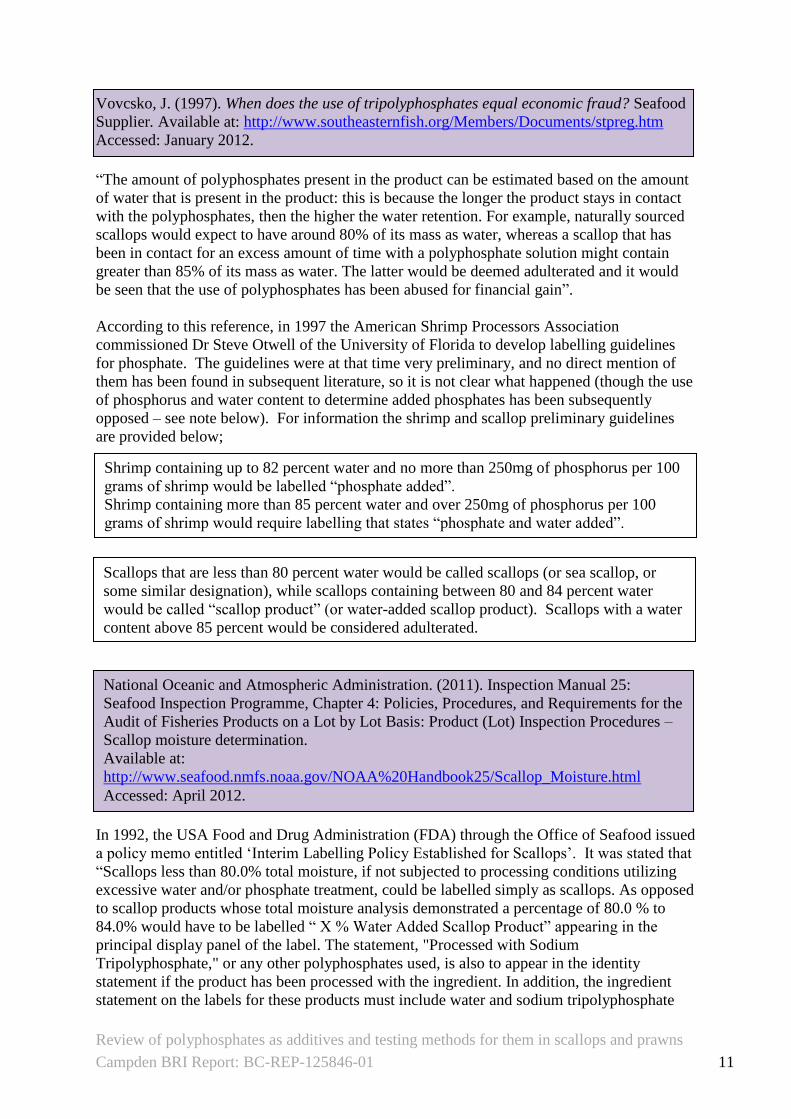
Vovcsko, J. (1997). When does the use of tripolyphosphates equal economic fraud? Seafood
Supplier. Available at: http://www.southeasternfish.org/Members/Documents/stpreg.htm
Accessed: January 2012.
“The amount of polyphosphates present in the product can be estimated based on the amount
of water that is present in the product: this is because the longer the product stays in contact
with the polyphosphates, then the higher the water retention. For example, naturally sourced
scallops would expect to have around 80% of its mass as water, whereas a scallop that has
been in contact for an excess amount of time with a polyphosphate solution might contain
greater than 85% of its mass as water. The latter would be deemed adulterated and it would
be seen that the use of polyphosphates has been abused for financial gain”.
According to this reference, in 1997 the American Shrimp Processors Association
commissioned Dr Steve Otwell of the University of Florida to develop labelling guidelines
for phosphate. The guidelines were at that time very preliminary, and no direct mention of
them has been found in subsequent literature, so it is not clear what happened (though the use
of phosphorus and water content to determine added phosphates has been subsequently
opposed – see note below). For information the shrimp and scallop preliminary guidelines
are provided below;
In 1992, the USA Food and Drug Administration (FDA) through the Office of Seafood issued
a policy memo entitled ‘Interim Labelling Policy Established for Scallops’. It was stated that
“Scallops less than 80.0% total moisture, if not subjected to processing conditions utilizing
excessive water and/or phosphate treatment, could be labelled simply as scallops. As opposed
to scallop products whose total moisture analysis demonstrated a percentage of 80.0 % to
84.0% would have to be labelled “ X % Water Added Scallop Product” appearing in the
principal display panel of the label. The statement, "Processed with Sodium
Tripolyphosphate," or any other polyphosphates used, is also to appear in the identity
statement if the product has been processed with the ingredient. In addition, the ingredient
statement on the labels for these products must include water and sodium tripolyphosphate
Shrimp containing up to 82 percent water and no more than 250mg of phosphorus per 100
grams of shrimp would be labelled “phosphate added”.
Shrimp containing more than 85 percent water and over 250mg of phosphorus per 100
grams of shrimp would require labelling that states “phosphate and water added”.
Scallops that are less than 80 percent water would be called scallops (or sea scallop, or
some similar designation), while scallops containing between 80 and 84 percent water
would be called “scallop product” (or water-added scallop product). Scallops with a water
content above 85 percent would be considered adulterated.
Review of polyphosphates as additives and testing methods for them in scallops and prawns
Campden BRI Report: BC-REP-125846-01 12
Þórarinsdóttir, K.A., Arason, S. and Þorkelsson, G. (2010). The role and fate of added
phosphates in salted cod products. Icelandic Food and Biotech R&D, Report Summary,
Matís. July 2010. p1-28.
(or other phosphate, as appropriate). Products having a moisture content over 84.0 % were
considered adulterated”. In 2004 the FDA rescinded the Interim Labelling Policy of 1992, so
the percentages used for defining labelling statements above are no longer being enforced.
The National Oceanic and Atmospheric Administration Inspection Manual (2011) also states
that “because of the concern over improper labelling or misuse of the process, the Seafood
Inspection Program will continue to require that all lots of scallops over 200 pounds destined
for domestic use be tested for total moisture [...]. The results of the analysis will be noted on
the certificate, score sheet or memorandum. If the inspector has definitive knowledge that the
product has been treated in some way to add water to the product, the label must reflect that.
Also if the product tests over 83.0 % for total moisture, the SIP will assume that the product
has been treated and must be properly labelled. This assumption is based on studies and data
collected by various governmental agencies, academia, and other organizations that have
demonstrated total moisture content of scallops consistently less than 83%. At this time there
is no upper limit for moisture content”.
N.B. The use of water content alone to prove adulteration of scallops with polyphosphates
has been opposed by other authors; due to great variations in moisture content in scallop meat
depending on the species, seasonality, harvest practices and geographical location (Botta and
Cahill, 1993).
“Protein rich foods, such as seafood products, include phosphorus containing compounds
such as nucleotides, phospholipids and naturally occurring orthophosphates. There is
approximately 0.11-4.8% naturally occurring orthophosphates in seafood, dependant on their
regional location and composition to name but a few: this makes detection of added
phosphates difficult.
The quantification of phosphate alone cannot be used to verify the presence of added
phosphates due to naturally occurring orthophosphates and other varying phosphorous
compounds (e.g. phospholipids). There is also large variation in phosphorous content
between individuals within a species. The level of phosphate compound added to the product
can be estimated using the phosphate to protein ratio, which is used to calculate the difference
between the total phosphorous and the phosphorous bound to proteins. The protein content
depends upon the concentration of nitrogen in meat products”.
The protein content of meat is calculated based on the nitrogen content (measured by
Kjeldahl method) and using a conversion factor (typically 6.25 for the determination of crude
protein in foods). Codex (2003) state that a specific nitrogen factor for scallops needs to be
developed, and that this would require considerable time, labour and expense. However, a
Code of Practice on the Declaration of Fish Content in Fish Products (1998) does provide
interim nitrogen factors for several fish and shellfish species, including prawn, shrimp,
scallops and queens. For more details on protein content determination and the use of
nitrogen factors, see section 4.1.2.
Review of polyphosphates as additives and testing methods for them in scallops and prawns
Campden BRI Report: BC-REP-125846-01 13
3.3.1 Summary
All seafood contains naturally occurring levels of phosphates and therefore phosphorus. It is
difficult to determine the level of added polyphosphates by measuring phosphate or
phosphorus alone, due to the large variation in naturally present levels.
It has been proposed that a measure of moisture content could be used to determine when
polyphosphates have been added to seafood products, but like phosphate, moisture content
varies greatly making this method alone unsuitable.
An estimation of polyphosphate levels using the phosphate to protein ratio has also been
proposed, but to calculate the protein content of scallops the interim nitrogen conversion
factors for scallops may need to be examined, which could involve considerable time, labour
and expense.
Review of polyphosphates as additives and testing methods for them in scallops and prawns
Campden BRI Report: BC-REP-125846-01 14
Gonçalves, A.A. and Ribiero, J.L.D. (2008). Do phosphates improve the seafood quality?
Reality and legislation. Pan-American Journal of Aquatic Sciences. 3(3). p237-247.
3.4 How polyphosphates interact with the product
Although much work has been conducted on the effects of polyphosphate treatment on food
products including meat and seafood, the actual mechanism of the action of polyphosphates
on proteins is not well understood. It is however known that the water holding capacity of a
proteinaceous food involves interactions between the protein and water; increased water
holding capacity is hypothesised to be due, in part, to increased space between muscle fibres,
creating more capacity for water holding.
Work looking at the microstructure of whole-muscle processed meats, which have been
tumbled with sodium chloride and polyphosphate solutions, has shown that a surface layer of
coagulated (solid) protein forms. This helps to hold the water within the muscle (Velinov,
Zhikov and Cassens, 1990). Sutton (1973), used phase contrast microscopy to show that
tripolyphosphate disrupts the close-packed arrangement of the protein molecules in natural
cod muscle, by altering the conformation of the proteins. Others have shown that addition of
polyphosphates results in swelling of muscle fibres (Offer and Trinick, 1983) and
solubilisation of muscle proteins which increases their dispersion (Lewis, Groves and
Holgate, 1986). Polyphosphates have also been shown to sequester metal ions, which inhibits
oxidative processes (Dziezak, 1990) and alter the pH of meat (Trout and Schmidt, 1984).
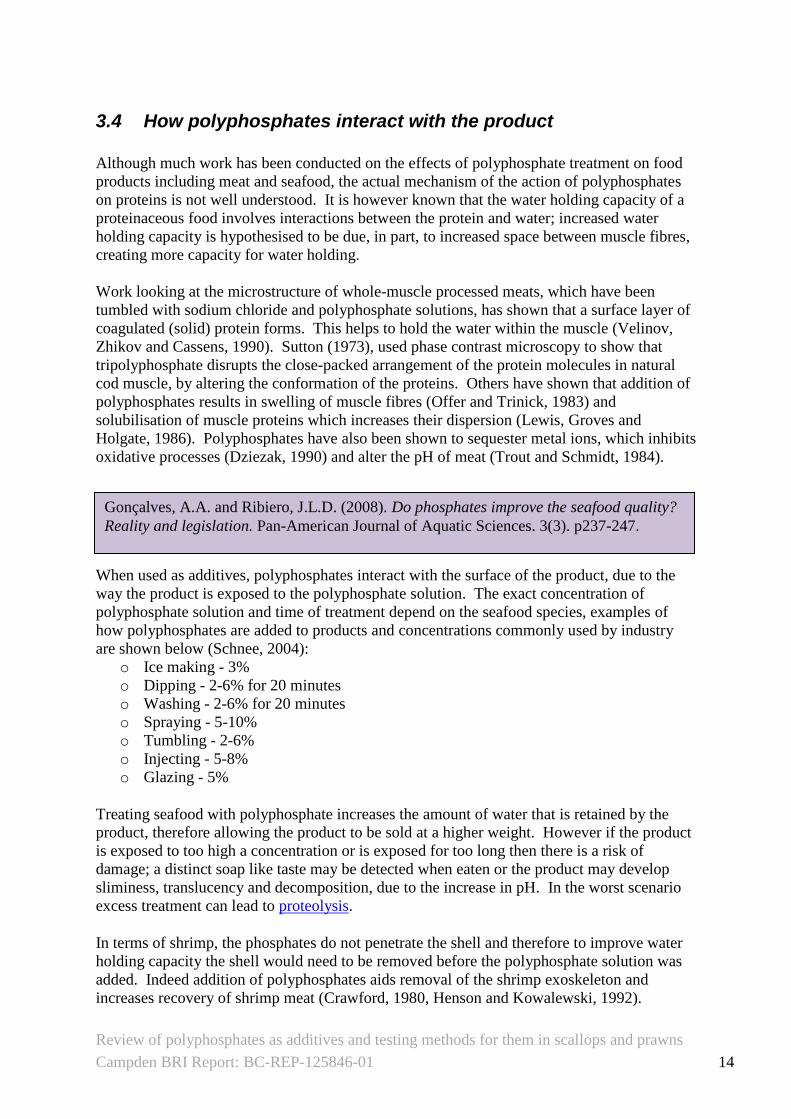
When used as additives, polyphosphates interact with the surface of the product, due to the
way the product is exposed to the polyphosphate solution. The exact concentration of
polyphosphate solution and time of treatment depend on the seafood species, examples of
how polyphosphates are added to products and concentrations commonly used by industry
are shown below (Schnee, 2004):
o Ice making - 3%
o Dipping - 2-6% for 20 minutes
o Washing - 2-6% for 20 minutes
o Spraying - 5-10%
o Tumbling - 2-6%
o Injecting - 5-8%
o Glazing - 5%
Treating seafood with polyphosphate increases the amount of water that is retained by the
product, therefore allowing the product to be sold at a higher weight. However if the product
is exposed to too high a concentration or is exposed for too long then there is a risk of
damage; a distinct soap like taste may be detected when eaten or the product may develop
sliminess, translucency and decomposition, due to the increase in pH. In the worst scenario
excess treatment can lead to proteolysis.
In terms of shrimp, the phosphates do not penetrate the shell and therefore to improve water
holding capacity the shell would need to be removed before the polyphosphate solution was
added. Indeed addition of polyphosphates aids removal of the shrimp exoskeleton and
increases recovery of shrimp meat (Crawford, 1980, Henson and Kowalewski, 1992).
Review of polyphosphates as additives and testing methods for them in scallops and prawns
Campden BRI Report: BC-REP-125846-01 15
Taylor, P.G. (1993). The application of phosphates in the processing of the pacific shrimp,
or what's so different about this use? Conference Proceedings from the Annual Tropical
and Subtropical Fisheries Technological Conference of the Americas (August 29 -
September 1, 1993, Williamsburg, Virginia, U.S.A.), p.72-77.
Crawford, D.L. (1980). Meat yield and shell removal functions of shrimp processing.
Oregon State University Extension Marine Advisory Program. Land Grant/Sea Grant
Cooperative Special Report 597. Available at:
http://ir.library.oregonstate.edu/xmlui/bitstream/handle/1957/4804/SR%20no.%20597_ocr
.pdf?sequence=1
Accessed: February 2012
Scallops have been treated with sodium tripolyphosphate at concentrations of 10% or 4% for
1 and 20 minutes respectively and 2.5% until the scallops reach a level not exceeding 86%
moisture. The polyphosphate solution was administered in the presence of low levels (1%
concentration) of sodium chloride. These treatments were found to be efficient at reducing
drip loss between freezing and defrosting, as well as improving the water holding capacity of
the product (Rippen et al. 1993). The addition of sodium chloride along with phosphates has
been shown to improve both the interaction with protein and the distribution of flavour
(Lampilla, 1992).
Keeping pacific shrimp on ice for three to four days after catching improves the ability of
mechanical peelers to remove the shell from the meat. This is due to the enzymatic action
degrading the connective tissue between the musculature and the shell. This however can
result in the loss of some solubilised tissues upon separation and washing.
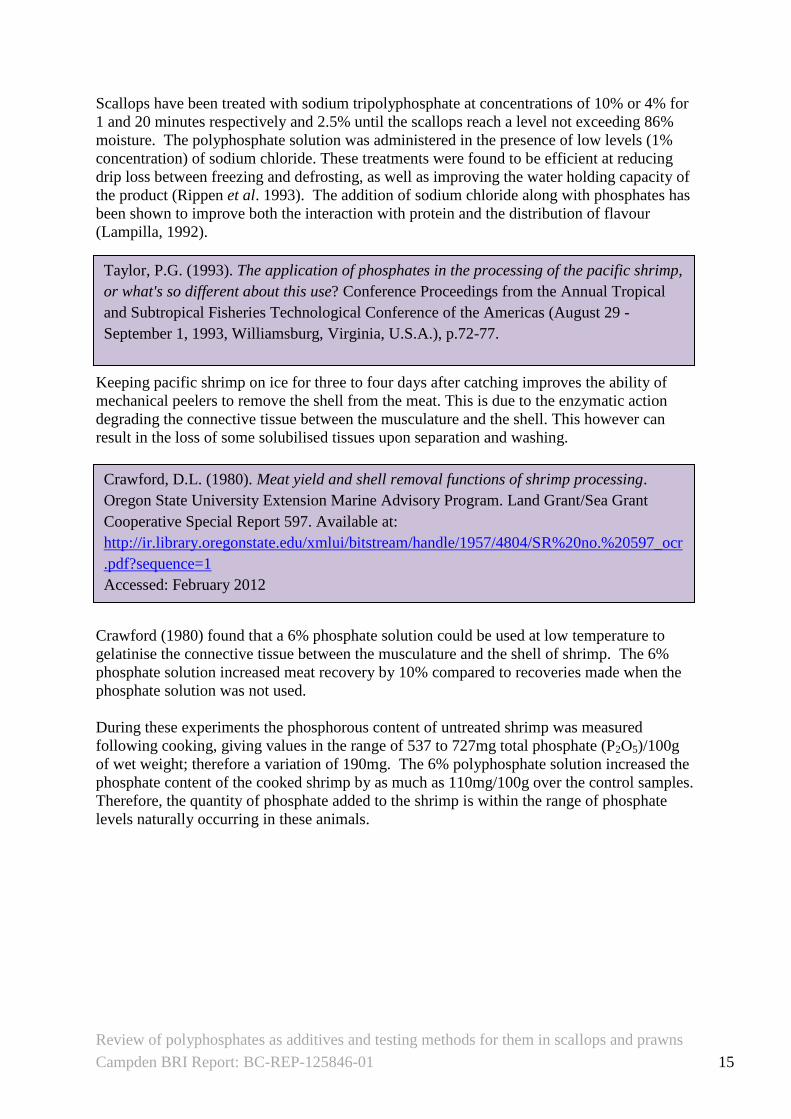
Crawford (1980) found that a 6% phosphate solution could be used at low temperature to
gelatinise the connective tissue between the musculature and the shell of shrimp. The 6%
phosphate solution increased meat recovery by 10% compared to recoveries made when the
phosphate solution was not used.
During these experiments the phosphorous content of untreated shrimp was measured
following cooking, giving values in the range of 537 to 727mg total phosphate (P2O5)/100g
of wet weight; therefore a variation of 190mg. The 6% polyphosphate solution increased the
phosphate content of the cooked shrimp by as much as 110mg/100g over the control samples.
Therefore, the quantity of phosphate added to the shrimp is within the range of phosphate
levels naturally occurring in these animals.
Review of polyphosphates as additives and testing methods for them in scallops and prawns
Campden BRI Report: BC-REP-125846-01 16
Þórarinsdóttir, K.A., Arason, S. and Þorkelsson, G. (2010). The role and fate of added
phosphates in salted cod products. Icelandic Food and Biotech R&D, Report Summary,
Matís. July 2010. p1-28.
Ünal, S.B., Erdo, F., Ekiz, H.B. and Özdemir, Y. (2004). Experimental theory,
fundamentals and mathematical evaluation of phosphate diffusion in meat. Journal of Food
Engineering. 65(2). p263-272.
Lampilla, L.E. (1993). Polyphosphates: Rationale for use and functionality in seafood and
seafood products. Conference Proceedings from the Annual Tropical and Subtropical
Fisheries Technological Conference of the Americas (August 29 - September 1, 1993,
Williamsburg, Virginia, U.S.A.), p13-20
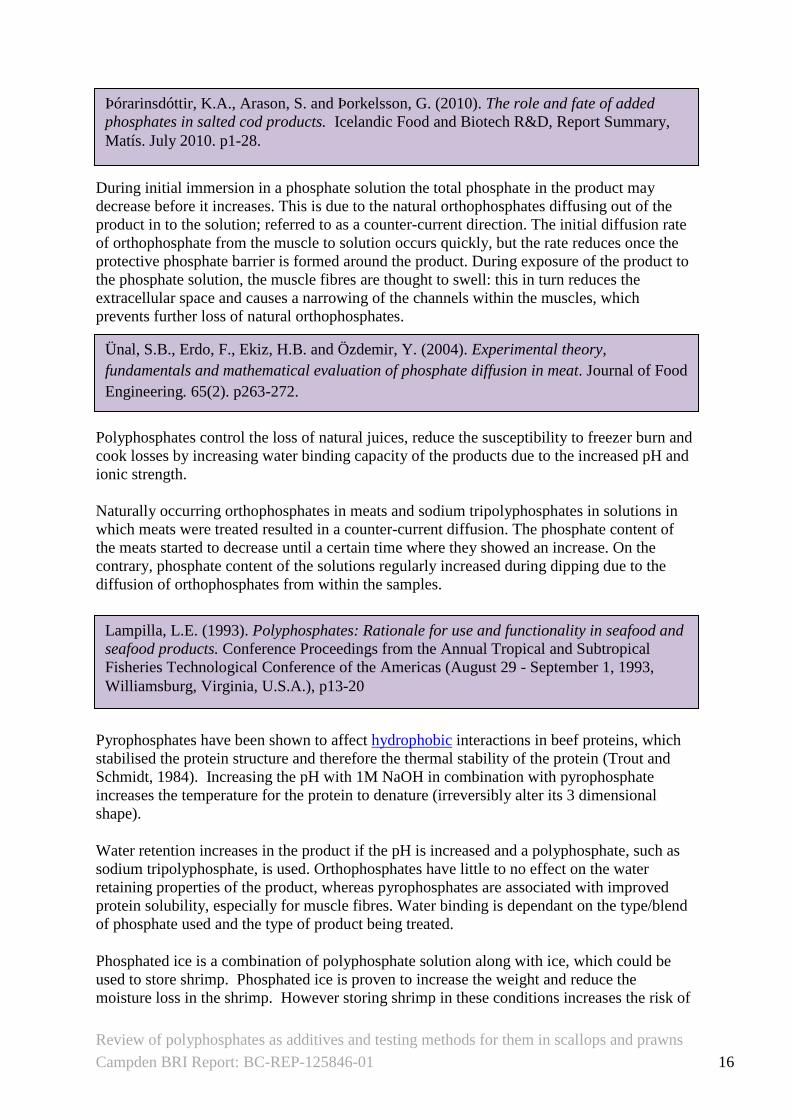
During initial immersion in a phosphate solution the total phosphate in the product may
decrease before it increases. This is due to the natural orthophosphates diffusing out of the
product in to the solution; referred to as a counter-current direction. The initial diffusion rate
of orthophosphate from the muscle to solution occurs quickly, but the rate reduces once the
protective phosphate barrier is formed around the product. During exposure of the product to
the phosphate solution, the muscle fibres are thought to swell: this in turn reduces the
extracellular space and causes a narrowing of the channels within the muscles, which
prevents further loss of natural orthophosphates.
Polyphosphates control the loss of natural juices, reduce the susceptibility to freezer burn and
cook losses by increasing water binding capacity of the products due to the increased pH and
ionic strength.
Naturally occurring orthophosphates in meats and sodium tripolyphosphates in solutions in
which meats were treated resulted in a counter-current diffusion. The phosphate content of
the meats started to decrease until a certain time where they showed an increase. On the
contrary, phosphate content of the solutions regularly increased during dipping due to the
diffusion of orthophosphates from within the samples.
Pyrophosphates have been shown to affect hydrophobic interactions in beef proteins, which
stabilised the protein structure and therefore the thermal stability of the protein (Trout and
Schmidt, 1984). Increasing the pH with 1M NaOH in combination with pyrophosphate
increases the temperature for the protein to denature (irreversibly alter its 3 dimensional
shape).
Water retention increases in the product if the pH is increased and a polyphosphate, such as
sodium tripolyphosphate, is used. Orthophosphates have little to no effect on the water
retaining properties of the product, whereas pyrophosphates are associated with improved
protein solubility, especially for muscle fibres. Water binding is dependant on the type/blend
of phosphate used and the type of product being treated.
Phosphated ice is a combination of polyphosphate solution along with ice, which could be
used to store shrimp. Phosphated ice is proven to increase the weight and reduce the
moisture loss in the shrimp. However storing shrimp in these conditions increases the risk of
Review of polyphosphates as additives and testing methods for them in scallops and prawns
Campden BRI Report: BC-REP-125846-01 17
Gonçalves, A.A and Ribiero, J.L.D. (2008). Do phosphates improve the seafood quality?
Reality and legislation. Pan-American Journal of Aquatic Sciences. 3(3). p237-247
Tenhet, V., Finne, G., Nickelson., R. and Toloday, D. (1981). Penetration of sodium
tripolyphosphate into fresh and prefrozen peeled and deveined shrimp. Journal of Food
Science, 46. p344-349
Torry Research Station (2001). Catching and Processing Scallops and Queens. FAO
Corporate Document Repository. (46).
Available at: http://www.fao.org/wairdocs/tan/x5923E/x5923e01.htm
Accessed: February 2012.
the products being over exposed to polyphosphates, if they are treated again during further
processing, which could result in a soapy flavour and/or physical quality defects such as
sliminess or translucency.
Due to the highly perishable nature of shrimp it is crucial that the additive is added quickly
and at low temperatures. The low temperature should also help with the solubility of the
polyphosphates.
“The distribution of sodium tripolyphosphate (STP) in peeled and deveined shrimp tails after
treatment was investigated using radioactive (P32
) labelled STP. When shrimp were treated
in 0.5% and 1% STP solutions, a phosphate concentration gradient was evident in the shrimp
muscle. After such treatments, STP was shown to accumulate on the surface of the muscle,
preventing further STP uptake. At higher STP concentrations (5% and 10% solutions)
prolonged time treatments (5 and 20 minutes) overcame the concentration gradient as STP
became equally distributed through the shrimp muscle (4.8mm)”.
So penetration of phosphate solution into shrimp muscle depends on the concentration of
phosphate in the solution, time of application and the thickness of the muscle.
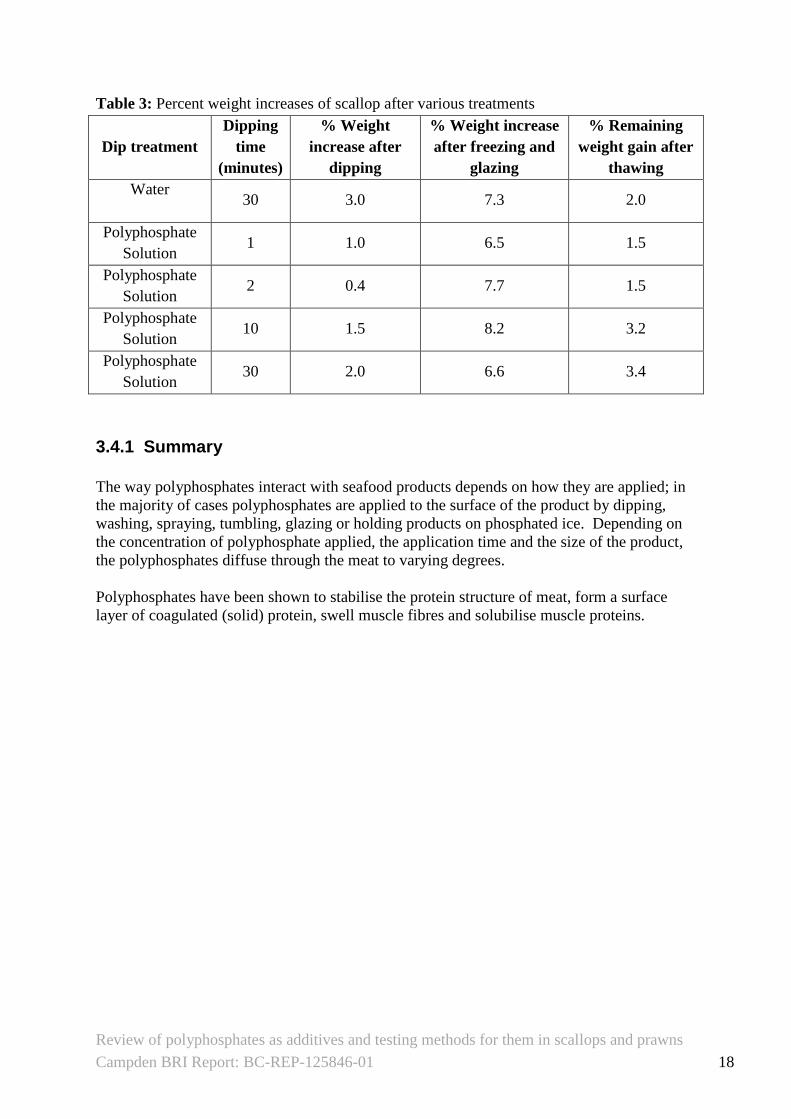
Table 3 shows that dipping scallops in water alone (without addition of polyphosphate) will
increase the weight of the scallops after dipping, after freezing and glazing, and after
thawing. Differing concentrations of polyphosphate solutions also increase the weight of
scallops, but to varying degrees; i.e. polyphosphate treatment for 1 minute increased the
weight of scallops, but the increase is less than the controls treated with water. When scallops
were dipped in polyphosphate solution for 2 minutes the weight increased after dipping, but
was actually lower than scallops dipped for 1 minute. This is thought to be due to the counter
current diffusion of the orthophosphates from the product into the polyphosphate solution.
Both the 10 minute and 30 minute treatments show a significant percentage weight increase
over all other treatments following thawing, however scallops treated with polyphosphate for
30 minutes had less weight increase after freezing and glazing than those treated with water.
This may be due to proteolysis (breakdown of proteins) due to over exposure.
Review of polyphosphates as additives and testing methods for them in scallops and prawns
Campden BRI Report: BC-REP-125846-01 18
Table 3: Percent weight increases of scallop after various treatments
Dip treatment
Dipping
time
(minutes)
% Weight
increase after
dipping
% Weight increase
after freezing and
glazing
% Remaining
weight gain after
thawing
Water
30 3.0 7.3 2.0
Polyphosphate
Solution 1 1.0 6.5 1.5
Polyphosphate
Solution 2 0.4 7.7 1.5
Polyphosphate
Solution 10 1.5 8.2 3.2
Polyphosphate
Solution 30 2.0 6.6 3.4
3.4.1 Summary
The way polyphosphates interact with seafood products depends on how they are applied; in
the majority of cases polyphosphates are applied to the surface of the product by dipping,
washing, spraying, tumbling, glazing or holding products on phosphated ice. Depending on
the concentration of polyphosphate applied, the application time and the size of the product,
the polyphosphates diffuse through the meat to varying degrees.
Polyphosphates have been shown to stabilise the protein structure of meat, form a surface
layer of coagulated (solid) protein, swell muscle fibres and solubilise muscle proteins.
Review of polyphosphates as additives and testing methods for them in scallops and prawns
Campden BRI Report: BC-REP-125846-01 19
Torry Research Station (2001). Polyphosphates in Fish Processing. FAO Corporate
Document Repository. (31).
Available at: http://www.fao.org/wairdocs/tan/x5909E/x5909e01.htm
Accessed: January 2012.
Tenhet, V., Finne, G., Nickelson., R. and Toloday, D. (1981). Penetration of sodium
tripolyphosphate into fresh and prefrozen peeled and deveined shrimp. Journal of Food
Science, 46, p344-349.
Taylor, P.G. (1993). The application of phosphates in the processing of the pacific shrimp,
or what's so different about this use? Conference Proceedings from the Annual Tropical
and Subtropical Fisheries Technological Conference of the Americas (August 29 -
September 1, 1993, Williamsburg, Virginia, U.S.A.), p.72-77.
Kaufmann, A., Maden, K., Leisser, W., Matera, M. & Gude, T. (2005). Analysis of
polyphosphates in fish and shrimps tissues by two different ion chromatography methods:
Implications on false-negative and -positive findings. Food Additives and Contaminants
22(11). p1073–1082.
3.5 How polyphosphates breakdown over time and their breakdown products
“Most polyphosphates added to food are broken down to single phosphate units
(orthophosphates) in the stomach when the food is eaten; indeed, many are converted to
single units in the food before it is eaten, for example in chill storage or during cooking.”
Experiments showed that after two weeks of frozen storage only 12% of the total
phosphorous in uncooked shrimp muscle corresponded to the originally added
tripolyphosphate. By ten weeks of frozen storage the phosphorous levels corresponded to
45% orthophosphate. This is probably due to naturally occurring hydrolysis; there was no
heat treatment to facilitate the hydrolysis of the tripolyphosphates.
At elevated temperatures, such as in steam cooking, sodium tripolyphosphates will be quickly
and efficiently hydrolysed to orthophosphates, which are one of the natural phosphates found
in muscle. Orthophosphates, unlike polyphosphates, are not involved in water binding and
therefore do nothing to improve the water retention of meat.
Analysis using ion chromatography measured the stability of the polyphosphates in fish and
shrimps under the following conditions; untreated, treated, 1 day after treatment, 2 days after
treatment and 3 days after treatment. In raw shrimps kept at 4oC the level of polyphosphate
drops from approximately 1500mg P2O5/kg to zero after 4 days. However in previously
cooked shrimp treated with polyphosphate after cooking, no degradation of polyphosphates
was observed. Initial concentrations of polyphosphates measured in cooked, treated shrimps
were higher than in raw, treated shrimps; 2600mg P2O5/kg and 1500mg P2O5/kg respectively.
Review of polyphosphates as additives and testing methods for them in scallops and prawns
Campden BRI Report: BC-REP-125846-01 20
Heitkemper, D.T., Kaine, L. A., Jackson, D.S., and Wolnik. K. A. (1993). Determination
of tripolyphosphate and related hydrolysis products in processed shrimp, as published in
the Conference Proceedings from the Annual Conference Tropical and Subtropical
Fisheries Technological Conference of the Americas (August 29 - September 1, 1993,
Williamsburg, Virginia, U.S.A.), p92-101.
This was considered to be due to rapid enzymatic degradation of polyphosphate in the raw
shrimps by the action of the enzyme phosphatase. Whereas the lack of degradation in the
cooked shrimp was thought to be due to the inactivation of phosphatase during the cooking
procedure.
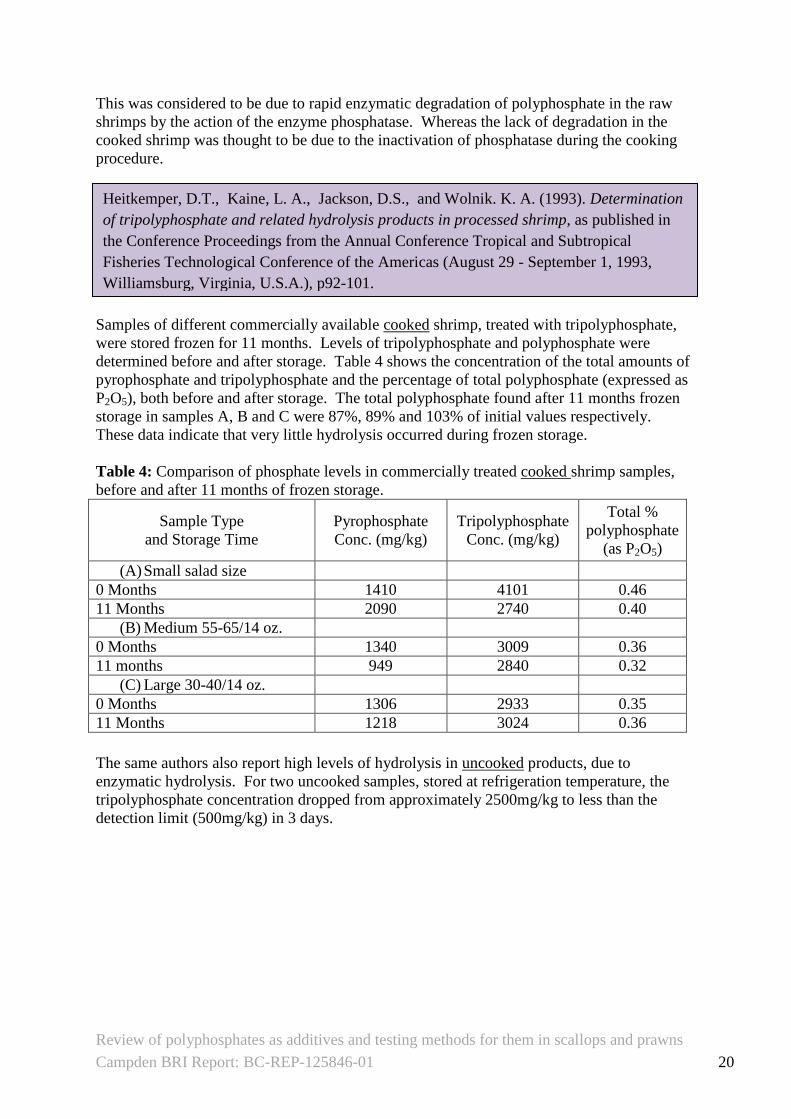
Samples of different commercially available cooked shrimp, treated with tripolyphosphate,
were stored frozen for 11 months. Levels of tripolyphosphate and polyphosphate were
determined before and after storage. Table 4 shows the concentration of the total amounts of
pyrophosphate and tripolyphosphate and the percentage of total polyphosphate (expressed as
P2O5), both before and after storage. The total polyphosphate found after 11 months frozen
storage in samples A, B and C were 87%, 89% and 103% of initial values respectively.
These data indicate that very little hydrolysis occurred during frozen storage.
Table 4: Comparison of phosphate levels in commercially treated cooked shrimp samples,
before and after 11 months of frozen storage.
Sample Type
and Storage Time
Pyrophosphate
Conc. (mg/kg)
Tripolyphosphate
Conc. (mg/kg)
Total %
polyphosphate
(as P2O5)
(A) Small salad size
0 Months 1410 4101 0.46
11 Months 2090 2740 0.40
(B) Medium 55-65/14 oz.
0 Months 1340 3009 0.36
11 months 949 2840 0.32
(C) Large 30-40/14 oz.
0 Months 1306 2933 0.35
11 Months 1218 3024 0.36
The same authors also report high levels of hydrolysis in uncooked products, due to
enzymatic hydrolysis. For two uncooked samples, stored at refrigeration temperature, the
tripolyphosphate concentration dropped from approximately 2500mg/kg to less than the
detection limit (500mg/kg) in 3 days.
Review of polyphosphates as additives and testing methods for them in scallops and prawns
Campden BRI Report: BC-REP-125846-01 21
Sutton, A.H (1973). The hydrolysis of sodium triphosphate in cod and beef muscle. Journal
of Food Technology. 8. p185-195.
Tripolyphosphates were shown to rapidly hydrolyse to pyrophosphate and then to
orthophosphate in uncooked muscle due to the action of phosphatase at both 0 and 25oC.
The rate at which tripolyphosphate breaks down is very rapid at 25oC although it still
degrades at 0oC, though at a significantly reduced rate. In raw cod held at 0˚C,
pyrophosphate was no longer detected after 30-40 hours, however orthophosphate remained
detectable.
3.5.1 Summary
Polyphosphates are broken down into pyrophosphates and eventually into single phosphate
units (orthophosphates). Hydrolysis (breakdown) of polyphosphates occurs in many products
(including meat and seafood) due to the activity of naturally occurring enzymes called
phosphatases.
In uncooked products (shrimp and other seafood) the rate of hydrolysis increases with
increasing temperature. Tripolyphosphate levels have been shown to decrease below the
limit of detection (500mg/kg) even at 0˚C within 2-3 days.
In cooked products, very little hydrolysis occurs in frozen storage even up to 11 months.
This is thought to be due to phosphatases being inactivated during cooking.
Review of polyphosphates as additives and testing methods for them in scallops and prawns
Campden BRI Report: BC-REP-125846-01 22
4. Review of testing methods for polyphosphates A review of literature has been undertaken to provide information on methods for detection
of added phosphates in scallops and prawns. The review is presented in sections according to
the type of method:
Classical methods
o Moisture content
o Protein content
o Quantification of phosphorus
o Calculation of ratios
Chromatographic methods
o Thin layer chromatography
o Ion chromatography
Capillary electrophoresis
o Capillary isotachophoresis
Research methods
o Nuclear magnetic resonance
o Thermo-differential-photometry
o Microwave dielectric spectra
Each section includes a summary of the theory behind the method and, where appropriate, a
table describing use of the method for relevant sample types, showing limits, reporting units
and references in which the method has been used. Information on the advantages and
disadvantages of each method is also presented.
4.1 Classical methods
Classical methods, also known as wet chemistry methods, are generally conducted at the
laboratory bench and do not require sophisticated analytical equipment. The following
sections describe determination of moisture and protein contents, quantification of
phosphorus (the use of a spectrophotometer for this method in recent time’s means it is not
strictly a ‘classical method’ nowadays) and the calculation of ratios to estimate the quantity
of added phosphates based on results from these analyses.
4.1.1 Moisture content
The moisture content of foodstuffs (and many other sample types) is generally determined by
gravimetric loss of water from the sample following drying in an oven (AOAC, 2011).
Results are reported as a percentage by mass.
Codex Alimentarius Commission (2003) provides a summary of the issues with the use of
moisture content to determine whether water has been added to scallops; the establishment of
a moisture content limit is discussed. The idea is that above a particular moisture content it
would be assumed that water had been added to the product, but there are significant
problems with this concept. Firstly, it is pointed out that ‘scientific research and studies have
shown that a considerable range of moisture levels in scallop meats can be observed’ and that
‘species, seasonality, harvest practices (length of voyage) and geographical location (i.e.
effect on water chemistry)’ can all affect moisture content of scallops. In addition, the
moisture content can be expressed in two ways; ‘as a percentage calculated by proximate
analysis (oven drying) or as a ratio of the moisture content to protein content calculated by
Review of polyphosphates as additives and testing methods for them in scallops and prawns
Campden BRI Report: BC-REP-125846-01 23
proximate analysis (oven drying and Kjeldahl)’. See Section 4.1.4 for further details on the
use of the moisture:protein ratio.
4.1.2 Protein content
The protein content of foods is commonly derived by calculation, based on the measurement
of nitrogen content using the Kjeldahl method (AOAC, 2011). The Kjeldahl method involves
digestion of the sample with concentrated sulphuric acid, which converts organic nitrogen to
ammonium ions. The resulting digest is made alkaline, distilled into excess boric acid and
the ammonia trapped by the boric acid is titrated with hydrochloric acid. The nitrogen
content is calculated from the amount of ammonia produced; standard factors are then used to
convert total nitrogen to protein equivalent. A standard factor, termed nitrogen factor, of 6.25
is typically used in the determination of crude protein in foods, based on the assumption that
the average nitrogen content of proteins is 16% (1/0.16 = 6.25). But, not all nitrogen in foods
is found in proteins; it is also contained in variable quantities of other compounds, such as
free amino acids and nucleotides. In addition, the nitrogen content of amino acids (the
building blocks of proteins) is not always 16%, proteins can actually have nitrogen contents
ranging from 13-19% depending on the different amino acids that are present; this would
equate to nitrogen conversion factors ranging from 5.26 to 7.69. It has been suggested that N
x 6.25 be abandoned and replaced by N x a factor specific for the food in question.
Information above has been adapted from (Food and Agriculture Organisation of the United
Nations, 2003).
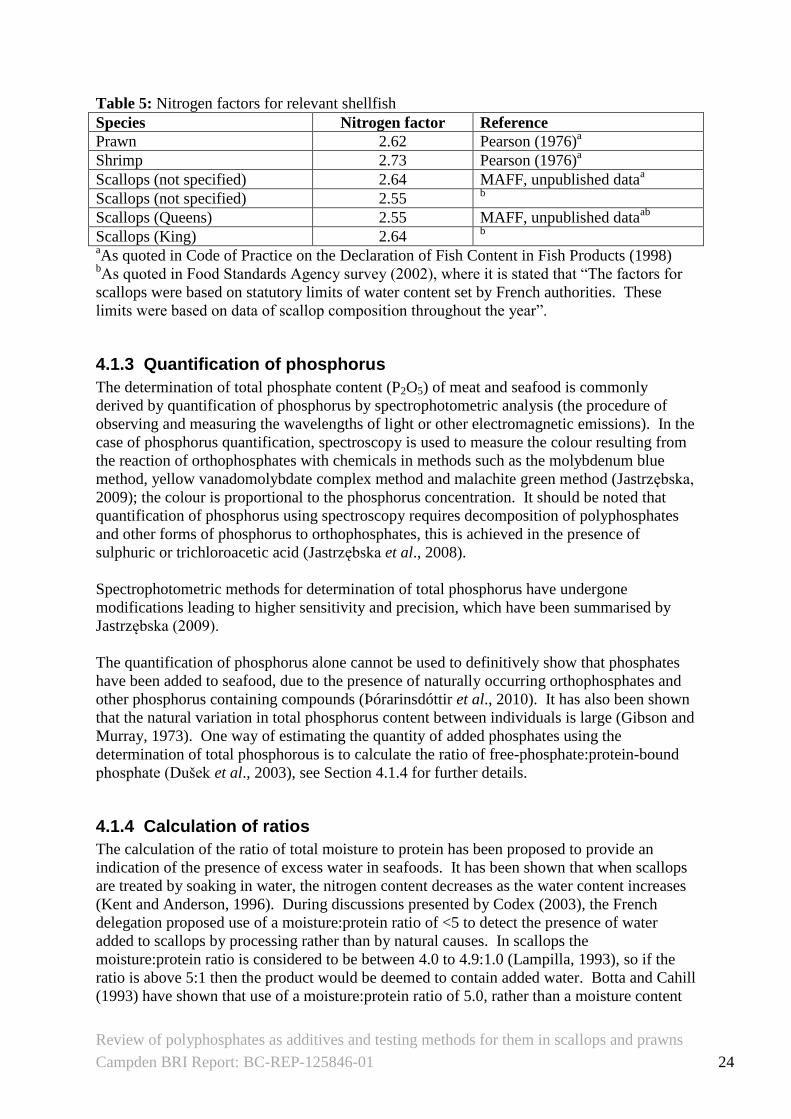
Codex Alimentarius Commission (2003) have stated that ‘the natural variability of the
moisture content in scallops (species, seasonality, location of catch, etc), has an effect on
protein content, so the development of a scallop nitrogen factor would need to consider these
and other factors, requiring considerable time, labour and expense’. Interim nitrogen factors
for several fish and shellfish species, including scallops, prawns and shrimps, have been
provided in the Code of Practice (COP) on the Declaration of Fish Content in Fish Products
(UKAFFP et al., 1998). The aforementioned COP also states that nitrogen factors will be
reviewed periodically; indeed in 2001 the factor for scampi (washed and peeled) was altered
from 2.33 to 2.45 based on data produced by the Analytical Methods Committee (2000).
However, factors for prawn, shrimp and scallops remain as interim values (shown in Table
5), and in the absence of more up-to-date values continue to be used, for example by Public
Analysts in the UK (Michaela Archer – Sea Fish Industry Authority (March 2012), personal
communication) and in a Food Standards Agency survey (2002b) of added water in seafood,
including scallops.
Review of polyphosphates as additives and testing methods for them in scallops and prawns
Campden BRI Report: BC-REP-125846-01 24
Table 5: Nitrogen factors for relevant shellfish
Species Nitrogen factor Reference
Prawn 2.62 Pearson (1976)a
Shrimp 2.73 Pearson (1976)a
Scallops (not specified) 2.64 MAFF, unpublished dataa
Scallops (not specified) 2.55 b
Scallops (Queens) 2.55 MAFF, unpublished dataab
Scallops (King) 2.64 b
aAs quoted in Code of Practice on the Declaration of Fish Content in Fish Products (1998)
bAs quoted in Food Standards Agency survey (2002), where it is stated that “The factors for
scallops were based on statutory limits of water content set by French authorities. These
limits were based on data of scallop composition throughout the year”.
4.1.3 Quantification of phosphorus
The determination of total phosphate content (P2O5) of meat and seafood is commonly
derived by quantification of phosphorus by spectrophotometric analysis (the procedure of
observing and measuring the wavelengths of light or other electromagnetic emissions). In the
case of phosphorus quantification, spectroscopy is used to measure the colour resulting from
the reaction of orthophosphates with chemicals in methods such as the molybdenum blue
method, yellow vanadomolybdate complex method and malachite green method (Jastrzębska,
2009); the colour is proportional to the phosphorus concentration. It should be noted that
quantification of phosphorus using spectroscopy requires decomposition of polyphosphates
and other forms of phosphorus to orthophosphates, this is achieved in the presence of
sulphuric or trichloroacetic acid (Jastrzębska et al., 2008).
Spectrophotometric methods for determination of total phosphorus have undergone
modifications leading to higher sensitivity and precision, which have been summarised by
Jastrzębska (2009).
The quantification of phosphorus alone cannot be used to definitively show that phosphates
have been added to seafood, due to the presence of naturally occurring orthophosphates and
other phosphorus containing compounds (Þórarinsdóttir et al., 2010). It has also been shown
that the natural variation in total phosphorus content between individuals is large (Gibson and
Murray, 1973). One way of estimating the quantity of added phosphates using the
determination of total phosphorous is to calculate the ratio of free-phosphate:protein-bound
phosphate (Dušek et al., 2003), see Section 4.1.4 for further details.
4.1.4 Calculation of ratios
The calculation of the ratio of total moisture to protein has been proposed to provide an
indication of the presence of excess water in seafoods. It has been shown that when scallops
are treated by soaking in water, the nitrogen content decreases as the water content increases
(Kent and Anderson, 1996). During discussions presented by Codex (2003), the French
delegation proposed use of a moisture:protein ratio of <5 to detect the presence of water
added to scallops by processing rather than by natural causes. In scallops the
moisture:protein ratio is considered to be between 4.0 to 4.9:1.0 (Lampilla, 1993), so if the
ratio is above 5:1 then the product would be deemed to contain added water. Botta and Cahill
(1993) have shown that use of a moisture:protein ratio of 5.0, rather than a moisture content
Review of polyphosphates as additives and testing methods for them in scallops and prawns
Campden BRI Report: BC-REP-125846-01 25
of 80% (see Section 3.3), to determine the presence of added water is more likely to detect
added water in scallops that have a naturally low moisture content, and is more tolerant of
water that has been added to scallops that naturally have a moisture content close to 80%.
The amount of added phosphate in meat has also been determined by calculating the ratio of
free (non-protein) phosphate and protein-bound phosphate (Dušek et al., 2003). Total
phosphate content is determined by spectroscopy, then the amount of bound protein
phosphate is calculated from the concentration of nitrogen (Kjeldahl method) and from the
known ratio (0.0106g phosphorus (P)/g protein) of phosphate to protein; the difference
between the total phosphate content and the protein-bound phosphate is calculated as the
free-phosphate (Dušek et al., 2003).
Calculation of both the moisture:protein and free-phosphate:protein-bound phosphate ratios
described above requires specific nitrogen factors for the determination of protein content
(see Section 4.1.2).
4.2 Chromatographic methods
Chromatographic methods can be used to detect, and in some instances quantify, added
phosphate in food products. Chromatographic methods use chromatography, in which
mixtures of substances are separated into their components. All forms of chromatography
work on the same principle and involve a stationary phase (a solid, or a liquid supported on a
solid) and a mobile phase (a liquid or a gas). The mobile phase flows through the stationary
phase and carries the components of the mixture with it. Different components of the mixture
travel at different rates and are therefore separated from one another.
4.2.1 Thin layer chromatography (TLC)
In thin layer chromatography (TLC) the stationary phase (TLC plate) is usually a thin layer of
an adsorbent substance such as silica, aluminium oxide or cellulose, which is dried onto an
aluminum, plastic or glass plate. The mobile phase is usually a liquid solvent or mixture of
solvents. A spot of sample is placed on to the bottom of the TLC plate, and allowed to dry.
The TLC plate is placed into a closed tank with a small amount of mobile phase at the
bottom. The mobile phase moves up the TLC plate bringing the sample with it. Each
component in the sample travels at a different rate, so at the end of the TLC process several
spots relating to the different components remain on the plate. If the sample components
being separated are colourless the TLC plate can be sprayed with or dipped into other
chemicals (for example iodine, bromine or ninhydrin) so the spots can be visualised.
Measurements of the distance travelled by individual spots, are compared with the total
distance travelled by the mobile phase to determine the Rf (retention factor) for each spot (Rf
= distance travelled by component (spot) ÷ distance travelled by mobile phase). Under the
same conditions (temperature, mobile phase composition etc) the Rf value for specific
components should remain the same, therefore spots can be identified by comparison with
standards containing known components. Information above has been adapted from Clark
(2012). With regards to the use of TLC to detect polyphosphates; ortho -, pyro-, tri- and
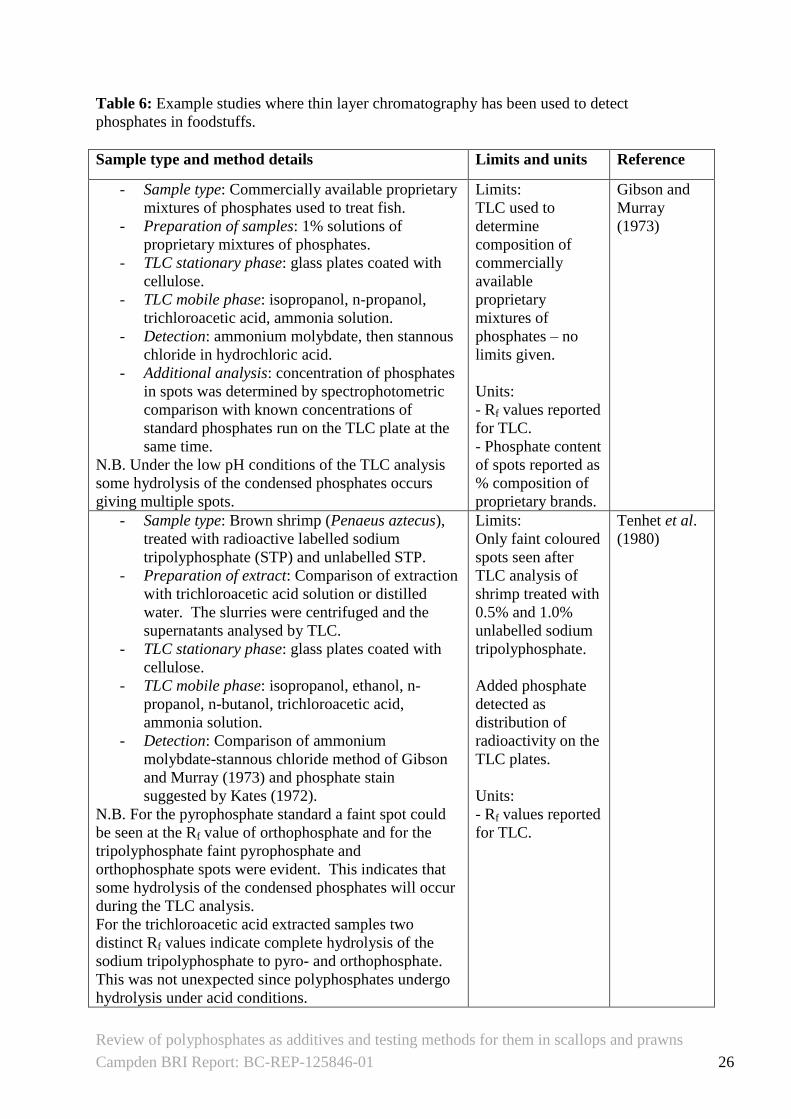
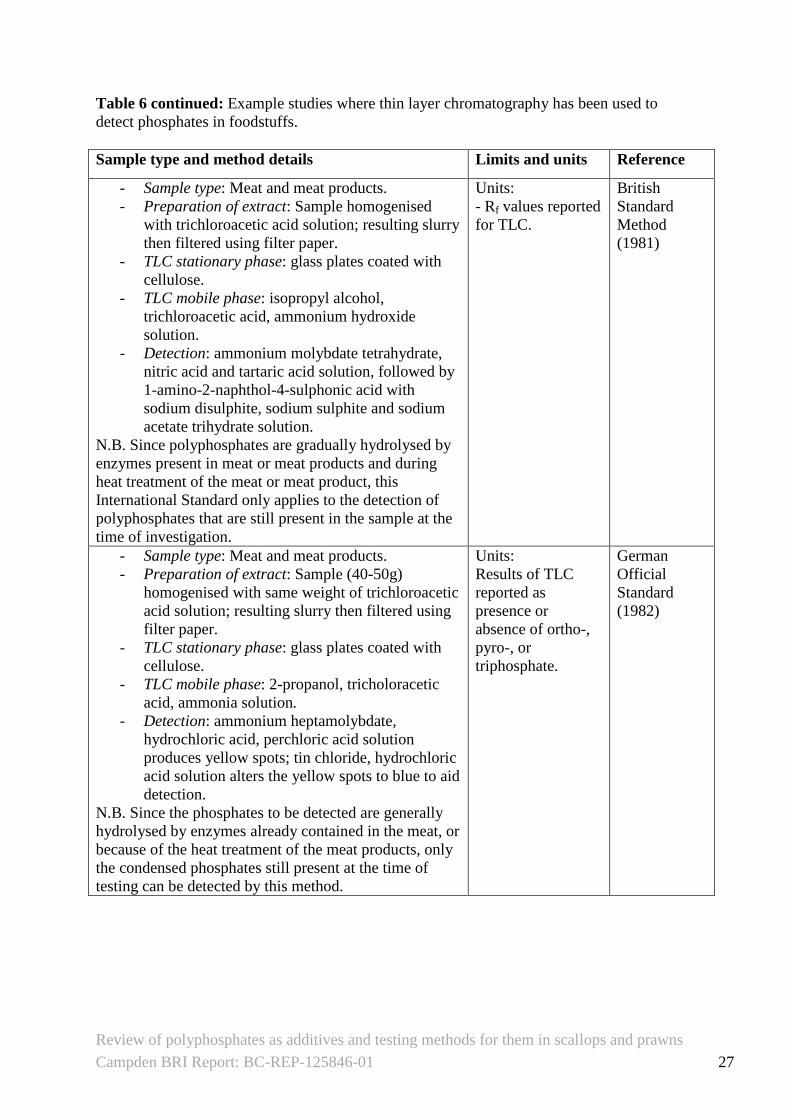
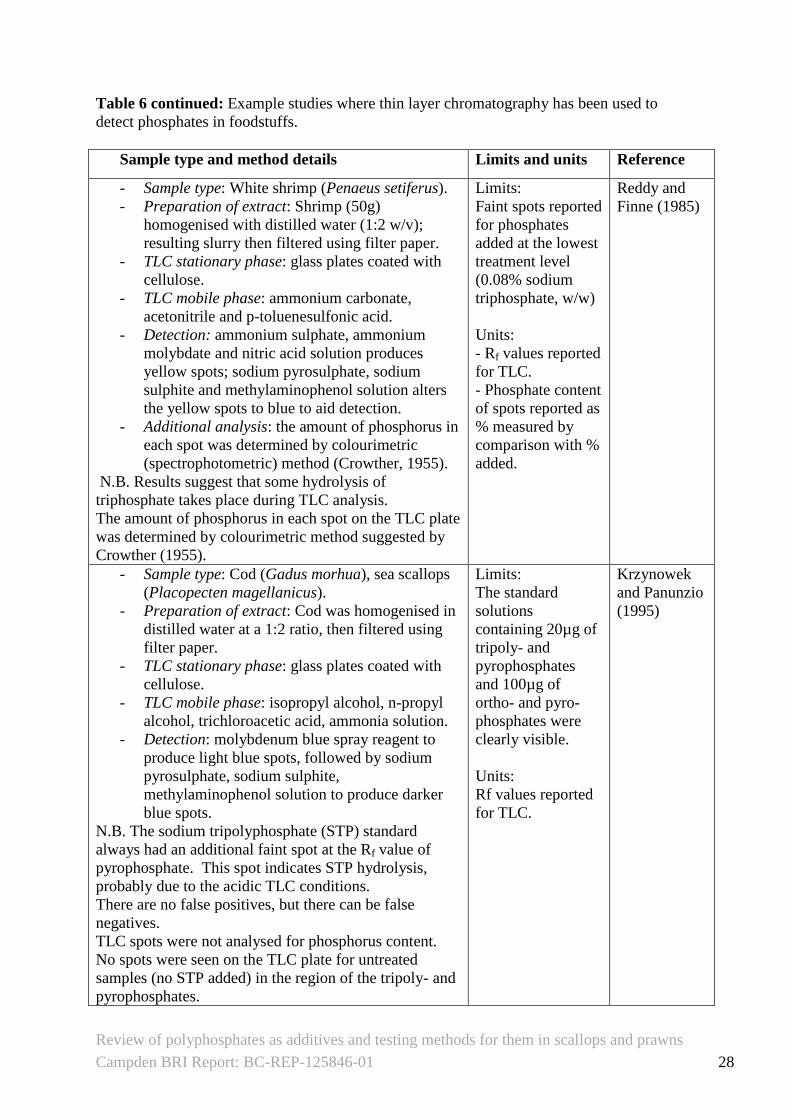
polyphosphates can all be separated from the same sample. See Table 6 for example studies
where TLC has been used to detect phosphates in foodstuffs.
Review of polyphosphates as additives and testing methods for them in scallops and prawns
Campden BRI Report: BC-REP-125846-01 26
Table 6: Example studies where thin layer chromatography has been used to detect
phosphates in foodstuffs.
Sample type and method details Limits and units Reference
- Sample type: Commercially available proprietary
mixtures of phosphates used to treat fish.
- Preparation of samples: 1% solutions of
proprietary mixtures of phosphates.
- TLC stationary phase: glass plates coated with
cellulose.
- TLC mobile phase: isopropanol, n-propanol,
trichloroacetic acid, ammonia solution.
- Detection: ammonium molybdate, then stannous
chloride in hydrochloric acid.
- Additional analysis: concentration of phosphates
in spots was determined by spectrophotometric
comparison with known concentrations of
standard phosphates run on the TLC plate at the
same time.
N.B. Under the low pH conditions of the TLC analysis
some hydrolysis of the condensed phosphates occurs
giving multiple spots.
Limits:
TLC used to
determine
composition of
commercially
available
proprietary
mixtures of
phosphates – no
limits given.
Units:
- Rf values reported
for TLC.
- Phosphate content
of spots reported as
% composition of
proprietary brands.
Gibson and
Murray
(1973)
- Sample type: Brown shrimp (Penaeus aztecus),
treated with radioactive labelled sodium
tripolyphosphate (STP) and unlabelled STP.
- Preparation of extract: Comparison of extraction
with trichloroacetic acid solution or distilled
water. The slurries were centrifuged and the
supernatants analysed by TLC.
- TLC stationary phase: glass plates coated with
cellulose.
- TLC mobile phase: isopropanol, ethanol, n-
propanol, n-butanol, trichloroacetic acid,
ammonia solution.
- Detection: Comparison of ammonium
molybdate-stannous chloride method of Gibson
and Murray (1973) and phosphate stain
suggested by Kates (1972).
N.B. For the pyrophosphate standard a faint spot could
be seen at the Rf value of orthophosphate and for the
tripolyphosphate faint pyrophosphate and
orthophosphate spots were evident. This indicates that
some hydrolysis of the condensed phosphates will occur
during the TLC analysis.
For the trichloroacetic acid extracted samples two
distinct Rf values indicate complete hydrolysis of the
sodium tripolyphosphate to pyro- and orthophosphate.
This was not unexpected since polyphosphates undergo
hydrolysis under acid conditions.
Limits:
Only faint coloured
spots seen after
TLC analysis of
shrimp treated with
0.5% and 1.0%
unlabelled sodium
tripolyphosphate.
Added phosphate
detected as
distribution of
radioactivity on the
TLC plates.
Units:
- Rf values reported
for TLC.
Tenhet et al.
(1980)
Review of polyphosphates as additives and testing methods for them in scallops and prawns
Campden BRI Report: BC-REP-125846-01 27
Table 6 continued: Example studies where thin layer chromatography has been used to
detect phosphates in foodstuffs.
Sample type and method details Limits and units Reference
- Sample type: Meat and meat products.
- Preparation of extract: Sample homogenised
with trichloroacetic acid solution; resulting slurry
then filtered using filter paper.
- TLC stationary phase: glass plates coated with
cellulose.
- TLC mobile phase: isopropyl alcohol,
trichloroacetic acid, ammonium hydroxide
solution.
- Detection: ammonium molybdate tetrahydrate,
nitric acid and tartaric acid solution, followed by
1-amino-2-naphthol-4-sulphonic acid with
sodium disulphite, sodium sulphite and sodium
acetate trihydrate solution.
N.B. Since polyphosphates are gradually hydrolysed by
enzymes present in meat or meat products and during
heat treatment of the meat or meat product, this
International Standard only applies to the detection of
polyphosphates that are still present in the sample at the
time of investigation.
Units:
- Rf values reported
for TLC.
British
Standard
Method
(1981)
- Sample type: Meat and meat products.
- Preparation of extract: Sample (40-50g)
homogenised with same weight of trichloroacetic
acid solution; resulting slurry then filtered using
filter paper.
- TLC stationary phase: glass plates coated with
cellulose.
- TLC mobile phase: 2-propanol, tricholoracetic
acid, ammonia solution.
- Detection: ammonium heptamolybdate,
hydrochloric acid, perchloric acid solution
produces yellow spots; tin chloride, hydrochloric
acid solution alters the yellow spots to blue to aid
detection.
N.B. Since the phosphates to be detected are generally
hydrolysed by enzymes already contained in the meat, or
because of the heat treatment of the meat products, only
the condensed phosphates still present at the time of
testing can be detected by this method.
Units:
Results of TLC
reported as
presence or
absence of ortho-,
pyro-, or
triphosphate.
German
Official
Standard
(1982)
Review of polyphosphates as additives and testing methods for them in scallops and prawns
Campden BRI Report: BC-REP-125846-01 28
Table 6 continued: Example studies where thin layer chromatography has been used to
detect phosphates in foodstuffs.
Sample type and method details Limits and units Reference
- Sample type: White shrimp (Penaeus setiferus).
- Preparation of extract: Shrimp (50g)
homogenised with distilled water (1:2 w/v);
resulting slurry then filtered using filter paper.
- TLC stationary phase: glass plates coated with
cellulose.
- TLC mobile phase: ammonium carbonate,
acetonitrile and p-toluenesulfonic acid.
- Detection: ammonium sulphate, ammonium
molybdate and nitric acid solution produces
yellow spots; sodium pyrosulphate, sodium
sulphite and methylaminophenol solution alters
the yellow spots to blue to aid detection.
- Additional analysis: the amount of phosphorus in
each spot was determined by colourimetric
(spectrophotometric) method (Crowther, 1955).
N.B. Results suggest that some hydrolysis of
triphosphate takes place during TLC analysis.
The amount of phosphorus in each spot on the TLC plate
was determined by colourimetric method suggested by
Crowther (1955).
Limits:
Faint spots reported
for phosphates
added at the lowest
treatment level
(0.08% sodium
triphosphate, w/w)
Units:
- Rf values reported
for TLC.
- Phosphate content
of spots reported as
% measured by
comparison with %
added.
Reddy and
Finne (1985)
- Sample type: Cod (Gadus morhua), sea scallops
(Placopecten magellanicus).
- Preparation of extract: Cod was homogenised in
distilled water at a 1:2 ratio, then filtered using
filter paper.
- TLC stationary phase: glass plates coated with
cellulose.
- TLC mobile phase: isopropyl alcohol, n-propyl
alcohol, trichloroacetic acid, ammonia solution.
- Detection: molybdenum blue spray reagent to
produce light blue spots, followed by sodium
pyrosulphate, sodium sulphite,
methylaminophenol solution to produce darker
blue spots.
N.B. The sodium tripolyphosphate (STP) standard
always had an additional faint spot at the Rf value of
pyrophosphate. This spot indicates STP hydrolysis,
probably due to the acidic TLC conditions.
There are no false positives, but there can be false
negatives.
TLC spots were not analysed for phosphorus content.
No spots were seen on the TLC plate for untreated
samples (no STP added) in the region of the tripoly- and
pyrophosphates.
Limits:
The standard
solutions
containing 20µg of
tripoly- and
pyrophosphates
and 100µg of
ortho- and pyro-
phosphates were
clearly visible.
Units:
Rf values reported
for TLC.
Krzynowek
and Panunzio
(1995)
Review of polyphosphates as additives and testing methods for them in scallops and prawns
Campden BRI Report: BC-REP-125846-01 29
The advantages of TLC include the relative simplicity and speed of the analysis; results are
generated within a few hours. The low cost of equipment required also makes TLC an
inexpensive assay to perform.
The main disadvantage of TLC is that hydrolysis of phosphates during sample preparation
and analysis may influence the results obtained (see comments in Table 6). One mole of
tripolyphosphate hydrolyses to one mole of orthophosphate and one mole of pyrophosphate,
while one mole of pyrophosphate hydrolyses to two moles of orthophosphate (Heitkemper et
al. 1993).
Without additional analysis, TLC is a qualitative technique, providing a positive or negative
result. Presence of a spot on the TLC plate in the region of polyphosphate (by comparison
with a standard) is taken to infer that polyphosphate has been added to the sample. However,
it has been shown that TLC detection of added phosphates can give false negative results.
The absence of a spot in the region of polyphosphate on a TLC plate means that the sample
either has not been treated with added phosphate or has been treated, but the polyphosphates
have completely hydrolysed to orthophosphates and are no longer detectable above the
natural background phosphate content (Krzynowek and Panunzio, 1995).
4.2.2 Ion chromatography (IC)
Ion chromatography is a form of high-performance liquid chromatography (HPLC). The
stationary phase is a column packed with ion exchange resin; the surface of the resin is coated
with a thin layer of active material. The ions (negative or positive charged particles) in the
sample are carried through the column by the mobile phase, which is an ionic solution (a
solution that dissociates into ions and is therefore capable of conducting electricity, such as
an acid, carbonate or hydroxide solution) termed the eluent. As the sample passes through
the column, individual ions attach and detach from the active material layer on the resin,
resulting in different retention times for different components within the sample. Therefore,
the ions of particular components exit, or elute, from the column at a specific time. The
detector at the end of the column measures either the conductivity (ability to conduct
electricity) or spectroscopy (wavelength of light or other electromagnetic emissions) of the
eluent. A chromatogram is generated, which is a plot of ion abundance measured by the
detector versus retention time i.e. the time the ion takes to pass along the column. The
position of a peak in the chromatogram (i.e. the retention time) is characteristic of a specific
ion, and the peak size is a function of the concentration of the ion represented by that peak.
Information above has been adapted from Materials Evaluation and Engineering (2010). For
further details on the theory of IC see Eith et al. (2001).
IC has been shown to be a useful method in determining individual polyphosphates in a
sample. See Table 7 for example studies where IC has been used to detect and measure
phosphates in foodstuffs.
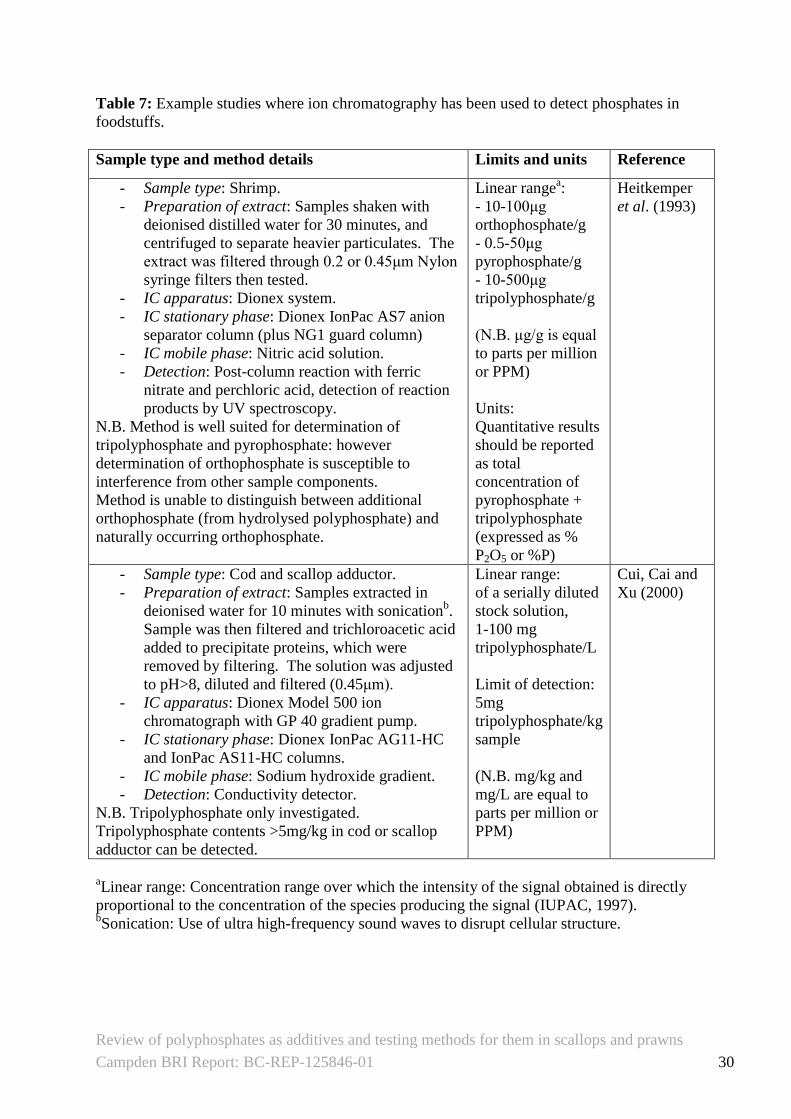
Review of polyphosphates as additives and testing methods for them in scallops and prawns
Campden BRI Report: BC-REP-125846-01 30
Table 7: Example studies where ion chromatography has been used to detect phosphates in
foodstuffs.
Sample type and method details Limits and units Reference
- Sample type: Shrimp.
- Preparation of extract: Samples shaken with
deionised distilled water for 30 minutes, and
centrifuged to separate heavier particulates. The
extract was filtered through 0.2 or 0.45μm Nylon
syringe filters then tested.
- IC apparatus: Dionex system.
- IC stationary phase: Dionex IonPac AS7 anion
separator column (plus NG1 guard column)
- IC mobile phase: Nitric acid solution.
- Detection: Post-column reaction with ferric
nitrate and perchloric acid, detection of reaction
products by UV spectroscopy.
N.B. Method is well suited for determination of
tripolyphosphate and pyrophosphate: however
determination of orthophosphate is susceptible to
interference from other sample components.
Method is unable to distinguish between additional
orthophosphate (from hydrolysed polyphosphate) and
naturally occurring orthophosphate.
Linear rangea:
- 10-100μg
orthophosphate/g
- 0.5-50μg
pyrophosphate/g
- 10-500μg
tripolyphosphate/g
(N.B. μg/g is equal
to parts per million
or PPM)
Units:
Quantitative results
should be reported
as total
concentration of
pyrophosphate +
tripolyphosphate
(expressed as %
P2O5 or %P)
Heitkemper
et al. (1993)
- Sample type: Cod and scallop adductor.
- Preparation of extract: Samples extracted in
deionised water for 10 minutes with sonicationb.
Sample was then filtered and trichloroacetic acid
added to precipitate proteins, which were
removed by filtering. The solution was adjusted
to pH>8, diluted and filtered (0.45μm).
- IC apparatus: Dionex Model 500 ion
chromatograph with GP 40 gradient pump.
- IC stationary phase: Dionex IonPac AG11-HC
and IonPac AS11-HC columns.
- IC mobile phase: Sodium hydroxide gradient.
- Detection: Conductivity detector.
N.B. Tripolyphosphate only investigated.
Tripolyphosphate contents >5mg/kg in cod or scallop
adductor can be detected.
Linear range:
of a serially diluted
stock solution,
1-100 mg
tripolyphosphate/L
Limit of detection:
5mg
tripolyphosphate/kg
sample
(N.B. mg/kg and
mg/L are equal to
parts per million or
PPM)
Cui, Cai and
Xu (2000)
aLinear range: Concentration range over which the intensity of the signal obtained is directly
proportional to the concentration of the species producing the signal (IUPAC, 1997). bSonication: Use of ultra high-frequency sound waves to disrupt cellular structure.
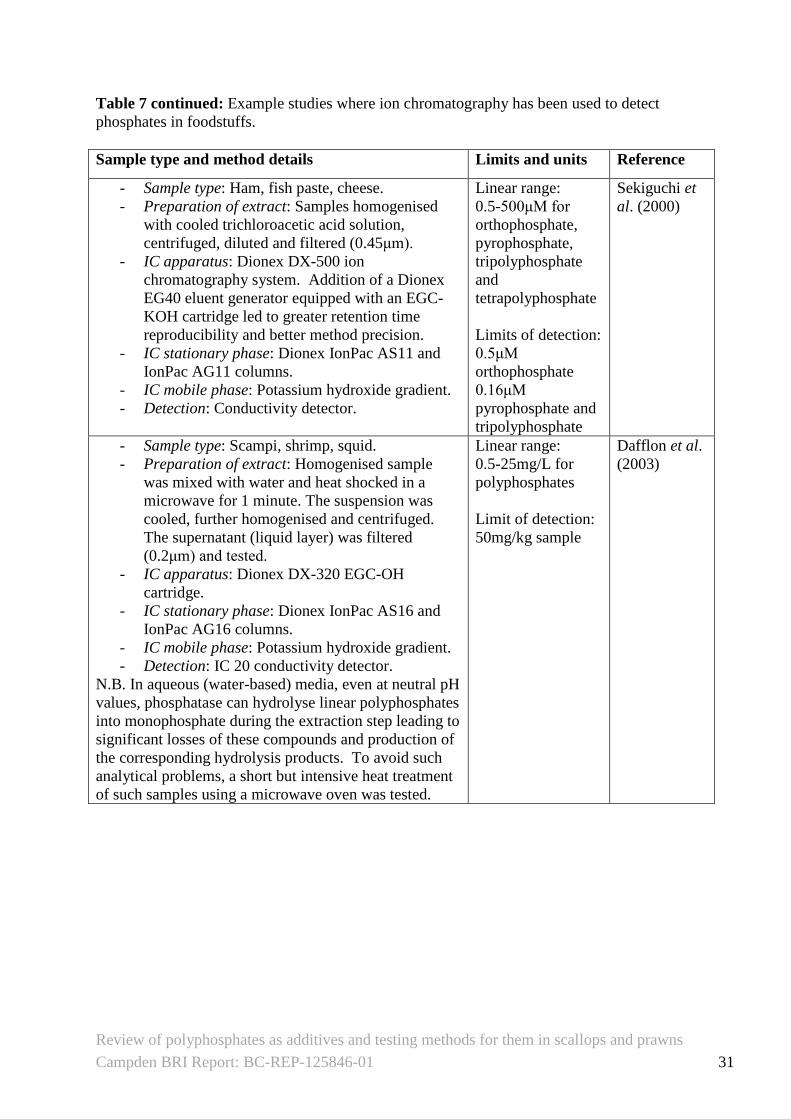
Review of polyphosphates as additives and testing methods for them in scallops and prawns
Campden BRI Report: BC-REP-125846-01 31
Table 7 continued: Example studies where ion chromatography has been used to detect
phosphates in foodstuffs.
Sample type and method details Limits and units Reference
- Sample type: Ham, fish paste, cheese.
- Preparation of extract: Samples homogenised
with cooled trichloroacetic acid solution,
centrifuged, diluted and filtered (0.45μm).
- IC apparatus: Dionex DX-500 ion
chromatography system. Addition of a Dionex
EG40 eluent generator equipped with an EGC-
KOH cartridge led to greater retention time
reproducibility and better method precision.
- IC stationary phase: Dionex IonPac AS11 and
IonPac AG11 columns.
- IC mobile phase: Potassium hydroxide gradient.
- Detection: Conductivity detector.
Linear range:
0.5-500μM for
orthophosphate,
pyrophosphate,
tripolyphosphate
and
tetrapolyphosphate
Limits of detection:
0.5μM
orthophosphate
0.16μM
pyrophosphate and
tripolyphosphate
Sekiguchi et
al. (2000)
- Sample type: Scampi, shrimp, squid.
- Preparation of extract: Homogenised sample
was mixed with water and heat shocked in a
microwave for 1 minute. The suspension was
cooled, further homogenised and centrifuged.
The supernatant (liquid layer) was filtered
(0.2μm) and tested.
- IC apparatus: Dionex DX-320 EGC-OH
cartridge.
- IC stationary phase: Dionex IonPac AS16 and
IonPac AG16 columns.
- IC mobile phase: Potassium hydroxide gradient.
- Detection: IC 20 conductivity detector.
N.B. In aqueous (water-based) media, even at neutral pH
values, phosphatase can hydrolyse linear polyphosphates
into monophosphate during the extraction step leading to
significant losses of these compounds and production of
the corresponding hydrolysis products. To avoid such
analytical problems, a short but intensive heat treatment
of such samples using a microwave oven was tested.
Linear range:
0.5-25mg/L for
polyphosphates
Limit of detection:
50mg/kg sample
Dafflon et al.
(2003)
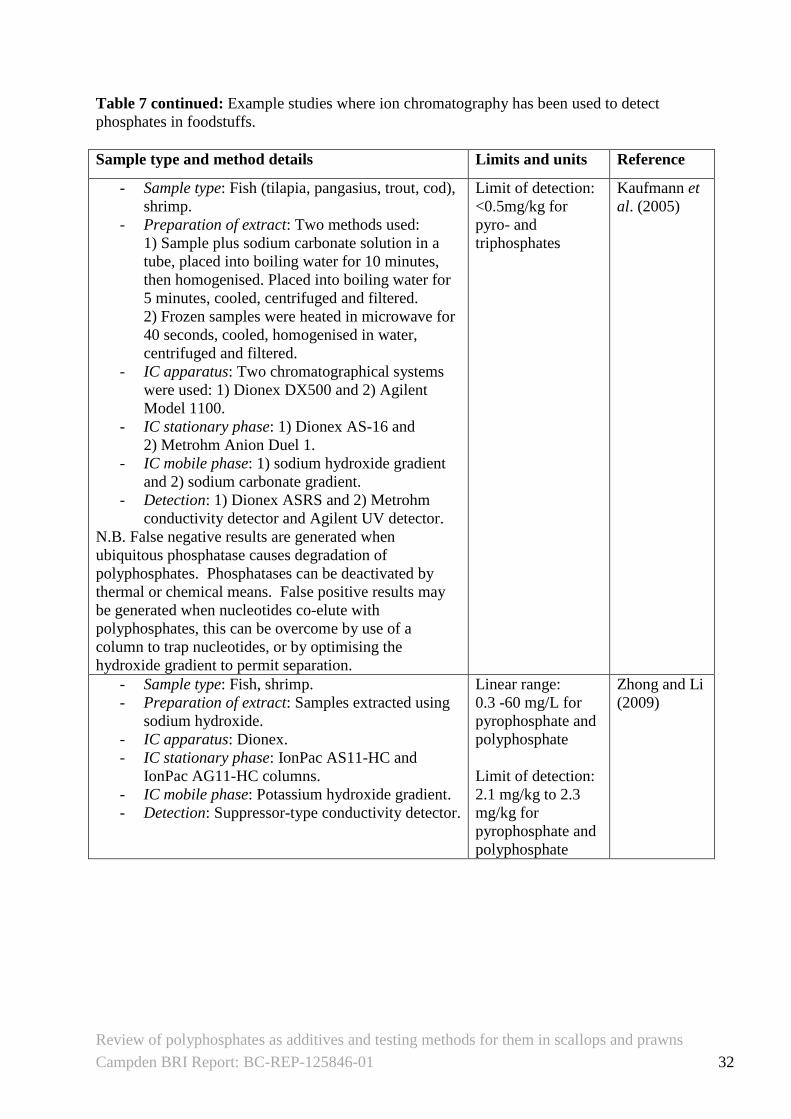
Review of polyphosphates as additives and testing methods for them in scallops and prawns
Campden BRI Report: BC-REP-125846-01 32
Table 7 continued: Example studies where ion chromatography has been used to detect
phosphates in foodstuffs.
Sample type and method details Limits and units Reference
- Sample type: Fish (tilapia, pangasius, trout, cod),
shrimp.
- Preparation of extract: Two methods used:
1) Sample plus sodium carbonate solution in a
tube, placed into boiling water for 10 minutes,
then homogenised. Placed into boiling water for
5 minutes, cooled, centrifuged and filtered.
2) Frozen samples were heated in microwave for
40 seconds, cooled, homogenised in water,
centrifuged and filtered.
- IC apparatus: Two chromatographical systems
were used: 1) Dionex DX500 and 2) Agilent
Model 1100.
- IC stationary phase: 1) Dionex AS-16 and
2) Metrohm Anion Duel 1.
- IC mobile phase: 1) sodium hydroxide gradient
and 2) sodium carbonate gradient.
- Detection: 1) Dionex ASRS and 2) Metrohm
conductivity detector and Agilent UV detector.
N.B. False negative results are generated when
ubiquitous phosphatase causes degradation of
polyphosphates. Phosphatases can be deactivated by
thermal or chemical means. False positive results may
be generated when nucleotides co-elute with
polyphosphates, this can be overcome by use of a
column to trap nucleotides, or by optimising the
hydroxide gradient to permit separation.
Limit of detection:
<0.5mg/kg for
pyro- and
triphosphates
Kaufmann et
al. (2005)
- Sample type: Fish, shrimp.
- Preparation of extract: Samples extracted using
sodium hydroxide.
- IC apparatus: Dionex.
- IC stationary phase: IonPac AS11-HC and
IonPac AG11-HC columns.
- IC mobile phase: Potassium hydroxide gradient.
- Detection: Suppressor-type conductivity detector.
Linear range:
0.3 -60 mg/L for
pyrophosphate and
polyphosphate
Limit of detection:
2.1 mg/kg to 2.3
mg/kg for
pyrophosphate and
polyphosphate
Zhong and Li
(2009)
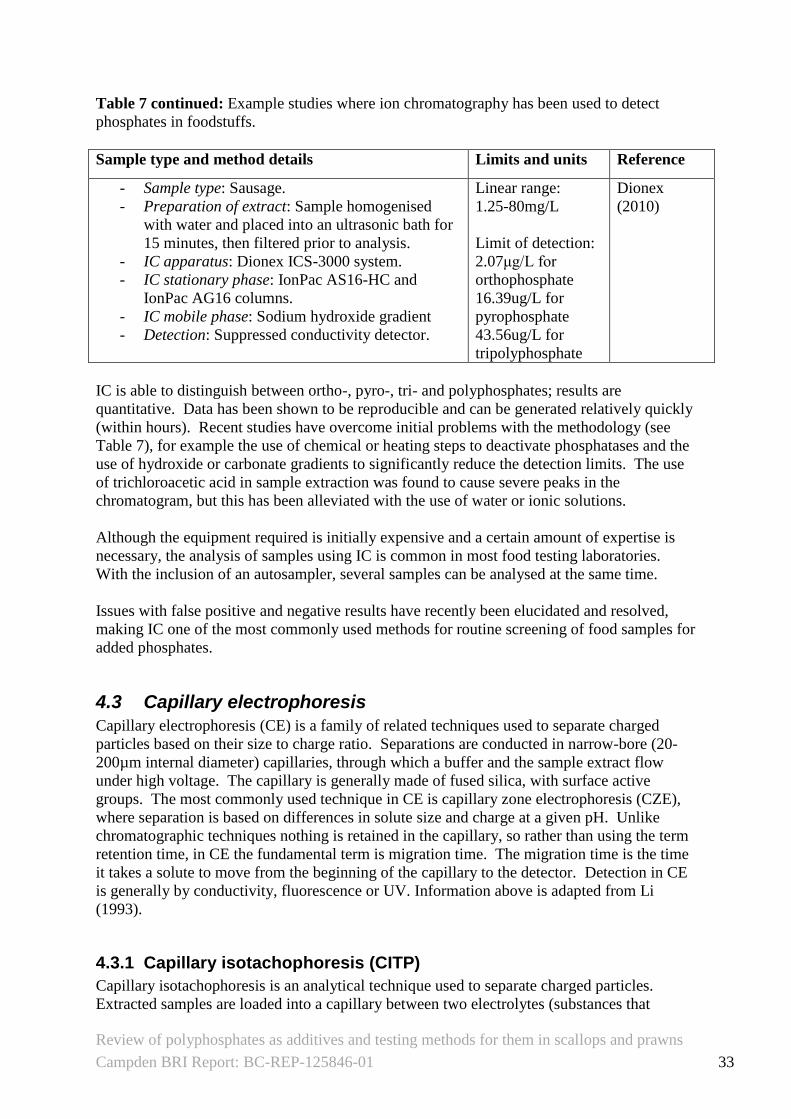
Review of polyphosphates as additives and testing methods for them in scallops and prawns
Campden BRI Report: BC-REP-125846-01 33
Table 7 continued: Example studies where ion chromatography has been used to detect
phosphates in foodstuffs.
Sample type and method details Limits and units Reference
- Sample type: Sausage.
- Preparation of extract: Sample homogenised
with water and placed into an ultrasonic bath for
15 minutes, then filtered prior to analysis.
- IC apparatus: Dionex ICS-3000 system.
- IC stationary phase: IonPac AS16-HC and
IonPac AG16 columns.
- IC mobile phase: Sodium hydroxide gradient
- Detection: Suppressed conductivity detector.
Linear range:
1.25-80mg/L
Limit of detection:
2.07μg/L for
orthophosphate
16.39ug/L for
pyrophosphate
43.56ug/L for
tripolyphosphate
Dionex
(2010)
IC is able to distinguish between ortho-, pyro-, tri- and polyphosphates; results are
quantitative. Data has been shown to be reproducible and can be generated relatively quickly
(within hours). Recent studies have overcome initial problems with the methodology (see
Table 7), for example the use of chemical or heating steps to deactivate phosphatases and the
use of hydroxide or carbonate gradients to significantly reduce the detection limits. The use
of trichloroacetic acid in sample extraction was found to cause severe peaks in the
chromatogram, but this has been alleviated with the use of water or ionic solutions.
Although the equipment required is initially expensive and a certain amount of expertise is
necessary, the analysis of samples using IC is common in most food testing laboratories.
With the inclusion of an autosampler, several samples can be analysed at the same time.
Issues with false positive and negative results have recently been elucidated and resolved,
making IC one of the most commonly used methods for routine screening of food samples for
added phosphates.
4.3 Capillary electrophoresis
Capillary electrophoresis (CE) is a family of related techniques used to separate charged
particles based on their size to charge ratio. Separations are conducted in narrow-bore (20-
200µm internal diameter) capillaries, through which a buffer and the sample extract flow
under high voltage. The capillary is generally made of fused silica, with surface active
groups. The most commonly used technique in CE is capillary zone electrophoresis (CZE),
where separation is based on differences in solute size and charge at a given pH. Unlike
chromatographic techniques nothing is retained in the capillary, so rather than using the term
retention time, in CE the fundamental term is migration time. The migration time is the time
it takes a solute to move from the beginning of the capillary to the detector. Detection in CE
is generally by conductivity, fluorescence or UV. Information above is adapted from Li
(1993).
4.3.1 Capillary isotachophoresis (CITP)
Capillary isotachophoresis is an analytical technique used to separate charged particles.
Extracted samples are loaded into a capillary between two electrolytes (substances that
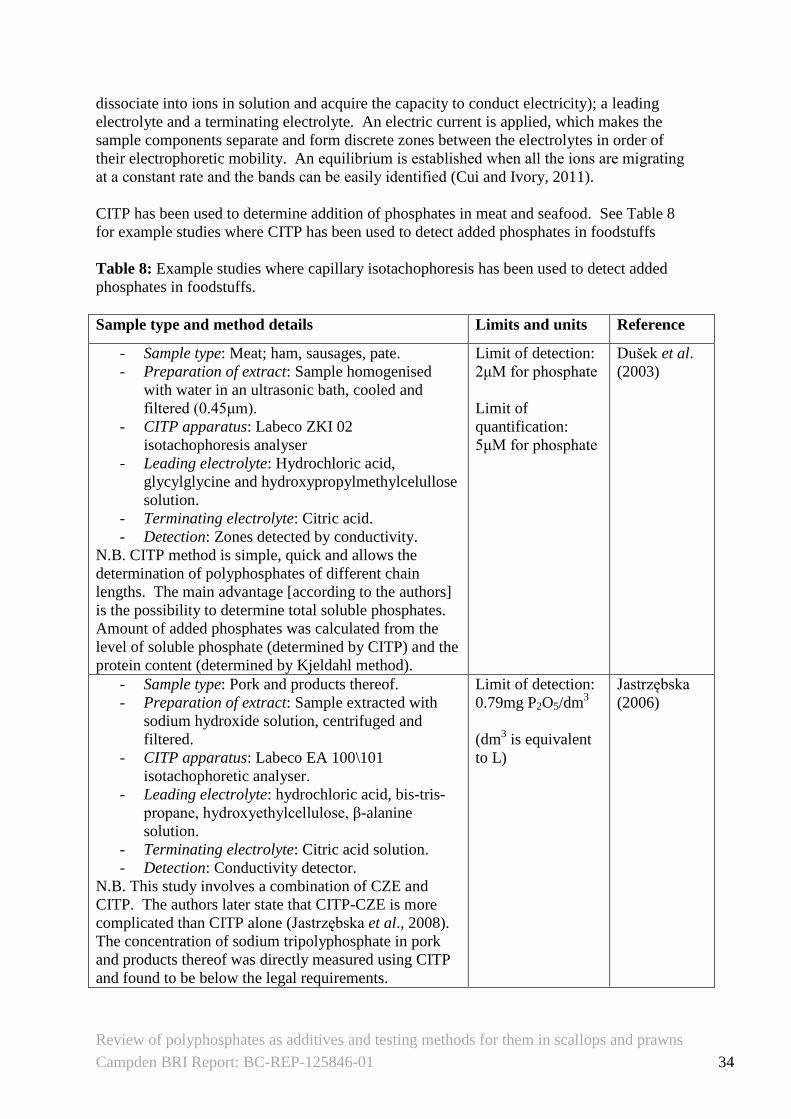
Review of polyphosphates as additives and testing methods for them in scallops and prawns
Campden BRI Report: BC-REP-125846-01 34
dissociate into ions in solution and acquire the capacity to conduct electricity); a leading
electrolyte and a terminating electrolyte. An electric current is applied, which makes the
sample components separate and form discrete zones between the electrolytes in order of
their electrophoretic mobility. An equilibrium is established when all the ions are migrating
at a constant rate and the bands can be easily identified (Cui and Ivory, 2011).
CITP has been used to determine addition of phosphates in meat and seafood. See Table 8
for example studies where CITP has been used to detect added phosphates in foodstuffs
Table 8: Example studies where capillary isotachophoresis has been used to detect added
phosphates in foodstuffs.
Sample type and method details Limits and units Reference
- Sample type: Meat; ham, sausages, pate.
- Preparation of extract: Sample homogenised
with water in an ultrasonic bath, cooled and
filtered (0.45μm).
- CITP apparatus: Labeco ZKI 02
isotachophoresis analyser
- Leading electrolyte: Hydrochloric acid,
glycylglycine and hydroxypropylmethylcelullose
solution.
- Terminating electrolyte: Citric acid.
- Detection: Zones detected by conductivity.
N.B. CITP method is simple, quick and allows the
determination of polyphosphates of different chain
lengths. The main advantage [according to the authors]
is the possibility to determine total soluble phosphates.
Amount of added phosphates was calculated from the
level of soluble phosphate (determined by CITP) and the
protein content (determined by Kjeldahl method).
Limit of detection:
2μM for phosphate
Limit of
quantification:
5μM for phosphate
Dušek et al.
(2003)
- Sample type: Pork and products thereof.
- Preparation of extract: Sample extracted with
sodium hydroxide solution, centrifuged and
filtered.
- CITP apparatus: Labeco EA 100\101
isotachophoretic analyser.
- Leading electrolyte: hydrochloric acid, bis-tris-
propane, hydroxyethylcellulose, β-alanine
solution.
- Terminating electrolyte: Citric acid solution.
- Detection: Conductivity detector.
N.B. This study involves a combination of CZE and
CITP. The authors later state that CITP-CZE is more
complicated than CITP alone (Jastrzębska et al., 2008).
The concentration of sodium tripolyphosphate in pork
and products thereof was directly measured using CITP
and found to be below the legal requirements.
Limit of detection:
0.79mg P2O5/dm3
(dm3 is equivalent
to L)
Jastrzębska
(2006)
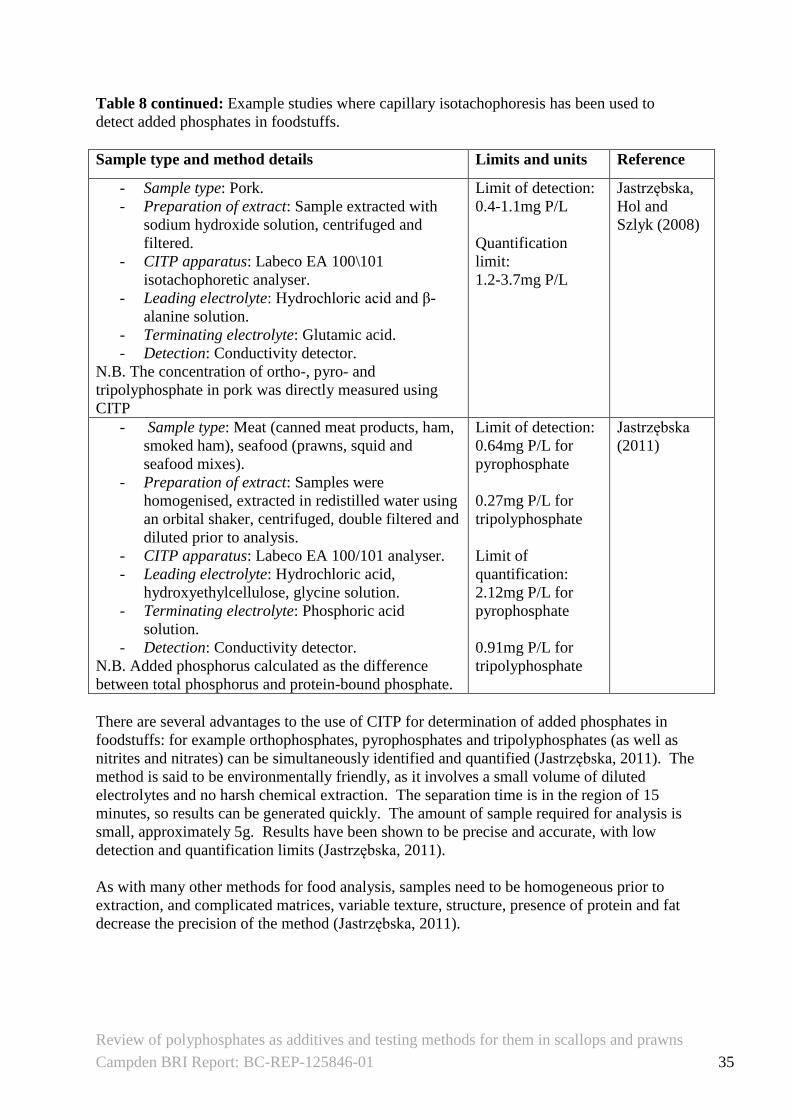
Review of polyphosphates as additives and testing methods for them in scallops and prawns
Campden BRI Report: BC-REP-125846-01 35
Table 8 continued: Example studies where capillary isotachophoresis has been used to
detect added phosphates in foodstuffs.
Sample type and method details Limits and units Reference
- Sample type: Pork.
- Preparation of extract: Sample extracted with
sodium hydroxide solution, centrifuged and
filtered.
- CITP apparatus: Labeco EA 100\101
isotachophoretic analyser.
- Leading electrolyte: Hydrochloric acid and β-
alanine solution.
- Terminating electrolyte: Glutamic acid.
- Detection: Conductivity detector.
N.B. The concentration of ortho-, pyro- and
tripolyphosphate in pork was directly measured using
CITP
Limit of detection:
0.4-1.1mg P/L
Quantification
limit:
1.2-3.7mg P/L
Jastrzębska,
Hol and
Szlyk (2008)
- Sample type: Meat (canned meat products, ham,
smoked ham), seafood (prawns, squid and
seafood mixes).
- Preparation of extract: Samples were
homogenised, extracted in redistilled water using
an orbital shaker, centrifuged, double filtered and
diluted prior to analysis.
- CITP apparatus: Labeco EA 100/101 analyser.
- Leading electrolyte: Hydrochloric acid,
hydroxyethylcellulose, glycine solution.
- Terminating electrolyte: Phosphoric acid
solution.
- Detection: Conductivity detector.
N.B. Added phosphorus calculated as the difference
between total phosphorus and protein-bound phosphate.
Limit of detection:
0.64mg P/L for
pyrophosphate
0.27mg P/L for
tripolyphosphate
Limit of
quantification:
2.12mg P/L for
pyrophosphate
0.91mg P/L for
tripolyphosphate
Jastrzębska
(2011)
There are several advantages to the use of CITP for determination of added phosphates in
foodstuffs: for example orthophosphates, pyrophosphates and tripolyphosphates (as well as
nitrites and nitrates) can be simultaneously identified and quantified (Jastrzębska, 2011). The
method is said to be environmentally friendly, as it involves a small volume of diluted
electrolytes and no harsh chemical extraction. The separation time is in the region of 15
minutes, so results can be generated quickly. The amount of sample required for analysis is
small, approximately 5g. Results have been shown to be precise and accurate, with low
detection and quantification limits (Jastrzębska, 2011).
As with many other methods for food analysis, samples need to be homogeneous prior to
extraction, and complicated matrices, variable texture, structure, presence of protein and fat
decrease the precision of the method (Jastrzębska, 2011).
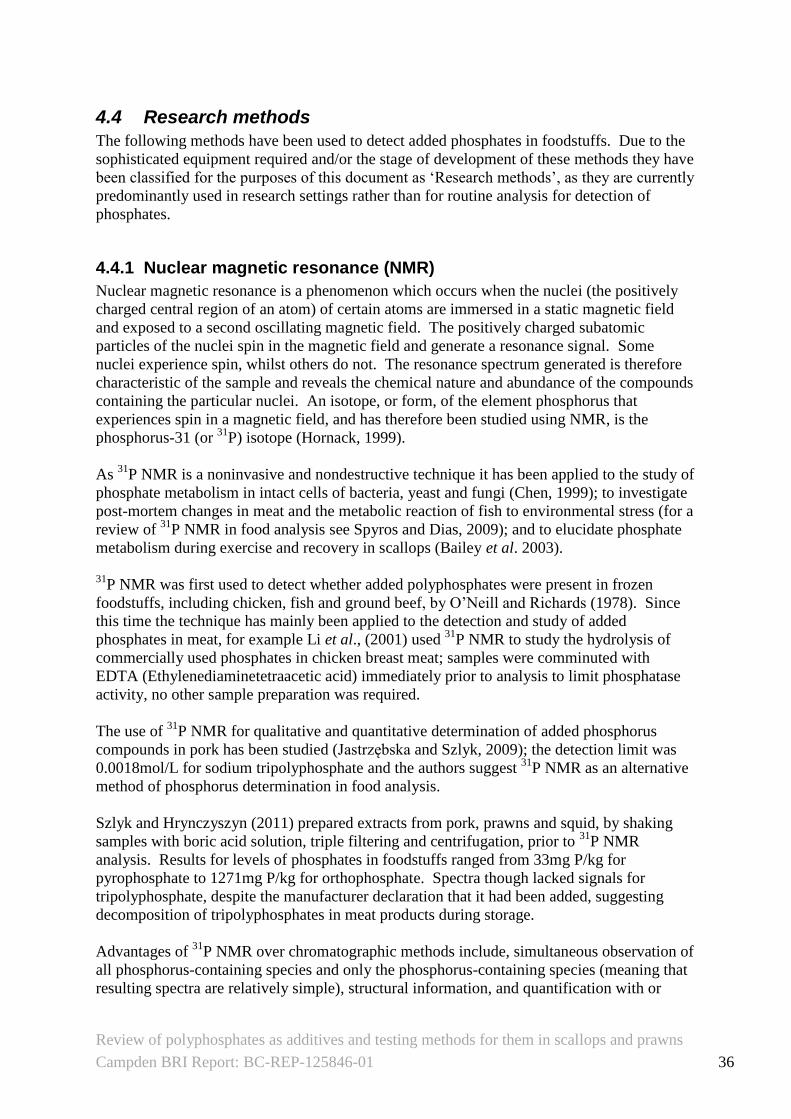
Review of polyphosphates as additives and testing methods for them in scallops and prawns
Campden BRI Report: BC-REP-125846-01 36
4.4 Research methods
The following methods have been used to detect added phosphates in foodstuffs. Due to the
sophisticated equipment required and/or the stage of development of these methods they have
been classified for the purposes of this document as ‘Research methods’, as they are currently
predominantly used in research settings rather than for routine analysis for detection of
phosphates.
4.4.1 Nuclear magnetic resonance (NMR)
Nuclear magnetic resonance is a phenomenon which occurs when the nuclei (the positively
charged central region of an atom) of certain atoms are immersed in a static magnetic field
and exposed to a second oscillating magnetic field. The positively charged subatomic
particles of the nuclei spin in the magnetic field and generate a resonance signal. Some
nuclei experience spin, whilst others do not. The resonance spectrum generated is therefore
characteristic of the sample and reveals the chemical nature and abundance of the compounds
containing the particular nuclei. An isotope, or form, of the element phosphorus that
experiences spin in a magnetic field, and has therefore been studied using NMR, is the
phosphorus-31 (or 31
P) isotope (Hornack, 1999).
As 31
P NMR is a noninvasive and nondestructive technique it has been applied to the study of
phosphate metabolism in intact cells of bacteria, yeast and fungi (Chen, 1999); to investigate
post-mortem changes in meat and the metabolic reaction of fish to environmental stress (for a
review of 31
P NMR in food analysis see Spyros and Dias, 2009); and to elucidate phosphate
metabolism during exercise and recovery in scallops (Bailey et al. 2003).
31
P NMR was first used to detect whether added polyphosphates were present in frozen
foodstuffs, including chicken, fish and ground beef, by O’Neill and Richards (1978). Since
this time the technique has mainly been applied to the detection and study of added
phosphates in meat, for example Li et al., (2001) used 31
P NMR to study the hydrolysis of
commercially used phosphates in chicken breast meat; samples were comminuted with
EDTA (Ethylenediaminetetraacetic acid) immediately prior to analysis to limit phosphatase
activity, no other sample preparation was required.
The use of 31
P NMR for qualitative and quantitative determination of added phosphorus
compounds in pork has been studied (Jastrzębska and Szlyk, 2009); the detection limit was
0.0018mol/L for sodium tripolyphosphate and the authors suggest 31
P NMR as an alternative
method of phosphorus determination in food analysis.
Szlyk and Hrynczyszyn (2011) prepared extracts from pork, prawns and squid, by shaking
samples with boric acid solution, triple filtering and centrifugation, prior to 31
P NMR
analysis. Results for levels of phosphates in foodstuffs ranged from 33mg P/kg for
pyrophosphate to 1271mg P/kg for orthophosphate. Spectra though lacked signals for
tripolyphosphate, despite the manufacturer declaration that it had been added, suggesting
decomposition of tripolyphosphates in meat products during storage.
Advantages of 31
P NMR over chromatographic methods include, simultaneous observation of
all phosphorus-containing species and only the phosphorus-containing species (meaning that
resulting spectra are relatively simple), structural information, and quantification with or
Review of polyphosphates as additives and testing methods for them in scallops and prawns
Campden BRI Report: BC-REP-125846-01 37
without standards (Gard et al., 1992). A notable disadvantage of the technique is that
although it is able to measure total phosphates or polyphosphates it cannot distinguish
between natural and added compounds. There are also issues with quantification of longer
chain (>tripolyphosphates) phosphates (Belloque et al., 2000).
4.4.2 Thermo-differential-photometry (TDF) Thermo-differential-photometry can be used to quantify phosphate compounds. The method
relies on the reaction of different phosphates to form the yellow molybdic vanadic
heteropolyc acid. Orthophosphates react quickly, whereas pyro-, tri- and polyphosphates
react much slower. The difference in the kinetics (speed) of the reaction (colour generation)
can be used for quantification of polyphosphates. Results are measured using a
spectrophotometer with a temperature controlled cuvette holder, readings are taken 15 and 90
minutes after initiation of the reaction (Þórarinsdóttir et al., 2010). TDF has been tested on
more than 1000 samples of fish products, for example salted, rehydrated cod. Results have
been verified by comparison with ion chromatography and the method has been described by
the authors as reliable and useful as a routine control method for products of animal origin
(Kruse and Bartelt, 2009).
A major drawback though is that TDF cannot be used to differentiate between pyro-, tri- or
other polyphosphates (Þórarinsdóttir et al. 2010).
4.4.3 Microwave dielectric spectroscopy
The technique ‘microwave dielectric spectroscopy’ measures the electromagnetic properties
of a sample in the microwave region of the electromagnetic spectrum, which are dependent
on its molecular structure. The theory behind the technique is based on the permittivity of a
substance; a measure of the ability of a material to resist the formation of an electric field
within it. The technique is non-destructive; the sample is placed into an electromagnetic
field, which results in polarization (or orientation) of positive and negative charged particles
(ions) in the sample. This happens to varying degrees depending upon the sample. If the
sample is altered, for instance by the addition of water, then the spectrum that is obtained will
be different to that of the untreated sample. By analysing the data using a statistical technique
called principle component analysis, it is possible to separate treated and untreated samples
based on the differences in their microwave dielectric spectra (Agilent, 2004; Kent et al.,
2000).
Work using microwave dielectric spectroscopy to study seafood with added water and
polyphosphates is based on the principle that as water is added, other constituents, such as
naturally occurring salts, are diluted and can diffuse into the exterior water. Also, the
addition of polyphosphates adds ions as well as water, resulting in an altered spectrum (Kent
et al., 2000)
Microwave dielectric spectroscopy has been used to measure the composition, including
added water, of foods such as pork, poultry and prawns (Kent et al., 2001). It has also been
used to estimate the quality of seafood, by distinguishing whether raw materials had been
frozen and how well they had been stored (Kent et al., 2004). This work, conducted as part
of the EU 5th
Framework project ‘SEQUID’ (Seafood Quality Identification), has resulted in
formation of a company, Sequid Gmbh, specialising in high frequency testing and analysis of
Review of polyphosphates as additives and testing methods for them in scallops and prawns
Campden BRI Report: BC-REP-125846-01 38
food and environmental samples. Sequid have also developed a measuring device, the RFQ-
scan, based on the principle of dielectric spectroscopy, which detects added water
independently of the used additive (for further details see
http://www.sequid.de/index_en.html).
The main disadvantages of microwave dielectric spectroscopy are that it can only detect
added polyphosphates if there is an untreated sample to compare against, and some of the
calculations involved to determine differences between samples are complex. However, with
the automation of the measurement procedure and provision of software to handle data, the
issue of complex calculations may be negated.
4.5 Summary
A variety of testing methods for detection of added phosphates in seafood have been used.
Classical methods, such as measurement of moisture, protein and phosphorus content have
been used to calculate ratios, which can show when phosphates and/or water have been added
to seafood. Levels of protein however, are currently determined using interim nitrogen
factors for prawns and scallops.
Some methods measure phosphates directly, such as ion chromatography and capillary
isotachophoresis; but may not be able to differentiate between added and naturally occurring
phosphates. These methods suffer from the lack of background information on the natural
variation in levels of phosphates and moisture content of crustaceans and molluscs. Other
methods, such as nuclear magnetic resonance, thermo-differential-photometry and microwave
dielectric spectroscopy, have not to date been used for routine determination of added
phosphates.
Throughout the course of this review no official methods for measurement of ‘added’
phosphates or for total phosphate determination were found. There is a spectrophotometric
AOAC method for phosphorus in meat and meat products (AOAC, 1996). There is also a
British Standard method for the detection of polyphosphates in meat and meat products
(British Standard Method, 1981), which uses thin layer chromatography. Due to the high
variability in natural levels of phosphates and moisture in scallops and prawns, testing for
‘added’ phosphates may need to rely on calculation of ratios of constituents measured using
robust, sensitive methods.
Review of polyphosphates as additives and testing methods for them in scallops and prawns
Campden BRI Report: BC-REP-125846-01 39
5. References
Agilent Technologies. (2004). Microwave dielectric spectroscopy workshop: measure the
difference. Presentation PDF. Available at: http://www.home.agilent.com/upload/cmc_upload
/All/MWDielectricSpectroscopyWS.pdf?&cc=GB&lc=eng. Accessed: April 2012.
Analytical Methods Committee. (2000). Nitrogen factor for Nephrops norvegicus (scampi).
Analyst. 125. p347-351.
AOAC (Association of Analytical Communities). (1996). Official Method 991.27
Phosphorus in Meat and Meat Products.
AOAC (Association of Analytical Communities). (2011). Official Methods of Analysis. 18th
Ed. Rev. 4.
Bailey, D.M., Peck, L.S., Bock, C. and Pörtner, H-O. (2003). High-Energy Phosphate
Metabolism during Exercise and Recovery in Temperate and Antarctic Scallops: An In Vivo
31P-NMR Study. Physiological and Biochemical Zoology. 76 (5). p622-633.
Belloque, J., de la Fuente, M., A. and Ramos, M. (2000). Qualitative and quantitative
analysis of phosphorylated compounds in milk by means of 31
P-NMR. Journal of Dairy
Research. 67. p529-539.
British Standard Method. (1981). Methods of test for meat and meat products- Part 15:
Detection of polyphosphates. BS 4401-15 1981. (ISO 5553:1981, ISO title: Meat and meat
products – Detection of polyphosphates).
Botta, J.R. and Cahill, F.M. (1993). Moisture Content of Scallop Meat: Effect of Species,
Time of Season and Method of Determining “Added Water”, as published in the Conference
Proceedings from the Annual Conference Tropical and Subtropical Fisheries Technological
Conference of the Americas (August 29 - September 1, 1993, Williamsburg, Virginia,
U.S.A.). p43 – 50.
Canadian Food Inspection Agency (2011). Appendix 3 Canadian Guidelines for Chemical
Contaminants and Toxins in Fish and Fish Products. Product Inspection of Fish and Seafood.
(online) Available at : http://www.inspection.gc.ca/english/fssa/fispoi/man/samnem/app3e.
shtml#no8. Accessed: January 2012.
Chen, K.Y. (1999). Study of polyphosphate metabolism in intact cells by 31-P nuclear
magnetic resonance spectroscopy. Progress in Molecular and Subcellular Biology. (23).
p253-273.
Clark, J. (2012). Thin layer chromatography section of Understanding Chemistry website for
UK A-level chemistry students. Available at: http://www.chemguide.co.uk/analysis/
chromatography/thinlayer.html.
Review of polyphosphates as additives and testing methods for them in scallops and prawns
Campden BRI Report: BC-REP-125846-01 40
Codex Alimentarius Commission (2003). Proposed draft standard for quick frozen scallop
adductor muscle meat: Discussion paper on the moisture content and phosphates in scallops.
(Agenda Item 8 CX/FFP 03/09-Add.1). Joint FAO/WHO Food Standards Programme
CODEX Committee on Fish and Fishery Products. Available at: ftp://ftp.fao.org/codex
/ccffp26/fp0309ae.pdf. Accessed: January 2012.
Crawford, D.L. (1980). Meat yield and shell removal functions of shrimp processing. Oregon
State University Extension Marine Advisory Program. Land Grant/Sea Grant Cooperative
Special Report 597. Available at: http://ir.library.oregonstate.edu/xmlui/bitstream/handle
/1957/4804/SR%20no.%20597_ocr.pdf?sequence=1. Accessed: February 2012.
Crowther, J. (1955). Analysis of phosphate mixtures by filter paper chromatography.
Analytical Chemistry 26. p1383. (not obtained).
Cui, H., Cai, F. and Xu, Q. (2000). Determination of tripolyphosphate in frozen cod and
scallop adductor by ion chromatography. Journal of Chromatography A. 884. p89-92.
Cui, H. And Ivory, C.F. (2011). Isotachophoresis. The American Electrophoresis Society.
Available at: http://www.aesociety.org/areas/isotachophoresis.php. Accessed: April 2012.
Dafflon, O., Scheurer, L., Gobet, H. and Bosset, J.O. (2003). Polyphosphate determination in
seafood and processed cheese using high-performance anion exchange chromatography after
phosphatase inhibition using microwave heat shock. Mitteilungen aus dem Gebiete der
Lebensmitteluntersuchung und Hygiene. 94. p127-135.
Dionex (2010). Application update 172: Determination of polyphosphates using ion
chromatography. Dionex Corporation, Sunnyvale, California. Available at: http://www.
dionex.com/en-us/webdocs/86232-AU172-IC-Polyphosphates-Food-13April2010-
LPN2496.pdf. Accessed: April 2012.
Dušek, M., Kvasnička, F., Lukášková, L. and Krátká, J. (2003). Isotachophoretic
determination of added phosphate in meat products. Meat Science. 65. p765-769.
Dziezak, J.D. (1990). Phosphates improve many foods. Food Technology, p80-92. (not
obtained).
Eith, C., Kolb, M., Seubert, A. and Viehweger, K.H. (2001). Metrohm Monograph:Practical
Ion Chromatography, an introduction. Metrohm Ltd., Herisau, Switzerland.
Available at: http://www.melvynbecerra.cl/images/ICPractica.pdf. Accessed: April 2012.
European Parliament and Council Directive No 95/2/EC (1995) Food additives other than
colours and sweeteners. Available at: http://eur-lex.europa.eu/LexUriServ/LexUriServ.do?
uri=OJ:L:1995:061:0001:0040:EN:PDF. Accessed: January 2012.
Food and Agriculture Organisation of the United Nations (2003). FAO Food and Nutrition
Paper 77: Food energy – methods of analysis and conversion factors. Report of a Technical
Workshop, Rome, 3-6 December 2002. Available at: http://www.fao.org/DOCREP/006/
Y5022E/y5022e00.htm#Contents. Accessed: March 2012.
Review of polyphosphates as additives and testing methods for them in scallops and prawns
Campden BRI Report: BC-REP-125846-01 41
Food Standards Agency (2002a). Food Additives Legislation: Guidance Notes. Food
Standards Agency. Available at: http://www.food.gov.uk/multimedia/pdfs/guidance.pdf.
Accessed: February 2012.
Food Standards Agency (2002b). Survey of added water in raw scallops, ice-glazed (peeled)
scampi tails and scampi content in coated (breaded) scampi products (Number 30/02).
Available at: http://food.gov.uk/multimedia/pdfs/30scampi.pdf. Accessed: April 2012.
Gard, D.R., Burquin, J.C. and Gard, J.K. (1992). Quantitative analysis of short-chain
phosphates by phosphorus-31 nuclear magnetic resonance and interlaboratory comparison
with infrared and chromatographic methods. Analytical Chemistry. 64. p557-561.
German Official Standard. (1982). Official compilation of test procedures according to 35
LMBG. Examination of foodstuffs: Detection of condensed phosphates in meat and meat
products. (Standard on which Campden BRI method ref: TES-AC-229 is based).
Gibson, D.M. and Murray, C.K. (1973). Polyphosphates and fish: some chemical studies.
International Journal of Food Science and Technology 8 (2). p197-204.
Gonçalves, A.A. and Ribiero, J.L.D. (2008). Do phosphates improve the seafood quality?
Reality and Legislation. Pan-American Journal of Aquatic Sciences. 3 (3). p237-247.
Heitkemper, D.T., Kaine, L. A., Jackson, D.S. and Wolnik. K. A. (1993). Determination of
tripolyphosphate and related hydrolysis products in processed shrimp, as published in the
Conference Proceedings from the Annual Conference Tropical and Subtropical Fisheries
Technological Conference of the Americas (August 29 - September 1, 1993, Williamsburg,
Virginia, U.S.A.). p92-101.
Henson, L.S. and Kowalewski, K.M. (1992). Use of phosphates in seafood. Infofish
International, v.5, p52-54. (Not obtained).
Hornack, J. P. (1999). The Basics of NMR. Chester F. Carlson - Center for Imaging Science
(CIS). Available at: http://www.cis.rit.edu/htbooks/nmr/inside.htm. Accessed: March 2012.
Huss, H.H. (1995). FAO Fisheries Technical Paper 348: Quality Changes in fresh fish.
Available at: http://www.fao.org/DOCREP/V7180E/V7180E00.HTM. Accessed: April 2012
IUPAC (1997). Compendium of Chemical Terminology, 2nd ed. (the "Gold Book").
Compiled by A. D. McNaught and A. Wilkinson. Blackwell Scientific Publications, Oxford.
XML on-line corrected version: created by M. Nic, J. Jirat, B. Kosata; updates compiled by
A. Jenkins. Available at: http://goldbook.iupac.org/. Accessed: April 2012.
Jastrzębska, A. (2006). Determination of sodium tripolyphosphate in meat samples by
capillary zone electrophoresis with on-line isotachophoretic sample pre-treatment. Talanta.
69. p1018-1024.
Jastrzębska, A. (2009). Modifications of spectrophotometric methods for total phosphorus
determination in meat samples. Chemical Papers, 63 (1). p47-54.
Review of polyphosphates as additives and testing methods for them in scallops and prawns
Campden BRI Report: BC-REP-125846-01 42
Jastrzębska, A. and Szlyk, E. (2009). Application of 31
P NMR for added polyphosphate
determination in pork meat. Chemical Papers. 63 (4). p414-419. (Abstract only).
Jastrzębska, A. (2011). Capillary isotachophoresis as rapid method for determination of
orthophosphates, pyrophosphates, tripolyphosphates and nitrites in food samples. Journal of
Food Composition and Analysis. 24. p1049-1056.
Jastrzębska, A., Hol, A. and Szlyk, E. (2008). Simultaneous and rapid determination of
added phosphorus (V) compounds in meat samples by capillary isotachophoresis. LWT-Food
Science and Technology, 41. p2097-2103.
Jastrzębska, A., Hrynczyszyn, P. and Szłyk, E. (2009). Comparison of cITP and 31
P NMR
methods for determination of polyphosphates in meat product and sea fruits. Czech Journal
of Food Science, 27. pS340. (Abstract only).
Kates, M. (1972). Techniques in Lipidology. North-Holland Publishing Company,
Amsterdam.
Kaufmann, A., Maden, K., Leisser, W., Matera, M. and Gude. T. (2005). Analysis of
polyphosphates in fish and shrimps tissues by two different ion chromatography methods:
Implications on false-negative and –positive findings. Food Additives and Contaminants. 22
(11). p1073-1082.
Kent, M. and Anderson, D. (1996). Dielectric studies of added water in poultry meat and
scallops. Journal of Food Engineering. 28. p239-259.
Kent, M., MacKenzie, K., Berger, U-K., Knöchel, R. and Daschner, F. (2000). Determination
of prior treatment of fish and fish products using microwave dielectric spectra. European
Food Research and Technology. 210. p427-433.
Kent, M., Knöchel, R., Daschner, F. and Berger, U-K. (2001). Composition of foods
including added water using microwave dielectric spectra. Food Control. 12 (7). p467-482.
(Abstract only)
Kent, M., Knöchel, R., Daschner, F., Schimmer, O., Oehlenschläger, J., Mierke-Klemeyer,
S., Barr, U-K., Floberg, P., Tejada, M., Huidobro, A., Nunes, L., Batista, I. and Martins, A.
(2004). Time domain reflectometry as a tool for the estimation of quality in foods.
International Agrophysics. 18. p225-229.
Kruse, R. and Bartelt, E. (2009). Phosphates in fishery products. Fleischwirtschaft. 89 (2).
p144-148. (Article in German – abstract only).
Krzynowek, J. and Panunzio, L.J. (1995). Practical application of thin-layer chromatography
for detection of polyphosphates in seafood. Journal of AOAC International, 78 (5). p1328-
1332.
Lampilla, L.E. (1992). Functions and uses of phosphates in the seafood industry. Journal of
Aquatic Food Product Technology, 1 (3): 29-41.
Review of polyphosphates as additives and testing methods for them in scallops and prawns
Campden BRI Report: BC-REP-125846-01 43
Lampilla, L.E. (1993). Polyphosphates: Rationale for use and functionality in seafood and
seafood products. Conference Proceedings from the Annual Tropical and Subtropical
Fisheries Technological Conference of the Americas (August 29 - September 1, 1993,
Williamsburg, Virginia, U.S.A.). p13-20.
Lewis, D.F., Groves, K.H.M. and Holgate, J.H. (1986). Action of polyphosphates in meat
products. Food Microstructure. 5. p53-62.
Li, S.F.Y. (1993). Capillary electrophoresis: principles, practise and applications. Journal of
Chromatography Library – volume 52. Elsevier, London.
Li, R., Kerr, W.L., Toledo, R.T. and Teng, Q. (2001). 31
P NMR analysis of chicken breast
meat vacuum tumbled with NaCl and various phosphates. Journal of the Science of Food and
Agriculture. 81. p576-582.
Materials Evaluation and Engineering Inc. (2010). Handbook of analytical methods for
materials. Available at: http://mee-inc.com/hamm72d.pdf. Accessed: April 2012.
National Oceanic and Atmospheric Administration. (2011). Inspection Manual 25: Seafood
Inspection Programme, Chapter 4: Policies, Procedures, and Requirements for the Audit of
Fisheries Products on a Lot by Lot Basis: Product (Lot) Inspection Procedures – Scallop
moisture determination. Available at:http://www.seafood.nmfs.noaa.gov/NOAA%20
Handbook25/Scallop_Moisture.html. Accessed: April 2012.
O’Neill, I.K. and Richards, C.P. (1978). Specific detection of polyphosphates in frozen
chicken by combination of enzyme blocking and 31P-FTNMR spectroscopy. Chem Ind. p65-
67. (Not obtained).
Offer , G. and Trinick, J. (1983). A unifying hypothesis for the mechanism of changes in the
water-holding capacity of meat. Journal of the Science of Food and Agriculture. (34). p1018.
Reddy, B.R. and Finne, G. (1985). A preliminary procedure for the detection of condensed
phosphates in shrimp using thin-layer chromatography. As published in the Proceedings of
the 10th Annual Tropical and Subtropical Fisheries Technological Conference of the
Americas (January 7-10, 1985, New Orleans, Louisiana, U.S.A.), p149-156. Available at:
http://fshn.ifas.ufl.edu/seafood/sst/AnnPdf/10th_149.pdf. Accessed: March 2012.
Rippen, T., Sutton, H., Lacey, P., Lane, R., Fisher, R. and Dupaul, W. (1993). Functional,
microbiological and sensory changes in sea scallops (Placopecten megallanicus) treated with
sodium tripolyphosphate during iced storage. Proceedings of the 18th
Annual Tropical and
Subtropical Fisheries Technological Conference of the Americas. Virginia (USA). p51-71.
Schnee, R. (2004). Budenheim Phosphates for Seafood Processing. Chemische Fabrik
Budenheim (Not obtained).
Sekiguchi, Y., Matsunaga, A., Yamamoto, A. and Inoue, Y. (2000). Analysis of condensed
phosphates in food products by ion chromatography with an in-line hydroxide eluent
generator. Journal of Chromatography A. 811. p639-644.
Review of polyphosphates as additives and testing methods for them in scallops and prawns
Campden BRI Report: BC-REP-125846-01 44
Spyros, A. and Dias, P. (2009). 31
P NMR spectroscopy in food analysis. Progress in Nuclear
Magnetic Resonance Spectroscopy. 54. p195-207. Available at: http://www.scribd.com/doc
/54517674/31P-NMR-Spectroscopy-in-Food-Analysis. Accessed: April 2012.
Storey, K.B. (2004). Oxygen Limitation and Metabolic Rate Depression. Functional
Metabolism: Regulation and Adaption. Wiley-Liss, New Jersey. p416-417.
Sutton, A.H. (1973). The hydrolysis of sodium triphosphate in cod and beef muscle. Journal
of Food Technology. 8. p185-195.
Szlyk, E. and Hrynczyszyn, P. (2011). Phosphate additives determination in meat products
by 31-phosphorus nuclear magnetic resonance using new internal reference standard:
hexamethylphosphoroamide. Talanta. 84. p199-203.
Taylor, P.G. (1993). The application of phosphates in the processing of the pacific shrimp, or
what's so different about this use? Conference Proceedings from the Annual Tropical and
Subtropical Fisheries Technological Conference of the Americas (August 29 - September 1,
1993, Williamsburg, Virginia, U.S.A.). p72-77.
Tenhet, V., Finne, G., Nickelson, R. and Toloday, D. (1980). Determination of phosphorus in
shrimp treated with sodium tripolyphosphate. Proceedings of the 5th Annual Tropical and
Subtropical Fisheries Technological Conference of the Americas. (April 27-30, 1980,
Charleston, South Carolina). p195-204.
Þórarinsdóttir, K.A., Arason, S. and Þorkelsson, G. (2010). The role and fate of added
phosphates in salted cod products. Icelandic Food and Biotech R&D, Report Summary,
Matís. July 2010. p1-28.
Trout, G.R. and Schmidt, G.R. (1984). Effect of phosphate type and concentration, salt level
and method of preparation on binding in restructured beef rolls. Journal of Food Science. 49
(3). p687-694.
Torry Research Station (2001). Polyphosphates in Fish Processing. FAO Corporate
Document Repository. (31). Available at: http://www.fao.org/wairdocs/tan/x5909E/
x5909e01.htm. Accessed: January 2012.
Torry Research Station (2001). Catching and Processing Scallops and Queens. FAO
Corporate Document Repository. (46). Available at: http://www.fao.org/wairdocs/tan/x5923E
/x5923e01.htm. Accessed: February 2012.
UKAFFP, BFFF, BRC, BHA, Seafish Industry Authority, LACOTS and APA. (1998). Code
of Practice on the Declaration of Fish Content in Fish Products. Available at: http://www.
seafish.org/media/Publications/Fish_Content_CoP.pdf. Accessed: March 2012.
Ünal, S.B., Erdo, F., Ekiz, H.B. and Özdemir, Y. (2004). Experimental theory, fundamentals
and mathematical evaluation of phosphate diffusion in meat. Journal of Food Engineering. 65
(2). p263-272.
Review of polyphosphates as additives and testing methods for them in scallops and prawns
Campden BRI Report: BC-REP-125846-01 45
Velinov, P.D., Zhikov, M.V. and Cassens, R.G. (1990). The effect of tumbling, sodium
chloride and polyphosphates on the microstructure and appearance of whole-muscle
processed meats. Food Structure. 9. p91-95.
Vovcsko, J. (1997). When does the use of tripolyphosphates equal economic fraud? Seafood
Supplier. Available at: http://www.southeasternfish.org/Members/Documents/stpreg.htm
Accessed: January 2012.
Wood, H.G. and Clark, J.E. (1988). Biological aspects of inorganic polyphosphates. Annual
Review of Biochemistry. 57. p235-260.
Zhong, Z. and Li, G. (2009). Determination of phosphate, pyrophosphate, metaphosphate
and total phosphorus in seafoods by ion chromatography. Se Pu. 27 (4). p499-504. (Article
in Chinese - abstract accessed only).
Other sources of information - references obtained but not included
Applewhite, L., Otwell, W. S. and Garrido, L. (1993). Consumer evaluations of phosphate
shrimp and scallops. Conference Proceedings from the Annual Tropical and Subtropical
Fisheries Technological Conference of the Americas (August 29 - September 1, 1993,
Williamsburg, Virginia, U.S.A.). p101-106.
Baluyot, E.S. and Hartford, C.G. (1996). Comparison of polyphosphate analysis by ion
chromatography and modified end-group titration. Journal of Chromatography. 739. p217-
222.
DuPaul, W. D., Fisher, R. A. and Kirkley, J. E. (1990). An evaluation of at-sea handling
practices: Effects on sea scallop meat quality, volume and integrity. Contract report
submitted to Gulf and South Atlantic Fisheries Development Foundation, Inc.
Available at: http://web.vims.edu/GreyLit/VIMS/VSG-91-01.pdf. Accessed: February 2012.
DuPaul, W. D., Otwell, W. S. and Rippen, T.E. (1993). An evaluation of processed Atlantic
sea scallops (Placopecten magellanicus). Conducted for the American Scallop Association
and The International Food Additives Council. Available at: http://web.vims.edu/
GreyLit/VIMS/mrr93-1.pdf?svr=www. Accessed: February 2012.
Fisher, R. A., DuPaul, W.D. and Rippen, T.E. (1996). Nutritional, proximate and microbial
characteristics of phosphate processed sea scallops (Placopecten magellanicus). Journal of
Muscle Foods, 7. p73-92.
Gonçalves, A. A. and Ribeiro, J. L. D. (2008). Optimisation of the freezing process of red
shrimp (Pleoticus muelleri) previously treated with phosphates. International Journal of
Refrigeration, 31. p1134-1144.
Nouchpramool, K. (1979). Effect of condensed phosphates and steam pre-cooking time on the
yield and quality of cooked shrimp (Pandalus jordani) meat. M. S. Thesis. Oregon State
University, Department of Food Science and Technology, Corvallis, OR.
Available at: http://ir.library.oregonstate.edu/xmlui/bitstream/handle/1957/27310/
NOUCHPRAMOOLKOVIT1979.pdf?sequence=1. Accessed: February 2012.
Review of polyphosphates as additives and testing methods for them in scallops and prawns
Campden BRI Report: BC-REP-125846-01 46
Otwell, W. S. (1993). Use of phosphates with Penaeid shrimp. Conference Proceedings from
the Annual Tropical and Subtropical Fisheries Technological Conference of the Americas
(August 29 - September 1, 1993, Williamsburg, Virginia, U.S.A.). p78-91.
Paul, S., Reza, M. S., Mandal, A. S. M. S., Ahmed, I. M., Khan, M. N. A., Islam, M. N. and
Kamal, M. (2012). Effect of sodium tripolyphosphate (STPP) and foreign materials on the
quantity of giant freshwater prawn (Macrobrachium rosenbergii) under ice storage
condition. Food and Nutrition Sciences. 3. p34-39.
Rattanasatheirn, N., Benjakul, S., Visessanguan, W. and Kijroongrojana, K. (2008).
Properties, translucence and microstructure of pacific white shrimp treated with mixed
phosphates as affected by freshness and deveining. Journal of Food Science, 73:1. p.S31-S40.
Regenstein, J. M. (1984). Protein-water interactions in muscle foods. Reciprocal Meat
Conference Proceedings, 37. p44-51.
Regenstein, J., Lu, X. and Weilmeier. (1993). Functionality of polyphosphates. Conference
Proceedings from the Annual Tropical and Subtropical Fisheries Technological Conference
of the Americas (August 29 - September 1, 1993, Williamsburg, Virginia, U.S.A.). p21-42.
Rippen, T., Sutton, H., Lacey, P., Lane, R. and DuPaul, W. (1993). Functional,
microbiological and sensory changes in sea scallops (Placopecten magellanicus) treated with
sodium tripolyphosphate during iced storage. Conference Proceedings from the Annual
Tropical and Subtropical Fisheries Technological Conference of the Americas (August 29 -
September 1, 1993, Williamsburg, Virginia, U.S.A.). p51-71.
Turan, H., Kaya, Y. and Erkoyuncu, İ. (2003). Effects of glazing, packaging and phosphate
treatments on drip loss in rainbow trout (Oncorhynchus mykiss W., 1792) during frozen
storage. Turkish Journal of Fisheries and Aquatic Sciences. 3. p105-109.