Embed Size (px)
Citation preview

7/24/2019 SR258 - Critical Properties of Mortar
http://slidepdf.com/reader/full/sr258-critical-properties-of-mortar 1/89
STUDY REPORT
SR 258 (2011)
Critical properties of
mortar for good seismicperformance of brick
veneer
S. J. Thurston

7/24/2019 SR258 - Critical Properties of Mortar
http://slidepdf.com/reader/full/sr258-critical-properties-of-mortar 2/89
Preface
The quality of brick veneer construction has improved markedly in recent years, withrequirements for the ties to be screw-fixed to the timber framing and with the advent of lighterbricks with vertical penetrations.
This is the sixth BRANZ investigation of a series looking into the seismic performance ofbrick veneer. Previously:
In Phase 1 slow cyclic tests were performed on two full-scale veneer specimens where the
veneer clad a rectangular room which had both window and door openings. In Phases 2 and 3 a shake table test was performed on a clay brick veneer-clad room and
concrete brick veneer-clad room respectively. These used an inertial mass to simulate roof
loads.
In Phase 4 a two-storey brick veneer building was cyclically racked to investigate its seismic
performance.
In Phase 5 the seismic performance of brick veneer walls was tested in the out-of-plane
direction using a shake table.
The above studies all used the same pre-mixed mortar. In this latest study the effect ofmortar type and quality is examined and it consisted of three parts:
In Stage 1 the properties of mortar collected on-site were measured.
Stage 2 consisted of elemental laboratory tests measuring mortar bond and compression
strength properties with variables including sand type and admixtures used

7/24/2019 SR258 - Critical Properties of Mortar
http://slidepdf.com/reader/full/sr258-critical-properties-of-mortar 3/89
i
Frontispiece. Flow chart of factors affecting mortar properties and veneer seismic performance
considered in this project

7/24/2019 SR258 - Critical Properties of Mortar
http://slidepdf.com/reader/full/sr258-critical-properties-of-mortar 4/89
Critical properties of mortar for good seismic
performance of brick veneer
BRANZ Study Report SR 258
S. J. Thurston
Reference
Thurston SJ. 2011. „Critical Properties of Mortar for Good Seismic Performance of BrickVeneer ‟. BRANZ Study Report 258. BRANZ Ltd, Judgeford, New Zealand.
Abstract
Recent cyclic displacement tests and shake table tests on full-scale buildings by theauthor have shown that modern single and two-storey brick veneer New Zealandhouses, constructed using good mortar, will perform very well under both in-plane andout-of-plane testing. The veneer can be relied on to carry a significant portion of theseismic design load.
In this project mortar compression strength and the mortar to brick bond strength were

7/24/2019 SR258 - Critical Properties of Mortar
http://slidepdf.com/reader/full/sr258-critical-properties-of-mortar 5/89
Contents Page
1. INTRODUCTION AND OUTLINE OF WORK ................................................................................ 1
2. LITERATURE SURVEY .................................................................................................................... 2
2.1 Mortar components and properties .................................................................................................... 2
2.1.1 Mortar-to-brick tensile bond strength ................................................................................. 2
2.1.2 Mortar-to-tie shear bond strength .......................................................................................... 4
2.1.3 Dry-bedding or full embedment of ties in mortar .......................................................... 4
2.1.4 Mortar compressive (crushing) strength ........................................................................... 5
2.1.5 Water content ...................................................................................................................................... 6
2.1.6 Workability ............................................................................................................................................ 6
2.1.7 Flow/water retentivity .................................................................................................................... 6
2.1.8 Sand ............................................................................................................................................................ 7
2.1.9 Admixtures .......................................................................................................................................... 10
2.1.10 Colouring admixtures .................................................................................................................... 11
2.1.11 Lime.......................................................................................................................................................... 12 2.1.12 Properties of mortar in a veneer ............................................................................................ 12
2.1.13 Durability .............................................................................................................................................. 13
2.2 Masonry units ................................................................................................................................................. 14
2.3 Workmanship and construction procedures .............................................................................. 14
2.3.1 Poor construction techniques ................................................................................................. 14
2.3.2 Tooling mortar joints..................................................................................................................... 15
2 3 3 Tapping 16

7/24/2019 SR258 - Critical Properties of Mortar
http://slidepdf.com/reader/full/sr258-critical-properties-of-mortar 6/89
4.4 Mortar bond direct tension tests using brick cruciforms................................................... 32
4.5 Brick tie pullout test .................................................................................................................................. 34
4.6 Test results on elemental specimens using Sand Y ............................................................... 36
4.6.1 Properties of Sand Y used .......................................................................................................... 36
4.6.2 Test results from samples made on Day One and Day Two .................................... 36
4.7 Test results on elemental specimens using various sands .............................................. 52
4.7.1 Properties of sands used ........................................................................................................... 52
4.7.2 Test results ........................................................................................................................................ 56
5. STAGE III. SHAKE TABLE TESTS ON BRICK VENEER WALLS .......................................... 59 5.1 Elemental test results ............................................................................................................................... 59
5.1.1 Relationship between flow and bond strength for all elemental tests ......... 59
5.2 Specimen construction ........................................................................................................................... 63
5.3 in-plane testing prior to the out-of-plane tests ......................................................................... 63
5.4 Seismic design loads ................................................................................................................................ 64
5.4.1 Single-storey veneer construction ..................................................................................... 65
5.4.2 Upper storey of two-storey veneer ....................................................................................... 65 5.5 Out-of-plane testing ................................................................................................................................... 65
5.5.1 Shake table tests ............................................................................................................................ 65
5.5.2 Test set-up .......................................................................................................................................... 66
5.5.3 Natural frequency measurements ........................................................................................ 67
5.5.4 Free vibration tests ........................................................................................................................ 67
5.6 Out-of-plane results .................................................................................................................................... 67
5 6 1 Veneer collapse mechanisms 67

7/24/2019 SR258 - Critical Properties of Mortar
http://slidepdf.com/reader/full/sr258-critical-properties-of-mortar 7/89
Figures Page
Figure 1. Sand grading curves from BDRI (1980) ................................................................... 8
Figure 2. Graph of motar-to-brick bond strength versus fines content ................................... 10
Figure 3. Grading curve of the BRANZ Kapiti sand sample .................................................. 20
Figure 4. System for measuring bond strength from brick couplets in the greater Aucklandregion ................................................................................................................................... 22
Figure 5. Relationship between mortar bond and compressive strengths from mortar sampledin the greater Auckland region .............................................................................................. 24
Figure 6. Sand gradings for J1 to J10 ................................................................................... 26 Figure 7. Sand gradings for samples taken from sites J12 to J15 ......................................... 27
Figure 8. Relationship between mortar bond and compressive strengths from mortar takenfrom sites in the Wellington region ........................................................................................ 28
Figure 9. Concrete mixer used for the BRANZ tests ............................................................. 30
Figure 10. Couplet test – couplet specimen, timber packers, vice and pipe clamp................ 31
Figure 11. Couplet test – thrust bar and load cell on the end of the pipe .............................. 32
Figure 12. Cruciform test specimen ...................................................................................... 33
Figure 13. Cruciform direct tension test ................................................................................ 33 Figure 14. Tie test specimen ................................................................................................ 34
Figure 15. Typical failure surface in the mortar after the tie test ............................................ 35
Figure 16. Tie pullout test ..................................................................................................... 35
Figure 17. Grading curve for Sand Y used in mortar made on 29 June and 13 July 2009..... 36
Figure 18. Relationship between seven day couplet bond strength and mortar flow whencement content varied .......................................................................................................... 47
Figure 19. Relationship between seven day couplet bond strength and mortar flow forconstant cement content ...................................................................................................... 47
Fig re 20 Relationship bet een co plet and direct tension bond strength 48

7/24/2019 SR258 - Critical Properties of Mortar
http://slidepdf.com/reader/full/sr258-critical-properties-of-mortar 8/89
Figure 40. Typical spectra calculated from measured table accelerations ............................ 69
Figure 41. Influence of wall flexing on tie pullout from the mortar bed for dry-bedded
construction .......................................................................................................................... 75 Figure 42. Photographs of veneer shedding mechanisms for the four test walls ................... 76
Figure 43. Spectra calculated from measured table accelerations for Wall W9 ..................... 77
Figure 44. Maximum spectra calculated from measured table accelerations for all walls ...... 77
Figure 45. Full acceleration excitation record ....................................................................... 80
Figure 46. Initial portion of acceleration excitation record ..................................................... 81
Tables PageTable 1. Site mixes sampled in the greater Auckland region ................................................ 23
Table 2. More details of site mixes sampled in the greater Auckland region ......................... 23
Table 3. Legend to tables giving site mixes sampled in the greater Auckland region ............ 23
Table 4. Mortar strengths measured from site samples collected in the greater Aucklandregion ................................................................................................................................... 24
Table 5. Mortar strengths measured in the Wellington region ............................................... 27
Table 6. Relationship between test group label and mortar cement content ......................... 30 Table 7. Samples made with Sand Y after five minutes mixing using specified levels ofadmixtures ............................................................................................................................ 40
Table 8. Samples made with Sand Y after 25 minutes mixing using specified levels ofadmixtures ............................................................................................................................ 40
Table 9. Samples made with Sand Y after five minutes mixing using 3 x specified levels ofadmixtures ............................................................................................................................ 41
Table 10. Ratio of strengths of samples made with Sand Y after five minutes mixing to thosemade after 25 minutes mixing............................................................................................... 41
T bl 11 R ti f t th f l d ith S d Y ft fi i t i i t th

7/24/2019 SR258 - Critical Properties of Mortar
http://slidepdf.com/reader/full/sr258-critical-properties-of-mortar 9/89
1. INTRODUCTION AND OUTLINE OF WORK
BRANZ has performed several in-plane and out-of-plane tests on full-scale brick veneerbuildings in the last few years. This work and a summary of tests by others on the out-of-plane performance of brick veneer is described by Thurston and Beattie (2011). This reportfocuses on the influence of mortar on the seismic resistance of brick veneer.
Concerns have been expressed by the industry about the compressive strength of mortarthat is being used for masonry construction in New Zealand buildings. NZS 4210 (SNZ 2001)
Masonry construction – materials and workmanship requires that the seven day compressivestrength of mortar “be not less than 12.5 MPa for structural compliance with NZS 3604”. (However, as brick veneer is “non-structural” this requirement does not apply to mortar forbrick veneer.) A member of the NZS 4210 Committee has advised that the value of 12.5 MPahas no technical basis as such and there is no clear understanding of what effect mortarstrength has on the overall structural performance of masonry.
Pre-mixed mortar, that is designed to deliver this strength, is commercially available but is
only used in 5-10% of brick veneer construction (by far the most common approach is to usesite-mixed mortar). A recent private pilot-scale survey of 10 sites in Auckland found anaverage strength of site-mixed mortar of 7.08 MPa with a minimum of 5.2 MPa and amaximum of 10.0 MPa.
The research hypothesis for this project is that “a threshold measurable value for mortarcompressive or bond strength can be established below which the seismic performance ofbrick veneer construction is compromised”. The project consisted of a series of experimentson a range of mortar strengths and components to ascertain the minimum level that achieves
ti f t i i f Thi i th b i f th d ti i i thi

7/24/2019 SR258 - Critical Properties of Mortar
http://slidepdf.com/reader/full/sr258-critical-properties-of-mortar 10/89
“Satisfactory performance” is defined as the ability to resist a design level earthquake for
locations where the seismic “Z” factor in Table 3.3 of NZS 1170.5 (SNZ 2004) = 0.40 (e.g.Wellington) without any masonry shedding. Many may suggest that some masonry sheddingis acceptable as the consequent life risk on a single-storey building is low and the veneer canbe repaired for a moderate cost. However, for the purposes of this project, for economic andsocial reasons it is considered unacceptable for a large number of houses to shed brickveneer should a design earthquake strike a major metropolitan area.
2. LITERATURE SURVEY
This project is intended to determine what mortar properties are necessary to ensurebrick veneer has good seismic performance. The literature survey examines thevarious properties of mortar to identify key parameters found by others.
BDRI (1977) lists the four functions of mortar as:
1. To provide a joint of sufficient thickness to accommodate bricks of slightly
different sizes – 10 mm average mortar thickness is regarded as being adequate
for this purpose;
2. To provide bond of sufficient strength to resist the lateral (wind and earthquake)
loads to which the wall will be subjected;
3. To provide an even bedding for the bricks with sufficient strength to carry the
compressive loads within the brickwork; and
4. To give a weather-tight and durable wall.
Thi j t i f d it (2) R di it (3) th i t th f
7/24/2019 SR258 - Critical Properties of Mortar
http://slidepdf.com/reader/full/sr258-critical-properties-of-mortar 11/89
use mortars having high water retentivity;
mix mortar to the maximum water content compatible with workability;
use masonry units having moderate initial rates of absorption when laid;
use bricks with a rough surface;
minimise the time between spreading mortar and placing masonry unity;
apply pressure between bricks in forming the mortar joint and do not
subsequently disturb laid units; and
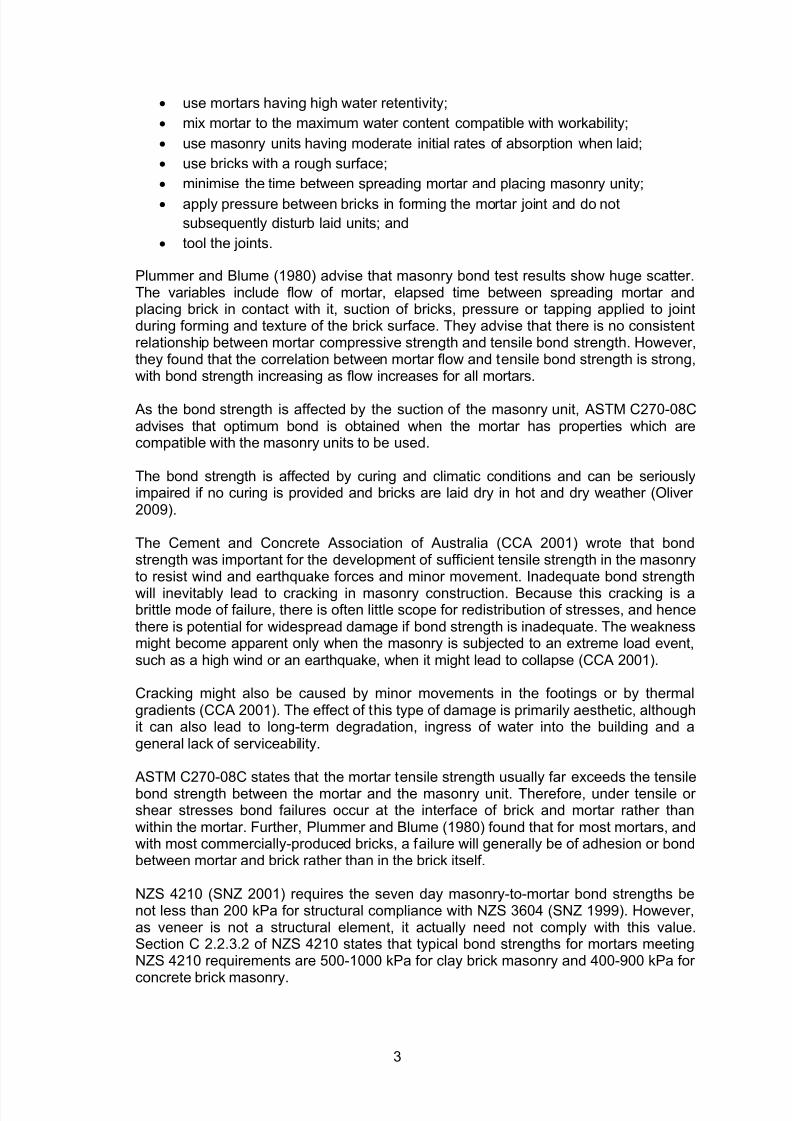
tool the joints.
Plummer and Blume (1980) advise that masonry bond test results show huge scatter.The variables include flow of mortar, elapsed time between spreading mortar andplacing brick in contact with it, suction of bricks, pressure or tapping applied to jointduring forming and texture of the brick surface. They advise that there is no consistentrelationship between mortar compressive strength and tensile bond strength. However,they found that the correlation between mortar flow and tensile bond strength is strong,with bond strength increasing as flow increases for all mortars.
As the bond strength is affected by the suction of the masonry unit, ASTM C270-08Cadvises that optimum bond is obtained when the mortar has properties which arecompatible with the masonry units to be used.
The bond strength is affected by curing and climatic conditions and can be seriouslyimpaired if no curing is provided and bricks are laid dry in hot and dry weather (Oliver2009).
The Cement and Concrete Association of Australia (CCA 2001) wrote that bondt th i t t f th d l t f ffi i t t il t th i th

7/24/2019 SR258 - Critical Properties of Mortar
http://slidepdf.com/reader/full/sr258-critical-properties-of-mortar 12/89
Both NZS 4210 and AS 3700 (SA 2001) are based on the bond strength measured atan age of seven days, as it is not usually convenient to continue testing beyond seven
days where site control monitoring of strength is required. As the strength of veneermortar is usually limited by lack of water for the hydration process due to water lossfrom evaporation or being “sucked” out by the brick, the seven day strengths may beclose to the strength finally achieved over time. The relationship between bond strengthand time is examined in the paragraph below.
CCA (2001) found that for specimens air cured in the laboratory the bond strengthtested at 28 days increased by 9% from that tested at seven days for clay bricks.However, if the specimens were cured under plastic the increase was 21% as therewas less water loss by evaporation. The average ratio of bond strengths for outsideand inside air cured specimens in Australia was 0.79 at seven days and 0.94 at 28days. That these ratios are less than 1.0 indicates that more moisture was lost fromevaporation from outside exposure and less hydration occurred. The results alsohighlight the beneficial effect of keeping new veneers moist and curing under plastic tofacilitate hydration of the cement. However, excessive wetting of new masonryconstruction can lead to problems with shrinkage and efflorescence and is notrecommended by the CCA.
2.1.2 Mortar-to-tie shear bond strength
Plummer and Blume (1980) reported that high compressive strength mortars havehigher bond strength between the mortar and steel. The compressive strength ofmortar increases with increased proportions of cement and with decreased water-cement ratio.
Th t d B tti (2009) f d th t h b i k ti b l i th t

7/24/2019 SR258 - Critical Properties of Mortar
http://slidepdf.com/reader/full/sr258-critical-properties-of-mortar 13/89
Placing a daub of mortar at a single tie location (whether on the tie or the brick
surface) and then screwing the tie to the adjacent stud before moving on to thenext tie location is cumbersome, as it requires picking up and putting down boththe power tool and trowel for each tie.
(b) Dry embedment. For a whole row of bricks ties are placed on the bottom brick withno mortar between the underside of the tie and brick and screwed to the adjacentstud. Some time later a bed of mortar is placed onto the bottom brick (and thereforeonto the top surface of the tie) in the normal way.
Based on brick tie tests to AS/NZS 2699.1 (SNZ 2000), BRANZ has provided anopinion for several brick tie types for given tie classifications that they may be used withdry embedment. Nowadays, most brick veneer in New Zealand is laid using dry-bedding. For this reason the tests in this report have generally used ties having dry-bedding, although for comparative purposes full tie embedment was also tested.
2.1.4 Mortar compressive (crushing) strength
Testing mortar compression strength requires mortar samples to be taken at the time ofmixing and stored for 28 days (at 100% humidity and 21oC) before testing inaccordance with NZS 3112 (1986).
NZS 4210 (SNZ 2001) calls for a compressive 28 day mortar strength of 12.5 MPa forstructural compliance with NZS 3604:1999 Timber framed buildings, although this isnot intended to apply to veneers. The standard also states that the strength of mortarsfor veneers shall follow the requirements of masonry suppliers. Some of these specifya strength of 12.5 MPa, and others rely on the mortar mix compositions listed in Table
7/24/2019 SR258 - Critical Properties of Mortar
http://slidepdf.com/reader/full/sr258-critical-properties-of-mortar 14/89
increases with cement content (Guirguis et al 2003), the compressive strength ofmortar can be an indicator of durability.
2.1.5 Water content
ASTM C270-08a (2008) states that water content is possibly the most misunderstoodaspect of masonry mortar, probably due to the confusion between mortar and concreterequirements. Water requirement for mortar is quite different from that for concretewhere a low water:cement ratio is desirable. Mortars should contain the maximumamount of water consistent with optimum workability. Mortar should also be re-
tempered to replace water lost by evaporation.
BDRI (1977) state that wet mortar encourages complete intimate contact with the brickto assist in the development of bond strength. In their tests in Australia the high water-to-cement ratio implied by this technique was not sustained for long as within about20 minutes of placing mortar between two bricks about 40-70% of the total water in themortar was sucked out by the brick. This movement of water into the brick was statedto carry a concentration of cementitious material to the interface of the brick and mortar
to enhance the strength of the adhesive bond between them.
Plummer and Blume (1980) recommend that mortar for masonry construction shouldbe mixed with the maximum amount of water consistent with workability.
2.1.6 Workability
BDRI (1977) define workability as the combination of flow and cohesiveness. Theystate that it can only be judged by how the mortar feels on the trowel. Workability is af ti f th t li i d t t t d th d di W ll d d

7/24/2019 SR258 - Critical Properties of Mortar
http://slidepdf.com/reader/full/sr258-critical-properties-of-mortar 15/89
heat or retarded by cold. BDRI (1977) recommend that for good bond, high suctionbricks should be combined with mortars with high water retention values and that, with
low suction bricks, lower water retention is desirable.
ASTM C270-08a (2008) states that bond strength increases as flow increases to thepoint where detectable bleeding begins. Bleeding was defined as migration of freewater through the mortar to its surface. Plummer and Blume (1980) also found that thetensile bond strength between mortar and brick increases with increased flow of themortar.
ASTM C270-08a states that mortars used on-site normally have initial flows in therange of 130-150% to produce a workability satisfactory to the mason. Glencross-Grantand Walker (2003) suggested 105-115% and Plummer and Blume (1980) 110%-140%.However, those measured at BRANZ in Section 4 of this report were in the range of 66-134% with an average of 98%.
2.1.8 Sand
The bulk of mortar is sand. An increase in sand content increases the setting time and
reduces potential cracking due to shrinkage of the mortar joint. The well-graded sandspecified in standards such as NZS 3103 (1991) (called “standard sand” and oftenused for laboratory mortar tests) may produce quite different test results from sand thatis used on-site.
Sand is usually described by the masses of different sized grains that have beenseparated as they pass through a group of standard sieves. A range of proportions ofeach of the grain sizes is permitted by a sand specification, and when this range is
l tt d hi ll it d di l Th lt f t t ti l

7/24/2019 SR258 - Critical Properties of Mortar
http://slidepdf.com/reader/full/sr258-critical-properties-of-mortar 16/89

7/24/2019 SR258 - Critical Properties of Mortar
http://slidepdf.com/reader/full/sr258-critical-properties-of-mortar 17/89
(b) Satisfies (1) and (2) below:
(1) Has been tested as a mortar at least twice in the last 12 months and has
achieved in each instance at least 80% of the compressive strength ofmortar made using standard sands;
(2) Has successful history of flow time and voids content test results.
The writer questions whether this methodology will prove sands do not containdeleterious material. The procedure is very complex for tradespeople to achieve orBuilding Consent Authorities (BCAs) to oversee. Most mortar sand suppliers in NewZealand do not claim to supply sand which conform to NZS 3103. One of the reasons
sometimes given is the difficulty in obtaining the “standard sand” which is necessary forthe comparative tests. Thus, mortar used in New Zealand is generally from non-complying sand.
ASTM C270-089 (2008) states that well-graded sand reduces bleeding and improvesworkability. Sands deficient in fines produce coarse mortars of low workability, whilesands with excessive fines produce weak mortars. CCA(2001) recommends that onlyclean sharp sand be used.
BDRI (1977) also recommend using well-graded sand and to avoid sand that is toocoarse or too fine. Very fine material is likely to be clay. Although small proportions ofclay in mortar act as plasticisers and slow the too-rapid absorption of water by high-suction bricks, too much clay can make wet mortar sticky and the set mortar has poorbond and compressive strength and has low durability. Excess clay in the mortar canalso result in traces of mortar (smears) on the face of the brickwork that are hard toremove.
7/24/2019 SR258 - Critical Properties of Mortar
http://slidepdf.com/reader/full/sr258-critical-properties-of-mortar 18/89
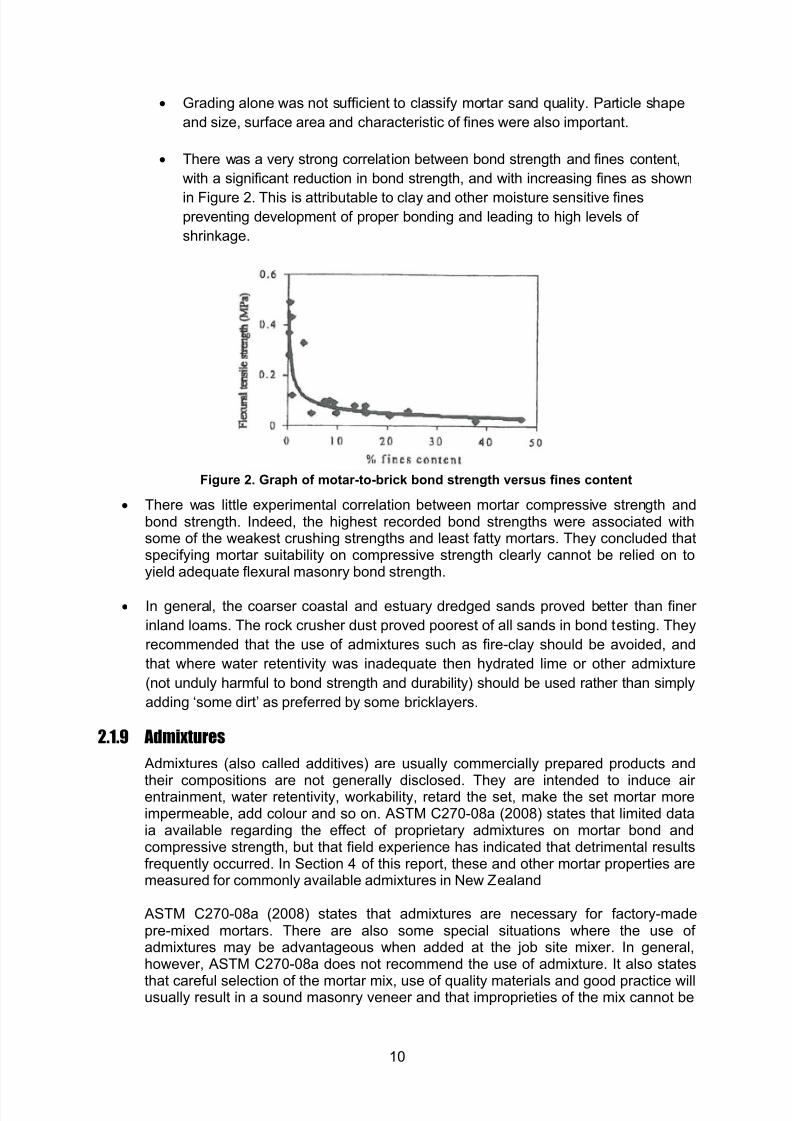
Grading alone was not sufficient to classify mortar sand quality. Particle shape
and size, surface area and characteristic of fines were also important.
There was a very strong correlation between bond strength and fines content,
with a significant reduction in bond strength, and with increasing fines as shown
in Figure 2. This is attributable to clay and other moisture sensitive fines
preventing development of proper bonding and leading to high levels of
shrinkage.
Figure 2. Graph of motar-to-brick bond strength versus fines content
There was little experimental correlation between mortar compressive strength andbond strength. Indeed, the highest recorded bond strengths were associated withsome of the weakest crushing strengths and least fatty mortars. They concluded that
if i t it bilit i t th l l t b li d t

7/24/2019 SR258 - Critical Properties of Mortar
http://slidepdf.com/reader/full/sr258-critical-properties-of-mortar 19/89
corrected by admixtures. However, now that lime is relatively rarely used apart from inthe southern part of the South Island, admixtures are almost universally used in New
Zealand.
ASTM C270-08a states that air entrainers should not be used, except under the mostspecial circumstances, because this decreases bond and compressive strength. Theydo note though that most highly air-entrained mortar systems can support higher sandcontents without the mortar losing workability.
BDRI (1980) states that air-entraining agents are the most common plasticisingadmixtures used in Australia. The purpose is sometimes to reduce the stickiness ofmortar made with fatty (clay-rich) sands. Although they frequently improve theworkability of wet mortar, BDRI consider that they can seriously diminish the strengthand durability of set mortar and recommend that they should only be used as a lastresort and be accurately measured. In Section 4 of this report, the effect on bondstrength from overdosing admixtures and from over-mixing is measured.
BDRI (1977) state that although air-entraining agents suit the bricklayer, there is adanger that the resulting mortar will not suit the brickwork. Their tests showed that:
from a level of around 5% by volume of air in a straight cement:lime:sand
reference mix, the air content of chemically plasticised mortars increased by
between 20-44%
in comparison with cement:lime:sand reference mixes, the compressive
strength of the plasticised mortars dropped by between 50-90%.
BDRI (1977) id th t th t t hi h t l dh i t

7/24/2019 SR258 - Critical Properties of Mortar
http://slidepdf.com/reader/full/sr258-critical-properties-of-mortar 20/89
2.1.11 Lime
Although lime is strictly an admixture, it is considered separately in this report.Nowadays, apart from in the south of the South Island, lime is rarely used in mortar inNew Zealand and admixtures are used to give the required workability.
Lime was the traditional single cementitious material in masonry mortar and provides acementing function, although significantly less than that of Portland cement which isused these days. Lime also has important functions in making wet mortar plastic and inimparting to set mortar the property of self-healing (often called autogenous healing)which will close up the hair cracks that can develop in masonry during setting and
loading.
Section 2.2.2.1 of NZS 4210 states that hydrated lime may be omitted from therequired mixes given in Table 2.1 if it can be demonstrated that the performancerequirements of Sections 2.2.3.1 and 2.2.3.2 will be achieved. However, the strengthsspecified in the Section 2.2.3.1 and 2.2.3.2 are only for “structural compliance” andthus not applicable to veneer (as it is not a structural element). Thus, the compressiveand bond strength values specified need not be complied with. Hence, NZS 4210
permits lime to be omitted from mortar mixes without any specific requirements.
ASTM 270-08a (2008) states that hydrated lime contributes to workability, waterretentivity and elasticity. Lime mortars carbonate gradually under the influence ofcarbon dioxide in the air. Complete hardening occurs very slowly. Thus, residual limecan cause healing which is the re-cementing of small hairline cracks. Here, the limegoes into solution when water is present and migrates through the masonry where itcan be deposited in cracks and crevices as water evaporates. Successive deposits
t ll fill th k S h t h li ill t d t d t

7/24/2019 SR258 - Critical Properties of Mortar
http://slidepdf.com/reader/full/sr258-critical-properties-of-mortar 21/89
powdery, its quality and strength should be questioned. Someone must make the callthat the mortar will be able to perform its functions.
2.1.13 Durability
The durability of mortar is an important topic that has not been covered in this studywhich focuses on the structural performance of brick veneer. The main aspects are:corrosion of metal embedded in the veneer; the water-tightness of the veneer (somewater is expected to penetrate the veneer, but this is expected to be handled by thecavity) and the mortar fretting away under wind-driven abrasion; salt crystallisation; andchemical attack or freeze-thaw action so that the veneer loses its face load strength to
resist wind pressure and earthquake forces. (Axial strength is expected to be of lessersignificance.) Any damage also has an aesthetic consequence. A lack of bond at theinterface of the mortar and the masonry unit may lead to moisture penetration throughthese areas.
NZS 4210 (2001) classifies various zones of New Zealand depending on the severity ofexposure to wind-driven sea salt or geothermal gases. AS/NZS 2699.1 (2000) thenspecifies the durability of metal components used in the veneer construction to meet
the 50-year durability requirement with B2 of the New Zealand Building Code (NZBC)current at the time. The current B2 (DBH 2011) has similar requirements. This hasresulted in all brick ties being either galvanised steel or stainless steel. Comments fromthe field indicate that little corrosion is being seen on these ties when circumstancesallow them to be examined.
Section 2.9.5.1 of NZS 4210:2001 requires ties to be fully embedded (i.e.encapsulated) in the mortar, which is apparently partly for durability reasons. However,BRANZ has provided opinions that specific ties may be dry-bedded as they were
h t t th t th/d f ti i t f AS/NZS 2699 1 (SNZ 2000)
7/24/2019 SR258 - Critical Properties of Mortar
http://slidepdf.com/reader/full/sr258-critical-properties-of-mortar 22/89
Brick veneer will not be damaged due to freezing unless the brickwork is nearly
saturated (ASTM C270-08a). Masonry walls, heated on one side, will stand many yearsbefore requiring maintenance. However, ASTM C270-08a considers that parapets,masonry paving, retaining walls and other masonry exposed to freezing while saturatedrepresents extreme exposure and requires a more durable mortar.
Properly entrained air in masonry mortar generally increases its resistance to freeze-thaw damage where extreme exposure exists (such as repeated cycles of freezing andthawing while saturated with water). Air contents do not have to be large for this to beachieved. Durability is adversely affected by over-sanded or over-tempered mortars aswell as the use of highly absorbent masonry units.
CCA (2007) also consider that most masonry structures exhibit excellent long-termperformance with comparatively low maintenance cost. They note that the veneerdurability is influenced by the durability of both the masonry units and mortar.
2.2 Masonry units
ASTM C270-08a (2008) notes that masonry units are absorbent by nature, with theresult that water is extracted from the mortar as soon as the masonry unit and mortarcome into contact. The amount of water removal affects the the bond strength.
The suction exerted by the masonry unit affects the development of bond. Masonryunits vary widely in the initial rate of absorption (suction). It is therefore necessary thatthe mortar chosen has properties that will provide compatibility with the properties ofthe masonry unit being used, as well as environmental conditions that exist during
i d h i i li h j b

7/24/2019 SR258 - Critical Properties of Mortar
http://slidepdf.com/reader/full/sr258-critical-properties-of-mortar 23/89
ASTM 270-08a (2008) came to similar conclusions and states that workmanship has asubstantial effect on bond strength. They also state that the time lapse between
spreading mortar and placing masonry units should be kept to a minimum because theflow will be reduced through suction of the unit on which it is first placed. This isespecially so in hot, dry and windy conditions, or with use of highly absorbent masonryunits.
Historically, masonry head joints were often only filled with fillets at the external edges,but this practice is rare nowadays. This can severely weaken a veneer (CCA 2001). Allen (1986) warns of the dangers of this practice and states that these small dabs ofmortar are more susceptible to suction of the masonry units and evaporation, with theresult that shrinkage cracks invariably open up. These cracks allow water ingress, soundand noise penetration, directly contribute to loss of masonry strength, and are weakunder wind and seismic loading. ASTM 270-08a (2008) also stresses the importance ofproviding full head joints.
Section 2.7.4.2 of NZS 4210 limits the depth of furrowing (grooves) of bed joints to adepth of 25% of joint thickness. ASTM 270-08a (2008) recommends elimination of deepfurrows in horizontal bed joints. Allan (1986) notes that deep furrowing of the mortar in a
cored veneer is unnecessary, because the perforations allow levelling of the brickthrough excess mortar being squeezed into the cavities. Even with solid concrete units,a light surface roughening is all that is required.
2.3.2 Tooling mortar joints
Tooling mortar joints is the process of pressing/sliding a metal tool across a fresh mortar joint.

7/24/2019 SR258 - Critical Properties of Mortar
http://slidepdf.com/reader/full/sr258-critical-properties-of-mortar 24/89
2.3.3 Tapping

7/24/2019 SR258 - Critical Properties of Mortar
http://slidepdf.com/reader/full/sr258-critical-properties-of-mortar 25/89
2.3.5 Re-tempering
Re-tempering is the process of adding water and re-mixing mortar that has stiffened inthe barrow. It therefore results in a decrease in mortar compressive strength. Theamount of the reduction increases with the amount of water addition and time betweenmixing and re-tempering. However, most standards allow some controlled re-temperingas stiff mortar has low bond strength and it is considered expedient to sacrifice somecompressive strength of the mortar in favour of improved bond.
BDRI (1980) recommend that mortar is mixed thoroughly so that it is as wet as possibleand, up to one-and-a-half hours after mixing, to replace water lost through evaporation
by the addition of more water (but discard unused mortar after two hours).
ASTM C270-08a (2008) recommends that the addition of water to mortar to replaceevaporation within specified time limits should not be prohibited. Although thecompressive strength of the mortar is reduced slightly by re-tempering, bond strength isusually increased. Because re-tempering is harmful after mortar has begun to set, ASTM C270-08a recommends that all site-prepared mortar should be placed in its finalposition as soon as possible, but always within two-and-a-half hours after the original
mixing (or the mortar is discarded).
Section 2.2.2.2 (d) of NZS 4210 (SNZ 2001) states that stiffened mortar may be re-tempered providing the water is added to a basin formed by the mortar and the mortaris carefully worked into it. However, mortar not used within one-and-a-half hours afterthe addition of cement to the mix must be discarded, except this may be increased totwo hours if the temperature is less than 5ºC.

7/24/2019 SR258 - Critical Properties of Mortar
http://slidepdf.com/reader/full/sr258-critical-properties-of-mortar 26/89
be detrimental as the excess moisture might saturate the masonry, creatingmovements which decrease the adhesion between mortar and masonry unit.
Oliver (2009) discusses why the brick veneer in a particular New Zealand houseneeded to be removed and replaced. The veneer had been laid in hot weather with awarm drying wind. He surmises that the moisture had rapidly evaporated from the freshmortar resulting in inadequate hydration and strength. The mortar powdered easily.
2.3.8 Efflorescence
Efflorescence is a crystalline deposit (usually white) of water soluble salts on thesurface of masonry. ASTM C270-08a (2008) states that the principal objection toefflorescence is the visual appearance of the salts on the surface and the nuisance oftheir removal. Under certain circumstances, particularly when exterior coatings arepresent, salts can be deposited below the surface of the masonry units. When thiscrypto florescence occurs, the force of crystallisation can cause disintegration of themasonry.
A combination of circumstances is necessary for the formation of efflorescence. First,there must be a source of soluble salts. Second, there must be moisture present to pickup the soluble salts and carry them to the surface. Third, evaporation or hydrostaticpressure must cause the solution to migrate. ASTM C270-08a states that if any one ofthese conditions is eliminated efflorescence will not occur. They note that full bed andhead joints, along with compacting finish on a concave mortar joint, will reduce waterpenetration and reduce efflorescence.

7/24/2019 SR258 - Critical Properties of Mortar
http://slidepdf.com/reader/full/sr258-critical-properties-of-mortar 27/89
not produced to a standard. When vintage buildings are torn down, there was no
possible way of differentiating between good bricks, commons, and underfired or
doughboys. Further, bricks which are retrieved from vintage buildings are not“de/aired”. De/airing is a relatively modern clay-working process in which the wet clay
particles are passed through a vacuum chamber with a negative pressure of about
90 kPa. This knitted the clay particles together to form a tight cohesive body which
fired well and is more regular in configuration. Also, used bricks have their bedding
surface pore structures clogged with lime particles, dirt or other deleterious matter.
These will adversely affect the bond of mortar to brick. Allen wrote that the Ceramic
Industries Association, mindful of its industry responsibilities and a correspondingobligation to the building trade, has issued the following policy statement:
“Demolition brick cannot be shown to comply with the New Zealand Standards inrespect of crushing strengths, soundness, durability or masonry-to-mortar bondstrengths. Their use is therefore prohibited”.
2.3.10 Separation of veneer at corners and windows for earthquake resistance
NZS 4210 (SNZ 2001) states that in the Coalings (USA) earthquake, veneer with poorfixings collapsed but veneer with correctly installed ties survived undamaged despitethe absence of a special separation details. Veneer damage at Edgecumbe in 1987revealed primarily a problem in inadequate tie provision and fixing.
However, NZS 4210 also states that “the adoption of full corner and windowseparation details is seen as a logical engineering step towards limiting damage inveneers. Veneer construction in these cases is likely to make use of the special

7/24/2019 SR258 - Critical Properties of Mortar
http://slidepdf.com/reader/full/sr258-critical-properties-of-mortar 28/89
The sand:cement ratio was 4:1 and was measured using 20 L pails. Two capfuls of theadmixture No. 2 from Table 22 was used per mix which BRANZ measured as 40 mL.
This was calculated to be 22% more than the manufacturer‟s recommended dose of100 mL per bag of cement.
Figure 3. Grading curve of the BRANZ Kapiti sand sample
3.3 Mortar sampled at building sites in the greater Auckland region
0
10
20
30
40
50
60
70
80
90
100
4.75mm
2.36mm
1.18mm
600 um425 um300 um150 um75 umPan
%
P a s s i n g
Sieve Size
Max Envelope (ASTM C144)
Min Envelope (ASTM C144)
Kap1
7/24/2019 SR258 - Critical Properties of Mortar
http://slidepdf.com/reader/full/sr258-critical-properties-of-mortar 29/89
The amount of cement in each mixer load was unknown but is expected to be close tohalf of a 40 kg bag. Based on this assumption and the volume of admixture the
tradesman said they used, Table 1 compares the dosage used with that recommended.That is, it gives (as a percentage) the ratio of the quantity of admixture used to theaverage quantity of admixture recommended by the manufacturer. It can be seen thatin nine of the 14 cases this was greater than 100%; in two cases it was less than 100%and the remaining three cases were 100%. It is unlikely that more than half a bag ofcement was used per mortar batch and possible that less than half a bag was used.Thus, the overdosing may be greater than Table 1 suggests.
Mixing times did not exceed 10 minutes, except that in one instance it was 20 minutes.
The time in the barrow when sampling occurred is also given as this may affect themeasured mortar strengths.
Table 2 contains information on the brickwork and Table 3 is a legend for Table 1 andTable 2.
3.3.2 Mortar compression tests
At each site mortar taken from the barrow was used to make three mortar compressiontest cylinders in accordance with NZS 3112 Part 1 (SNZ 1986), except that the testspecimens were made in 200 x 100 mm cardboard cylinders. These were covered andleft overnight on the site. The next day these specimens were fully submerged in abucket of water, delivered to an accredited testing laboratory, and stored at 100%humidity until tested for compressive strength at age 28 days.

7/24/2019 SR258 - Critical Properties of Mortar
http://slidepdf.com/reader/full/sr258-critical-properties-of-mortar 30/89
Figure 4. System for measuring bond strength from brick couplets in the greaterAuckland region

7/24/2019 SR258 - Critical Properties of Mortar
http://slidepdf.com/reader/full/sr258-critical-properties-of-mortar 31/89
Table 1. Site mixes sampled in the greater Auckland region
Table 2. More details of site mixes sampled in the greater Auckland region
Label Mix Location Sand: Sand Fineness Admixture dmixture Mix time Time inCement Equiv. Modulus Type quantity (Minutes) barrow
Ratio ratio (Minutes)
J1 Volume Auckland 4 82 1.1 3 133% 5 5
J2 Volume Auckland 4 86 0.96 3 133% 10 15
J3 Volume Auckland N/A 8 N/A 5 5
J4 Volume Auckland 4 79 1.52 6 100% 20 10
J5 Volume Auckland 4 3 100% 7 20
J6 Shovel Auckland 3.5* 80 1.11 3 67% 7 5J7 Volume Auckland 4 3 133% 5 5
J8 Volume Auckland 3 3 67% 5 10
J9 Volume Waikato 4 73 1.7 2 120% 10 60
J10 Volume Huntly 4 71 1.09 2 120% 8 45
J11 Volume Waikato 4 3 133% 5 50
J12 Volume Waikato 4 83 2.42 4 200% 4 30
J13 Volume Matamata 4 80 1.29 7 100% 8 60
J14 Volume Bay of Plenty 4 74 1.79 4 133% 5 60
J15 Shovel Bay of Plenty 4** 86 1.4 4 200% 10 15
See J9
See J6
See J6
N/A
See J4
Label Mortar Tie Joint Note 1 Note 2
finish on embedment tooled
house smooth?
J1 Flush Dry bedded Veneer to be plastered 50% bricks kept dry rest left open to weather
J2 Rake 8 mm Dry bedded Face veneer
J3

7/24/2019 SR258 - Critical Properties of Mortar
http://slidepdf.com/reader/full/sr258-critical-properties-of-mortar 32/89
Table 4. Mortar strengths measured from site samples collected in the greater
Auckland regionLabel Location Age (days) at Density
testing couplet kN/m3
bond strength Ave C.O.V. Ave C.O.V.
J1 Auckland 33 275 0.16 7.83 0.037 1694
J2 Auckland 33 135 0.27 6.83 0.042 1540
J3 Auckland 27 338 0.20 11.66 0.157 1693
J4 Auckland 27 353 0.18 13.66 0.042 1763J5 Auckland 27 353 0.20 9.16 0.063 1663
J6 Auckland 49 317 0.23 10.00 0.087 1713
J7 Auckland 49 433 0.14 9.67 0.030 1663
J8 Auckland 49 283 0.43 8.00 0.000 1663
36.8 311 0.23 9.60 0.06 1674
J9 Waikato 33 317 0.23 5.20 0.056 1513
J10 Huntly 33 317 0.23 10.20 0.028 1650J11 Waikato 33 367 0.68 8.00 0.063 1710
J12 Waikato 24 27 0.83 7.00 0.000 1593
J13 Matamata 24 85 1.21 10.50 0.048 1543
J14 Bay of Plenty 19 15 0.53 4.83 0.060 1590
J15 Bay of Plenty 19 304 0.37 10.50 0.048 1656
26.4 205 0.59 8.03 0.04 1608
Compressive
strength (MPa)
Average from Auckland
Average from BOP/Waikato
Couplet bond
strength (kPa)

7/24/2019 SR258 - Critical Properties of Mortar
http://slidepdf.com/reader/full/sr258-critical-properties-of-mortar 33/89
3.3.5 Sand samples
Figure 6 and Figure 7 show the measured grading of sand samples collected in the
greater Auckland region: J3 was a pre-mixed mortar; the sand source for J5, J6, J7 andJ8 was the same; and similarly the sand source for J9 and J11 was the same.
Many of the sand gradings showed wide divergence from the standard curves whichmay explain why the measured bond strengths were low. Some had a steep portionindicating a big proportion of the sand the similar sand particle size (J1, J2, J6, J10),with the worst being J2. J10 has the largest discontinuity between the 300 µm and 150µm sieves. Most were low on fines which indicates that a large amount of admixture or
cement would be needed to give good workability.
3.4 Mortar sampled at building sites in the Wellington region
Mortar was sampled at 12 sites in the Wellington region in a similar manner to thatdone in the greater Auckland region. However, it was found that the same sand hadbeen used at each site (called Sand Y) and the couplet strengths were measured atage seven days. Mortar cylinder compressive strengths were measured at age 28
days.
The results in Table 5 showed very low bond strengths and only moderate cylindercompressive strengths. Scatter was high in both instances. In six of the 70 bondcouplet specimens the specimens broke during transport. These results are ignored.With couplets taken from one particular building site (called “MATS8”), four specimensbroke as the bucket was being added to the bar. These specimens (and also for anadditional four specimens taken from other sites where this happened) were assigned

7/24/2019 SR258 - Critical Properties of Mortar
http://slidepdf.com/reader/full/sr258-critical-properties-of-mortar 34/89
0
10
20
30
40
50
60
70
80
90
100
4.75mm
2.36mm
1.18mm
600 um425 um300 um150 um75 umPan
%
P a s s i n g
Sieve Size
J1 and DJ1 Grading Curve
Max Envelope (ASTMC144)
Min Envelope (ASTMC144)
J1
DJ10
10
20
30
40
50
60
70
80
90
100
4.75mm
2.36mm
1.18mm
600 um425 um300 um150 um75 umPan
%
P a s s i n g
Sieve Size
J2 Grading Curve
Max Envelope (ASTMC144)
Min Envelope (ASTM C144)
J2
0
10
20
30
40
50
60
70
80
90
100
4.75mm
2.36mm
1.18mm
600 um425 um300 um150 um75 umPan
%
P a s s i n g
Sieve Size
J4 Grading Curve
Max Envelope (ASTMC144)
Min Envelope (ASTMC144)
J4
0
10
20
30
40
50
60
70
80
90
100
4.75mm
2.36mm
1.18mm
600 um425 um300 um150 um75 umPan
%
P a s s i n g
Sieve Size
J6 and DJ6 Grading Curve
Max Envelope (ASTMC144)
Min Envelope (ASTMC144)
J6
DJ6

7/24/2019 SR258 - Critical Properties of Mortar
http://slidepdf.com/reader/full/sr258-critical-properties-of-mortar 35/89
0
10
20
30
40
50
60
70
80
90
100
4.75mm
2.36mm
1.18mm
600 um425 um300 um150 um75 umPan
%
P a s s i n g
Sieve Size
J12 and DJ12 Grading Curve
Max Envelope (ASTMC144)
Min Envelope (ASTMC144)
J12
DJ12
0
10
20
30
40
50
60
70
80
90
100
4.75mm
2.36mm
1.18mm
600 um425 um300 um150 um75 umPan
%
P a s s i n g
Sieve Size
J13 and DJ13 Grading Curve
Max Envelope (ASTMC144)
Min Envelope (ASTMC144)
J13
DJ13
0
10
20
30
40
50
60
70
80
90
100
4.75mm
2.36mm
1.18mm
600 um425 um300 um150 um75 umPan
%
P a s s i n g
Sieve Size
J14 Grading Curve
Max Envelope (ASTMC144)
Min Envelope (ASTMC144)
J14
0
10
20
30
40
50
60
70
80
90
100
4.75mm
2.36mm
1.18mm
600 um425 um300 um150 um75 umPan
%
P a s s i n g
Sieve Size
J15 Grading Curve
Max Envelope (ASTMC144)
Min Envelope (ASTM C144)
J15

7/24/2019 SR258 - Critical Properties of Mortar
http://slidepdf.com/reader/full/sr258-critical-properties-of-mortar 36/89
Figure 8. Relationship between mortar bond and compressive strengths from mortartaken from sites in the Wellington region
0
2
4
6
8
10
12
14
16
18
0 50 100 150 200 250 300 350 400 450 500
C o m p r e s s i v e s t r e n g t h ( M P a )
Bond strength (kPa)

7/24/2019 SR258 - Critical Properties of Mortar
http://slidepdf.com/reader/full/sr258-critical-properties-of-mortar 37/89
Day Four (16 December to 23 December 2010). These were the mortars used
for constructing the test walls which were later tested on the shake table. The
elemental tests on this mortar were mainly to confirm consistency with theresults of the elemental testing on the other days. Also, a few of the mortar
mixes from earlier tests were repeated to verify or otherwise some of the
previous results the writer had found surprising.
The mortars for Days One to Three were made in the Concrete Laboratory whereasthe mortars for Day Four were made in the Structures Laboratory. The dates on which
particular mortar mixes were made are noted in the tables in this report.
Test specimens made with the various mortars were:
1. Brick couplet test specimens to measure the bond strength of brick-to-brick
mortared joints under flexural loading.
2. Brick tension test specimens to measure the bond strength of brick-to-brick
mortared joints under direct tension loading.
3. Brick tie pullout test specimens to measure the force required to pull a brick tie
from two bricks mortared together.
4. Mortar cylinders to measure mortar compressive (crushing) strength.
Compression test specimens were stripped at three days and transferred to a 100%humidity fog room and tested at 28 days. The other specimens were stored in thesame room in which they were made and tested at age seven days as stipulated inNZS 4210 for bond strength. The exception was that some specimens were tested at

7/24/2019 SR258 - Critical Properties of Mortar
http://slidepdf.com/reader/full/sr258-critical-properties-of-mortar 38/89
Each concrete mixer load of mortar was assigned a Concrete Mix (CM) Number. ATest Group Label was assigned to mortar taken out of the mixer at the same time foreach CM Number. Thus, mortar taken from CM Number having five minutes mixinghad a different Test Group Label from that retained in the mixer and given a total of25 minutes mixing, but of course they had the same CM Number.
There are several examples where the same mix ingredients were used on differentdays and each of these received different CM Numbers, and the test specimens weregiven different Test Group Labels.
The first two letters of the mortar Test Group Label defines the cement content basedon Table 2.1 of NZS 4210 as described in Table 6. The exception is Test Group Label
“MX”, which is similar to M3 but uses a 4:1 ratio rather than 4.5:1 ratio. A Test GroupLabel was assigned to all specimens made after the same mixing time from the sameCM Number irrespective of whether they were couplet, tension or tie specimens.
As an example, the first concrete mix load on Day One (CM = 1) had a batch taken offafter five minutes mixing called M3B1. Twenty minutes later a second batch was takenoff called M3B2. On Day Two the same ingredients were tested and were calledM3B21 for five minutes mixing and M3B22 for 25 minutes mixing.
Table 6. Relationship between test group label and mortar cement content
First letters of Test Group Label Sand:Cement ratio
M2 6:1
M3 4.5:1
M4 3:1
7/24/2019 SR258 - Critical Properties of Mortar
http://slidepdf.com/reader/full/sr258-critical-properties-of-mortar 39/89
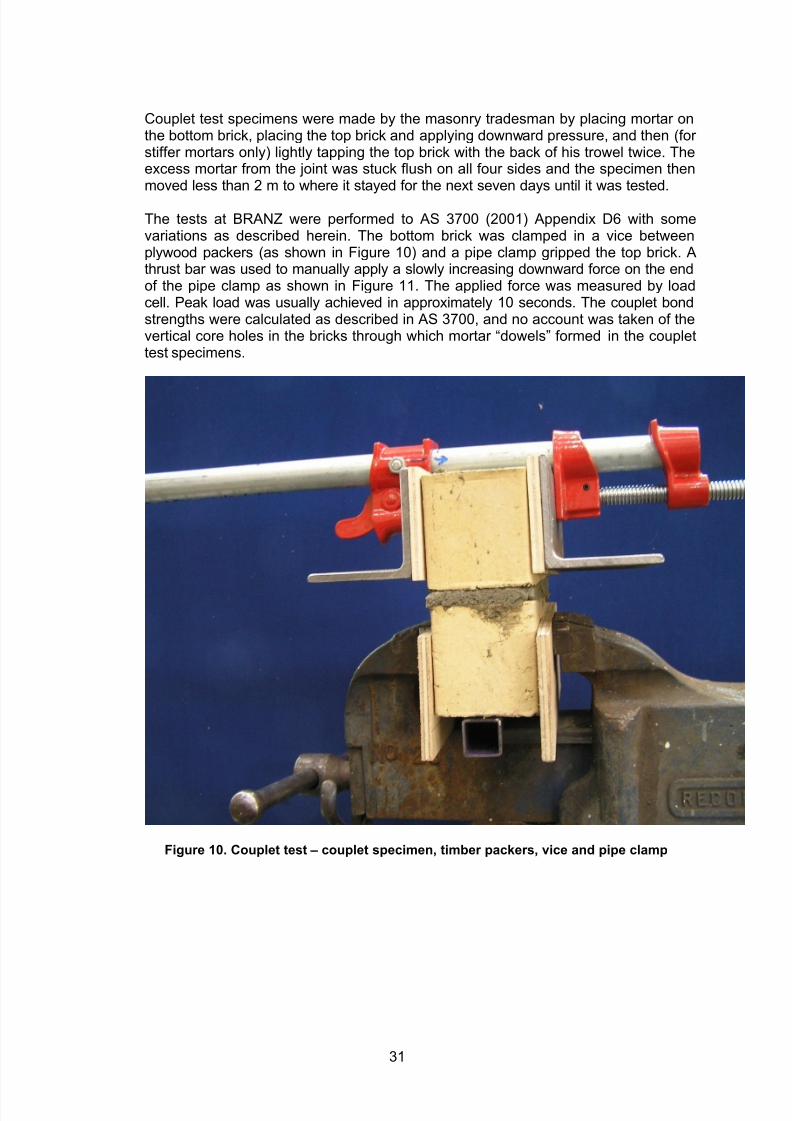
Couplet test specimens were made by the masonry tradesman by placing mortar onthe bottom brick, placing the top brick and applying downward pressure, and then (forstiffer mortars only) lightly tapping the top brick with the back of his trowel twice. Theexcess mortar from the joint was stuck flush on all four sides and the specimen thenmoved less than 2 m to where it stayed for the next seven days until it was tested.
The tests at BRANZ were performed to AS 3700 (2001) Appendix D6 with somevariations as described herein. The bottom brick was clamped in a vice betweenplywood packers (as shown in Figure 10) and a pipe clamp gripped the top brick. Athrust bar was used to manually apply a slowly increasing downward force on the end
of the pipe clamp as shown in Figure 11. The applied force was measured by loadcell. Peak load was usually achieved in approximately 10 seconds. The couplet bondstrengths were calculated as described in AS 3700, and no account was taken of thevertical core holes in the bricks through which mortar “dowels” formed in the couplettest specimens.

7/24/2019 SR258 - Critical Properties of Mortar
http://slidepdf.com/reader/full/sr258-critical-properties-of-mortar 40/89

7/24/2019 SR258 - Critical Properties of Mortar
http://slidepdf.com/reader/full/sr258-critical-properties-of-mortar 41/89
Figure 12. Cruciform test specimen

7/24/2019 SR258 - Critical Properties of Mortar
http://slidepdf.com/reader/full/sr258-critical-properties-of-mortar 42/89
4.5 Brick tie pullout test
Generally three tie pullout test specimens were made for each Test Group. However,five specimens in each group were made for tests investigating the influence ofdifferent sands in Day Three.
For the purpose of this tests the „L-shaped‟ ties were flattened in a vice as shown inFigure 14. The tie pullout test specimens for dry-bedding were made by the masonrytradesman by placing the bottom brick onto the angle shown in Figure 14 and placinga flattened tie onto the brick in the same position used in normal bricklaying, except
the tie passed through a slot in the angle. The bricklayer then placed a layer of mortaronto the bottom brick and then placed the top brick on this. Keeping the two brickspressed against the vertical face of the angle, he applied downward pressure and (forstiffer mortars only) lightly tapped the top brick with the back of his trowel twice. Thespecimen was then moved less than 2 m to where it stayed for the next seven daysuntil it was tested. Note that the steel angle was kept with the specimen to containand protect the specimen until the test was complete. The mortar from the joint madeuniform contact with the steel angle, as can be seen by observing the smooth surface
in Figure 15.
These ad-hoc tie pullout tests were performed as shown in Figure 16. Tension wasgradually applied by tightening the shaft with the ring spanner. The applied force wasmeasured by load cell. Peak load was usually achieved in approximately 20 seconds.In approximately 70% of the cases the tie pulled out of the mortar without disruptingthe brick-brick bond and in the remaining cases the bricks separated. Actual tieembedment depth in the mortar was measured after each test.

7/24/2019 SR258 - Critical Properties of Mortar
http://slidepdf.com/reader/full/sr258-critical-properties-of-mortar 43/89
Figure 15. Typical failure surface in the mortar after the tie test

7/24/2019 SR258 - Critical Properties of Mortar
http://slidepdf.com/reader/full/sr258-critical-properties-of-mortar 44/89
4.6 Test results on elemental specimens using Sand Y
4.6.1 Properties of Sand Y used
NZS 3103 (SNZ 1991) specifies the following limits for the mortar sand:
1. The percentage oversize material in the sand shall not exceed 1% by mass.
2. The flow limits shall be in a stipulated range (which for a voids content of 46.5%is between 22 and 28 seconds).
3. The voids content shall not exceed 48%.
4. The minimum value of sand equivalence is 60. Apart from pre-mixed mortar, the mortar made on Day One and Day Two used sandfrom a plant in Wellington and is referred to as Sand Y. The sand, like most being usedin New Zealand, did not comply with NZS 3103. In particular:
1. The measured percentage oversize was 4%.
2. The voids content was 46.5% (which does comply) but the flow time was only20.6 seconds.
3. The sand equivalence was 48.
4. The grading curves were outside the ASTM C144 (2004) limits shown in Figure17.
5. The sand had a fineness modulus of 1.56.
100
7/24/2019 SR258 - Critical Properties of Mortar
http://slidepdf.com/reader/full/sr258-critical-properties-of-mortar 45/89
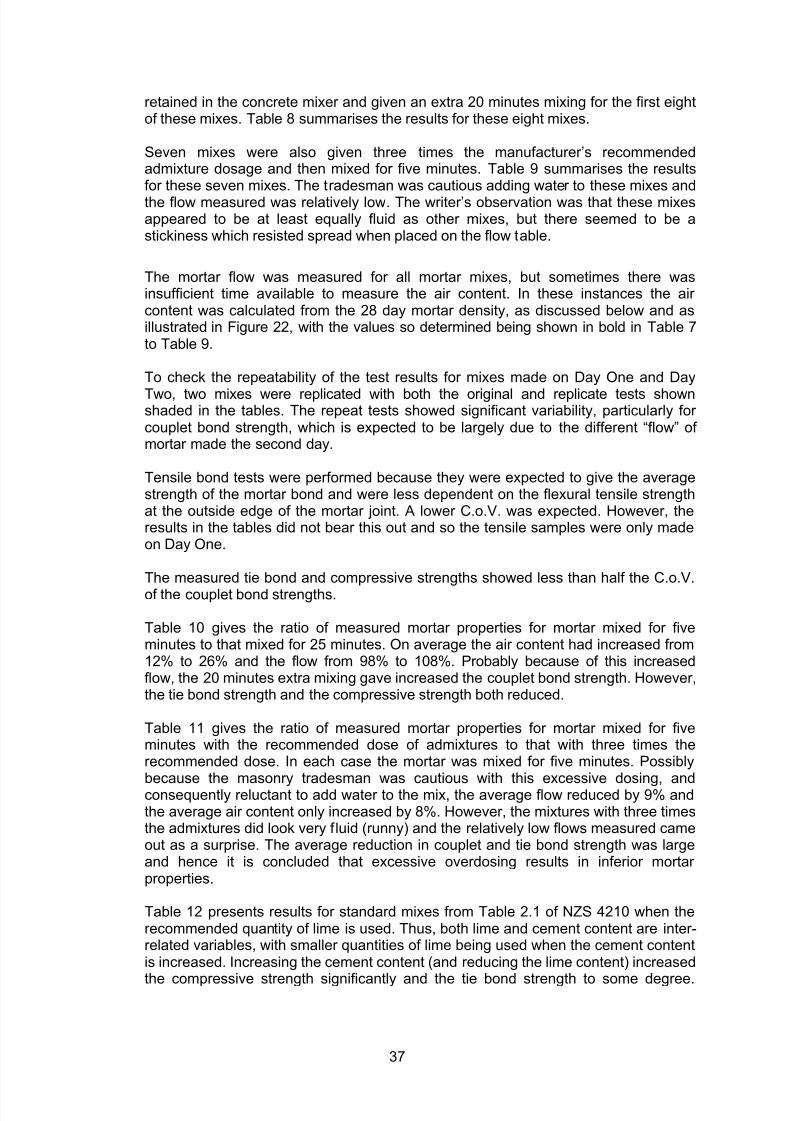
retained in the concrete mixer and given an extra 20 minutes mixing for the first eightof these mixes. Table 8 summarises the results for these eight mixes.
Seven mixes were also given three times the manufacturer‟s recommendedadmixture dosage and then mixed for five minutes. Table 9 summarises the resultsfor these seven mixes. The tradesman was cautious adding water to these mixes andthe flow measured was relatively low. The writer‟s observation was that these mixesappeared to be at least equally fluid as other mixes, but there seemed to be astickiness which resisted spread when placed on the flow table.
The mortar flow was measured for all mortar mixes, but sometimes there wasinsufficient time available to measure the air content. In these instances the aircontent was calculated from the 28 day mortar density, as discussed below and asillustrated in Figure 22, with the values so determined being shown in bold in Table 7to Table 9.
To check the repeatability of the test results for mixes made on Day One and DayTwo, two mixes were replicated with both the original and replicate tests shownshaded in the tables. The repeat tests showed significant variability, particularly forcouplet bond strength, which is expected to be largely due to the different “flow” ofmortar made the second day.
Tensile bond tests were performed because they were expected to give the averagestrength of the mortar bond and were less dependent on the flexural tensile strengthat the outside edge of the mortar joint. A lower C.o.V. was expected. However, theresults in the tables did not bear this out and so the tensile samples were only madeon Day One.

7/24/2019 SR258 - Critical Properties of Mortar
http://slidepdf.com/reader/full/sr258-critical-properties-of-mortar 46/89
However, it had little effect on the couplet strength. The highest strength was forsample M3B1 where an intermediate lime and cement content was used.
Table 13 summarises results where cement content is the only variable and theadmixture is No. 2 from Table 22. Increasing the cement content again increased thecompressive strength significantly but had no trend influence on the tie bond strength.The couplet bond strength was lowest with the maximum cement content.
In Table 12 the admixture is lime whereas in Table 13 Admixture 2 was used (seeTable 22). Comparing these two tables it is concluded that the compressive strengthwas lower when lime rather than the admixture was used but the tie bond strength
was similar.
Because the results for Table 12 and Table 13 did not show an increase in mortarbond strength with an increase in cement content, as many engineers would expectto happen, the tests were repeated on Day Four but using 10 mortar bond samplesper Test Group Label and three brick tie samples. The corresponding results in Table14 and Table 15, respectively, largely confirm the conclusion that bond strength haslittle correlation with cement content. Figure 18 plots the couplet bond strength versus
flow from Table 12 to Table 15. Bond strength increased with flow. As the flows weregreater on Day Four this explains why greater bond strengths were obtained on DayFour compared with Day One and Day Two.
Wetting the bricks by dipping them into water for five seconds approximately fiveminutes before the couplet was made increased the average couplet mortar bondstrength by 48% as shown in Table 16. The weather at the time was cold(approximately 8ºC) and overcast and a greater increase from wetting may occur in

7/24/2019 SR258 - Critical Properties of Mortar
http://slidepdf.com/reader/full/sr258-critical-properties-of-mortar 47/89
mixed mortar (25.4 MPa) was greater than the corresponding average from the othermixes in Table 7 (12.5 MPa), the average brick couplet mortar bond strengths (265kPa as against 278 kPa) and the average tie bond strength were similar (41 N/mm asagainst 40 N/mm).
The effect of tooling joints on mortar bond strength is shown in Table 21. Theweatherstruck and ironed concave finishes gave greatest bond strengths. Rakingreduced the bond strength. In this test series tooling the raked joint did not increasethe measured bond strength.
Figure 19 plots the relationship between flow and couplet bond strength for all
mortars that had not been provided pre-mixed. This shows that increased flow resultsin increased couplet bond strength. This was independent of whether there was fiveor 25 minutes mixing or whether three times the recommended admixture was used,although the latter did give slightly lower couplet bond strengths for correspondingflows.
Figure 20 shows that there was also a moderate relationship between couplet anddirect tension bond strength, with the best fit line indicating that the couplet bond
strength was 43% greater.
Figure 21 shows that there is little correlation between couplet bond strength andmortar compression strength.
Figure 22 shows that there was also a good relationship between measured aircontent and mortar density. The best fit curves were used to estimate air content ofmortar where it was not measured directly.

7/24/2019 SR258 - Critical Properties of Mortar
http://slidepdf.com/reader/full/sr258-critical-properties-of-mortar 48/89
40
Table 7. Samples made with Sand Y after five minutes mixing using specified levels of admixtures
(shading represents replicates made on different dates)
Table 8. Samples made with Sand Y after 25 minutes mixing using specified levels of admixtures
Mortar Day Test Flow Air Density
CM made Group No Dosage per 40 kg % content kN/m
3
couplet: couplet:number Label bag of cement Ave. C.O.V. Ave. C.O.V. Ave. C.O.V. Ave. C.O.V. tension Tie bond
1 One M3B1 1 0.5:1 by volume 98 6% 305 0.11 254 0.23 49 0.12 18.0 0.028 2070 1.20 6.24
2 One M3B3 2 100 ml 101 18% 330 0.20 267 0.27 48 0.08 11.5 0.130 1893 1.24 6.93
3 Two M3B21 2 100 ml 87 20% 257 0.18 35 0.20 10.0 0.050 1823 7.27
4 One M3B5 3 25 gms 103 12% 303 0.29 208 0.43 40 0.10 11.3 0.243 1963 1.46 7.58
5 One M3B8 4 60 ml 96 15% 384 0.28 352 0.16 52 0.03 15.0 0.220 1895 1.09 7.37
6 Two M3B18 4 60 ml 94 16% 204 0.23 31 0.09 15.5 0.116 1890 6.68
7 One M3B11 5 30 gms 109 10% 396 0.25 307 0.17 36 0.07 12.8 0.045 1980 1.29 10.87
8 Two M3B15 6 30 gms 93 14% 212 0.18 39 0.03 11.0 0.045 1930 5.45
9 Two MX 7 658 gms 94 30% 123 0.17 26 0.22 8.7 0.120 1683 4.67
10 Two M3Tool 2 100 ml 94 20% 11.0 0.120 1830
Averages 97 16% 279 0.21 278 0.25 40 0.10 12.5 0.11 1896 1.25 7.01
strength (kPa) stre ngth (kPa) strength (N/mm) stre ngth (MPa)
RatiosAdmixture Couplet bond Tension bond Tie bond Compressive
Mortar Day Test Flow Air Density
CM made Group No Dosage per 40 kg % content kN/m3
couplet: couplet:
number Label bag of cement Ave. C.O.V. Ave. C.O.V. Ave. C.O.V. Ave. C.O.V. tension Tie bond
1 One M3B2 1 0.5:1 by volume 100 5% 436 0.28 226 0.20 56 0.20 16.0 0.031 2063 1.93 7.76
2 One M3B4 2 100 ml 109 33% 282 0.06 178 0.13 25 0.08 7.8 0.037 1627 1.59 11.36
3 Two M3B22 2 100 ml 98 32% 295 0.16 28 0.13 7.0 0.000 1647 10.36
4 One M3B6 3 25 gms 120 30% 439 0.16 186 0.14 31 0.16 7.0 0.124 1670 2.36 14.24
5 One M3B9 4 60 ml 104 24% 363 0.12 321 0.24 39 0.05 9.5 0.053 1773 1.13 9.23
6 Two M3B19 4 60 ml 105 25% 358 0.30 38 0.12 13.0 0.077 1760 9.49
7 One M3B12 5 30 gms 134 20% 618 0.22 306 0.21 42 0.07 9.2 0.031 1833 2.02 14.778 Two M3B16 6 30 gms 104 37% 328 0.38 21 0.09 5.3 0.054 1573 15.94
Averages 109 26% 390 0.21 243 0.18 35 0.11 9.4 0.05 1743 1.81 11.64
Ratios
strength (kPa) stre ngth (kPa) strength (N/mm) stre ngth (MPa)
Admixture Couplet bond Tension bond Tie bond Compressive

7/24/2019 SR258 - Critical Properties of Mortar
http://slidepdf.com/reader/full/sr258-critical-properties-of-mortar 49/89
41
Table 9. Samples made with Sand Y after five minutes mixing using 3 x specified levels of admixtures
Table 10. Ratio of strengths of samples made with Sand Y after five minutes mixing to those made after 25 minutes mixing
Mortar Day Test Flow Air Density
CM made Group No Dosage per 40 kg % content kN/m3
couplet: couplet:
number Label bag of cement Ave. C.O.V. Ave. C.O.V. Ave. C.O.V. Ave. C.O.V. tension Tie bond11 One M3B14 2 300 mL 66 29% 107 0.69 110 0.40 20 0.14 9.7 0.030 1723 0.97 5.22
12 Two M3B23 2 300 mL 86 27% 124 0.27 18.28 0.17 9.8 0.029 1723 6.81
13 One M3B7 3 75 gms 108 18% 214 0.15 129 0.34 31 0.13 8.8 0.131 1863 1.66 6.85
14 One M3B10 4 180 mL 81 22% 166 0.33 104 0.29 32 0.07 9.5 0.091 1803 1.59 5.21
15 Two M3B20 4 180 mL 97 25% 167 0.16 16.15 0.03 11.5 0.115 1760 10.36
16 One M3B13 5 90 gms 101 17% 314 0.33 108 0.45 32 0.13 9.3 0.164 1873 2.91 9.87
17 Two M3B17 6 90 gms 82 24% 95 0.23 24 0.05 10.0 0.050 1767 4.05
Averages 89 23% 170 0.31 113 0.37 25 0.10 9.8 0.09 1787 1.78 6.91
Ratios
strength (kPa) stre ngth (kPa) strength (N/mm) stre ngth (MPa)
Admixture Couplet bond Tension bond Tie bond Compressive
Mortar Day Test Test Couplet bond Tension bond Tie bond Compressive
CM made Group1 Group2 No Dosage per 40 kg At At At At strength (kPa) strength (kPa) strength (N/mm) strength (MPa)
number Label Label bag of cement 5 min 25 min 5 min 25 min Ave. Ave. Ave. Ave.
1 One M3B1 M3B2 1 0.5:1 by volume 98 100 6% 5% 0.70 1.13 0.87 1.13
2 One M3B3 M3B4 2 100 ml 101 109 18% 33% 1.17 1.50 1.92 1.47
3 Two M3B21 M3B22 2 100 ml 87 98 20% 32% 0.87 1.24 1.43
4 One M3B5 M3B6 3 25 gms 103 120 12% 30% 0.69 1.12 1.29 1.61
5 One M3B8 M3B9 4 60 ml 96 104 15% 24% 1.06 1.10 1.32 1.58
6 Two M3B18 M3B19 4 60 ml 94 105 16% 25% 0.57 0.81 1.19
7 One M3B11 M3B12 5 30 gms 109 134 10% 20% 0.64 1.00 0.87 1.39
8 Two M3B15 M3B16 6 30 gms 93 104 14% 37% 0.65 1.89 2.08
98 109 14% 26% 0.79 1.17 1.28 1.49
Flow (%) Air contentAdmixture
Average

7/24/2019 SR258 - Critical Properties of Mortar
http://slidepdf.com/reader/full/sr258-critical-properties-of-mortar 50/89

7/24/2019 SR258 - Critical Properties of Mortar
http://slidepdf.com/reader/full/sr258-critical-properties-of-mortar 51/89
43
Table 14. Repeat tests: samples made with Sand Y after five minutes mixing with cement as a variable and admixture is lime
Table 15. Repeat tests: samples made with Sand Y after five minutes mixing with cement as a variable and admixture is 2
Original Repeat
Test Test Sand Flow ratios
Group Group to cement No Dosage by volume % couplet:
Label Label ratio Lime:cement ratio Ave. C.O.V. Ave. C.O.V. Tie bond
M4C2 M4C6 3 1 0.25 99 448 0.43 55 0.09 8.17M3B1 M3B25 4.5 1 0.5 117 460 0.25 46 0.13 9.97
M2C4 M2C8 6 1 1 117 336 0.26 37 0.11 8.95
Average 111 415 0.31 46 0.11
Admixture Couplet bond Tie bond
strength (kPa) strength (N/mm)
Original Repeat
Test Test Sand Flow ratios
Group Group to cement No Dosage per 40 kg % couplet:
Label Label ratio bag of cement Ave. C.O.V. Ave. C.O.V. Tie bondM4C1 M4C5 3 2 100 ml 103 324 0.29 34 0.33 9.57
M3B3 M3B24 4.5 2 100 ml 110 412 0.15 42 0.09 9.79
M2C3 M2C7 6 2 100 ml 120 608 0.26 41 0.13 14.95
Average 111 448 0.23 39 0.18
strength (kPa) strength (N/mm)
Admixture Couplet bond Tie bond

7/24/2019 SR258 - Critical Properties of Mortar
http://slidepdf.com/reader/full/sr258-critical-properties-of-mortar 52/89
44
Table 16. Effect of wetting bricks using mortar with Sand Y
Table 17. Effect of filling core holes using mortar with Sand Y
Ratio of
Day Label Sand Flow Air strengths
made to cement No Dosage per 40 kg (mm) content Wet:Dry
ratio bag of cement Ave. C.O.V. Ave. C.O.V.Two M3B21 4.5 2 100 ml 87 20% 257 0.18 326 0.14 1.27
Two M3B18 4.5 4 60 ml 94 16% 204 0.23 384 0.16 1.88
Two M3B15 4.5 6 30 gms 93 14% 212 0.18 269 0.28 1.27
One M3B1 4.5 1 0.5:1 by volume 98 6% 305 0.11 479 0.21 1.57
Two M4C1 3 2 100 ml 153 0.20 364 0.25 2.38
Two M2C3 6 2 100 ml 344 0.16 357 0.24 1.04
Two Premix N/A 8 N/A 369 0.30 494 0.09 1.34
Two Premix N/A 9 N/A 138 0.72 395 0.30 2.86
Two Premix N/A 10 N/A 283 0.15 286 0.23 1.01
Averages 252 0.25 373 0.211.48Ratio of average wet:dry
Dry Couplet bond
strength (kPa)
Admixture Wet Couplet bond
strength (kPa)
Ratio of
Mortar Day Test Flow Air strengths
batch made group No Dosage per 40 kg (mm) content Filled:cored
number label bag of cement Ave. C.O.V. Ave. C.O.V.
1 One M3B1 1 0.5:1 by volume 98 6% 305 0.11 453 0.25 1.48
8 Two M3B15 6 30 gms 93 212 0.18 167 0.16 0.79
Average 96 6% 259 0.14 310 0.20 1.14
Couplet bond
Admixture strength (kPa)
Cored bricks Filled bricks

7/24/2019 SR258 - Critical Properties of Mortar
http://slidepdf.com/reader/full/sr258-critical-properties-of-mortar 53/89
45
Table 18. Effect of full tie embedment using mortar with Sand Y
Table 19. Effect of using cardboard as against steel cylinders using mortar with Sand Y
Ratio of
Mortar Day Test Flow Air strengths
batch made group No Dosage per 40 kg % content Filled:
number label bag of cement Ave. C.O.V. Ave. C.O.V. dry bedded
1 One M3B1 1 0.5:1 by volume 98 6% 49 0.12 65 0.08 1.338 Two M3B15 6 30 gms 93 14% 39 0.03 36 0.38 0.93
20 Two M4C1 2 100 mL 88 42 0.29 75 0.06 1.77
21 Two M2C3 2 100 mL 90 37 0.26 72 0.11 1.92
6 Two M3B18 4 100 mL 94 16% 31 0.09 44 0.26 1.45
Average 93 12% 40 0.16 58 0.18 1.48
Admixture strength (N/mm)
Dry be dded Full embedment
Tie bond
Ratio of
Mortar Day Test strengthsbatch made group No Dosage per 40 kg card./steel
number label bag of cement Ave. C.O.V. Ave. C.O.V.
4 One M3B6 2 25 gms 7.00 0.12 7.30 0.04 1.04
22 Two Premix 8 31.30 0.05 31.50 0.02 1.01
8 Two M3B15 2 25 gms 11.00 0.05 11.00 0.08 1.00
20 Two M4C1 2 25 gms 18.30 0.08 23.70 0.01 1.30
Average 16.90 0.07 18.38 0.04 1.09
Cylinder strengths for
Admixture different moulds (MPa)Cardboard Steel

7/24/2019 SR258 - Critical Properties of Mortar
http://slidepdf.com/reader/full/sr258-critical-properties-of-mortar 54/89
46
Table 20. Properties determined using pre-mixed mortars
Table 21. Effect of tooling joints
Mortar Day Premix Flow Density Ratios
CM made No % kN/m
3
couplet:number Ave. C.O.V. Ave. C.O.V. Ave. C.O.V. Tie bond
22 Two 8 96 369 0.30 49 0.42 0.0 8.333 2020 7.53
23 Two 9 85 138 0.72 37 0.10 0.0 6.000 1880 3.71
24 Two 10 57 283 0.15 37 0.23 0.0 9.833 1870 7.70
Averages 79 263 0.39 41 0.25 0.0 8.06 1923 6.31
strength (kPa) strength (N/mm) strength (MPa)
Couplet bond Tie bond Compressive
air Notional bond
# specimens Flow content strength (kPa) C.o.V.
Ironed concave 10 94% 20% 276 0.26
Weatherstruck 10 94% 20% 304 0.30
Raked and tooled 10 94% 20% 214 0.24
Raked and brushed. 10 94% 20% 212 0.44
M3B3 struck flush 5 101% 18% 330 0.20
M3B21 struck flush 5 87% 20% 259 0.18

7/24/2019 SR258 - Critical Properties of Mortar
http://slidepdf.com/reader/full/sr258-critical-properties-of-mortar 55/89
Figure 18. Relationship between seven day couplet bond strength and mortar flow whencement content varied
0
100
200
300
400
500
600
700
60 70 80 90 100 110 120 130 140 150
C o u p l e t t e n s i o n b o n d s t r e n g t h ( k P a )
Flow (Percent)
Day 1 and 2 Admixture 1 (Lime)
Day 1 and 2 Admixture 2
Day 4 Admixture 1 (l ime)
Day 4 Admixture 2
Best fit line to other data

7/24/2019 SR258 - Critical Properties of Mortar
http://slidepdf.com/reader/full/sr258-critical-properties-of-mortar 56/89
Figure 20. Relationship between couplet and direct tension bond strength
0
100
200
300
400
500
600
700
0 50 100 150 200 250 300 350 400
C o u p l e t t e n s i o n b o n d s t r e n g t h ( k P a )
Direct tension bond stength (kPa)
5 minutes mixing
30 minutes mixing
3 x Admixture and 5 minutes mixing
Best fit line: Couplet = 1.435 x direct tension

7/24/2019 SR258 - Critical Properties of Mortar
http://slidepdf.com/reader/full/sr258-critical-properties-of-mortar 57/89
Figure 22. Relationship between air content and mortar density for Sand Y
0%
5%
10%
15%
20%
25%
30%
35%
40%
1500 1600 1700 1800 1900 2000 2100 2200 2300 2400
A i r c o n t e n
t
Density kg/m3
5 minutes mixing
30 minutes mixing
3 x Admixture and 5 minutes mixing
% air content = 0.06383(2145.5-density)
Day 4

7/24/2019 SR258 - Critical Properties of Mortar
http://slidepdf.com/reader/full/sr258-critical-properties-of-mortar 58/89
Figure 24. Relationship between mortar compressive strength and mortar air content forSand Y
0
2
4
6
8
10
12
14
16
18
20
0% 5% 10% 15% 20% 25% 30% 35% 40%
2 8 d a y c o m p r e s s i o n s t r e n g t h ( k P a )
Air content (%)
5 minutes mixing
30 minutes mixing
3 x Admixture and 5 minutes mixing
Best fit curve
Day 4
60
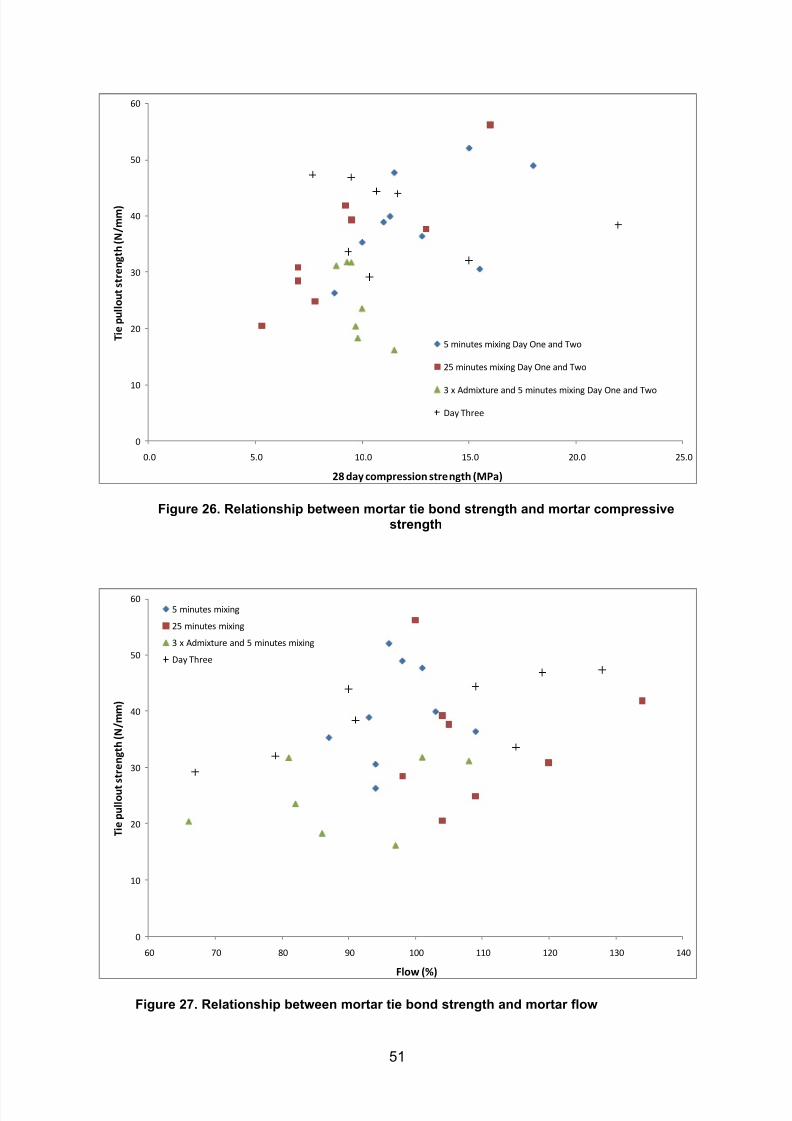
7/24/2019 SR258 - Critical Properties of Mortar
http://slidepdf.com/reader/full/sr258-critical-properties-of-mortar 59/89
Figure 26. Relationship between mortar tie bond strength and mortar compressivestrength
0
10
20
30
40
50
60
0.0 5.0 10.0 15.0 20.0 25.0
T i e p u l l o u t s
t r e n g t h ( N / m m )
28 day compression strength (MPa)
5 minutes mixing Day One and Two
25 minutes mixing Day One and Two
3 x Admixture and 5 minutes mixing Day One and Two
Day Three

7/24/2019 SR258 - Critical Properties of Mortar
http://slidepdf.com/reader/full/sr258-critical-properties-of-mortar 60/89
Table 22. Admixtures or pre-mix type used in the BRANZ testing programNumber Admixture or Pre-mix label
1 Hydrated lime
2 A2 admixture
3 A3 admixture
4 A4 admixture
5 A5 admixture
6 A6 admixture
7 A7 admixture8 B1 pre-mixed mortar
9 B2 pre-mixed mortar
10 B3 pre-mixed mortar
4.7 Test results on elemental specimens using various sands
4.7.1 Properties of sands used
Small samples of sand were collected from various suppliers around the country andwere sent to BRANZ. They were subsequently sent to an accredited laboratory forsand sieve analysis. Based on this information the seven sands listed in the firstcolumn of Table 23 were selected for detailed mortar testing as they were consideredto represent the extremes of good and bad from the spectrum of sands used in thecountry. A larger quantity of sand was then obtained, reputably from the original

7/24/2019 SR258 - Critical Properties of Mortar
http://slidepdf.com/reader/full/sr258-critical-properties-of-mortar 61/89
Figure 28. Grading curves for sands X1 and X11
Table 23. Sands used in Tests in Section 4.7
Sand label fromoriginal small
packet
Sand label from largervolume of the same
sand
Reason for selection of sand
X1 DX1 Good fit to grading envelope, fairly clean
X11 DX11 A moderately good grading curve, butdirty
J1 DJ1 A single sized very fine sand
J6 DJ6 Another example of a single sized veryfine sand
J9 DJ9 Good fit to grading envelope, clean
0
10
20
30
40
50
60
70
80
90
100
4.75mm
2.36mm
1.18mm
600 um425 um300 um150 um75 umPan
%
P a s s i n g
Sieve Size
X1 Grading Curve
Max Envelope (ASTMC144)
Min Envelope (ASTM C144)
X1
0
10
20
30
40
50
60
70
80
90
100
4.75mm
2.36mm
1.18mm
600 um425 um300 um150 um75 umPan
%
P a s s i n g
Sieve Size
X11 Grading Curve
Max Envelope (ASTMC144)
Min Envelope (ASTM C144)
X11

7/24/2019 SR258 - Critical Properties of Mortar
http://slidepdf.com/reader/full/sr258-critical-properties-of-mortar 62/89
water did not separate. There wastime to work it. It had life in it.
DX11 This limestone sand was similar to the
DJ9 sand. However, the mortarabsorbed water OK and did notseparate but was slightly sticky.However, he rated it slightly worsethan DJ9.
4 91
DJ12 He described this as a coarse silicasand. It felt like “silver” sand but it wasa bit coarser and had a bit of
grittiness. The mortar was slightlyhungry for water and the mix neededmore cement. It was good, but notquite as good as mortar from DX1sand.
2 67
DJ13 He considered this beach sand to besimilar to DJ1, but not as bad. It mademortar which was fatty and hungry for
water but it bound OK.
6 109
Wall W9(Sand Y)
He considered this to be coarse riversand which contained some foreignparticles. It was a clay loam Sand Ythat did not mix up easily. However, itmade mortar which felt good on thetrowel, had good water retention anddid not separate. The mortar was
5 119

7/24/2019 SR258 - Critical Properties of Mortar
http://slidepdf.com/reader/full/sr258-critical-properties-of-mortar 63/89
Figure 29. Flow and bond strength versus sand rating for the range of tested sands
0
100
200
300
400
500
600
700
800
0
20
40
60
80
100
120
140
0 1 2 3 4 5 6 7 8 9
B o n d s
t r e n g t h ( k P a )
F
l o w ( % )
Relative rating of sand suitability by the tradesman (1 = good, 8 = bad)
Flow
Bond
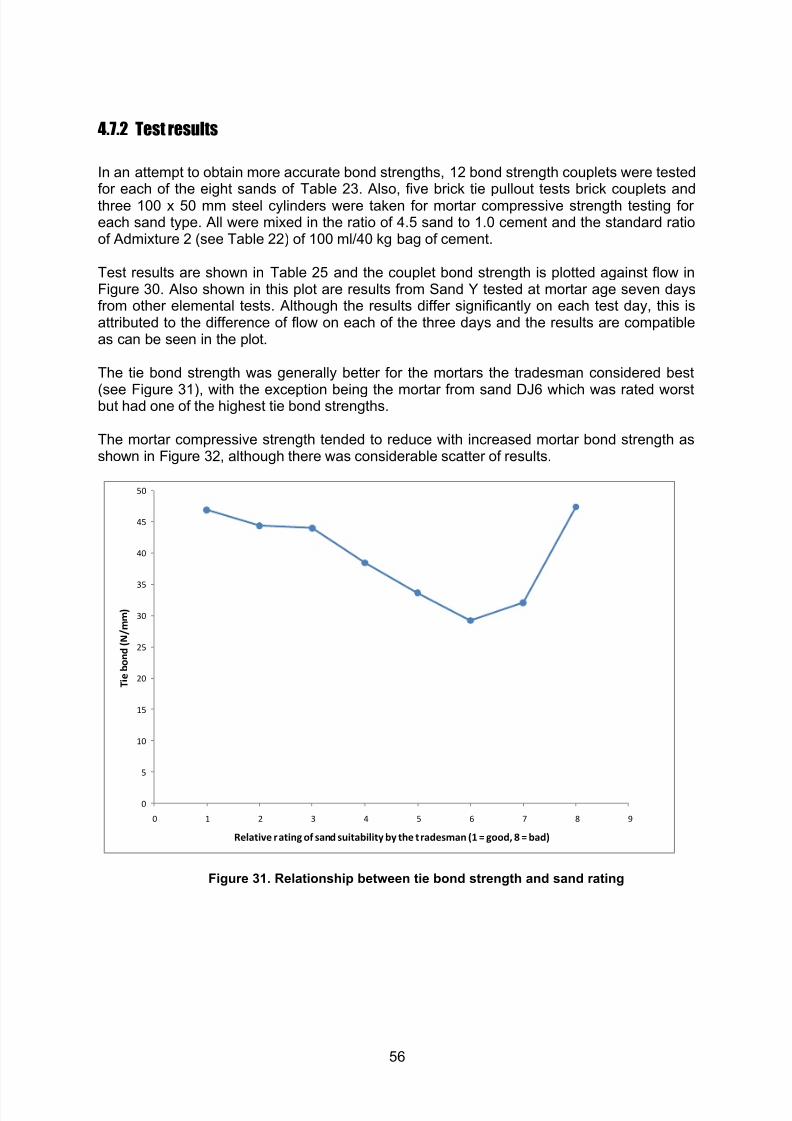
7/24/2019 SR258 - Critical Properties of Mortar
http://slidepdf.com/reader/full/sr258-critical-properties-of-mortar 64/89
4.7.2 Test results
In an attempt to obtain more accurate bond strengths, 12 bond strength couplets were testedfor each of the eight sands of Table 23. Also, five brick tie pullout tests brick couplets andthree 100 x 50 mm steel cylinders were taken for mortar compressive strength testing foreach sand type. All were mixed in the ratio of 4.5 sand to 1.0 cement and the standard ratioof Admixture 2 (see Table 22) of 100 ml/40 kg bag of cement.
Test results are shown in Table 25 and the couplet bond strength is plotted against flow in
Figure 30. Also shown in this plot are results from Sand Y tested at mortar age seven daysfrom other elemental tests. Although the results differ significantly on each test day, this isattributed to the difference of flow on each of the three days and the results are compatibleas can be seen in the plot.
The tie bond strength was generally better for the mortars the tradesman considered best(see Figure 31), with the exception being the mortar from sand DJ6 which was rated worstbut had one of the highest tie bond strengths.
The mortar compressive strength tended to reduce with increased mortar bond strength asshown in Figure 32, although there was considerable scatter of results.
40
45
50

7/24/2019 SR258 - Critical Properties of Mortar
http://slidepdf.com/reader/full/sr258-critical-properties-of-mortar 65/89
Figure 32. Relationship between mortar bond strength and mortar compressive strengthfor Sand Y Admixture 2
0
100
200
300
400
500
600
700
800
0.0 2.0 4.0 6.0 8.0 10.0 12.0 14.0 16.0 18.0 20.0
C o u p l e t t e n s i o n
b o n d s t r e n g t h ( k P a )
28 day compression strength (MPa)
Day One and Two
Day Three (all sands)
Day Four Sand Y1 at 7 days

7/24/2019 SR258 - Critical Properties of Mortar
http://slidepdf.com/reader/full/sr258-critical-properties-of-mortar 66/89
58
Table 25. Test results from elemental tests on mortar on Day Three using various sands
Sand Flow Density Ratio Later used for
Type % kN/m3
couplet: Wall
Ave. C.O.V. Ave. C.O.V. Ave. C.O.V. Tie bond Number
Y 119 539 0.25 47 0.09 9.5 0.091 1880 11.50 W9 and W12
DJ13 109 463 0.17 44 0.11 10.7 0.027 1680 10.43
DJ9 90 334 0.27 44 0.16 11.7 0.124 1707 7.60
DX11 91 154 0.40 38 0.10 22.0 0.060 1953 4.00
DJ1 115 430 0.24 34 0.18 9.3 0.062 1800 12.80 W10
DJ12 67 204 0.52 29 0.12 10.3 0.028 1640 7.00
DX1 79 144 0.36 32 0.17 15.0 0.000 1797 4.48 W11
DJ6 128 743 0.18 47 0.18 7.7 0.136 1860 15.67
Average 99 360 0.28 40 0.14 11.8 0.07 1803 8.77
strength (kPa) strength (N/mm) strength (MPa)
Couplet bond Tie bond Compressive
7/24/2019 SR258 - Critical Properties of Mortar
http://slidepdf.com/reader/full/sr258-critical-properties-of-mortar 67/89
5. STAGE III. SHAKE TABLE TESTS ON BRICK VENEER WALLSFour brick veneer walls were constructed with each using a different mortar mix. Theywere first racked in the in-plane direction and then shaken to destruction on the BRANZshake table at a mortar age of 49 to 58 days.
Section 5.1 describes the elemental tests performed on the mortar used
Section 5.2 describes the wall construction
Section 5.3 describes the in-plane tests
Section 5.4 derives the seismic demand load on the test walls to enable acomparison to be made of the measured strength of the test walls and therequired demand load
Section 5.5 describes the shake table tests
Section 5.6 analyses the test results.
5.1 Elemental test results
Based on the elemental tests of Section 4.7, four mortar mixes were selected for brickveneer walls to be tested on the BRANZ shake table. These were based on the maximumand minimum bond strengths from the mixes as summarised in Table 26. The walls werecalled W9, W10, W11 and W12 and were constructed over a period of three days.
During construction of the test walls, five brick bond couplets and three brick tie test
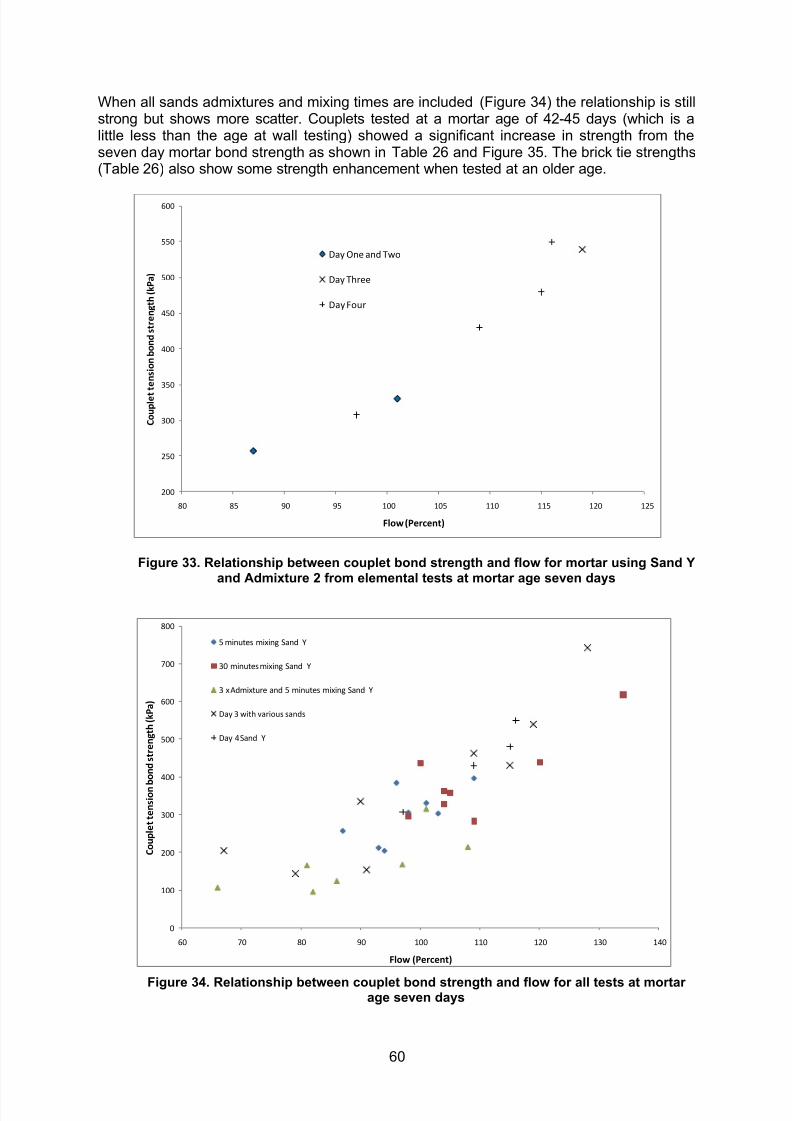
7/24/2019 SR258 - Critical Properties of Mortar
http://slidepdf.com/reader/full/sr258-critical-properties-of-mortar 68/89
When all sands admixtures and mixing times are included (Figure 34) the relationship is stillstrong but shows more scatter. Couplets tested at a mortar age of 42-45 days (which is alittle less than the age at wall testing) showed a significant increase in strength from the
seven day mortar bond strength as shown in Table 26 and Figure 35. The brick tie strengths(Table 26) also show some strength enhancement when tested at an older age.
200
250
300
350
400
450
500
550
600
80 85 90 95 100 105 110 115 120 125
C
o u p l e t t e n s i o n b o n d s t r e n g t h ( k P a )
Flow (Percent)
Day One and Two
Day Three
Day Four

7/24/2019 SR258 - Critical Properties of Mortar
http://slidepdf.com/reader/full/sr258-critical-properties-of-mortar 69/89
Figure 35. Relationship between couplet bond strength and flow for all tests irrespectiveof mortar age
0
200
400
600
800
1000
1200
60 70 80 90 100 110 120 130 140
C o u p l e t t e n s i o n b o n d s t r e n g t h ( k P a )
Flow (Percent)
5 minutes mixing Sand Y age 7 days
30 minutes mixing Sand Y age 7 days
3 x Admixture Sand Y age 7 days
Day 3 with various sands age 7 days
Day 4 Sand Y age 7 days
Day 4 Walls W9 to W11 age 42-45 days

7/24/2019 SR258 - Critical Properties of Mortar
http://slidepdf.com/reader/full/sr258-critical-properties-of-mortar 70/89
62
Table 26. Test results on mortar used in shake table tests
Legend
* Sand type is described in Section 4.7.1. ** Admixtures are described in Table 22.
Notes on Table 26
Dosage of Admixture 2 was 100 ml/40 kg of cement which is that recommended by the manufacturer.
Dosage of Admixture 7 was 658 gm/40 kg of cement which is that recommended by the manufacturer.
The sand:cement ratio was 4.5 for all walls except Wall W12 where the ratio was 4:1 as recommended by the manufacturer.
Wall Sand Admixture
Label Type Used
* ** Flow Brick Tie 28 day Flow Brick Brick Tie 28 day
bond bond compressive bond bond bond compressive
strength strength strength strength strength strength strength
at 7 days N/mm (MPa) at 7 days at 42 to at 43 to (MPa)
45 days 46 days
(kPa) (kPa) (kPa) N/mm
W9 Y 2 119 539 46.9 9.5 110 455 686 59 15.3
W10 DJ1 2 115 430 33.6 9.3 102 - 835 56 12.7
W11 DX1 2 79 144 32.1 15.0 109 - 490 47 17.7
W12 Y 7 94 123 26.0 8.7 104 - 240 40 16.2
Elemental test results
From samples taken during wall constructionFrom Day3 except W12 is from Day1
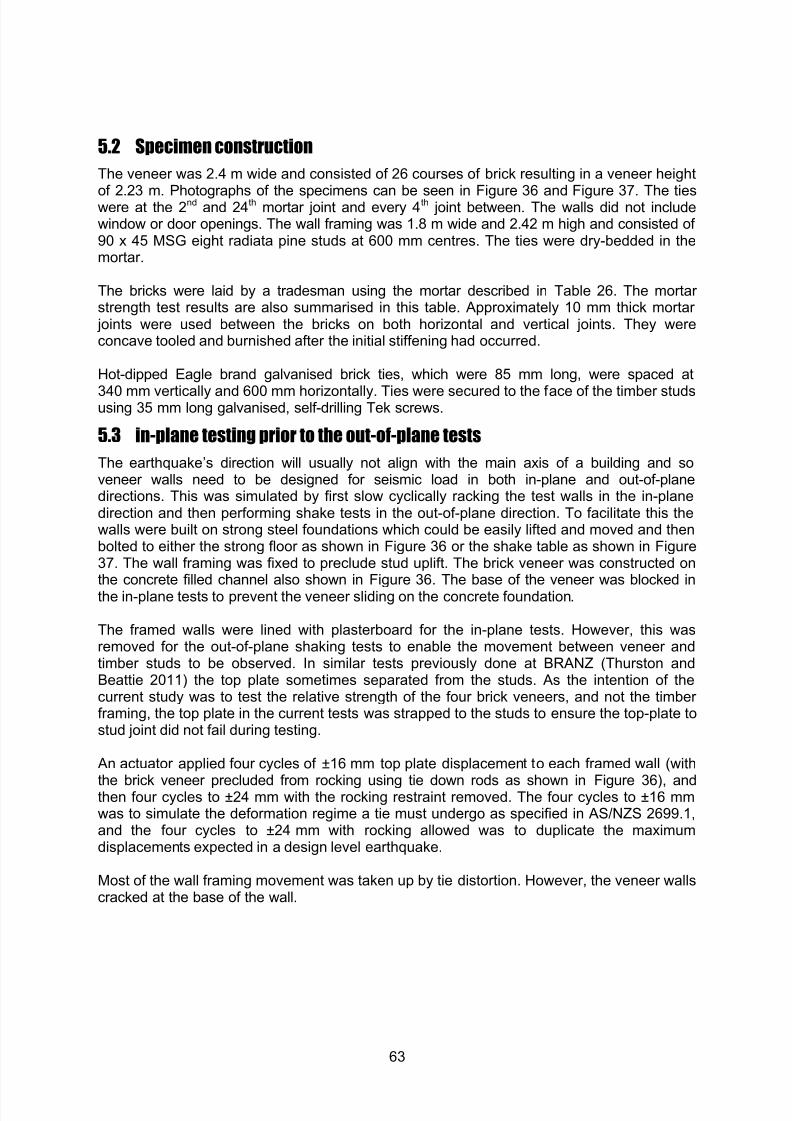
7/24/2019 SR258 - Critical Properties of Mortar
http://slidepdf.com/reader/full/sr258-critical-properties-of-mortar 71/89
5.2 Specimen constructionThe veneer was 2.4 m wide and consisted of 26 courses of brick resulting in a veneer heightof 2.23 m. Photographs of the specimens can be seen in Figure 36 and Figure 37. The tieswere at the 2nd and 24th mortar joint and every 4th joint between. The walls did not includewindow or door openings. The wall framing was 1.8 m wide and 2.42 m high and consisted of90 x 45 MSG eight radiata pine studs at 600 mm centres. The ties were dry-bedded in themortar.
The bricks were laid by a tradesman using the mortar described in Table 26. The mortarstrength test results are also summarised in this table. Approximately 10 mm thick mortar joints were used between the bricks on both horizontal and vertical joints. They wereconcave tooled and burnished after the initial stiffening had occurred.
Hot-dipped Eagle brand galvanised brick ties, which were 85 mm long, were spaced at340 mm vertically and 600 mm horizontally. Ties were secured to the face of the timber studsusing 35 mm long galvanised, self-drilling Tek screws.
5.3 in-plane testing prior to the out-of-plane tests
The earthquake‟s direction will usually not align with the main axis of a building and soveneer walls need to be designed for seismic load in both in-plane and out-of-planedirections. This was simulated by first slow cyclically racking the test walls in the in-planedirection and then performing shake tests in the out-of-plane direction. To facilitate this thewalls were built on strong steel foundations which could be easily lifted and moved and thenbolted to either the strong floor as shown in Figure 36 or the shake table as shown in Figure
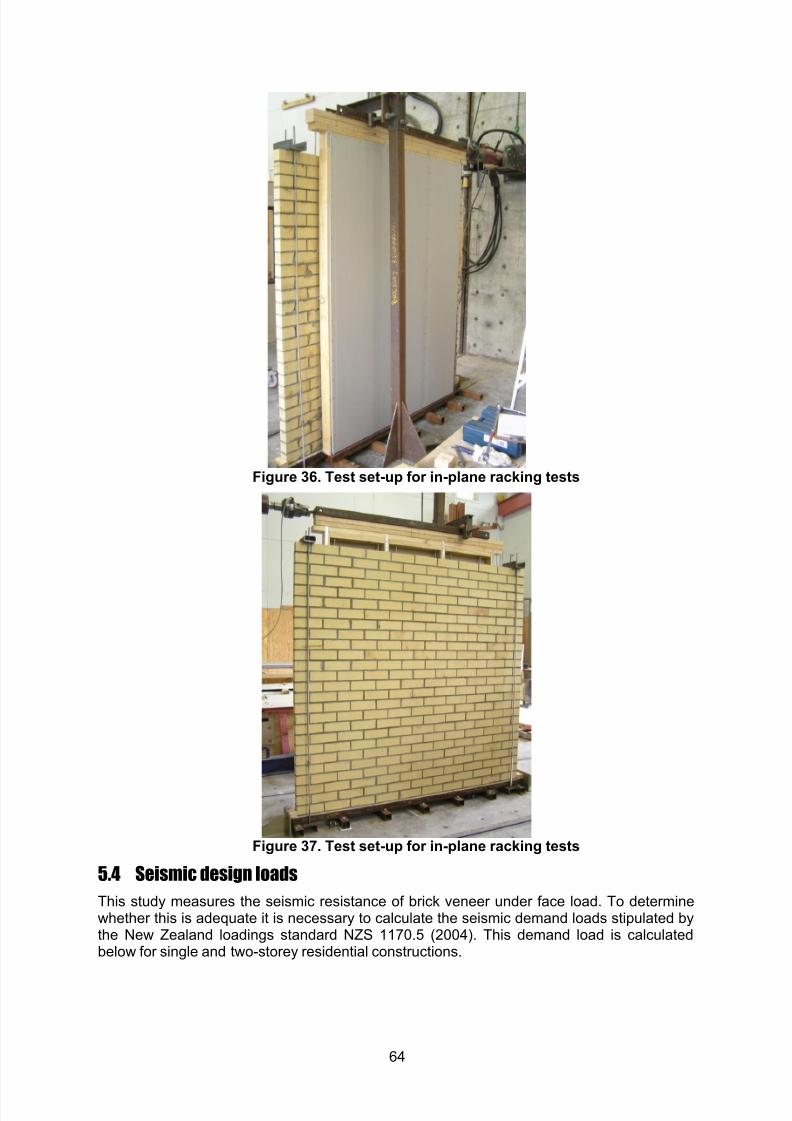
7/24/2019 SR258 - Critical Properties of Mortar
http://slidepdf.com/reader/full/sr258-critical-properties-of-mortar 72/89
Figure 36. Test set-up for in-plane racking tests

7/24/2019 SR258 - Critical Properties of Mortar
http://slidepdf.com/reader/full/sr258-critical-properties-of-mortar 73/89
5.4.1 Single-storey veneer construction
Section 8 (requirements for parts and components) of NZS 1170.5 (SNZ 2004) states that
(for category P.1, P.2 and P.3 parts) that the scope of Section 8 was limited to parts thatweigh more than 10 kg and are able to fall more than 3 m onto a publically accessible area.Further, that “when a part is supported directly on the ground it shall be designed as aseparate structure with design actions derived in accordance with Section 5” of NZS 1170.5.Consequently, single-storey brick veneer need not be designed as a “part” and Eqn. 5.2(1) of NZS 1170.5 was used to derive the horizontal design action coefficient, Cd(T1) for out-of-plane loading on a single-storey brick veneer house located on soft soil in Wellington. It wasassumed that the building period was less than 0.4 seconds and the ductility factor, µ, was
1.0. Thus;
2.10.1
0.12.1
K
S)(TC)(TC
p11d
x
Note that based on the face load tie strength requirement of Table 2 of AS/NZS 2699.1 (SNZ2000) the tie spacing given in Table 2.3 of NZS 4210 (SNZ 2001) implicitly assumes Cd(T1) =1.74 for Wellington (Thurston and Beattie 2011).
5.4.2 Upper storey of two-storey veneer
Section 8 specifies that the design action on a part, Fph, is given by:
Fph = Cp(Tp) Cph Rp Wp = C (0) CHi Ci(Tp) Cph Rp Wp = 1.12 x 1.5 x 2.0 x 1.0 x 1.0 Wp = 3.36 Wp
To calculate CHi, assumptions needed to be made of the height of veneer attachment to thebuilding and height of the uppermost seismic mass (which could be open to debate).

7/24/2019 SR258 - Critical Properties of Mortar
http://slidepdf.com/reader/full/sr258-critical-properties-of-mortar 74/89
The first P-EQ applied (called Set A) imposed the lowest level peak displacements, withgood fidelity being achieved for both the target displacements and accelerations. The
magnitude of the voltage trace was designed to produce the same table accelerations ateach frequency. Thus, at each frequency (i.e. carriage of the train) the sine wave induceddifferent table peak displacements but the same peak accelerations.
At each successive P-EQ from Set B to Set G greater magnitudes of excitation voltage tracewere applied to produce greater peak accelerations. However, at the lower frequencies thetrace was modified to take into account the physical limits of the equipment, and theaccelerations at these lower frequencies was less than the target accelerations.
Figure 45 shows the target acceleration record for two P-EQs called Set A and Set G. (Set Bto Set F are not shown for clarity.) The first portion of Figure 45 is expanded in Figure 46 toshow the higher frequency accelerations more clearly. With the low accelerations of Set Athe table is capable of following the whole record. In Set G, for frequencies below 3.5 Hz, thetable velocity and displacement limitations prevented the full peaks from being achieved asshown in Figure 45.
5.5.2 Test set-upThe bottom of each specimen was bolted to the shake table as shown in Figure 38. Theactuator applying the motion was fixed to mid-height of a stiff space frame (also shown inFigure 38). The space frame was rigidly connected to both the shake table and to the topplate of the wall framing. Thus, the accelerations imposed on the table were also(approximately) imposed to the top of the framing. This arrangement simulated the situationwhere the side walls and ceiling/roof diaphragm of a house are extremely rigid and is oneextreme for worst case out-of-plane loading of veneer walls.

7/24/2019 SR258 - Critical Properties of Mortar
http://slidepdf.com/reader/full/sr258-critical-properties-of-mortar 75/89

7/24/2019 SR258 - Critical Properties of Mortar
http://slidepdf.com/reader/full/sr258-critical-properties-of-mortar 76/89
Generally veneer shedding was preceded by a group of ties pulling out of the mortar.However occasionally the ties partially pulled out under tension, jammed and then buckledunder subsequent compression load, and then finally ruptured under a buckling fatigue
mode.
1 2
-0.8
-0.4
0
0.4
0.8
1.2
0 200 400 600 800 1000 1200 1400 1600 1800
D e f l e c t i o n b e t w e e n
v e n e e r a n d s t u d a t w a l l m i d - h e i g h t ( m m )
Time (milliseconds)
Mid-height differential deflection
Peak points

7/24/2019 SR258 - Critical Properties of Mortar
http://slidepdf.com/reader/full/sr258-critical-properties-of-mortar 77/89
Between 6-8 Hz the spectra tended to increase. This was again attributed to
feedback from the table and end support frame. As this frequency range was not
critical to the performance of the test walls, this feature is considered to be of little
consequence.
0
1
2
3
4
5
6
S p e c t r u m c o e f f i c i e n t ( g )
Line A. Limit due to table maximum velocity.
P-EQ Set A
P-EQ Set B
P-EQ Set C
P-EQ Set D
P-EQ Set E

7/24/2019 SR258 - Critical Properties of Mortar
http://slidepdf.com/reader/full/sr258-critical-properties-of-mortar 78/89
With the exception of Wall W12, all walls resisted spectra greater than the design spectra forsingle-storey buildings. The seven day bond strength for Wall W11 was 144 kPa and for WallW12 was 123 kPa. It was concluded that seven day mortar bond strength over 200 kPa was
suitable for single-storey buildings.
Wall W9 and W10 resisted spectra greater than the design spectra for two-storey buildings.The seven day bond strength for Wall W9 was 455 kPa and for Wall W10 it was 430 kPa. Itwas concluded that seven day mortar bond strength over 500 kPa was suitable for two-storey buildings.
6. DISCUSSION AND CONCLUSIONS
6.1 Comments on AS/NZS 2699.1
Currently brick veneer ties are classified as light, medium or heavy duty depending on theirperformance in the tests to Appendix A of AS/NZS 2699.1 (SNZ 2000). Table 2.3 of NZS4210 (SNZ 2001) stipulates the tie classification required for a particular building as afunction of seismic zone, veneer weight and tie spacing. This was determined by ensuring
the tie strength (as measured by the AS/NZS 2699.1 tie test) exceeded the seismic demandforce on the tie. This is defined as the tributary weight of the veneer per tie (i.e. weight of anarea of veneer = tie vertical spacing x tie horizontal spacing) factored by a horizontal seismiccoefficient which varies with seismic zone. Hence, if the coefficient is selected on soundprinciples the tie connection should not fail under face loading in a design earthquake.
Limitations of the test method in AS/NZS 2699.1 are discussed below:

7/24/2019 SR258 - Critical Properties of Mortar
http://slidepdf.com/reader/full/sr258-critical-properties-of-mortar 79/89
2699.1 tests. Thus, ties can pull out of joints more readily in practice than simulated in
the AS/NZS 2699.1 tests. Small corrugations and protrusions in the tie are not very
effective in a cracked joint. A better simulation of a cracked joint in a revised
AS/NZS 2699.1 test is likely to result in use of ties with deeper corrugations or an
upturned end. However, although desirable, devising such a test will be difficult.
5. Section A7.3 of AS/NZS 2699.1 requires a compressive pressure between 10 and
100 kPa be placed across the mortar joint of the test specimen. This is a huge range,
which can significantly affect test results. It is equivalent to a range of approximately
0.5 to 5 m of veneer weight above the joint. For a tie of area of say 50 x 20 =
1000 mm2 in the joint, a pressure on the tie of 100 kPa, assuming a friction coefficient
of 1.0, will resist a sliding force of 2 x 1000 x 100-6 = 0.2 kN, which is 40% of the
required strength for EL ties. However, in most laboratory tests the level of
compression is not measured and the equipment used may strongly resist any
expansion of the joint, which means that corrugated or dimpled tie shapes need to
ream out the mortar or the brick surface before they will pull out. The actual pressure
on the tie may therefore be greater than 100 kPa at tie pullout. In actual construction
some joint expansion is possible meaning that the high pressure cannot be
maintained. It is recommended that AS/NZS 2699.1 stipulates the compressionpressure across the mortar joint be 20 kPa, require this to be monitored during the
test (or use a dead load), and for the set-up not to impose additional restraints on the
joint expanding.
6.2 Discussion of parameters affecting brick veneer seismic performance
Based on the writer‟s previous testing (Thurston and Beattie 2009), it is considered that the

7/24/2019 SR258 - Critical Properties of Mortar
http://slidepdf.com/reader/full/sr258-critical-properties-of-mortar 80/89
This research found that the in-plane loading sometimes induced cracks in the mortar. Suchcracks can result in early tie pullout and thereby early veneer collapse. By comparing mortarbond strength used in the test walls with wall resistance to the shake table loading the
following recommendation was made:
“To ensure a brick veneer complying with NZS 4210 can resist the New Zealand demandearthquake loads without any masonry shedding, brick veneer should use a mortar withminimum seven day bond strength of:
(a) Single-storey brick veneer: 200 kPa
(b) Two-storey brick veneer: 500 kPa”.
6.2.3 Strength of the connection between brick ties and the brick veneer
Only brick ties which have had the strength/stiffness of their connection between timberframing and brick veneer tested to AS/NZS 2699.1 may be used in construction toNZS 4210. As discussed in Section 6, the results from the AS/NZS 2699.1 test, veneerweight and seismic zone determine whether a specific tie may be used on a specific project.
NZS 4210 stipulates that ties must be screwed to studs. With most ties on the market a
robust Tek screw is used, and the writer has not encountered a failure with this connectioneither in the field or in the laboratory.
Tie rupture is also rare, and the writer has only observed it to occur after the tie has partlypulled out of the mortar and then jammed on the reverse compression load, buckled andsubsequently suffered low cycle fatigue failure.
The weakest link between veneer and frame is the tie pulling out of the mortar. In the face

7/24/2019 SR258 - Critical Properties of Mortar
http://slidepdf.com/reader/full/sr258-critical-properties-of-mortar 81/89
Paradoxically, the sand considered worst by the tradesman gave high mortar bond strength,because to achieve a suitable workability he was required to add more water and hence ahigh mortar flow was achieved.
6.2.4.2 Mortar compressive strength
The elemental test results showed that increases in cement content increases mortarcompressive strength. Mortar compressive strength had poor correlation with the mortar-to-brick bond strength. Mixing the mortar too long in the barrow, and also using excessiveadmixtures compared with the manufacturer‟s recommendations reduced the mortarcompressive strength.
Specifying mortar suitability on compressive strength alone cannot be relied on to yieldadequate masonry bond strength. However, it would be imprudent to suggest that thecement content of mortar can be reduced as the cement plays a major part in the mortardurability.
NZS 4210 (SNZ 2001) calls for a compressive 28 day mortar strength of 12.5 MPa forstructural compliance with NZS 3604, although this is not intended to apply to veneers. Thestandard also states that the strength of mortars for veneers shall follow the requirements of
masonry suppliers. Some of these specify strength of 12.5 MPa, and others rely on themortar mix compositions listed in Table 2.1 of NZS 4210. The minimum compressivestrength needs to be clarified in future revisions of the standard. It is recommended that themortar compressive strength of brick veneer be at least 6 MPa to maintain an acceptablelevel of durability.
7. GENERAL RECOMMENDATIONS FOR REVISION OF STANDARDS

7/24/2019 SR258 - Critical Properties of Mortar
http://slidepdf.com/reader/full/sr258-critical-properties-of-mortar 82/89
7.1.5 Quality assurance of mortar bond strength
It has been shown that bond strength is mainly influenced by mortar flow. On this basis thefollowing recommendation is made:
I t is recommended that bond strength is measured for each new brick or mortarcombination used on-site to ensure the target bond strength results are achieved. Also, eachtradesperson should be required to have the bond strength measured every 12 months. Thecouplets should be made on-site, left on-site under shelter (but not under plastic) to cure forseven days and then tested by an accredited laboratory. At the same time as these testsamples are made, a slump test should be preformed and the spread recorded. Thetradesperson should daily perform the same slump test on-site to ensure the spread matchesor exceeds that obtained when the mortar bond strength was measured.
Although the equipment to do the mortar bond test on-site is simple, it is not consideredappropriate for the tradesperson to do the bond tests as test results are sensitive to handlingand the mortar-brick bond test results show a large scatter. The bond strength depends tosome extent on the curing conditions (temperature and humidity). It will be difficult to removethis variable in practice without undue expense. I t is recomm ended , therefore, that daily
slump tests (but not bond tests) are carried out.
7.2 AS/NZS 2699.1 test method
I t is recomm ended that the test method specify a mortar bond strength not exceeding200 kPa and the test be performed with solid clay-brick units with core holes. The bricksshould have the minimum width they can have in practice – eg 70 mm. NZS 4210 shouldalso be modified to require single-storey construction to achieve a bond strength of at least

7/24/2019 SR258 - Critical Properties of Mortar
http://slidepdf.com/reader/full/sr258-critical-properties-of-mortar 83/89

7/24/2019 SR258 - Critical Properties of Mortar
http://slidepdf.com/reader/full/sr258-critical-properties-of-mortar 84/89
76
Figure 42. Photographs of veneer shedding mechanisms for the four test walls
Wall W9 Wall W10 Wall W11 Wall W12

7/24/2019 SR258 - Critical Properties of Mortar
http://slidepdf.com/reader/full/sr258-critical-properties-of-mortar 85/89
Figure 43. Spectra calculated from measured table accelerations for Wall W9
0
1
2
3
4
5
6
0 1 2 3 4 5 6 7 8
S e i s m i c c o
e f f i c i e n t ( g )
Frequency (Hz)
Test 9A
Test 9B
Test 9C
Test 9D
Test 9E
Test 9F
6

7/24/2019 SR258 - Critical Properties of Mortar
http://slidepdf.com/reader/full/sr258-critical-properties-of-mortar 86/89
8. REFERENCES
Allen D. 1986. Masonry – Materials, Workmanship and Inspection. The New ZealandInstitute of Building Inspectors Inc. annual conference, Nelson, New Zealand.
ASTM Standard. 2004. C144: 2004 Standard specification for aggregate for masonry mortar. ASTM International, West Conshohocken, PA, USA.
ASTM International. 2008. ASTM C270-08a Standard specification for mortar for unit masonry . ASTM, West Conshohocken, PA, USA.
Brick Development Research Institute. 1977. Design Note 4A “Mortar for Brickwork”. [missingpublisher details?]
Brick Development Research Institute. 1980. Design Note 4C “Mortar Ingredients”. [missing
details?]
British Standards Institute. 2005. BS 5628-3 Code of practice for the use of masonry. Part 3:Materials and components, design and workmanship. BSI, England.
Cement Concrete & Aggregates Australia. 2007. Durability of Masonry Mortar TechnicalNote. [missing details?]

7/24/2019 SR258 - Critical Properties of Mortar
http://slidepdf.com/reader/full/sr258-critical-properties-of-mortar 87/89
Standards New Zealand. 1986. NZS 3112 Part 1 Test methods for fresh concrete. SNZ,Wellington, New Zealand.
Standards New Zealand. 1991. NZS 3103 Specification for sands for mortars and plasters.SNZ, Wellington, New Zealand.
Standards New Zealand. 1999. NZS 3604 Timber framed buildings. SNZ, Wellington, NewZealand.
Standards New Zealand. 2000. AS/NZS 2699 Built-in components for masonry construction.Part 1: Wall ties. SNZ, Wellington, New Zealand.
Standards New Zealand. 2001. NZS 4210 Masonry construction – materials andworkmanship. SNZ, Wellington, New Zealand.
Standards New Zealand. 2004. NZS 1170.5 Part 5 Earthquake actions – New Zealand . SNZ,Wellington, New Zealand.
Thurston SJ and Beattie GJ. 2009. Seismic Resistance of Brick Veneer Under Face Loading . AEES Conference, Newcastle, UK.
Thurston SJ and Beattie GJ. 2011. „Seismic Resistance of Brick Veneer Under FaceLoading‟. BRANZ Study Report 216 . BRANZ Ltd, Judgeford, New Zealand.

7/24/2019 SR258 - Critical Properties of Mortar
http://slidepdf.com/reader/full/sr258-critical-properties-of-mortar 88/89

7/24/2019 SR258 - Critical Properties of Mortar
http://slidepdf.com/reader/full/sr258-critical-properties-of-mortar 89/89
Figure 46. Initial portion of acceleration excitation record