Embed Size (px)
Citation preview

SR-91 CORRIDOR OPERATIONS PROJECT UPDATE
Western Riverside County
Programs and Projects Committee Meeting
November 26, 2018
David Thomas, Toll Project Manager
1
SR-91 Corridor Operations Project Update
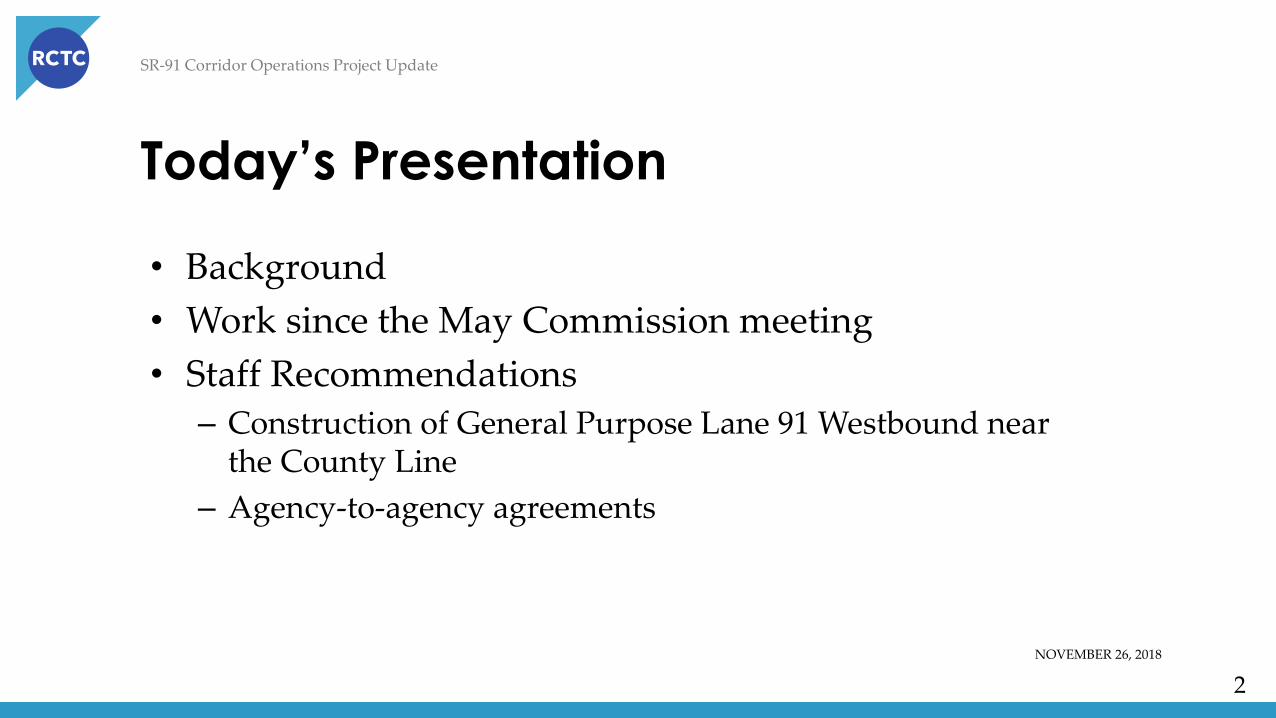
Today’s Presentation
NOVEMBER 26, 2018
2
• Background
• Work since the May Commission meeting
• Staff Recommendations
– Construction of General Purpose Lane 91 Westbound near the County Line
– Agency-to-agency agreements
SR-91 Corridor Operations Project Update
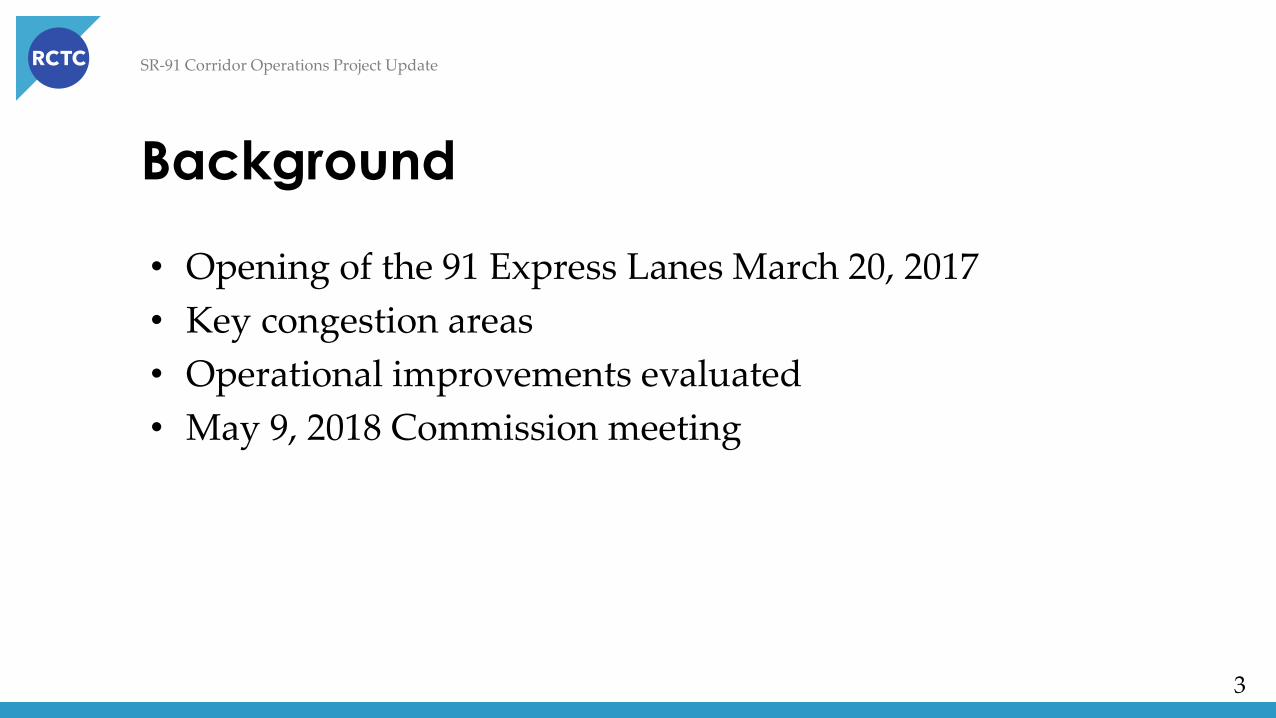
Background
3
• Opening of the 91 Express Lanes March 20, 2017
• Key congestion areas
• Operational improvements evaluated
• May 9, 2018 Commission meeting
SR-91 Corridor Operations Project Update
Work Performed Since May
4
• 91 Express Lanes entrance at I-15 Northbound
• Restriping 91 Westbound Express Lanes entrance/exit near the County Line
• Green River Road Ramp Meter Study
• Environmental and Design of General Purpose Lane 91 Westbound near the County Line

SR-91 Corridor Operations Project Update
91 Express Lanes entrance at I-15 Northbound
5
• Extend express lane entrance south
• Implemented on September 16, 2018
• Reduces impact to General Purpose lanes from queuing in the 91 Express Lanes
I-15 NB EL Option 1
SR-91 Corridor Operations Project Update
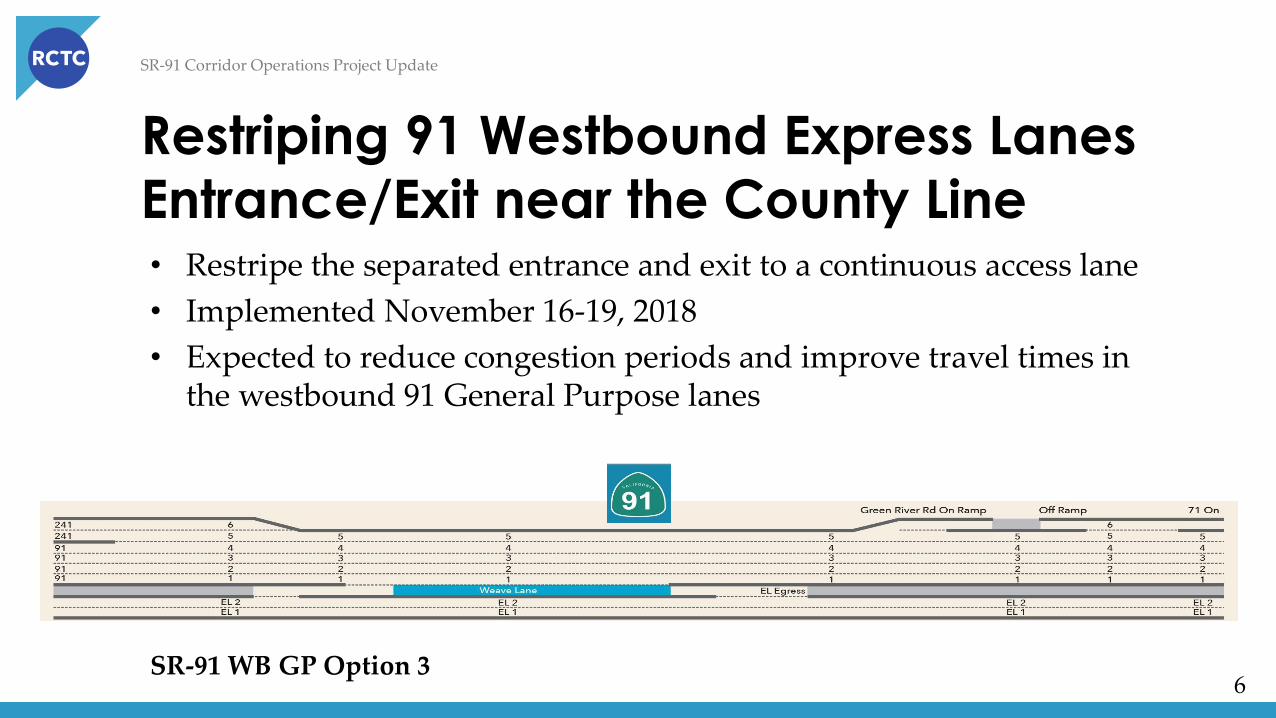
Restriping 91 Westbound Express Lanes
Entrance/Exit near the County Line
6
• Restripe the separated entrance and exit to a continuous access lane
• Implemented November 16-19, 2018
• Expected to reduce congestion periods and improve travel times in the westbound 91 General Purpose lanes
SR-91 WB GP Option 3
7
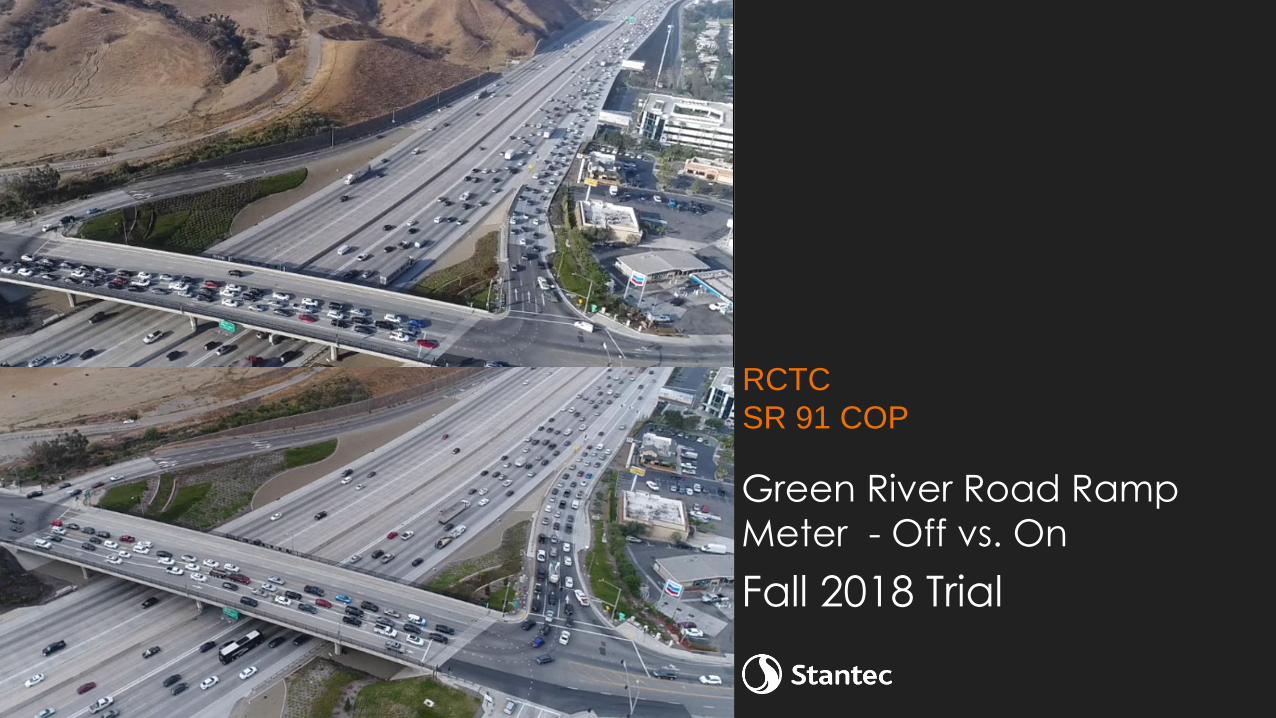
RCTC
SR 91 COP
Green River Road Ramp
Meter - Off vs. On
Fall 2018 Trial
8
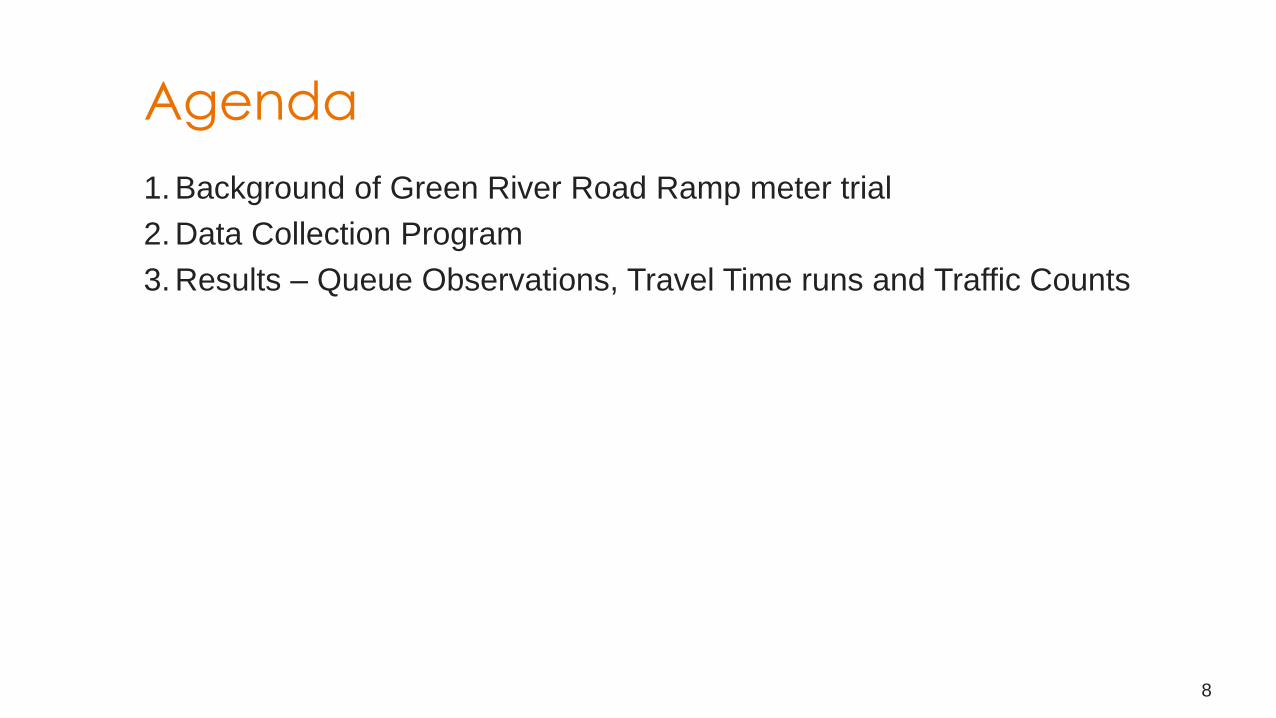
Agenda
1. Background of Green River Road Ramp meter trial
2. Data Collection Program
3. Results – Queue Observations, Travel Time runs and Traffic Counts
9
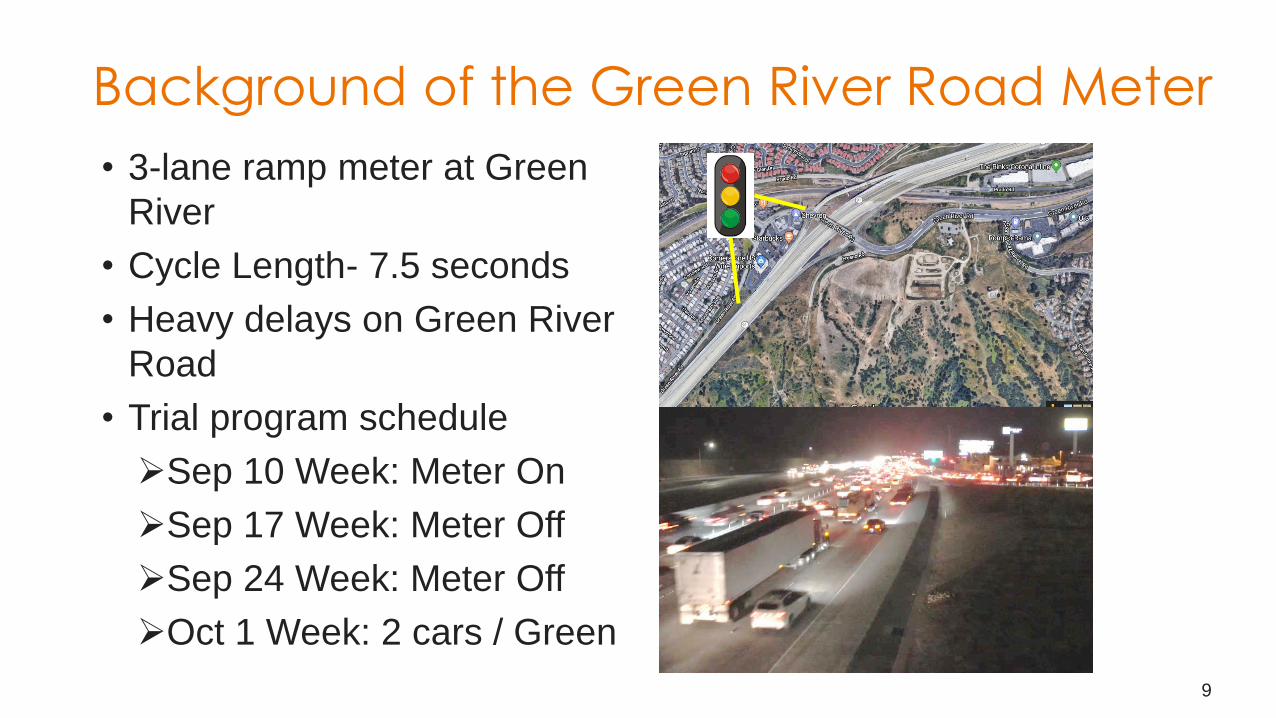
Background of the Green River Road Meter
• 3-lane ramp meter at Green
River
• Cycle Length- 7.5 seconds
• Heavy delays on Green River
Road
• Trial program schedule
Sep 10 Week: Meter On
Sep 17 Week: Meter Off
Sep 24 Week: Meter Off
Oct 1 Week: 2 cars / Green

10
Monitor Traffic Conditions before and afterTravel Time Runs
• Travel time runs on Green River Road and SR 91 (3 days/ week)
• Traffic counts on SR 91 and Green River Road

11
Monitor Traffic Conditions before and afterVideo Camera Observations
• Drone observation every Tuesday
• Fixed position cameras:
o Green River Road at Fresno Road and Dominguez Ranch Rd
o SR 91 at Main Street
o Green River Road on Ramp

12
Drone Observation: Points of Reference
Ramps to SR91
Eastbound
Fresno Rd
Dominguez Ranch Rd
Nicholas Pl
Palisades Dr
(~ 1 mile)

13
Drone Observation at On-Ramp: 6:45 AM
METER OFF: Sep 25
METER ON: Sep 11 METER OFF: Sep 18
2 cars / green: Oct 2
14
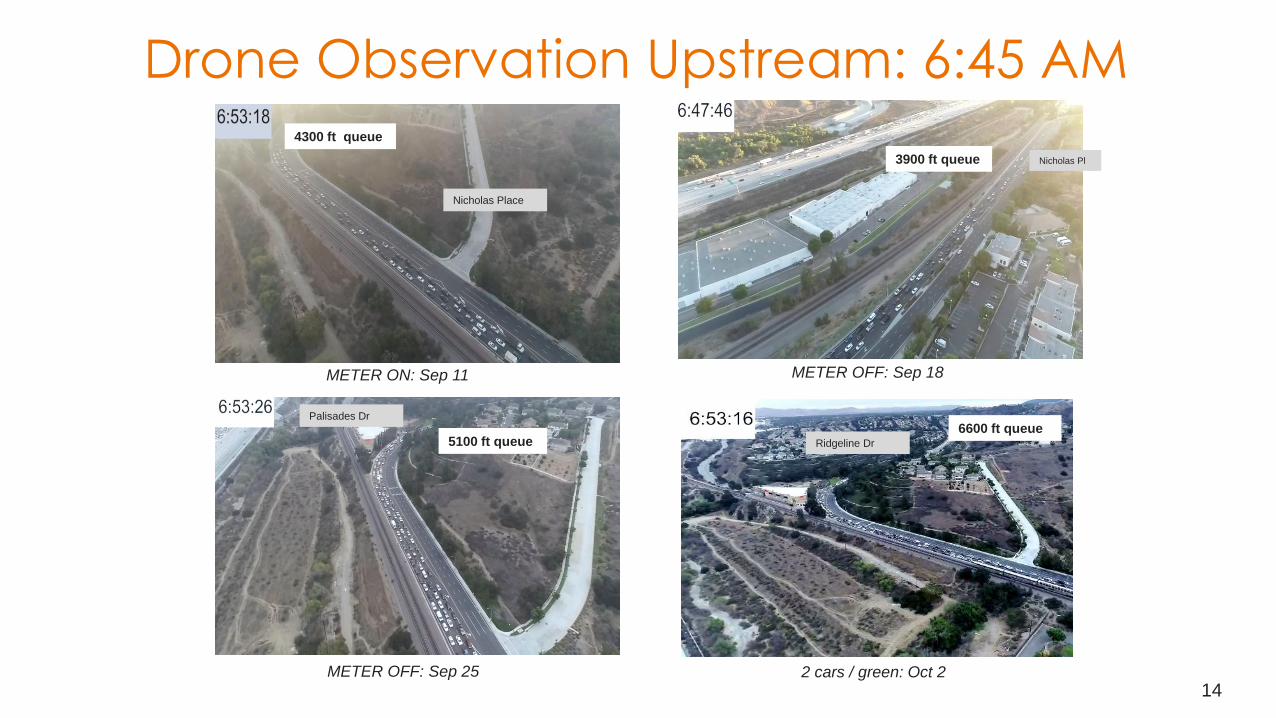
Drone Observation Upstream: 6:45 AM
METER OFF: Sep 25
METER ON: Sep 11 METER OFF: Sep 18
4300 ft queue
5100 ft queue
Nicholas Place
3900 ft queue Nicholas Pl
Palisades Dr
Ridgeline Dr
2 cars / green: Oct 2
6600 ft queue
15
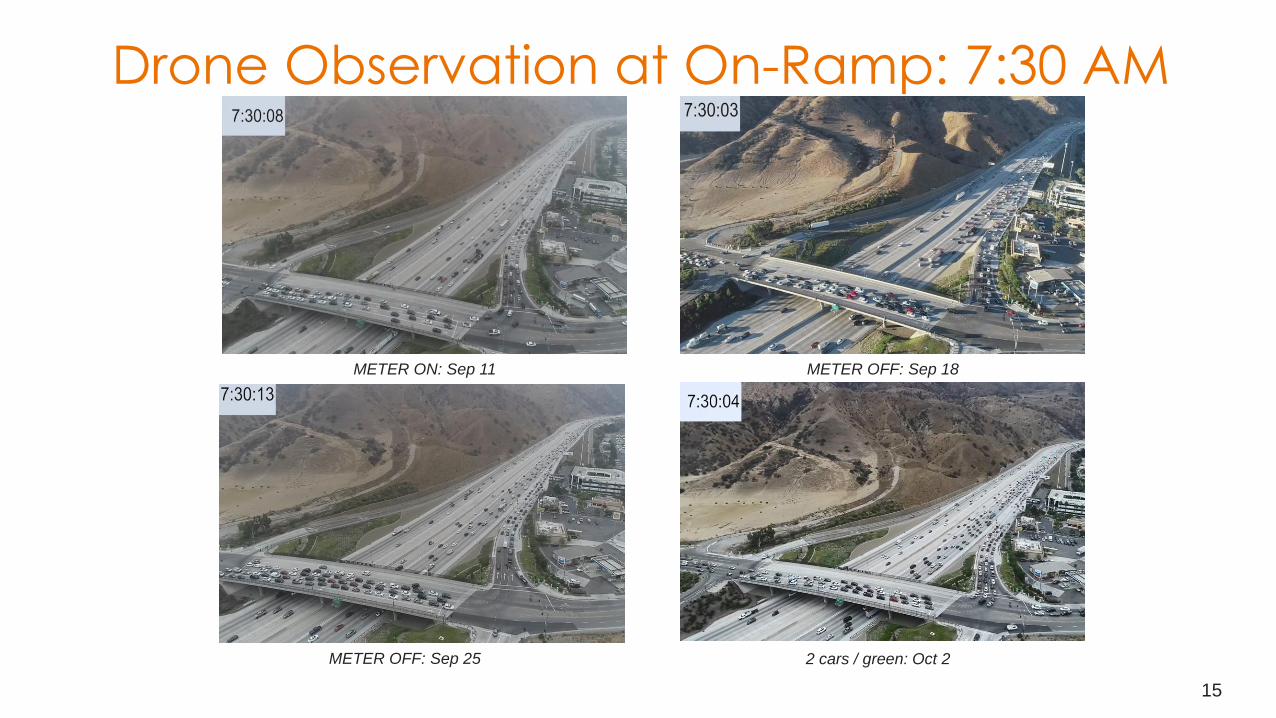
Drone Observation at On-Ramp: 7:30 AM
METER OFF: Sep 25
METER ON: Sep 11 METER OFF: Sep 18
2 cars / green: Oct 2

16
Drone Observation Upstream: 7:30 AM
METER ON: Sep. 11 METER OFF: Sep 18
METER OFF: Sep 25
Dominguez
Ranch Road
Dominguez
Ranch Road
2350 ft queue
Dominguez
Ranch Road
2350 ft queue
2150 ft queue
2 cars / green: Oct 2
Palisades Dr.
5100 ft queue

17
Week 4: 2 cars per green
• Portable message signs were placed at two locations, before and after meter
18
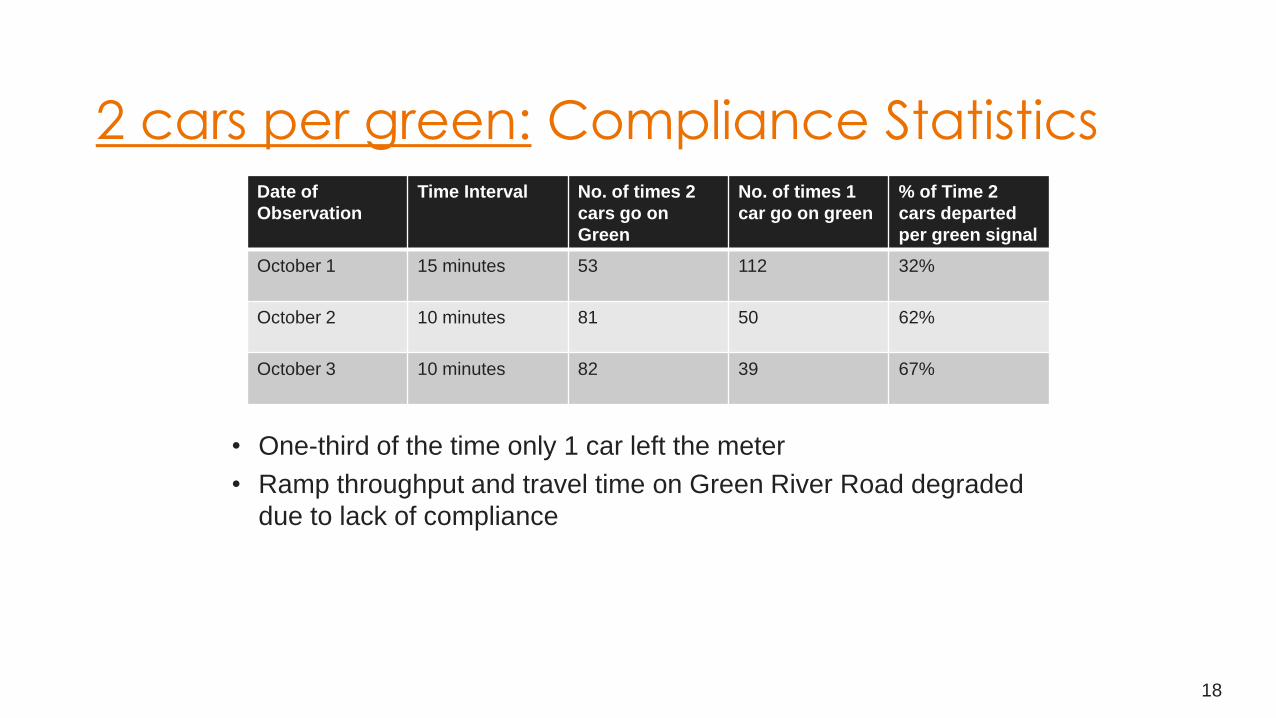
2 cars per green: Compliance Statistics
• One-third of the time only 1 car left the meter
• Ramp throughput and travel time on Green River Road degraded
due to lack of compliance
Date of
Observation
Time Interval No. of times 2
cars go on
Green
No. of times 1
car go on green
% of Time 2
cars departed
per green signal
October 1 15 minutes 53 112 32%
October 2 10 minutes 81 50 62%
October 3 10 minutes 82 39 67%
19
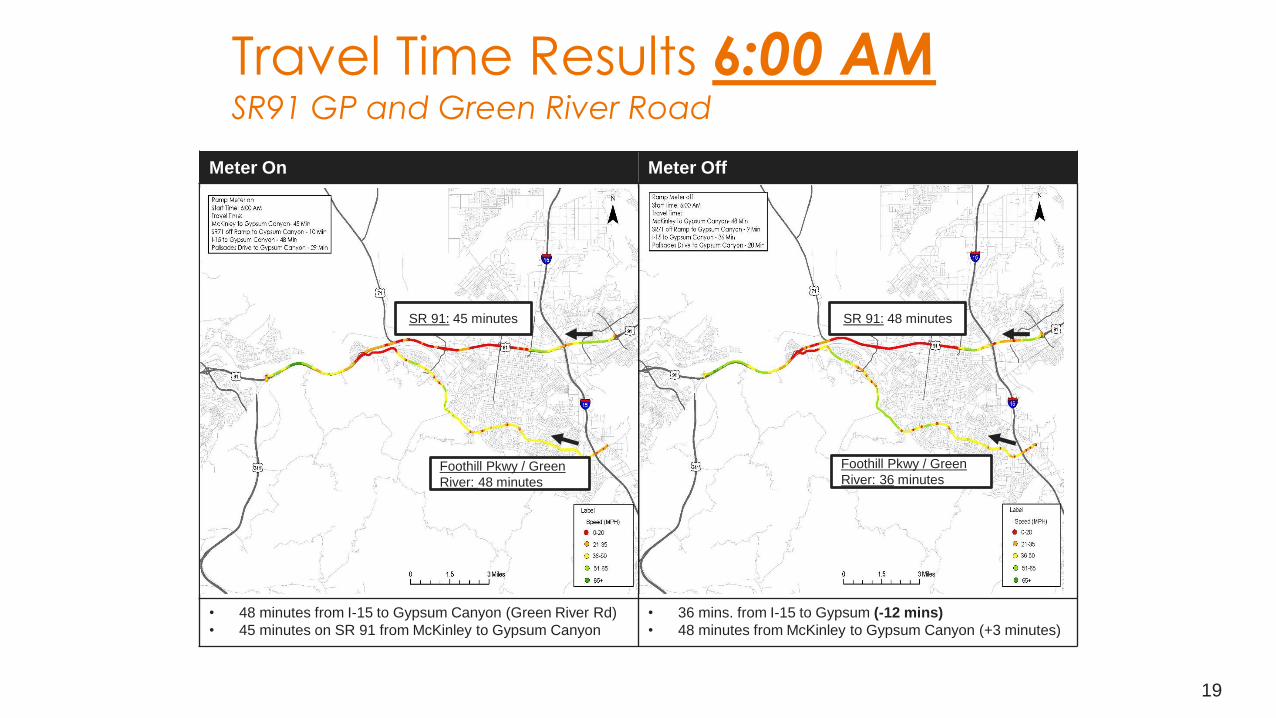
Travel Time Results 6:00 AMSR91 GP and Green River Road
Meter On Meter Off
• 48 minutes from I-15 to Gypsum Canyon (Green River Rd)
• 45 minutes on SR 91 from McKinley to Gypsum Canyon
• 36 mins. from I-15 to Gypsum (-12 mins)
• 48 minutes from McKinley to Gypsum Canyon (+3 minutes)
Foothill Pkwy / Green
River: 48 minutes
SR 91: 45 minutes SR 91: 48 minutes
Foothill Pkwy / Green
River: 36 minutes

20
Travel Time Impact: Green River Road and SR 91
• 9 to 11 minute decrease in average Travel Time on Green River Road from 6-8 AM
when meter is off
• 2 to 3 minute increase in travel time on SR 91 from 5-7 AM
• Factor in the amount of traffic - total increase of 270 vehicle-hours of delay
22
39
47
40
31
2326
42
49
40
31
24
0
10
20
30
40
50
60
4 - 5 AM 5 - 6 AM 6 - 7 AM 7 - 8 AM 8 - 9 AM 9 - 10 AM
SR 91: McKinley St to 91 at Gypsum Canyon Road (11.4 miles)
Meter On Meter Off
22
34
4648
30
2525
32
37 37
31
27
0
10
20
30
40
50
60
4 - 5 AM 5 - 6 AM 6 - 7 AM 7 - 8 AM 8 - 9 AM 9 - 10 AM
Min
ute
s
Foothill Pkwy / Green River Rd: I-15 to 91 at Gypsum Canyon Road (13.1 miles)
Meter On Meter off
21
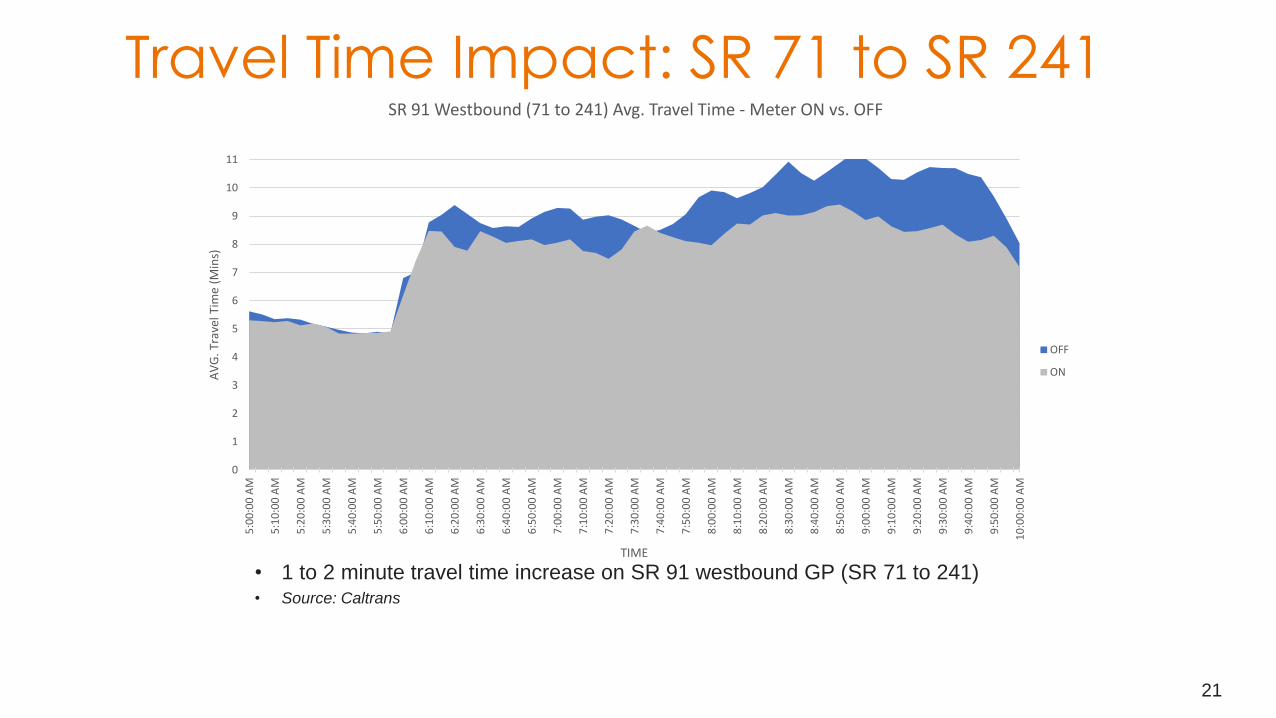
Travel Time Impact: SR 71 to SR 241
0
1
2
3
4
5
6
7
8
9
10
11
5:0
0:0
0 A
M
5:1
0:0
0 A
M
5:2
0:0
0 A
M
5:3
0:0
0 A
M
5:4
0:0
0 A
M
5:5
0:0
0 A
M
6:0
0:0
0 A
M
6:1
0:0
0 A
M
6:2
0:0
0 A
M
6:3
0:0
0 A
M
6:4
0:0
0 A
M
6:5
0:0
0 A
M
7:0
0:0
0 A
M
7:1
0:0
0 A
M
7:2
0:0
0 A
M
7:3
0:0
0 A
M
7:4
0:0
0 A
M
7:5
0:0
0 A
M
8:0
0:0
0 A
M
8:1
0:0
0 A
M
8:2
0:0
0 A
M
8:3
0:0
0 A
M
8:4
0:0
0 A
M
8:5
0:0
0 A
M
9:0
0:0
0 A
M
9:1
0:0
0 A
M
9:2
0:0
0 A
M
9:3
0:0
0 A
M
9:4
0:0
0 A
M
9:5
0:0
0 A
M
10
:00
:00
AM
AV
G. T
rave
l Tim
e (M
ins)
TIME
SR 91 Westbound (71 to 241) Avg. Travel Time - Meter ON vs. OFF
OFF
ON
• 1 to 2 minute travel time increase on SR 91 westbound GP (SR 71 to 241)• Source: Caltrans
22
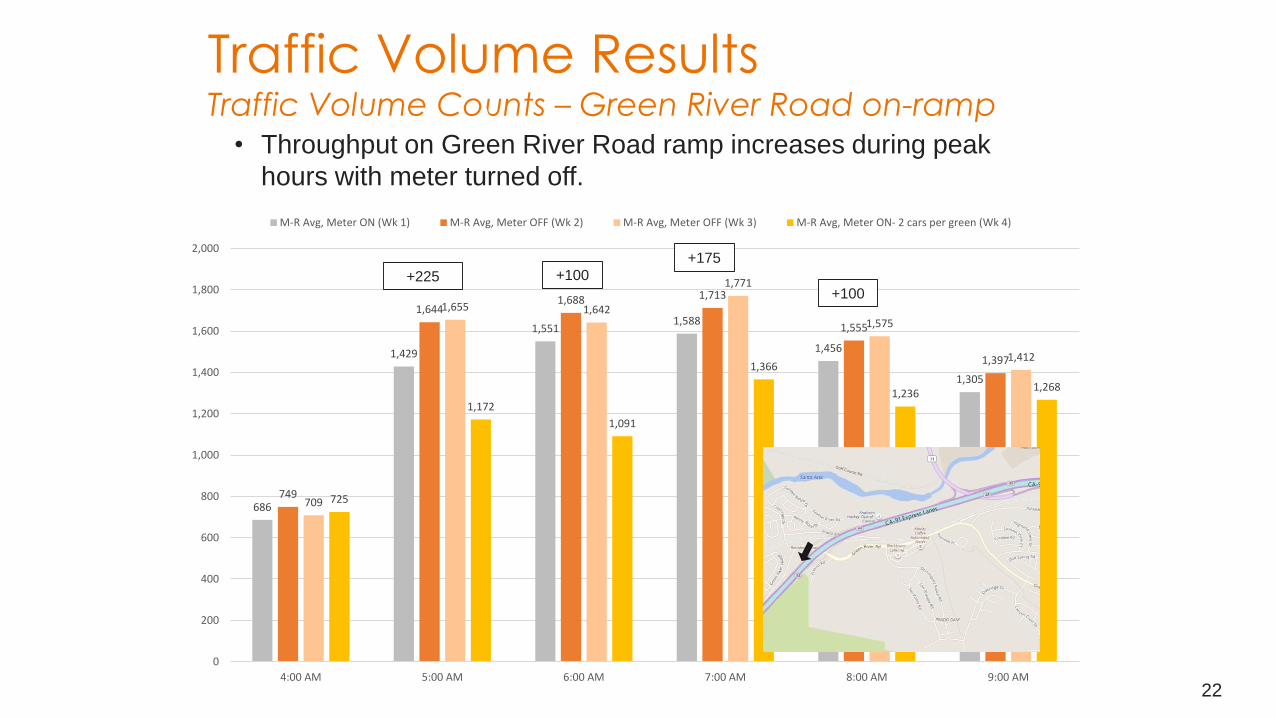
Traffic Volume ResultsTraffic Volume Counts – Green River Road on-ramp
• Throughput on Green River Road ramp increases during peak
hours with meter turned off.
686
1,429
1,5511,588
1,456
1,305
749
1,6441,688 1,713
1,555
1,397
709
1,655 1,642
1,771
1,575
1,412
725
1,172
1,091
1,366
1,2361,268
0
200
400
600
800
1,000
1,200
1,400
1,600
1,800
2,000
4:00 AM 5:00 AM 6:00 AM 7:00 AM 8:00 AM 9:00 AM
M-R Avg, Meter ON (Wk 1) M-R Avg, Meter OFF (Wk 2) M-R Avg, Meter OFF (Wk 3) M-R Avg, Meter ON- 2 cars per green (Wk 4)
+225 +100
+175
+100
23
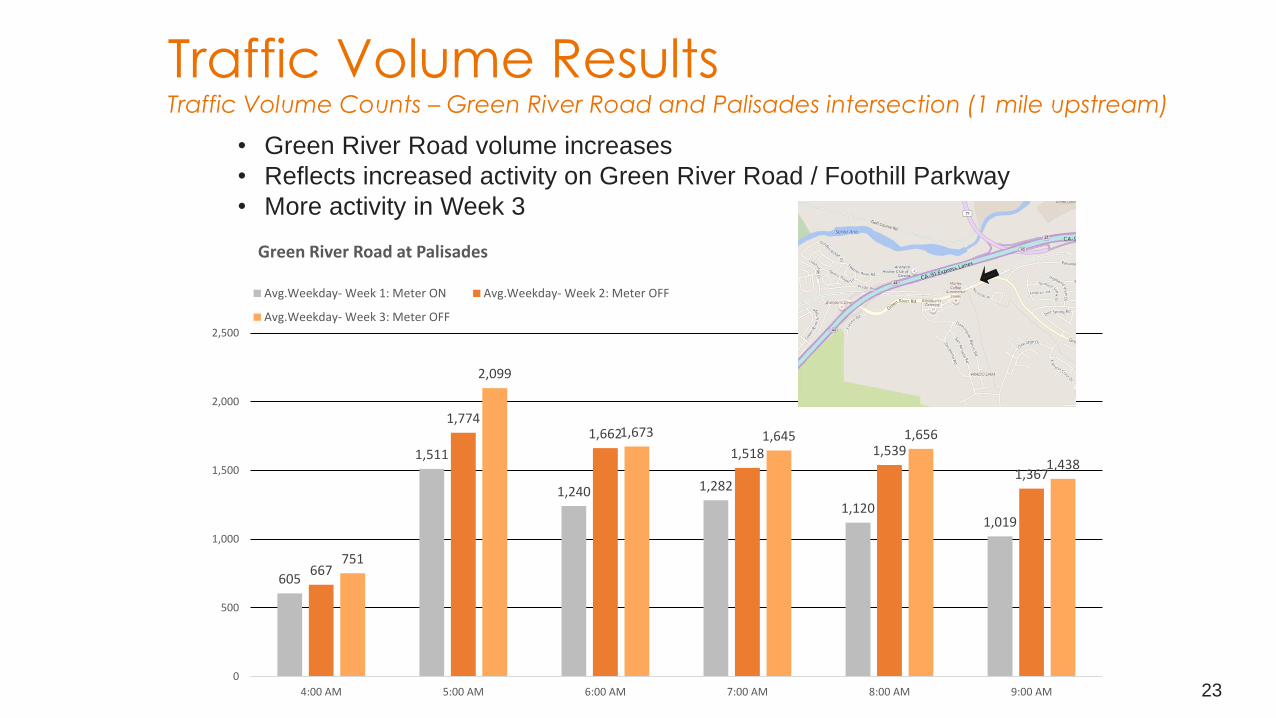
Traffic Volume ResultsTraffic Volume Counts – Green River Road and Palisades intersection (1 mile upstream)
• Green River Road volume increases
• Reflects increased activity on Green River Road / Foothill Parkway
• More activity in Week 3
605
1,511
1,240 1,282
1,1201,019
667
1,7741,662
1,518 1,539
1,367
751
2,099
1,673 1,645 1,656
1,438
0
500
1,000
1,500
2,000
2,500
4:00 AM 5:00 AM 6:00 AM 7:00 AM 8:00 AM 9:00 AM
Green River Road at Palisades
Avg.Weekday- Week 1: Meter ON Avg.Weekday- Week 2: Meter OFF
Avg.Weekday- Week 3: Meter OFF
24
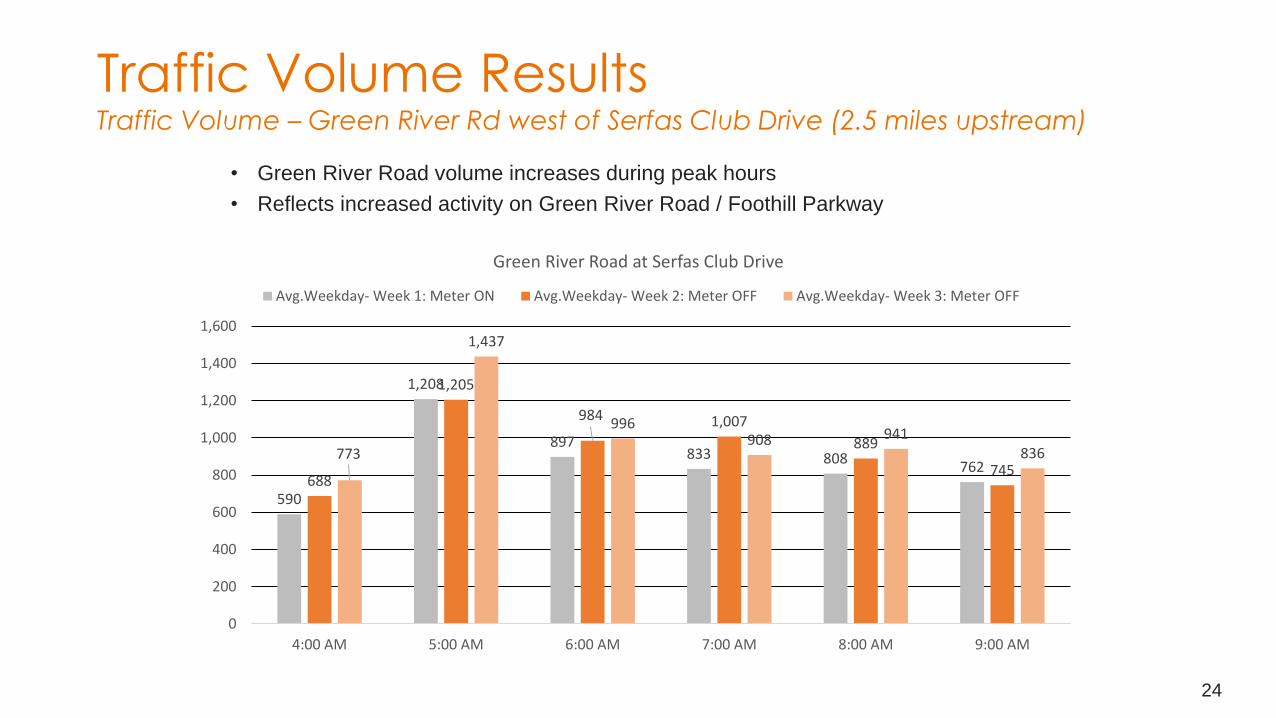
Traffic Volume ResultsTraffic Volume – Green River Rd west of Serfas Club Drive (2.5 miles upstream)
• Green River Road volume increases during peak hours
• Reflects increased activity on Green River Road / Foothill Parkway
590
1,208
897833 808
762688
1,205
984 1,007
889
745773
1,437
996908 941
836
0
200
400
600
800
1,000
1,200
1,400
1,600
4:00 AM 5:00 AM 6:00 AM 7:00 AM 8:00 AM 9:00 AM
Green River Road at Serfas Club Drive
Avg.Weekday- Week 1: Meter ON Avg.Weekday- Week 2: Meter OFF Avg.Weekday- Week 3: Meter OFF
25
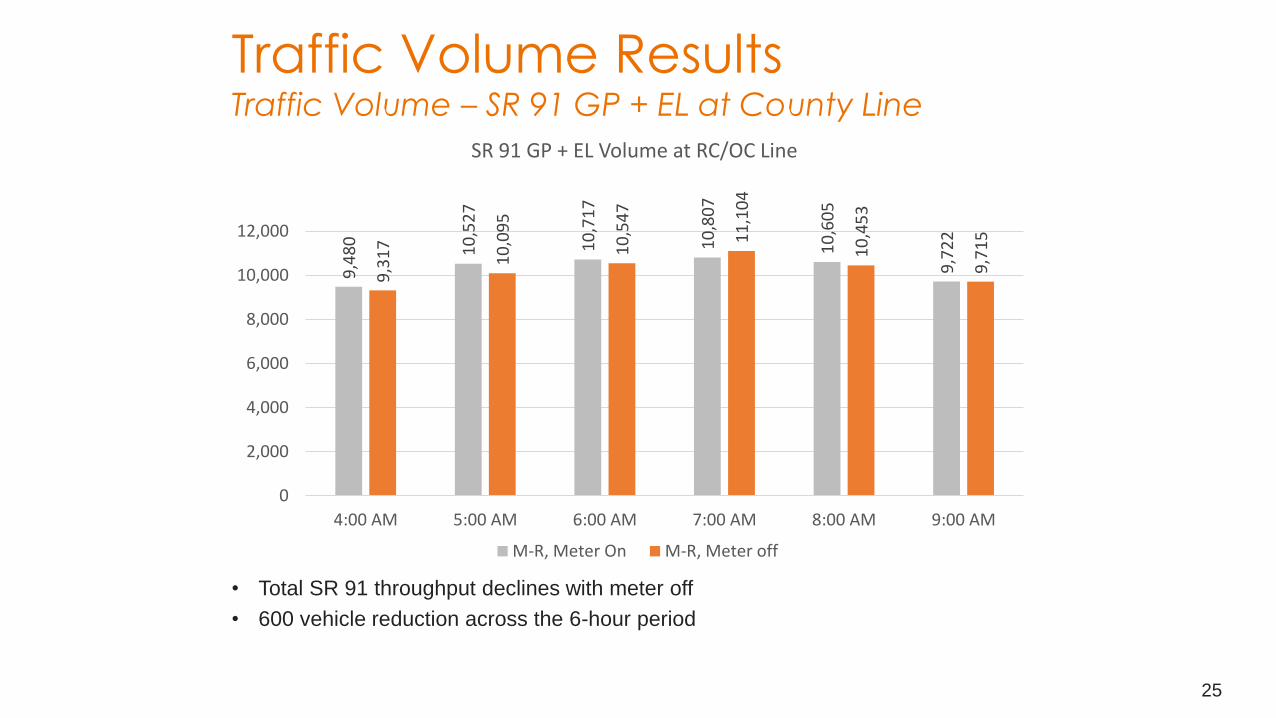
Traffic Volume ResultsTraffic Volume – SR 91 GP + EL at County Line
• Total SR 91 throughput declines with meter off
• 600 vehicle reduction across the 6-hour period
9,4
80
10
,52
7
10
,71
7
10
,80
7
10
,60
5
9,7
22
9,3
17
10
,09
5
10
,54
7
11
,10
4
10
,45
3
9,7
15
0
2,000
4,000
6,000
8,000
10,000
12,000
4:00 AM 5:00 AM 6:00 AM 7:00 AM 8:00 AM 9:00 AM
SR 91 GP + EL Volume at RC/OC Line
M-R, Meter On M-R, Meter off

26
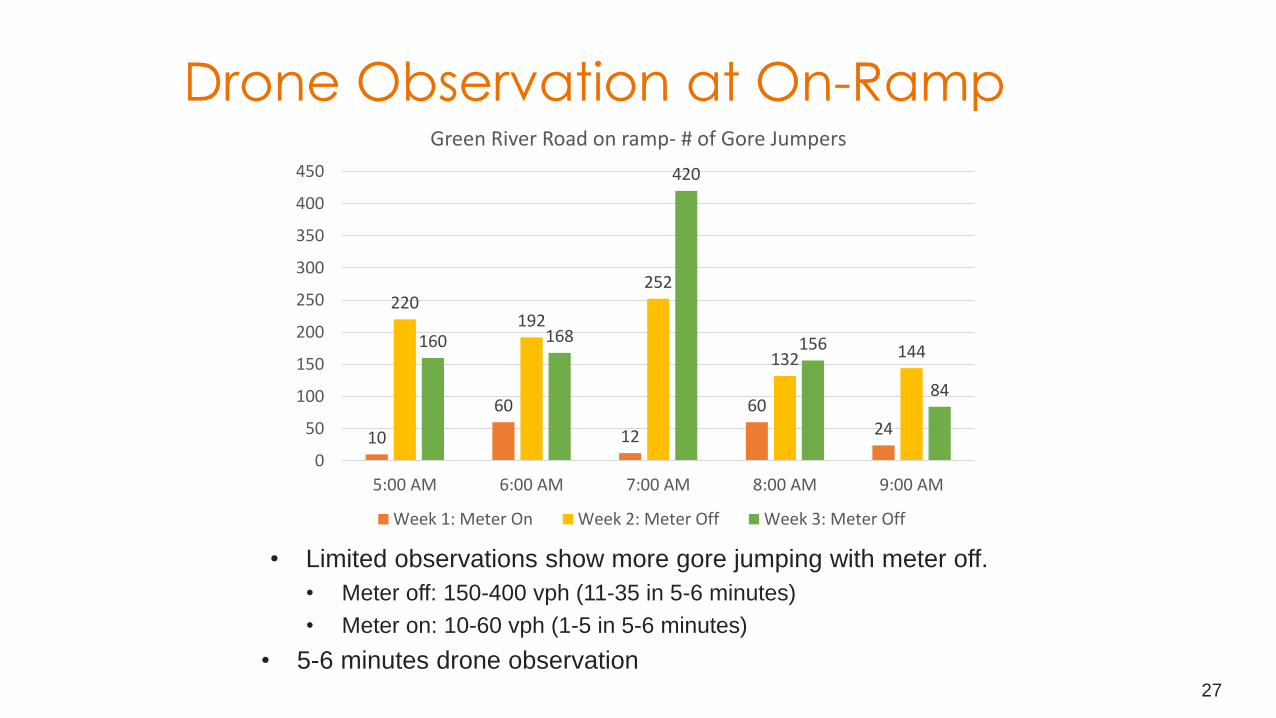
Drone Observation at On-Ramp: Gore Jumpers
27
Drone Observation at On-Ramp
• Limited observations show more gore jumping with meter off.
• Meter off: 150-400 vph (11-35 in 5-6 minutes)
• Meter on: 10-60 vph (1-5 in 5-6 minutes)
• 5-6 minutes drone observation
10
60
12
6024
220192
252
132 144160 168
420
156
84
0
50
100
150
200
250
300
350
400
450
5:00 AM 6:00 AM 7:00 AM 8:00 AM 9:00 AM
Green River Road on ramp- # of Gore Jumpers
Week 1: Meter On Week 2: Meter Off Week 3: Meter Off

28
Summary of FindingsTravel Time
(91 GP)
Travel Time
(Green
River Road)
CL
Throughput
Green River
Road
Demand
Gore
Jumpers
Change with
meter off
+1-3 mins - 5 to 10
mins
- 600 vehicle
total
reduction
+100 to +200
vph
200 vph
Base Case 40-50
minutes
base
35-50
minutes
base
11,000 vph 1,500 vph 30 vph
• Improvement on Green River Road coupled with more traffic.
• Degradation along 91
• Net change in delay 270 vehicle-hours
• Increase in “gore jumping”
SR-91 Corridor Operations Project Update
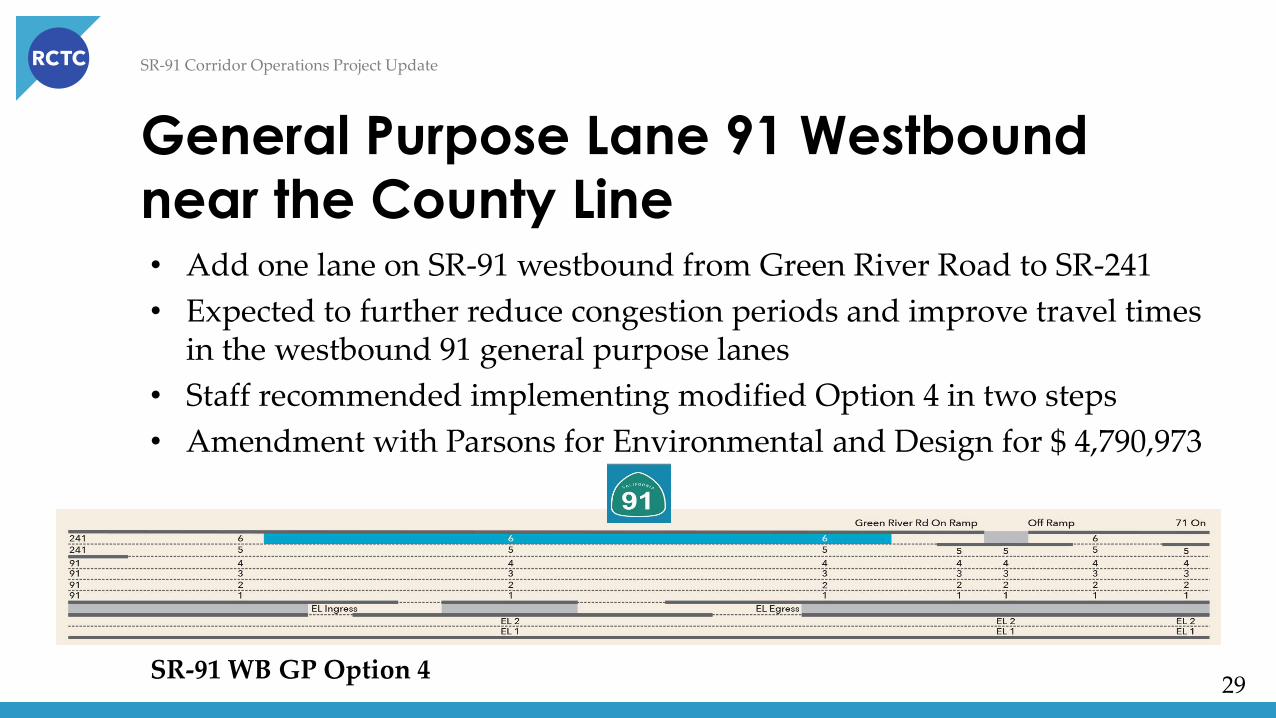
General Purpose Lane 91 Westbound
near the County Line
29
• Add one lane on SR-91 westbound from Green River Road to SR-241
• Expected to further reduce congestion periods and improve travel times in the westbound 91 general purpose lanes
• Staff recommended implementing modified Option 4 in two steps
• Amendment with Parsons for Environmental and Design for $ 4,790,973
SR-91 WB GP Option 4

SR-91 Corridor Operations Project Update
General Purpose Lane 91 Westbound near
the County Line – Toll Revenue Impacts
30
Year Baseline Revenue 91 WB Option 4M Revenue
Revenue Loss
2022 $ 57,250,000 $ 49,730,000 $ 7,520,000
2023 62,250,000 54,070,000 8,180,000
2024 67,690,000 58,790,000 8,900,000
2025 73,600,000 63,930,000 9,670,000
2026 79,240,000 68,840,000 10,400,000
2027 84,550,000 73,460,000 11,090,000
2028 90,200,000 78,390,000 11,810,000
2029 96,240,000 83,650,000 12,590,000
2030 102,690,000 89,270,000 13,420,000
2031 109,560,000 95,270,000 14,290,000
2032 116,890,000 101,660,000 15,230,000
2033 124,710,000 108,490,000 16,220,000
2034 133,060,000 115,770,000 17,290,000
2035 134,580,000 125,660,000 8,920,000
Total $ 165,530,000
SR-91 Corridor Operations Project Update
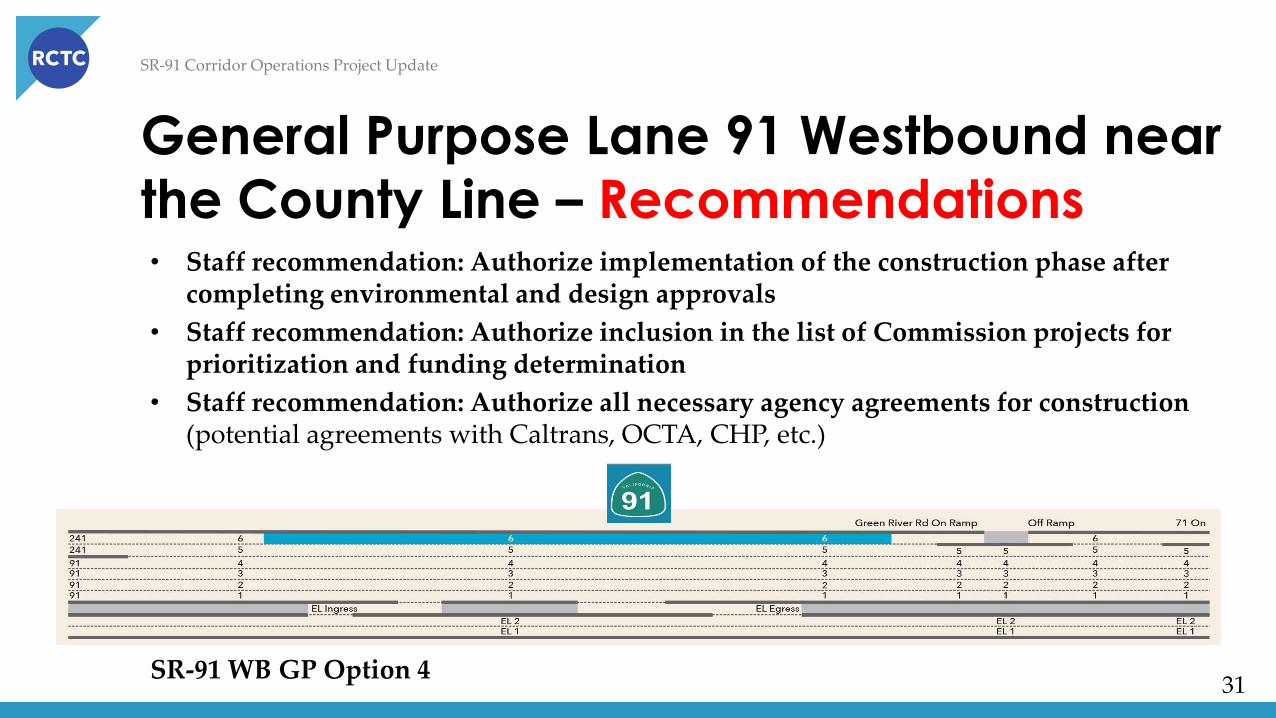
General Purpose Lane 91 Westbound near
the County Line – Recommendations
31
• Staff recommendation: Authorize implementation of the construction phase after completing environmental and design approvals
• Staff recommendation: Authorize inclusion in the list of Commission projects for prioritization and funding determination
• Staff recommendation: Authorize all necessary agency agreements for construction (potential agreements with Caltrans, OCTA, CHP, etc.)
SR-91 WB GP Option 4

THANK YOU
32