Embed Size (px)
Citation preview
Accepted Manuscript
Squandering Australia’s Food Security— the Environmental and Economic Costs ofour Unhealthy Diet and the Policy Path We’re On
Graham M. Turner, Kirsten A. Larsen, Seona Candy, Sue Ogilvy, JaithriAnanthapavan, Marj Moodie, Sarah James, Sharon Friel, Chris J. Ryana, Mark A.Lawrence
PII: S0959-6526(17)31500-7
DOI: 10.1016/j.jclepro.2017.07.072
Reference: JCLP 10074
To appear in: Journal of Cleaner Production
Please cite this article as: Graham M. Turner, Kirsten A. Larsen, Seona Candy, Sue Ogilvy, JaithriAnanthapavan, Marj Moodie, Sarah James, Sharon Friel, Chris J. Ryana, Mark A. Lawrence,Squandering Australia's Food Security— the Environmental and Economic Costs of our Unhealthy Dietand the Policy Path We're On, Journal of Cleaner Production (2017), doi: 10.1016/j.jclepro.2017.07.072
This is a PDF file of an unedited manuscript that has been accepted for publication. As a service toour customers we are providing this early version of the manuscript. The manuscript will undergocopyediting, typesetting, and review of the resulting proof before it is published in its final form. Pleasenote that during the production process errors may be discovered which could affect the content, and alllegal disclaimers that apply to the journal pertain.
MANUSCRIP
T
ACCEPTED
ACCEPTED MANUSCRIPT
1
SquanderingAustralia’sFoodSecurity—
theEnvironmentalandEconomicCostsofourUnhealthyDiet
andthePolicyPathWe’reOn
Authors:
Graham M. Turnera, Kirsten A. Larsena, Seona Candya, , Sue Ogilvyb, Jaithri Ananthapavanc, Marj
Moodiec, Sarah Jamesd, Sharon Frield, Chris J. Ryana, Mark A. Lawrencee
Corresponding author: Seona Candy, [email protected]
Contact details:
a) Victorian Eco-Innovation Lab, School of Architecture Building and Planning, University of
Melbourne
b) Fenner School of Environment and Society, Australian National University
c) Deakin Health Economics, Faculty of Health, Deakin University
d) Regulatory Institutions Network, College of Asia and the Pacific, The Australian National University
e) Institute for Physical Activity and Nutrition (IPAN), Faculty of Health, Deakin University
Abstract
While historically Australia has been a major exporter of food commodities and is generally
considered to be “food secure”, our inter-disciplinary modelling of Australia’s food system and
contemporary diet demonstrates that Australia is likely to become a net importer of key nutritious
foods such as nuts and dairy if it continues along its current policy path. Furthermore, this occurs in
the context of accelerating international debt, complete dependence on imported oil and declines in
Gross Domestic Product per capita. Coupled with no reduction in greenhouse gas emissions, and
increasing water deficits around many capital cities, these factors indicate increasing threats to
Australia’s food security. These strategic challenges arise from past and current policy choices and
trends, including continued consumption of an unhealthy diet. Their effects are modelled for the
coming decades using an innovative scenario simulation based on comprehensive accounts of
physical processes in Australia’s economy simulated in the Australian Stocks and Flows Framework.
Our analysis further employed health and economic cost modelling based on burden of disease data,
conservatively demonstrating that productivity and health costs of unhealthy diets would be at least
three billion Australian dollars for the 2025 Australian population if we were to continue on this
trajectory.
Keywords
Food security, climate change, policy, scenario modelling, economy, dietary pattern, health,
nutrition
Highlights
MANUSCRIP
T
ACCEPTED
ACCEPTED MANUSCRIPT
2
• Inter-disciplinary scenario modelling of Australia’s food system and diet indicates that
current policies mean Australia may become a net importer of key nutritious foods such as
nuts, fish and dairy.
• Environmental, economic and resource issues will worsen, and increasingly threaten
Australia’s future food security.
• Health and economic cost modelling show that productivity and health costs of unhealthy
diets will be significant, at least three billion dollars in 2025.
Acknowledgements
Lawrence, Ryan, Friel, Turner, Larsen, Ogilvy, Moodie, Candy, James and Ananthapavan are
researchers within an Australian Research Council Linkage Project, ‘Modelling policy interventions to
protect Australia's food security in the face of environmental sustainability challenges’
(LP120100168). Lawrence, Moodie and Ananthapavan are researchers within a NHMRC Centre
for Research Excellence in Obesity Policy and Food Systems (APP1041020). Turner was a Senior
Research Fellow in the Melbourne Sustainable Society Institute. The authors would like to
particularly acknowledge the technical guidance of whatIf? Technologies® who are the originators of
the software used in the modelling, and the valuable contribution by Kate Wingrove to the final
editing of the manuscript. The authors would also like to thank several anonymous reviewers for
improvements to the manuscript.
MANUSCRIP
T
ACCEPTED
ACCEPTED MANUSCRIPT
3
1. Introduction Food security is recognised as a significant global problem and considerable research has focussed
on addressing the question of how to produce enough food to feed a growing population with finite
resources and also mitigate and adapt to climate change (Cassidy et al., 2013; Godfray et al., 2010a;
Smith et al., 2013). Australia is currently considered to be food secure—domestic production of most
major food groups equals or exceeds domestic consumption; Australian farmers produce the
equivalent of 90% of daily domestic food supply and export enough to feed an additional 40 million
people (DAFF, 2013).
Global concern around the future of food is intensifying (Coates, 2013; FAO, 2015a; IPRI, 2015;
Lawrence G et al., 2013; Millar and Roots, 2012), with evidence mounting of the impacts of climate
change, water scarcity and energy costs (for example) on food production, alongside continued
urbanisation and degradation of agricultural land (Cadilhac et al., 2011b; Ceccarelli et al., 2010).
Increasing incidences of ‘food shocks’ are occurring as declining energy stocks and fiscal measures
and political or trade agreements reduce access to food or viability of farming for significant global
populations (anon, 2006; Suweis et al., 2015). These and other factors are driving civil disturbance
and unrest worldwide, with the largest movements of migrants and refugees since World War II. This
may be just the beginning, with the real impacts of climate, water, food and economic
destabilisation still to come (ABS, 2006; Suweis et al., 2015). While some nations, like China and the
United Arab Emirates, have clear intentions and actions underway to secure future food supplies for
their populations, many others—like Australia—have an assumed ongoing surplus and a strong faith
in the market economy to secure any additional stocks required. Further, the common political
narrative (Commonwealth of Australia, 2015a) sees Australia’s economic future continuing to come
from the land and its resources on which it has long depended.
However, increasing population, resource constraints (land, water, energy, fertilisers), climate
change impacts and growing greenhouse gas (GHG) emissions have implications for future Australian
food security, with evident global repercussions. Although Australia’s land area is substantial, only
6% is arable land suitable for intensive soil-based agriculture such as cropping and sown pasture
(ABARES, 2010). Most of this arable land is located on the coastal fringe of the continent, coinciding
with major urban centres and fossil fuel deposits. Since population increases are occurring mainly in
urban areas (ABS, 2013a), their expansion (ABS, 2008) often displaces highly productive agricultural
areas (R. Carey et al., 2016). Yields per hectare in Australia are also diminishing due to various
degradation processes (National Land and Water Resources Audit, 2001; PMSEIC, 2010). This will
intensify current dependence on imported and limited fossil fuel based fertilisers, making food
production increasingly vulnerable to shocks and stresses in the global economy.
The productivity of dry-land farming—which constitutes the majority of the Australian agricultural
sector—is likely to be negatively impacted by climate change (Gunasekera et al., 2007). Increasing
temperatures due to climate change will increase heat stress on crops and livestock, decreasing
productivity. At the same time, increased evaporation due to warmer conditions and potential
increased water demand from the mining and energy sector will reduce water availability for
irrigation on an already arid continent. Mitigation measures for climate change may also put further
pressure on agricultural land availability if the transfer of land from agriculture to forestry to offset
emissions or sequester carbon becomes necessary (Keating and Carberry, 2010). Due to these
MANUSCRIP
T
ACCEPTED
ACCEPTED MANUSCRIPT
4
pressures, tensions between food supply and demand are likely to occur, with implications for future
food security (Ramsey and Gallegos, 2011).
The critical issue of food production is only one aspect of food security, which also entails issues of
access, utilisation and affordability (Farmar-Bowers et al., 2012). A coherent understanding of these
issues requires a ‘food systems approach’ (Ingram, 2011), in which food system activities (namely
production, processing, packaging/distribution and consumption) mediate the bidirectional
relationship between environmental resources and public health nutrition status (Lawrence et al.,
2015). Greenhouse gas emissions, resource intensity and health concerns associated with the
prevalence of meat-based diets, now increasing significantly in developing countries, is a case in
point (Friel, 2010a). Unfortunately there is a general lack of research and scenarios exploring these
wider issues underpinning food security (Ericksen et al., 2009).
Instead, a narrow ‘production-volumes’ perspective is common, illustrated by recent Australian
government research and reports. Scenario modelling employed by the Australian Bureau of
Agricultural and Resource Economics and Sciences (ABARES) “…to investigate the possible response
of world food prices, food production and trade to the projected increase in demand” concluded
that increases in agricultural productivity and trade liberalisation were required (Linehan et al.,
2013). Although environmental outcomes were considered, the ABARES research focused heavily on
the economic value of food production and trade. The most recent Agriculture Productivity Report
(Commonwealth of Australia, 2015a) promotes an economically competitive production system with
sparse consideration of climate change, future resource constraints or other food system challenges.
The narrow perspective overlooks the economic value of a production system that promotes healthy
diets. Similarly, the National Food Plan (DAFF, 2013) was founded on expansion of production,
without adequate consideration of the impact of this on the health of the nation. A simplistic focus
on efficiency is also evident internationally in the FAO-UNEP Sustainable Food Systems Programme
(FAO, 2015b).
This contrasts with concerns that neo-liberal productivist approaches are proving incapable of
guaranteeing national food security (Lawrence et al., 2012). Earlier scenario modelling provided
insights on this, identifying tensions between the food required for a healthy diet for Australia’s
growing population and that which could be produced using traditional broad-acre agricultural
methods (Larsen et al., 2011; Turner et al., 2012). This work was mainly focused on the state of
Victoria, and explored the implications of three scenarios that diverged from the current state,
substantially in some cases. No scenario achieved comprehensive food security – scenarios resulted
in either significant imports of key foods, environmental deficits or economic problems.
This earlier research did not quantify health implications associated with the current unhealthy diet
(inconsistent with the recommended number and type of food group serves for population groups
as specified in the Australian Guide to Healthy Eating (reference) and the health and economic
benefits of shifting to a diet consistent with the Australian Dietary Guideline recommendations. In
Australia, the majority of the population are not consuming the recommended number of serves for
each of the five nutritious food groups while consuming 35% (adults) and 39% (children) of energy
from non-essential ‘discretionary foods’ (ABS, 2014). In addition, excessive dietary energy intake has
resulted in 63% of adults and 25% of children being overweight or obese (ABS, 2013b). These dietary
imbalances and excesses are linked to a wide range of non-communicable diseases which are a
MANUSCRIP
T
ACCEPTED
ACCEPTED MANUSCRIPT
5
leading cause of death and disability in Australia. Dietary risk factors are now the leading
contributors to the burden of disease in Australia contributing to over 500,000 Disability Adjusted
Life Years (DALYs) and approximately 36,000 deaths annually (Institute for Health Metrics and
Evaluation, 2015b, c). Since 1990, high body-mass index (BMI) has overtaken smoking and is now the
second highest ranking risk factor for disease burden, resulting in over 400,000 DALYs and over
18,000 deaths annually. Currently, over 18% of the total burden of disease in Australia is attributable
to these two preventable risk factors, namely poor diet and high BMI. (Institute for Health Metrics
and Evaluation, 2015a). In addition to the health impact of these modifiable risk factors, there is also
a significant economic impact on society as a result of lost productivity and health care costs.
In this paper, we improve on earlier food security analysis by modelling the food system with a
national coverage and incorporating economic costs of the current unhealthy diet. Our analysis also
differs from earlier scenario modelling that was based on divergent scenarios; here, we explore
near-term environmental and economic ramifications of ‘The Path We’re On’, incorporating
substantial detail on contemporary policy positions and resource exploitation trends, including
heavy reliance on fossil fuel use and mineral exports. An analysis of the current Australian diet
completes the scenario, thereby enabling an assessment of the Australian food system’s ability to
meet current demands.
We first outline the components of our analytic approach, which involves inter-disciplinary scenario
modelling, and subsequently summarise the assumptions and settings of ‘The Path We’re On’
scenario. While the scenario settings focus specifically on the 10-year period to 2025, the results
section typically presents simulation outcomes to 2040 in order to highlight impending
environmental, resource and economic issues. We discuss the interpretation of our results,
including factors such as sensitivity and reliability, and then present our conclusions – that
Australia’s food system is insecure when viewed in a whole-of-economy perspective.
2. Inter-disciplinary scenario modelling approach Food systems are complex socio-ecological entities (Lawrence and Worsley, 2007). Patterns of
consumption influence, and are influenced by, health, economic and environmental factors.
Analysing food systems requires a coherent assessment of the interactions between these factors,
and an awareness and incorporation of factors and patterns that cannot necessarily be forecast from
historical trends.
Scenario analysis, and later scenario modeling, have long been used by government planners,
corporate managers and military analysts as powerful tools to aid in decision making in the face of
uncertainty (Mietzner and Reger, 2005). Assessments of food systems are increasingly using scenario
modelling to explore multiple possible futures for food security (Reilly and Willenbockel, 2010), and,
by necessity, employ an interdisciplinary approach (Godfray et al., 2010b; Parry et al., 2004).
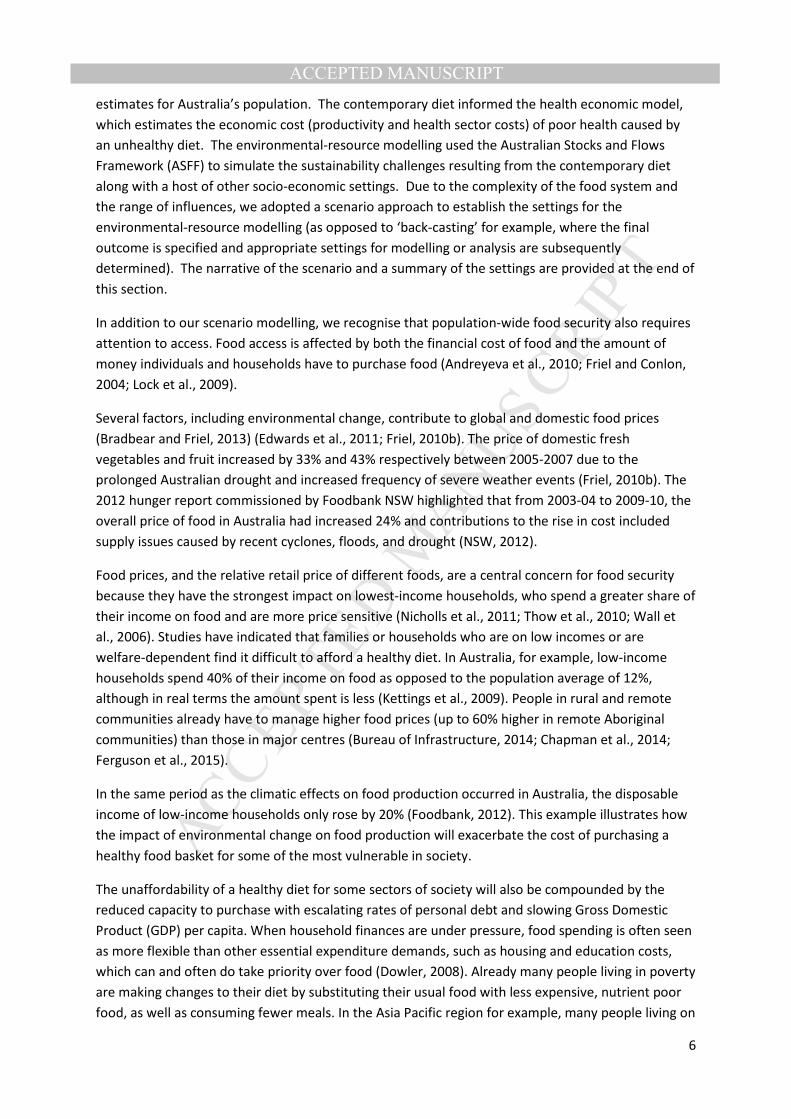
Our approach described below draws together the disciplines of nutrition science, economics and
system modelling. Dietary analysis, health economics modelling and environmental-resource
modelling were integrated to provide a multi-faceted perspective on food security (Figure 1). In
summary, dietary analysis determined the contemporary Australian diet profile by drawing on the
findings of a recent national nutrition and physical activity survey that included food consumption
MANUSCRIP
T
ACCEPTED
ACCEPTED MANUSCRIPT
6
estimates for Australia’s population. The contemporary diet informed the health economic model,
which estimates the economic cost (productivity and health sector costs) of poor health caused by
an unhealthy diet. The environmental-resource modelling used the Australian Stocks and Flows
Framework (ASFF) to simulate the sustainability challenges resulting from the contemporary diet
along with a host of other socio-economic settings. Due to the complexity of the food system and
the range of influences, we adopted a scenario approach to establish the settings for the
environmental-resource modelling (as opposed to ‘back-casting’ for example, where the final
outcome is specified and appropriate settings for modelling or analysis are subsequently
determined). The narrative of the scenario and a summary of the settings are provided at the end of
this section.
In addition to our scenario modelling, we recognise that population-wide food security also requires
attention to access. Food access is affected by both the financial cost of food and the amount of
money individuals and households have to purchase food (Andreyeva et al., 2010; Friel and Conlon,
2004; Lock et al., 2009).
Several factors, including environmental change, contribute to global and domestic food prices
(Bradbear and Friel, 2013) (Edwards et al., 2011; Friel, 2010b). The price of domestic fresh
vegetables and fruit increased by 33% and 43% respectively between 2005-2007 due to the
prolonged Australian drought and increased frequency of severe weather events (Friel, 2010b). The
2012 hunger report commissioned by Foodbank NSW highlighted that from 2003-04 to 2009-10, the
overall price of food in Australia had increased 24% and contributions to the rise in cost included
supply issues caused by recent cyclones, floods, and drought (NSW, 2012).
Food prices, and the relative retail price of different foods, are a central concern for food security
because they have the strongest impact on lowest-income households, who spend a greater share of
their income on food and are more price sensitive (Nicholls et al., 2011; Thow et al., 2010; Wall et
al., 2006). Studies have indicated that families or households who are on low incomes or are
welfare-dependent find it difficult to afford a healthy diet. In Australia, for example, low-income
households spend 40% of their income on food as opposed to the population average of 12%,
although in real terms the amount spent is less (Kettings et al., 2009). People in rural and remote
communities already have to manage higher food prices (up to 60% higher in remote Aboriginal
communities) than those in major centres (Bureau of Infrastructure, 2014; Chapman et al., 2014;
Ferguson et al., 2015).
In the same period as the climatic effects on food production occurred in Australia, the disposable
income of low-income households only rose by 20% (Foodbank, 2012). This example illustrates how
the impact of environmental change on food production will exacerbate the cost of purchasing a
healthy food basket for some of the most vulnerable in society.
The unaffordability of a healthy diet for some sectors of society will also be compounded by the
reduced capacity to purchase with escalating rates of personal debt and slowing Gross Domestic
Product (GDP) per capita. When household finances are under pressure, food spending is often seen
as more flexible than other essential expenditure demands, such as housing and education costs,
which can and often do take priority over food (Dowler, 2008). Already many people living in poverty
are making changes to their diet by substituting their usual food with less expensive, nutrient poor
food, as well as consuming fewer meals. In the Asia Pacific region for example, many people living on
MANUSCRIP
T
ACCEPTED
ACCEPTED MANUSCRIPT
7
less than USD 2 a day have cut out health and education and sold or eaten their livestock. Those
living on less than USD 1 a day have cut out protein and vegetables from their diet (ESCAP, 2009).
Figure 1 The three connected components of our analysis (blue boxes), and their inputs. The models used are the Risk
Factor Impact (RFI model), and the Australian Stocks and Flows Framework (ASFF).
2.1 Determining Australia’s contemporary diet profile for the ASFF
simulation
Diet profiles that represent current food consumption patterns in Australia were created from data
collected as part of the Australian Health Survey’s 2011-12 National Nutrition and Physical Activity
Survey (NNPAS) (ABS, 2013b). The NNPAS collected data on 24-hour dietary recall of food, beverages
and supplements from a sample size of approximately 12,000 participants across Australia.
In order for the biophysical modelling to represent the contemporary diet it was necessary to
convert the detailed diet profiles data from NNPAS to the 20 aggregate ASFF food groups (see Figure
2). In the ASFF, foods are grouped according to the physical resources (e.g. water, land, energy,
fertiliser) required to produce them as well as suitable trade categories. In contrast, the NNPAS
classifies food at four levels (2-, 3-, 5-, and 8-digit levels) with increasing specification (see example
in Table 1). There are about 5300 foods at the 8-digit level. Analysis at the 8-digit level is necessary
to distinguish between foods which are classified as nutritious and belong to one of the five food
groups and those that are ‘discretionary’ (energy-dense, nutrient-poor) but might not be identifiable
as such at the 2-, 3- or 5-digit level (this distinction is important for the next stage of our research
into alternative scenarios incorporating healthy diets). In the example provided in Table 1, it is only
at the 8-digit level that sufficient detail is available to enable classification of a particular food item
in the cereal and cereal products major food group as a nutritious (five food group) food or a
MANUSCRIP
T
ACCEPTED
ACCEPTED MANUSCRIPT
8
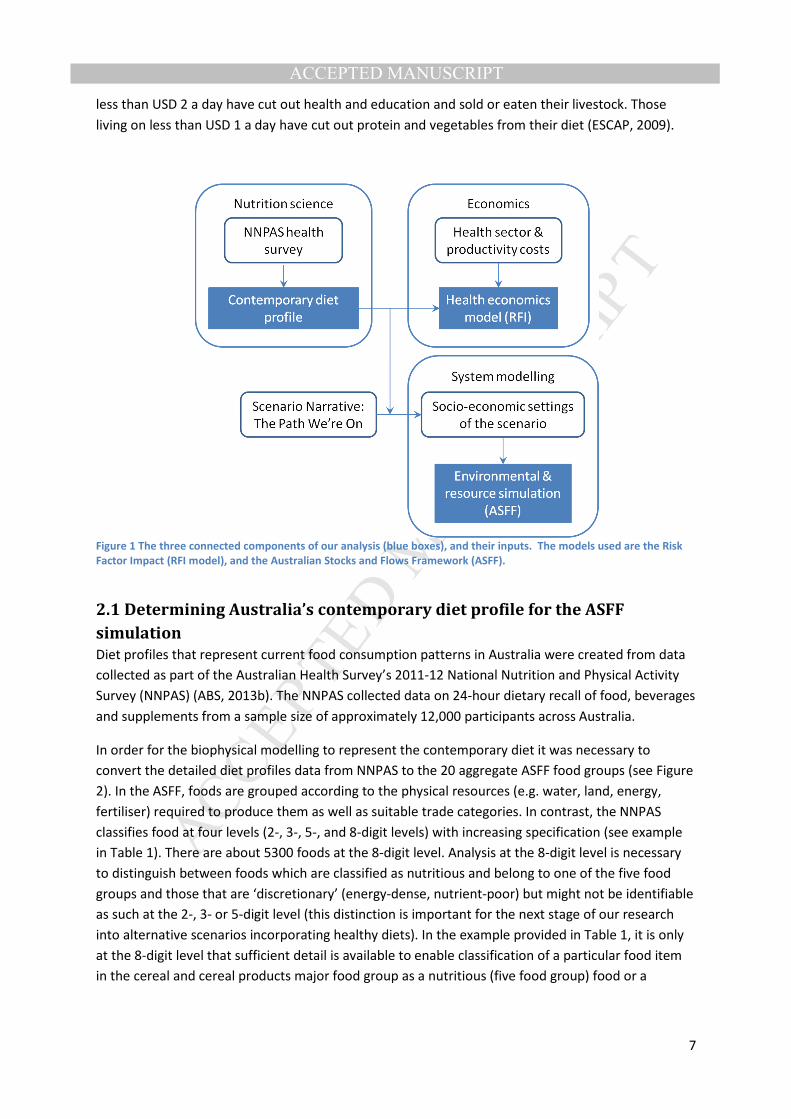
discretionary food. It is at this level of specification that the added sugar content of the item could
be assessed and identified as exceeding the level necessary to classify it as a discretionary food.
Table 1 Example food classification of the NNPAS.
Major food group
2-digit level
Sub-major food group
3-digit level
Minor food group
5-digit level
Food codes
8-digit level
12: Cereals and cereal
products
125: Breakfast cereals,
ready to eat
12502: Breakfast
cereal, corn based,
fortified
12502011: Breakfast
cereal, frosted flakes of
corn, added vitamins
B1, B2, B3, C, E & folate,
Fe & Zn
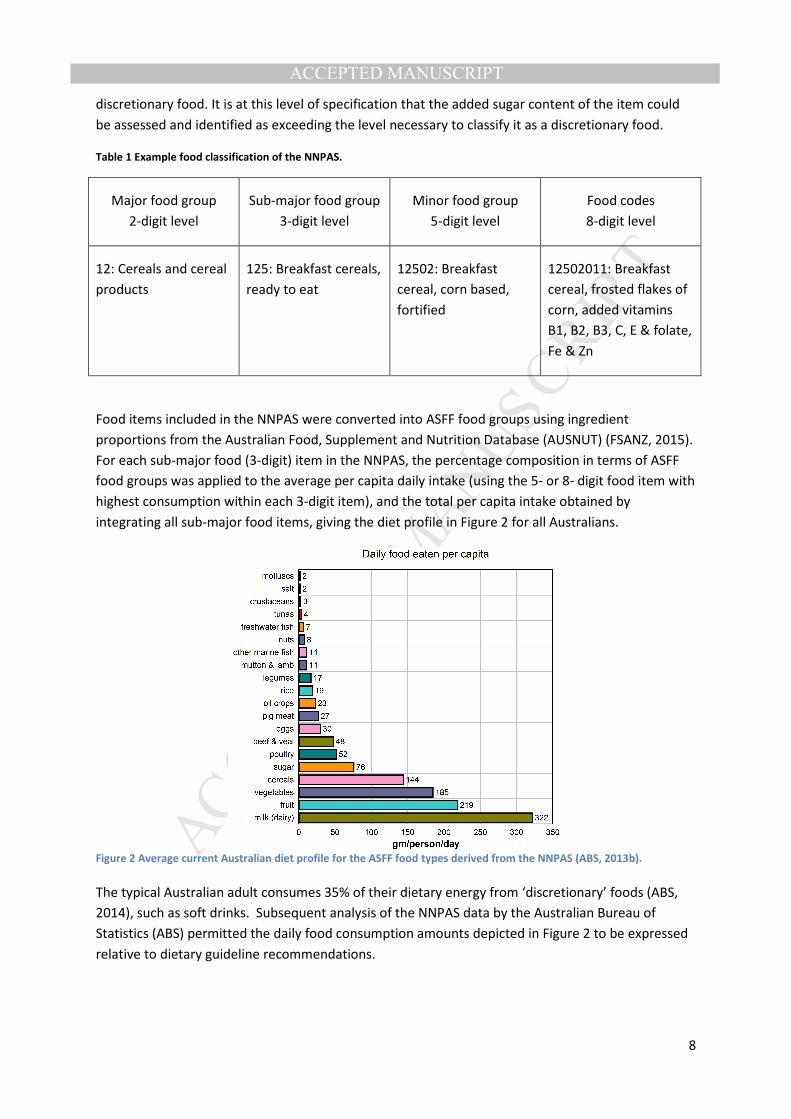
Food items included in the NNPAS were converted into ASFF food groups using ingredient
proportions from the Australian Food, Supplement and Nutrition Database (AUSNUT) (FSANZ, 2015).
For each sub-major food (3-digit) item in the NNPAS, the percentage composition in terms of ASFF
food groups was applied to the average per capita daily intake (using the 5- or 8- digit food item with
highest consumption within each 3-digit item), and the total per capita intake obtained by
integrating all sub-major food items, giving the diet profile in Figure 2 for all Australians.
Figure 2 Average current Australian diet profile for the ASFF food types derived from the NNPAS (ABS, 2013b).
The typical Australian adult consumes 35% of their dietary energy from ‘discretionary’ foods (ABS,
2014), such as soft drinks. Subsequent analysis of the NNPAS data by the Australian Bureau of
Statistics (ABS) permitted the daily food consumption amounts depicted in Figure 2 to be expressed
relative to dietary guideline recommendations.
MANUSCRIP
T
ACCEPTED
ACCEPTED MANUSCRIPT
9
2.2 Modelling the health and economic consequences of the current diet
To estimate the health and economic consequences of the current diet, we used the Risk Factor
Impact (RFI) model, which uses burden of disease data to predict the incident cases of disease
attributable to low fruit and vegetable intake and elevated BMI for the 2025 Australian adult
population (Cadilhac et al., 2011a; Cadilhac et al., 2009; Cadilhac et al., 2011b; Cadilhac et al., 2015;
Magnus et al., 2011, 2012). Given the lack of reliable evidence on the predicted diet profile of the
2025 Australian population, it is assumed that the prevalence of inadequate fruit and vegetable
intake will remain constant (i.e. the model used the prevalence data from the Australian Health
Survey 2011/12). However projections of future overweight and obesity prevalence in Australia
have estimated an increase. We modelled the impact of an estimated 72% of the Australian adult
population being overweight or obese in 2025 (Walls et al., 2012). The model draws on Australian
data on employment status, health related absenteeism from work and disruption to household and
leisure activities1 for persons exposed and not exposed to the risk factor of interest to predict the
economic burden and healthcare costs attributable to these two risk factors.
Workforce productivity was measured using the Friction Cost Approach (FCA) which only considers
the short-term impact of lost productivity in the workplace and can be considered a conservative
estimate of workplace productivity costs (Birnbaum, 2005). Health care costs of incident cases of
disease attributable to high BMI and inadequate fruit and vegetable intake in the 2025 population
was estimated using Australian Institute of Health and Welfare cost data (Australian Institute of
Health and Welfare, 2014). All future costs for the 2025 Australian population were discounted by
5% and reported in 2014 values.
It is common for people to be both overweight/obese and not consume enough fruits and
vegetables, and it is possible for two or more conditions to occur simultaneously in an individual (i.e.
co-morbidity). It is therefore important to avoid double counting the impact of both high BMI and
inadequate fruit and vegetable consumption on the same person (deaths and incident cases of
disease can only occur once). A downward correction is undertaken in the RFI model to reduce the
possible overestimation of the health and economic impact of these two risk factors occurring
concurrently in the population (Cadilhac et al., 2011b).
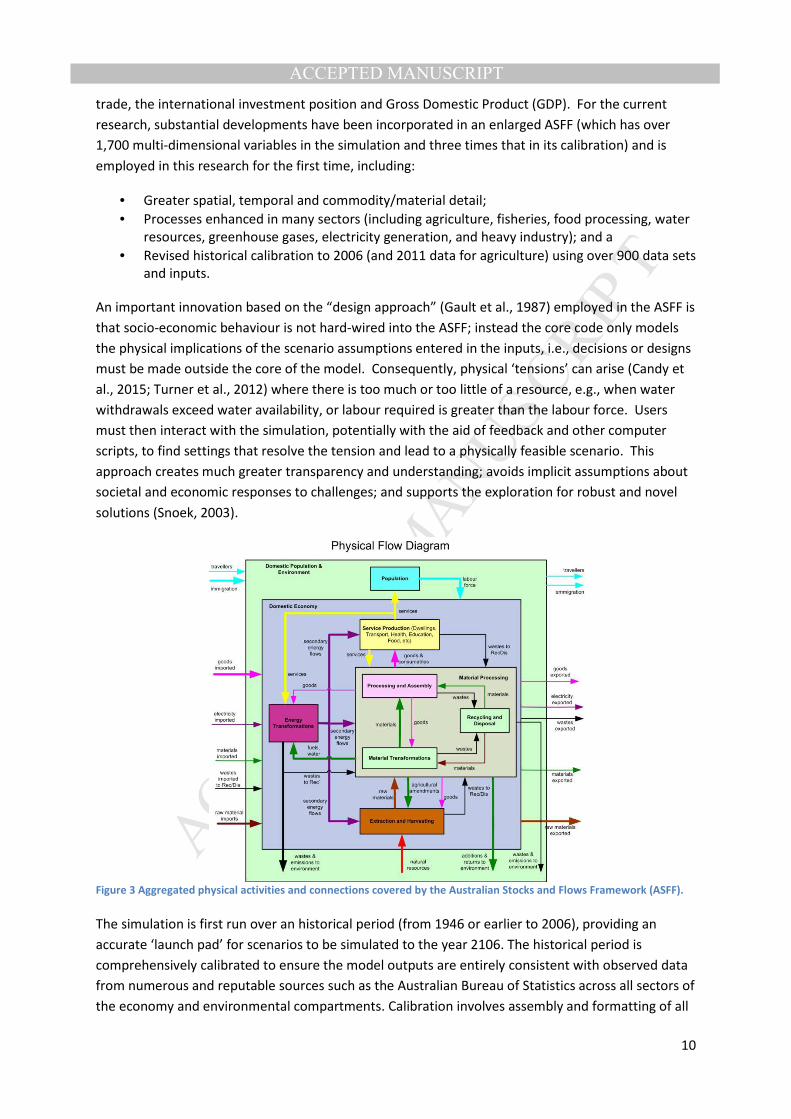
2.3 Simulating environmental, resource and macro-economic outcomes
System-wide aspects of Australia’s food security covering environmental and resource sustainability
as well as macro-economic outcomes, were explored using the Australian Stocks and Flows
Framework (ASFF). ASFF was first developed twenty years ago as a scenario-modelling platform for
comprehensively assessing Australian environmental sustainability challenges and exploring
potential solutions (Turner et al., 2011). It was designed as a scientific and policy tool to study the
interplay between factors such as population, technology, lifestyles and the environment (Poldy et
al., 2000). It models the physical processes (often involving the flows in and out of stocks, e.g.,
additions and demolitions of the building stock) that underlie activity across all sectors of the
economy. Essentially, a mass and energy accounting system is employed that tracks land, water,
energy, labour and materials required for economic activity to actually occur (Figure 3). In addition
to the physical accounts, exogenous prices are also used to establish macro-economic indicators for
1 cooking, cleaning, childcare, maintenance, social interaction, recreation and other leisure activities
MANUSCRIP
T
ACCEPTED
ACCEPTED MANUSCRIPT
10
trade, the international investment position and Gross Domestic Product (GDP). For the current
research, substantial developments have been incorporated in an enlarged ASFF (which has over
1,700 multi-dimensional variables in the simulation and three times that in its calibration) and is
employed in this research for the first time, including:
• Greater spatial, temporal and commodity/material detail;
• Processes enhanced in many sectors (including agriculture, fisheries, food processing, water
resources, greenhouse gases, electricity generation, and heavy industry); and a
• Revised historical calibration to 2006 (and 2011 data for agriculture) using over 900 data sets
and inputs.
An important innovation based on the “design approach” (Gault et al., 1987) employed in the ASFF is
that socio-economic behaviour is not hard-wired into the ASFF; instead the core code only models
the physical implications of the scenario assumptions entered in the inputs, i.e., decisions or designs
must be made outside the core of the model. Consequently, physical ‘tensions’ can arise (Candy et
al., 2015; Turner et al., 2012) where there is too much or too little of a resource, e.g., when water
withdrawals exceed water availability, or labour required is greater than the labour force. Users
must then interact with the simulation, potentially with the aid of feedback and other computer
scripts, to find settings that resolve the tension and lead to a physically feasible scenario. This
approach creates much greater transparency and understanding; avoids implicit assumptions about
societal and economic responses to challenges; and supports the exploration for robust and novel
solutions (Snoek, 2003).
Figure 3 Aggregated physical activities and connections covered by the Australian Stocks and Flows Framework (ASFF).
The simulation is first run over an historical period (from 1946 or earlier to 2006), providing an
accurate ‘launch pad’ for scenarios to be simulated to the year 2106. The historical period is
comprehensively calibrated to ensure the model outputs are entirely consistent with observed data
from numerous and reputable sources such as the Australian Bureau of Statistics across all sectors of
the economy and environmental compartments. Calibration involves assembly and formatting of all
MANUSCRIP
T
ACCEPTED
ACCEPTED MANUSCRIPT
11
relevant data sets, estimation of missing data, correction of erroneous data, and estimation of
parameters and variables that do not have any observed data (see e.g. (Baynes et al., 2009)).
2.4 Scenario narrative and key settings for The Path We’re On
In scenario modelling, qualitative ‘exploratory’ or ‘what-if’ scenarios are created, ideally as internally
consistent stories of alternate futures. The trends, policy positions and assumptions are then
translated into quantitative scenario settings for the model to enable computational analysis of
relationships and outcomes.
‘The Path We’re On’ (TPWO) scenario explored in this paper is designed to examine the
implications for Australia of continuing medium to long-term trends in the economy and resource
management, in line with current policy propositions. Other modelling work (Larsen et al., 2011;
Turner et al., 2012) developed scenarios with more promising outlooks for how challenges of
environmental and economic management, and food security might be managed. But as the
conditions in those scenarios fade from plausibility, let alone possibility (e.g. reduction of
greenhouse gas emissions to climate stabilising levels e.g. 80-90% on 1990 levels by 2050), a
considered and cogent examination of where ‘the path we are on’ is actually taking Australia is a
critical contribution to public debate.
In TWPO, despite increasing pressures globally and locally, Australia manages to maintain an
insulating buffer that prevents any significant or systemic change to the status quo. The dominant
narrative of ‘Australia as Asia’s food bowl’, with expansion of the north is actively pursued
(Commonwealth of Australia, 2015a). A continued investment in and intensification of mining and
gas extraction can conflict with highly productive agricultural areas. The recent government approval
of the Watermark (Shenhua) Coal Mine in the Liverpool Plains (DoE, 2015) is a classic example of this
tension playing out across Australia’s agricultural landscapes.
Changing the usual Australian diet and decoupling the economy from greenhouse gas emissions
requires significant changes in knowledge and culture, major infrastructure, energy systems, food
production, manufacturing systems and employment types. To make these changes in time for them
to have a significant impact by 2025 would require a confluence of drivers in economic policy and
both social and technological innovation by 2017. The premise of The Path We’re On is that even if a
new Australian Government in 2016 could combine efforts with international powers to induce
dramatic changes to the energy and social systems that underpin the economy, it will take
considerable time for these changes to take effect. Therefore, the narrative for The Path We’re On
scenario and the emergent snapshot of Australia in 2025 and beyond incorporates government
policies that are either already enacted or are reasonably expected to be enacted during the
scenario period (Table 2; some key settings are summarised in Figure 4–Figure 6).
There is a counter-narrative to this scenario involving ‘food sovereignty’ and agro-ecology of local
and resilient food systems empowered by active and engaged communities. In The Path We’re On
scenario, we assume that while the strength of this second narrative continues to build it will not
gain enough momentum to make a significant difference in this short timeframe to the settings
explored in the scenario.
MANUSCRIP
T
ACCEPTED
ACCEPTED MANUSCRIPT
12
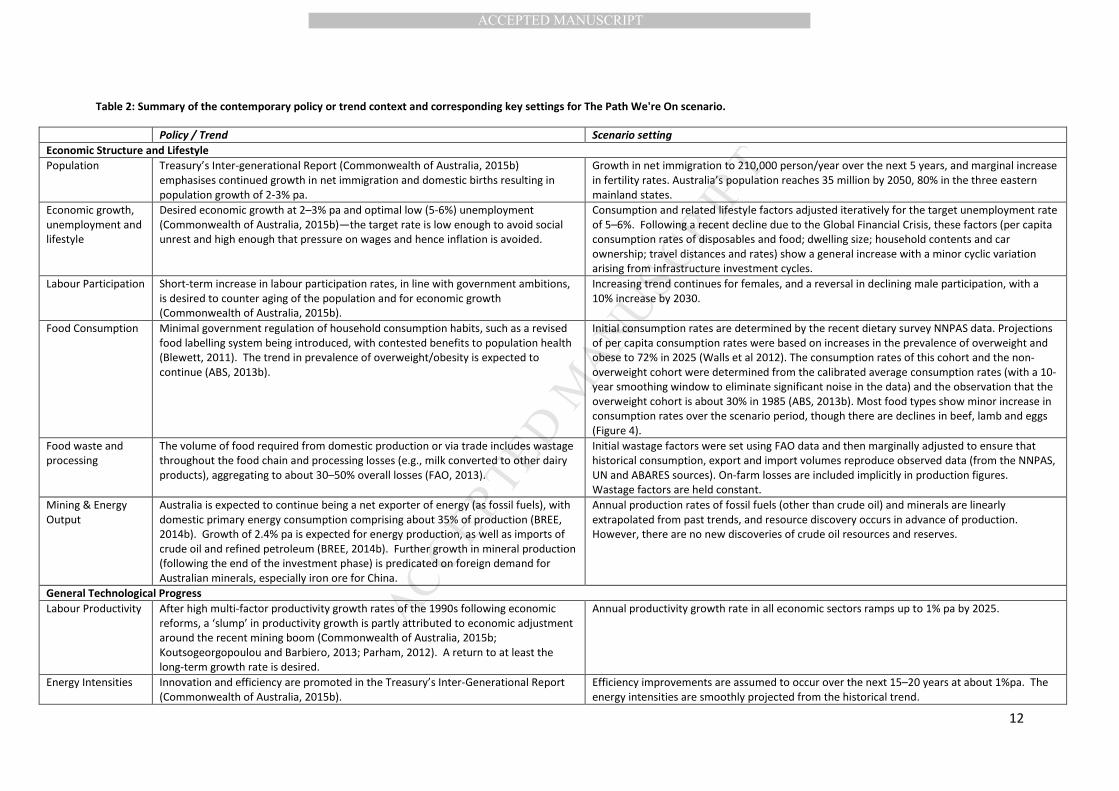
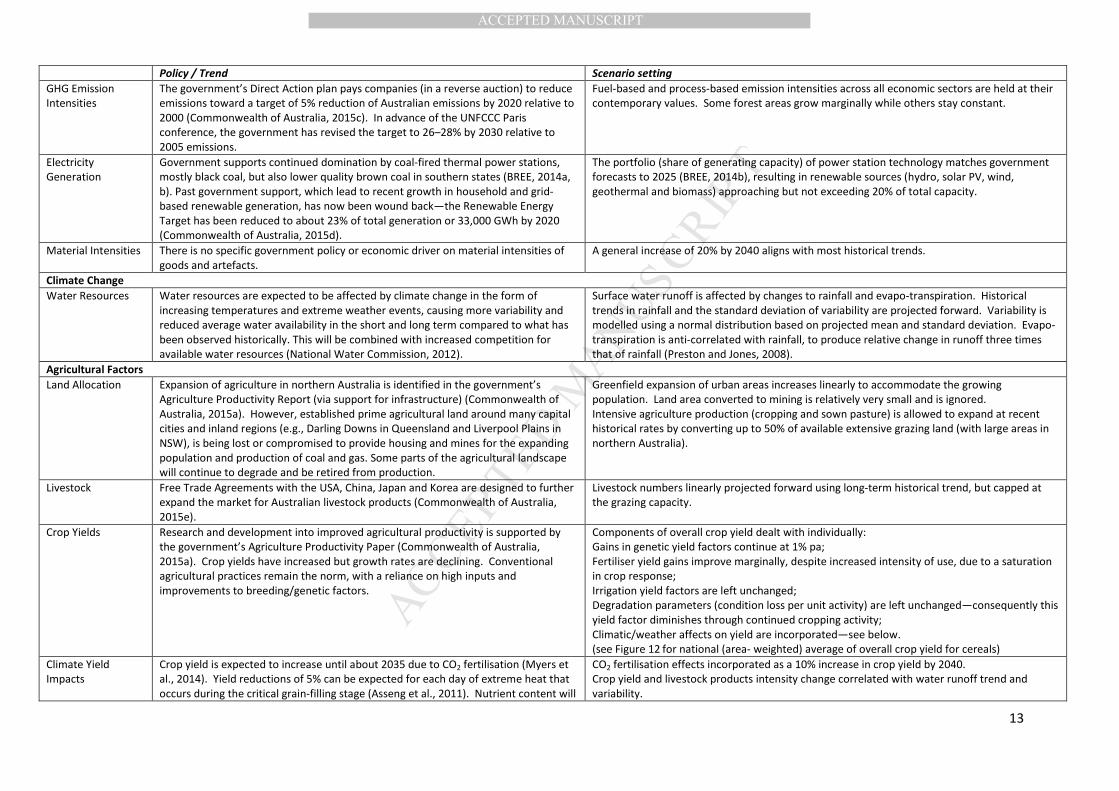
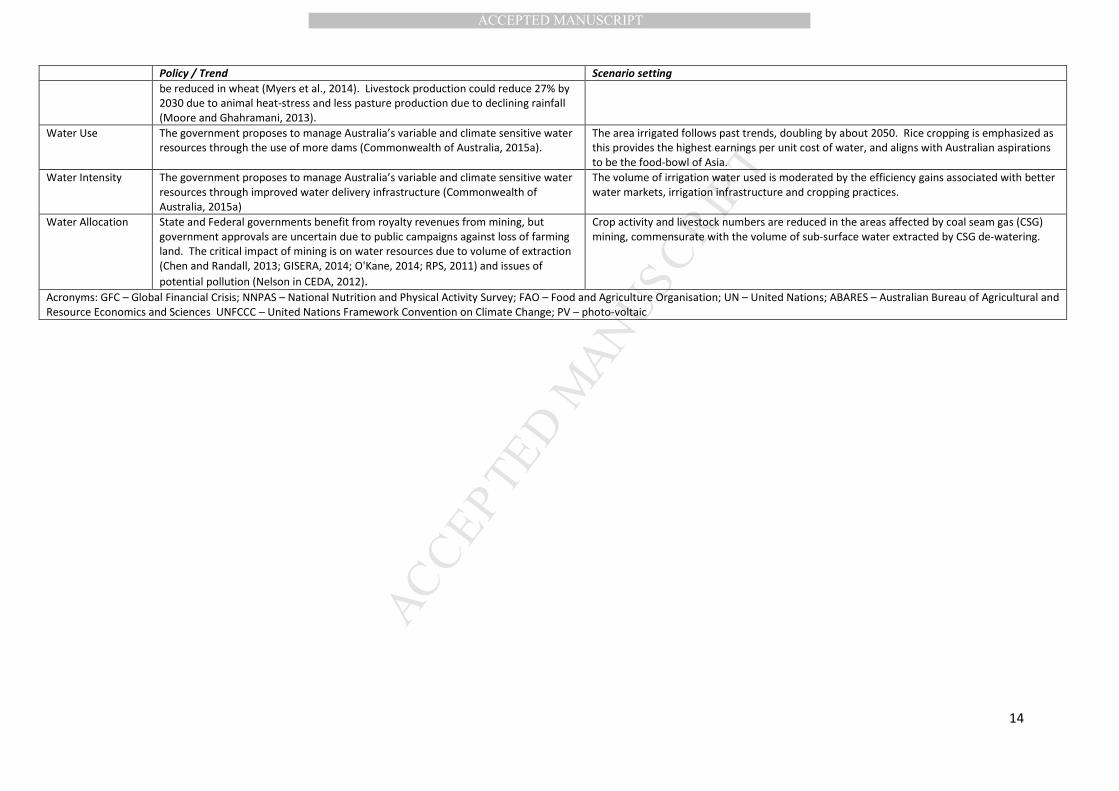
Table 2: Summary of the contemporary policy or trend context and corresponding key settings for The Path We're On scenario.
Policy / Trend Scenario setting
Economic Structure and Lifestyle
Population Treasury’s Inter-generational Report (Commonwealth of Australia, 2015b)
emphasises continued growth in net immigration and domestic births resulting in
population growth of 2-3% pa.
Growth in net immigration to 210,000 person/year over the next 5 years, and marginal increase
in fertility rates. Australia’s population reaches 35 million by 2050, 80% in the three eastern
mainland states.
Economic growth,
unemployment and
lifestyle
Desired economic growth at 2–3% pa and optimal low (5-6%) unemployment
(Commonwealth of Australia, 2015b)—the target rate is low enough to avoid social
unrest and high enough that pressure on wages and hence inflation is avoided.
Consumption and related lifestyle factors adjusted iteratively for the target unemployment rate
of 5–6%. Following a recent decline due to the Global Financial Crisis, these factors (per capita
consumption rates of disposables and food; dwelling size; household contents and car
ownership; travel distances and rates) show a general increase with a minor cyclic variation
arising from infrastructure investment cycles.
Labour Participation Short-term increase in labour participation rates, in line with government ambitions,
is desired to counter aging of the population and for economic growth
(Commonwealth of Australia, 2015b).
Increasing trend continues for females, and a reversal in declining male participation, with a
10% increase by 2030.
Food Consumption Minimal government regulation of household consumption habits, such as a revised
food labelling system being introduced, with contested benefits to population health
(Blewett, 2011). The trend in prevalence of overweight/obesity is expected to
continue (ABS, 2013b).
Initial consumption rates are determined by the recent dietary survey NNPAS data. Projections
of per capita consumption rates were based on increases in the prevalence of overweight and
obese to 72% in 2025 (Walls et al 2012). The consumption rates of this cohort and the non-
overweight cohort were determined from the calibrated average consumption rates (with a 10-
year smoothing window to eliminate significant noise in the data) and the observation that the
overweight cohort is about 30% in 1985 (ABS, 2013b). Most food types show minor increase in
consumption rates over the scenario period, though there are declines in beef, lamb and eggs
(Figure 4).
Food waste and
processing
The volume of food required from domestic production or via trade includes wastage
throughout the food chain and processing losses (e.g., milk converted to other dairy
products), aggregating to about 30–50% overall losses (FAO, 2013).
Initial wastage factors were set using FAO data and then marginally adjusted to ensure that
historical consumption, export and import volumes reproduce observed data (from the NNPAS,
UN and ABARES sources). On-farm losses are included implicitly in production figures.
Wastage factors are held constant.
Mining & Energy
Output
Australia is expected to continue being a net exporter of energy (as fossil fuels), with
domestic primary energy consumption comprising about 35% of production (BREE,
2014b). Growth of 2.4% pa is expected for energy production, as well as imports of
crude oil and refined petroleum (BREE, 2014b). Further growth in mineral production
(following the end of the investment phase) is predicated on foreign demand for
Australian minerals, especially iron ore for China.
Annual production rates of fossil fuels (other than crude oil) and minerals are linearly
extrapolated from past trends, and resource discovery occurs in advance of production.
However, there are no new discoveries of crude oil resources and reserves.
General Technological Progress
Labour Productivity After high multi-factor productivity growth rates of the 1990s following economic
reforms, a ‘slump’ in productivity growth is partly attributed to economic adjustment
around the recent mining boom (Commonwealth of Australia, 2015b;
Koutsogeorgopoulou and Barbiero, 2013; Parham, 2012). A return to at least the
long-term growth rate is desired.
Annual productivity growth rate in all economic sectors ramps up to 1% pa by 2025.
Energy Intensities Innovation and efficiency are promoted in the Treasury’s Inter-Generational Report
(Commonwealth of Australia, 2015b).
Efficiency improvements are assumed to occur over the next 15–20 years at about 1%pa. The
energy intensities are smoothly projected from the historical trend.
MANUSCRIP
T
ACCEPTED
ACCEPTED MANUSCRIPT
13
Policy / Trend Scenario setting
GHG Emission
Intensities
The government’s Direct Action plan pays companies (in a reverse auction) to reduce
emissions toward a target of 5% reduction of Australian emissions by 2020 relative to
2000 (Commonwealth of Australia, 2015c). In advance of the UNFCCC Paris
conference, the government has revised the target to 26–28% by 2030 relative to
2005 emissions.
Fuel-based and process-based emission intensities across all economic sectors are held at their
contemporary values. Some forest areas grow marginally while others stay constant.
Electricity
Generation
Government supports continued domination by coal-fired thermal power stations,
mostly black coal, but also lower quality brown coal in southern states (BREE, 2014a,
b). Past government support, which lead to recent growth in household and grid-
based renewable generation, has now been wound back—the Renewable Energy
Target has been reduced to about 23% of total generation or 33,000 GWh by 2020
(Commonwealth of Australia, 2015d).
The portfolio (share of generating capacity) of power station technology matches government
forecasts to 2025 (BREE, 2014b), resulting in renewable sources (hydro, solar PV, wind,
geothermal and biomass) approaching but not exceeding 20% of total capacity.
Material Intensities There is no specific government policy or economic driver on material intensities of
goods and artefacts.
A general increase of 20% by 2040 aligns with most historical trends.
Climate Change
Water Resources Water resources are expected to be affected by climate change in the form of
increasing temperatures and extreme weather events, causing more variability and
reduced average water availability in the short and long term compared to what has
been observed historically. This will be combined with increased competition for
available water resources (National Water Commission, 2012).
Surface water runoff is affected by changes to rainfall and evapo-transpiration. Historical
trends in rainfall and the standard deviation of variability are projected forward. Variability is
modelled using a normal distribution based on projected mean and standard deviation. Evapo-
transpiration is anti-correlated with rainfall, to produce relative change in runoff three times
that of rainfall (Preston and Jones, 2008).
Agricultural Factors
Land Allocation Expansion of agriculture in northern Australia is identified in the government’s
Agriculture Productivity Report (via support for infrastructure) (Commonwealth of
Australia, 2015a). However, established prime agricultural land around many capital
cities and inland regions (e.g., Darling Downs in Queensland and Liverpool Plains in
NSW), is being lost or compromised to provide housing and mines for the expanding
population and production of coal and gas. Some parts of the agricultural landscape
will continue to degrade and be retired from production.
Greenfield expansion of urban areas increases linearly to accommodate the growing
population. Land area converted to mining is relatively very small and is ignored.
Intensive agriculture production (cropping and sown pasture) is allowed to expand at recent
historical rates by converting up to 50% of available extensive grazing land (with large areas in
northern Australia).
Livestock Free Trade Agreements with the USA, China, Japan and Korea are designed to further
expand the market for Australian livestock products (Commonwealth of Australia,
2015e).
Livestock numbers linearly projected forward using long-term historical trend, but capped at
the grazing capacity.
Crop Yields Research and development into improved agricultural productivity is supported by
the government’s Agriculture Productivity Paper (Commonwealth of Australia,
2015a). Crop yields have increased but growth rates are declining. Conventional
agricultural practices remain the norm, with a reliance on high inputs and
improvements to breeding/genetic factors.
Components of overall crop yield dealt with individually:
Gains in genetic yield factors continue at 1% pa;
Fertiliser yield gains improve marginally, despite increased intensity of use, due to a saturation
in crop response;
Irrigation yield factors are left unchanged;
Degradation parameters (condition loss per unit activity) are left unchanged—consequently this
yield factor diminishes through continued cropping activity;
Climatic/weather affects on yield are incorporated—see below.
(see Figure 12 for national (area- weighted) average of overall crop yield for cereals)
Climate Yield
Impacts
Crop yield is expected to increase until about 2035 due to CO2 fertilisation (Myers et
al., 2014). Yield reductions of 5% can be expected for each day of extreme heat that
occurs during the critical grain-filling stage (Asseng et al., 2011). Nutrient content will
CO2 fertilisation effects incorporated as a 10% increase in crop yield by 2040.
Crop yield and livestock products intensity change correlated with water runoff trend and
variability.
MANUSCRIP
T
ACCEPTED
ACCEPTED MANUSCRIPT
14
Policy / Trend Scenario setting
be reduced in wheat (Myers et al., 2014). Livestock production could reduce 27% by
2030 due to animal heat-stress and less pasture production due to declining rainfall
(Moore and Ghahramani, 2013).
Water Use The government proposes to manage Australia’s variable and climate sensitive water
resources through the use of more dams (Commonwealth of Australia, 2015a).
The area irrigated follows past trends, doubling by about 2050. Rice cropping is emphasized as
this provides the highest earnings per unit cost of water, and aligns with Australian aspirations
to be the food-bowl of Asia.
Water Intensity The government proposes to manage Australia’s variable and climate sensitive water
resources through improved water delivery infrastructure (Commonwealth of
Australia, 2015a)
The volume of irrigation water used is moderated by the efficiency gains associated with better
water markets, irrigation infrastructure and cropping practices.
Water Allocation State and Federal governments benefit from royalty revenues from mining, but
government approvals are uncertain due to public campaigns against loss of farming
land. The critical impact of mining is on water resources due to volume of extraction
(Chen and Randall, 2013; GISERA, 2014; O'Kane, 2014; RPS, 2011) and issues of
potential pollution (Nelson in CEDA, 2012).
Crop activity and livestock numbers are reduced in the areas affected by coal seam gas (CSG)
mining, commensurate with the volume of sub-surface water extracted by CSG de-watering.
Acronyms: GFC – Global Financial Crisis; NNPAS – National Nutrition and Physical Activity Survey; FAO – Food and Agriculture Organisation; UN – United Nations; ABARES – Australian Bureau of Agricultural and
Resource Economics and Sciences UNFCCC – United Nations Framework Convention on Climate Change; PV – photo-voltaic
MANUSCRIP
T
ACCEPTED
ACCEPTED MANUSCRIPT
15
(a) (b) (c)
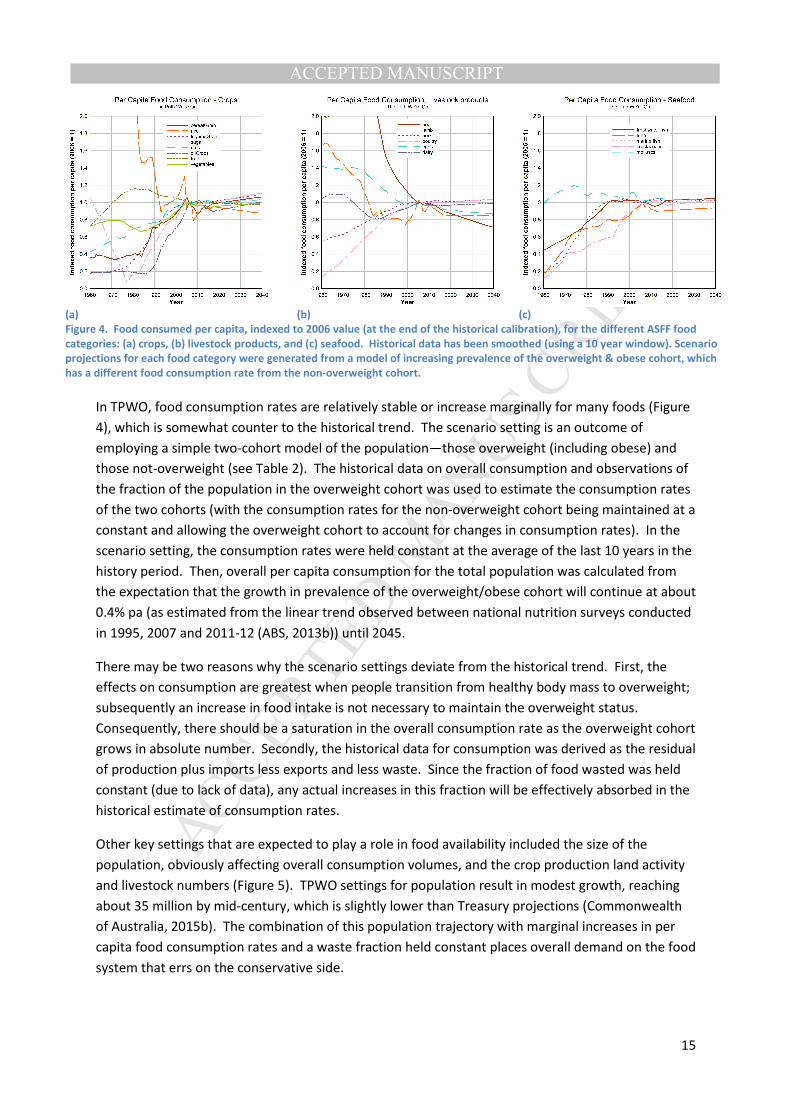
Figure 4. Food consumed per capita, indexed to 2006 value (at the end of the historical calibration), for the different ASFF food
categories: (a) crops, (b) livestock products, and (c) seafood. Historical data has been smoothed (using a 10 year window). Scenario
projections for each food category were generated from a model of increasing prevalence of the overweight & obese cohort, which
has a different food consumption rate from the non-overweight cohort.
In TPWO, food consumption rates are relatively stable or increase marginally for many foods (Figure
4), which is somewhat counter to the historical trend. The scenario setting is an outcome of
employing a simple two-cohort model of the population—those overweight (including obese) and
those not-overweight (see Table 2). The historical data on overall consumption and observations of
the fraction of the population in the overweight cohort was used to estimate the consumption rates
of the two cohorts (with the consumption rates for the non-overweight cohort being maintained at a
constant and allowing the overweight cohort to account for changes in consumption rates). In the
scenario setting, the consumption rates were held constant at the average of the last 10 years in the
history period. Then, overall per capita consumption for the total population was calculated from
the expectation that the growth in prevalence of the overweight/obese cohort will continue at about
0.4% pa (as estimated from the linear trend observed between national nutrition surveys conducted
in 1995, 2007 and 2011-12 (ABS, 2013b)) until 2045.
There may be two reasons why the scenario settings deviate from the historical trend. First, the
effects on consumption are greatest when people transition from healthy body mass to overweight;
subsequently an increase in food intake is not necessary to maintain the overweight status.
Consequently, there should be a saturation in the overall consumption rate as the overweight cohort
grows in absolute number. Secondly, the historical data for consumption was derived as the residual
of production plus imports less exports and less waste. Since the fraction of food wasted was held
constant (due to lack of data), any actual increases in this fraction will be effectively absorbed in the
historical estimate of consumption rates.
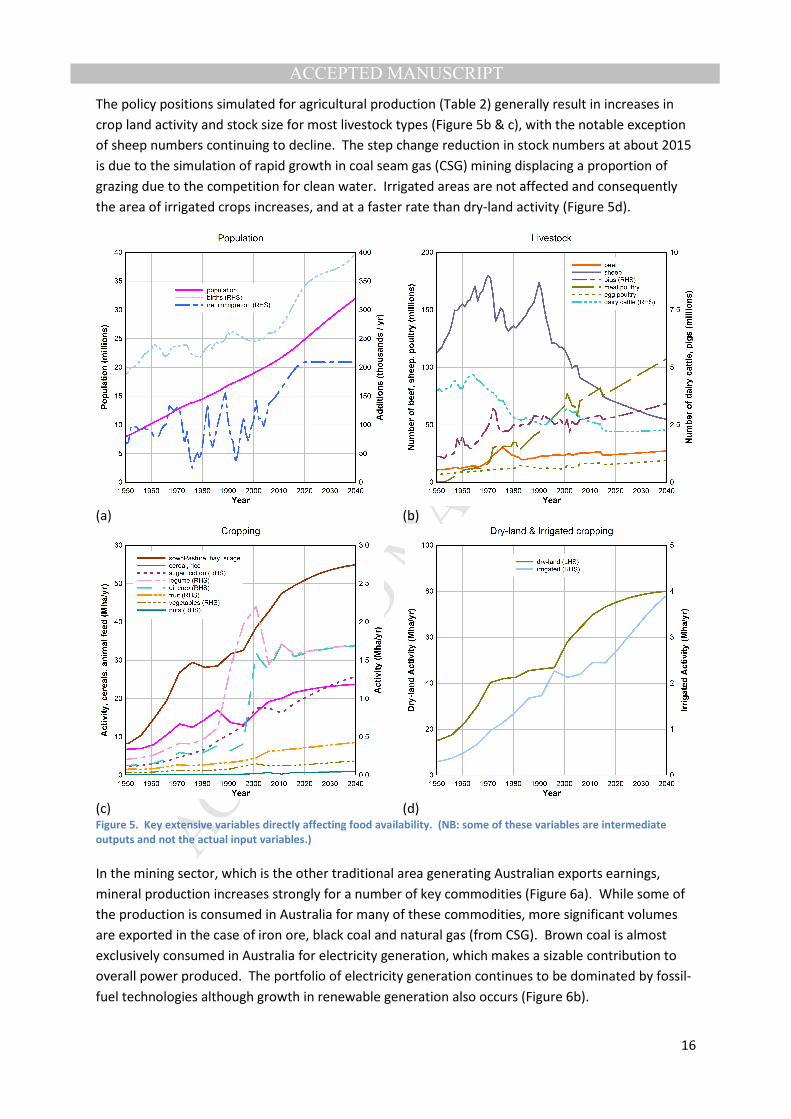
Other key settings that are expected to play a role in food availability included the size of the
population, obviously affecting overall consumption volumes, and the crop production land activity
and livestock numbers (Figure 5). TPWO settings for population result in modest growth, reaching
about 35 million by mid-century, which is slightly lower than Treasury projections (Commonwealth
of Australia, 2015b). The combination of this population trajectory with marginal increases in per
capita food consumption rates and a waste fraction held constant places overall demand on the food
system that errs on the conservative side.
MANUSCRIP
T
ACCEPTED
ACCEPTED MANUSCRIPT
16
The policy positions simulated for agricultural production (Table 2) generally result in increases in
crop land activity and stock size for most livestock types (Figure 5b & c), with the notable exception
of sheep numbers continuing to decline. The step change reduction in stock numbers at about 2015
is due to the simulation of rapid growth in coal seam gas (CSG) mining displacing a proportion of
grazing due to the competition for clean water. Irrigated areas are not affected and consequently
the area of irrigated crops increases, and at a faster rate than dry-land activity (Figure 5d).
(a) (b)
(c) (d) Figure 5. Key extensive variables directly affecting food availability. (NB: some of these variables are intermediate
outputs and not the actual input variables.)
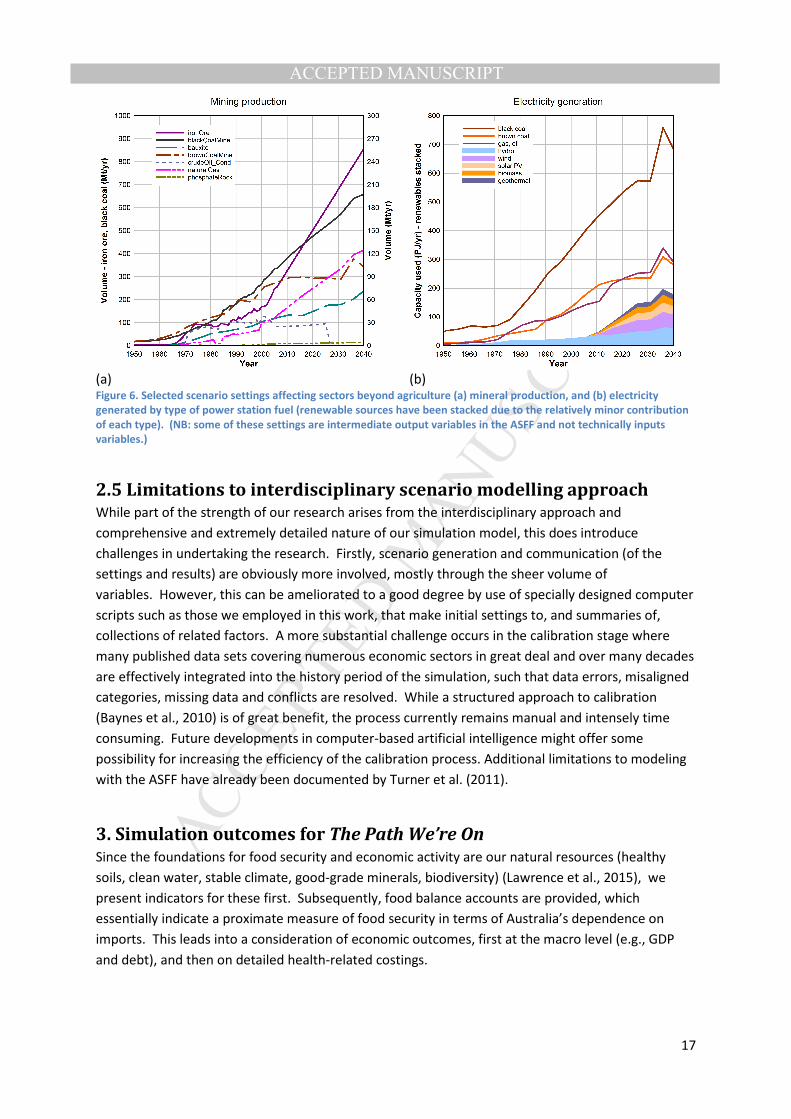
In the mining sector, which is the other traditional area generating Australian exports earnings,
mineral production increases strongly for a number of key commodities (Figure 6a). While some of
the production is consumed in Australia for many of these commodities, more significant volumes
are exported in the case of iron ore, black coal and natural gas (from CSG). Brown coal is almost
exclusively consumed in Australia for electricity generation, which makes a sizable contribution to
overall power produced. The portfolio of electricity generation continues to be dominated by fossil-
fuel technologies although growth in renewable generation also occurs (Figure 6b).
MANUSCRIP
T
ACCEPTED
ACCEPTED MANUSCRIPT
17
(a) (b) Figure 6. Selected scenario settings affecting sectors beyond agriculture (a) mineral production, and (b) electricity
generated by type of power station fuel (renewable sources have been stacked due to the relatively minor contribution
of each type). (NB: some of these settings are intermediate output variables in the ASFF and not technically inputs
variables.)
2.5 Limitations to interdisciplinary scenario modelling approach While part of the strength of our research arises from the interdisciplinary approach and
comprehensive and extremely detailed nature of our simulation model, this does introduce
challenges in undertaking the research. Firstly, scenario generation and communication (of the
settings and results) are obviously more involved, mostly through the sheer volume of
variables. However, this can be ameliorated to a good degree by use of specially designed computer
scripts such as those we employed in this work, that make initial settings to, and summaries of,
collections of related factors. A more substantial challenge occurs in the calibration stage where
many published data sets covering numerous economic sectors in great deal and over many decades
are effectively integrated into the history period of the simulation, such that data errors, misaligned
categories, missing data and conflicts are resolved. While a structured approach to calibration
(Baynes et al., 2010) is of great benefit, the process currently remains manual and intensely time
consuming. Future developments in computer-based artificial intelligence might offer some
possibility for increasing the efficiency of the calibration process. Additional limitations to modeling
with the ASFF have already been documented by Turner et al. (2011).
3. Simulation outcomes for The Path We’re On Since the foundations for food security and economic activity are our natural resources (healthy
soils, clean water, stable climate, good-grade minerals, biodiversity) (Lawrence et al., 2015), we
present indicators for these first. Subsequently, food balance accounts are provided, which
essentially indicate a proximate measure of food security in terms of Australia’s dependence on
imports. This leads into a consideration of economic outcomes, first at the macro level (e.g., GDP
and debt), and then on detailed health-related costings.
MANUSCRIP
T
ACCEPTED
ACCEPTED MANUSCRIPT
18
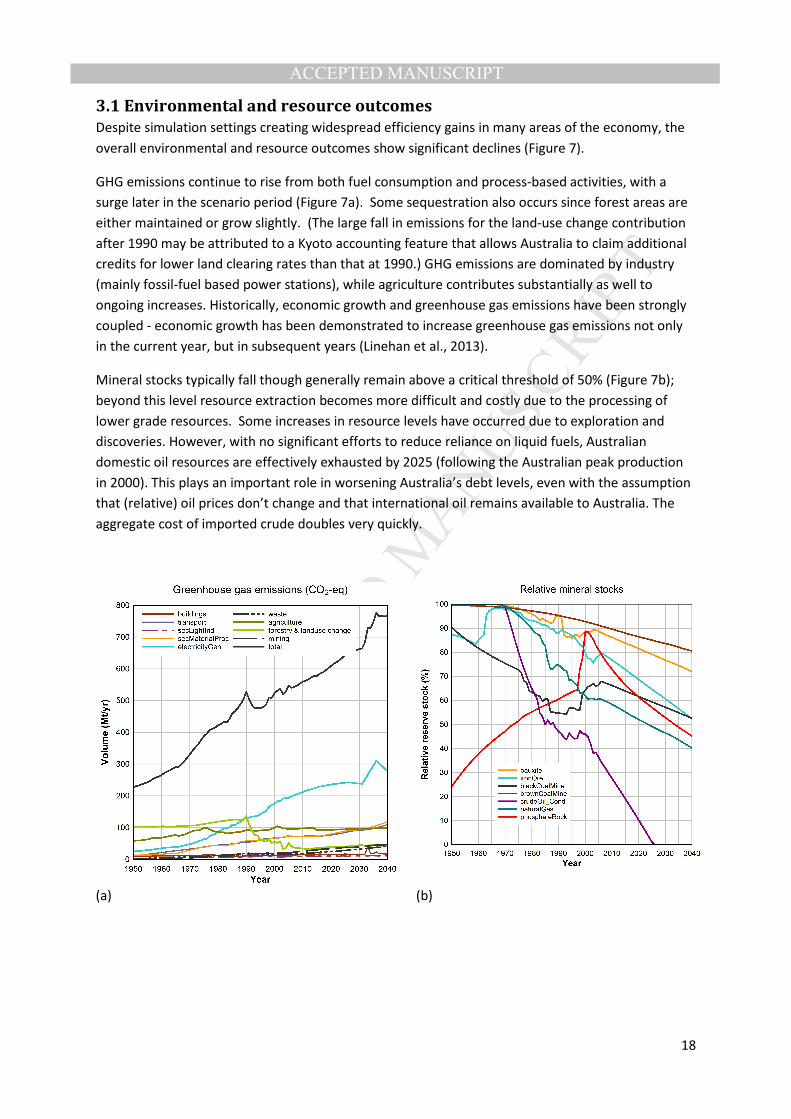
3.1 Environmental and resource outcomes
Despite simulation settings creating widespread efficiency gains in many areas of the economy, the
overall environmental and resource outcomes show significant declines (Figure 7).
GHG emissions continue to rise from both fuel consumption and process-based activities, with a
surge later in the scenario period (Figure 7a). Some sequestration also occurs since forest areas are
either maintained or grow slightly. (The large fall in emissions for the land-use change contribution
after 1990 may be attributed to a Kyoto accounting feature that allows Australia to claim additional
credits for lower land clearing rates than that at 1990.) GHG emissions are dominated by industry
(mainly fossil-fuel based power stations), while agriculture contributes substantially as well to
ongoing increases. Historically, economic growth and greenhouse gas emissions have been strongly
coupled - economic growth has been demonstrated to increase greenhouse gas emissions not only
in the current year, but in subsequent years (Linehan et al., 2013).
Mineral stocks typically fall though generally remain above a critical threshold of 50% (Figure 7b);
beyond this level resource extraction becomes more difficult and costly due to the processing of
lower grade resources. Some increases in resource levels have occurred due to exploration and
discoveries. However, with no significant efforts to reduce reliance on liquid fuels, Australian
domestic oil resources are effectively exhausted by 2025 (following the Australian peak production
in 2000). This plays an important role in worsening Australia’s debt levels, even with the assumption
that (relative) oil prices don’t change and that international oil remains available to Australia. The
aggregate cost of imported crude doubles very quickly.
(a) (b)
MANUSCRIP
T
ACCEPTED
ACCEPTED MANUSCRIPT
19
(c) (d)
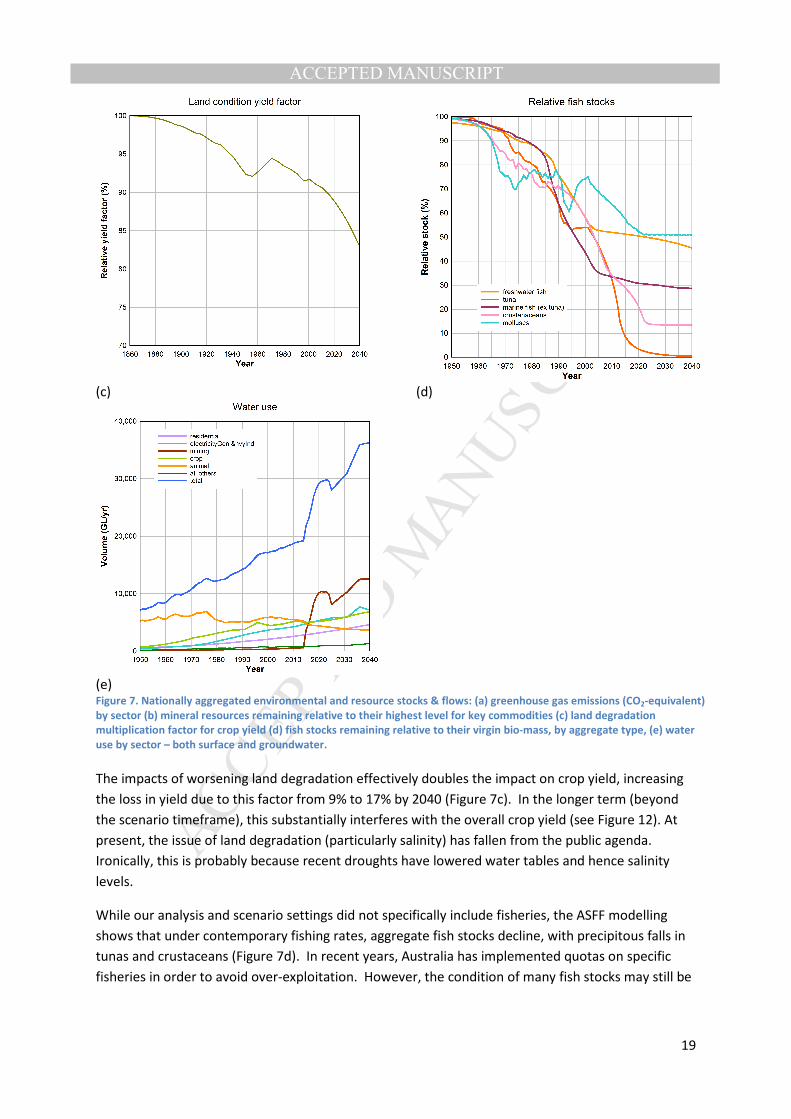
(e) Figure 7. Nationally aggregated environmental and resource stocks & flows: (a) greenhouse gas emissions (CO2-equivalent)
by sector (b) mineral resources remaining relative to their highest level for key commodities (c) land degradation
multiplication factor for crop yield (d) fish stocks remaining relative to their virgin bio-mass, by aggregate type, (e) water
use by sector – both surface and groundwater.
The impacts of worsening land degradation effectively doubles the impact on crop yield, increasing
the loss in yield due to this factor from 9% to 17% by 2040 (Figure 7c). In the longer term (beyond
the scenario timeframe), this substantially interferes with the overall crop yield (see Figure 12). At
present, the issue of land degradation (particularly salinity) has fallen from the public agenda.
Ironically, this is probably because recent droughts have lowered water tables and hence salinity
levels.
While our analysis and scenario settings did not specifically include fisheries, the ASFF modelling
shows that under contemporary fishing rates, aggregate fish stocks decline, with precipitous falls in
tunas and crustaceans (Figure 7d). In recent years, Australia has implemented quotas on specific
fisheries in order to avoid over-exploitation. However, the condition of many fish stocks may still be
MANUSCRIP
T
ACCEPTED
ACCEPTED MANUSCRIPT
20
under pressure from other factors not modelled, such as pollution from land-use and rising ocean
acidification and temperature (SOE, 2011).
Despite more efficient water use, the volume used by most sectors generally increases in line with
historical experience (Figure 7e). Water use for livestock is the exception, due to constraints on
sheep and dairy numbers. A dramatic increase in overall water use occurs in the mining sector due
to CSG operations, with a peak in use resulting from the time profile of water extraction combined
with industry aspirations for the number of wells drilled. The volume of water involved is broadly
equivalent to that used by agriculture, and would propel mining from being one of the lowest water
use sectors into the highest. Since this water is drawn from deep aquifers it does not compete with
surface water use. However, possible lowering of sub-surface water tables and concern about
contaminated water have a negative impact on some livestock numbers in TPWO scenario.
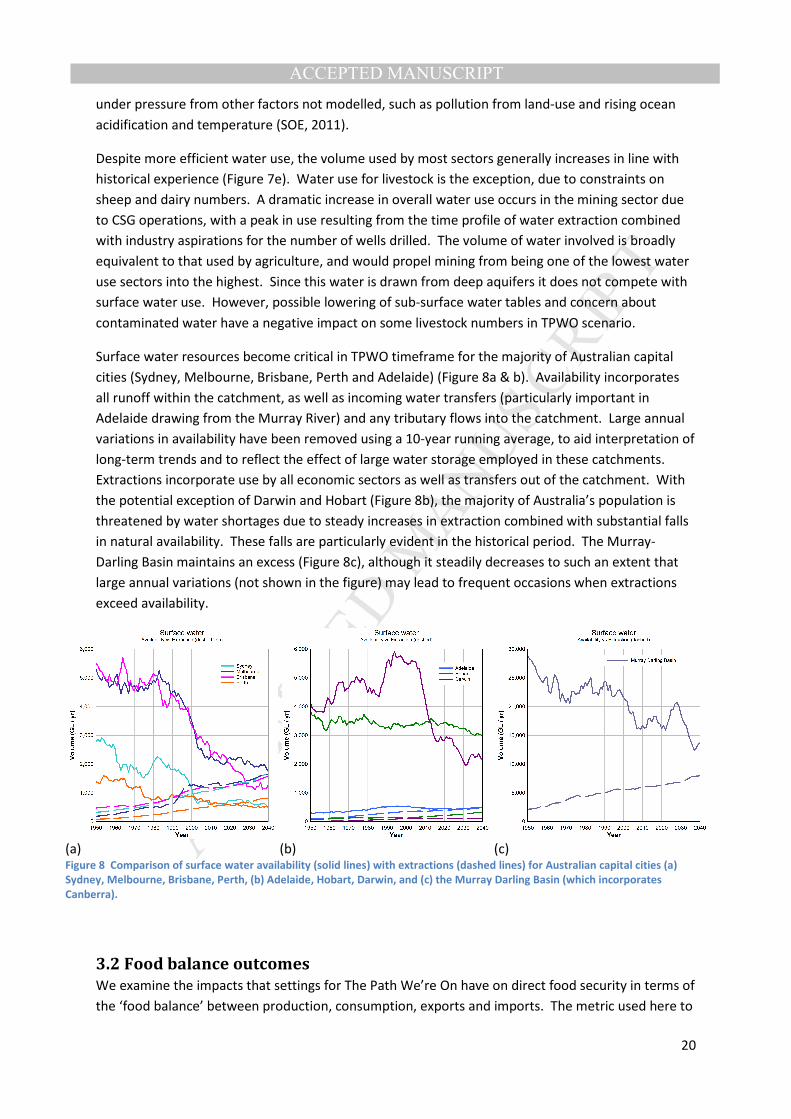
Surface water resources become critical in TPWO timeframe for the majority of Australian capital
cities (Sydney, Melbourne, Brisbane, Perth and Adelaide) (Figure 8a & b). Availability incorporates
all runoff within the catchment, as well as incoming water transfers (particularly important in
Adelaide drawing from the Murray River) and any tributary flows into the catchment. Large annual
variations in availability have been removed using a 10-year running average, to aid interpretation of
long-term trends and to reflect the effect of large water storage employed in these catchments.
Extractions incorporate use by all economic sectors as well as transfers out of the catchment. With
the potential exception of Darwin and Hobart (Figure 8b), the majority of Australia’s population is
threatened by water shortages due to steady increases in extraction combined with substantial falls
in natural availability. These falls are particularly evident in the historical period. The Murray-
Darling Basin maintains an excess (Figure 8c), although it steadily decreases to such an extent that
large annual variations (not shown in the figure) may lead to frequent occasions when extractions
exceed availability.
(a) (b) (c) Figure 8 Comparison of surface water availability (solid lines) with extractions (dashed lines) for Australian capital cities (a)
Sydney, Melbourne, Brisbane, Perth, (b) Adelaide, Hobart, Darwin, and (c) the Murray Darling Basin (which incorporates
Canberra).
3.2 Food balance outcomes
We examine the impacts that settings for The Path We’re On have on direct food security in terms of
the ‘food balance’ between production, consumption, exports and imports. The metric used here to
MANUSCRIP
T
ACCEPTED
ACCEPTED MANUSCRIPT
21
represent direct food security (i.e. availability) is ‘net imports relative to production’. Net imports
are imports less exports, which are positive if imports are greater than exports (lack of direct food
security) and negative if exports are greater than imports (direct food security). Expressing these
relative to the production volume gives a measure of how much production would have to change to
address direct food security, and it allows multiple food types to be shown on one graph.
Net import volume relative to production is a direct (or primary) measure of insecurity since it
indicates the extent to which Australia is not self-reliant in food production. A broader sense of
security needs to consider (as we present in other sections) the environmental/resource situation
supporting the food system, as well as economic and trade conditions in particular. If these
conditions are healthy then importing food may be a viable means to secure supply, but our analysis
indicates conditions may not be suitable.
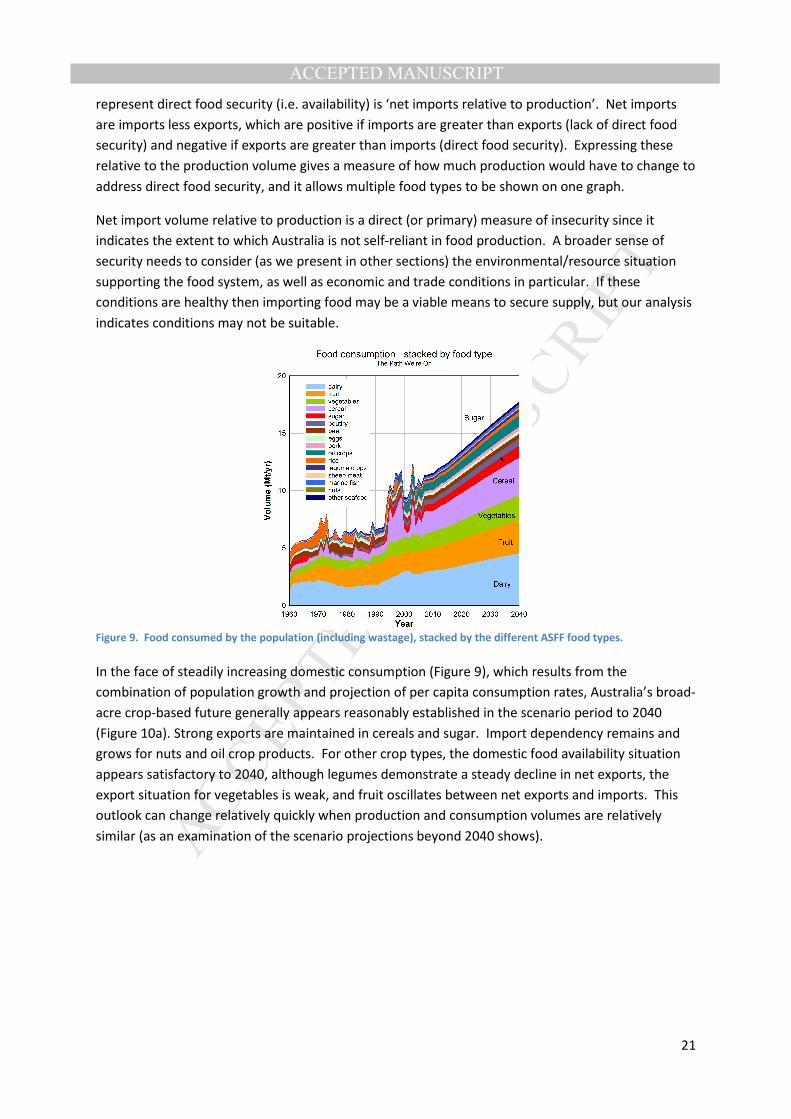
Figure 9. Food consumed by the population (including wastage), stacked by the different ASFF food types.
In the face of steadily increasing domestic consumption (Figure 9), which results from the
combination of population growth and projection of per capita consumption rates, Australia’s broad-
acre crop-based future generally appears reasonably established in the scenario period to 2040
(Figure 10a). Strong exports are maintained in cereals and sugar. Import dependency remains and
grows for nuts and oil crop products. For other crop types, the domestic food availability situation
appears satisfactory to 2040, although legumes demonstrate a steady decline in net exports, the
export situation for vegetables is weak, and fruit oscillates between net exports and imports. This
outlook can change relatively quickly when production and consumption volumes are relatively
similar (as an examination of the scenario projections beyond 2040 shows).
MANUSCRIP
T
ACCEPTED
ACCEPTED MANUSCRIPT
22
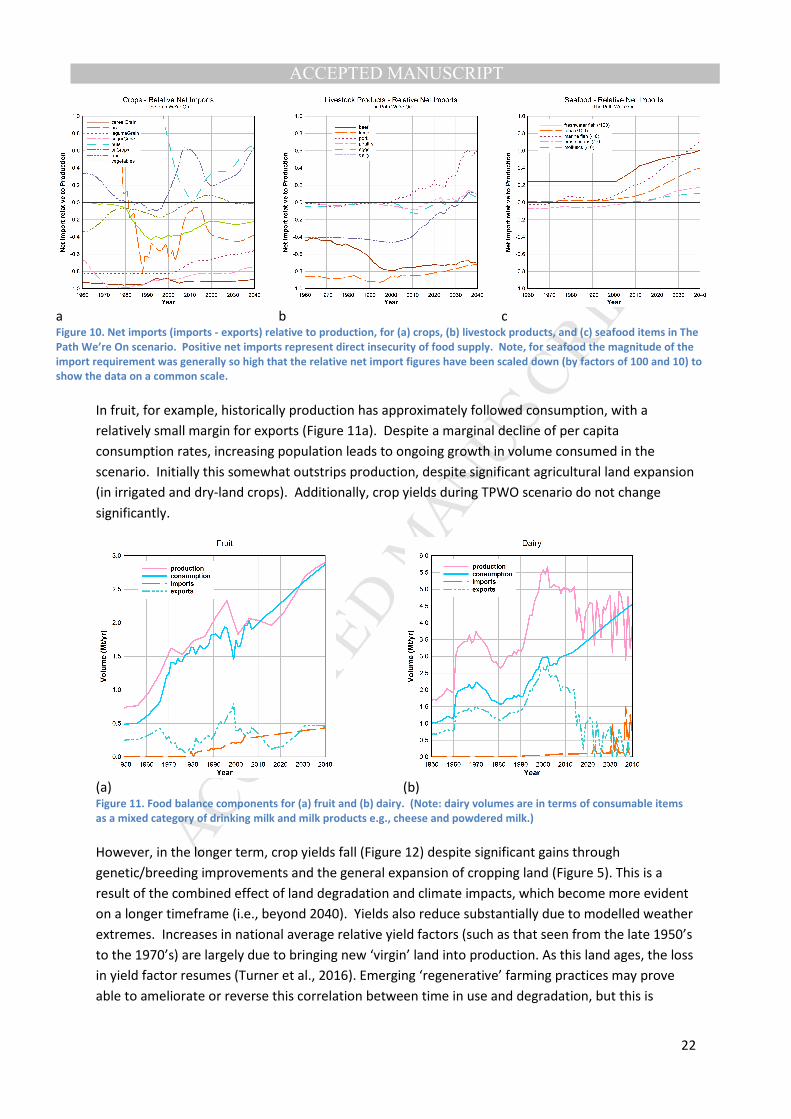
a b c Figure 10. Net imports (imports - exports) relative to production, for (a) crops, (b) livestock products, and (c) seafood items in The
Path We’re On scenario. Positive net imports represent direct insecurity of food supply. Note, for seafood the magnitude of the
import requirement was generally so high that the relative net import figures have been scaled down (by factors of 100 and 10) to
show the data on a common scale.
In fruit, for example, historically production has approximately followed consumption, with a
relatively small margin for exports (Figure 11a). Despite a marginal decline of per capita
consumption rates, increasing population leads to ongoing growth in volume consumed in the
scenario. Initially this somewhat outstrips production, despite significant agricultural land expansion
(in irrigated and dry-land crops). Additionally, crop yields during TPWO scenario do not change
significantly.
(a) (b) Figure 11. Food balance components for (a) fruit and (b) dairy. (Note: dairy volumes are in terms of consumable items
as a mixed category of drinking milk and milk products e.g., cheese and powdered milk.)
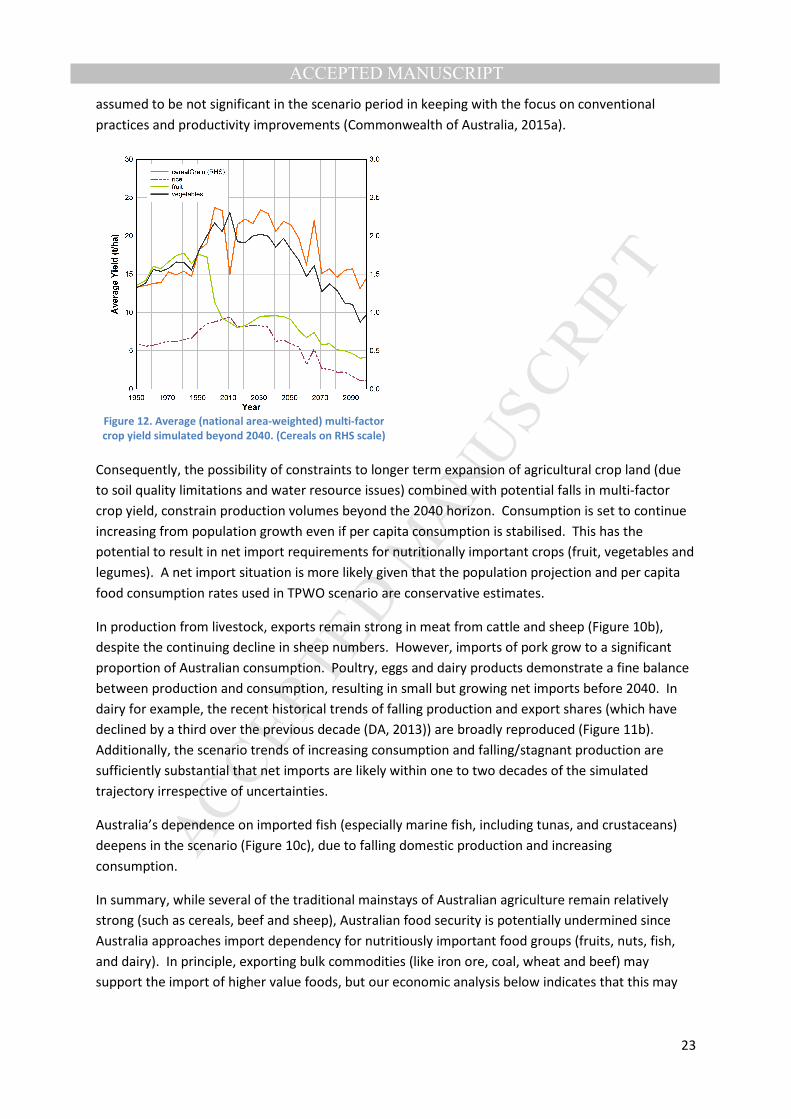
However, in the longer term, crop yields fall (Figure 12) despite significant gains through
genetic/breeding improvements and the general expansion of cropping land (Figure 5). This is a
result of the combined effect of land degradation and climate impacts, which become more evident
on a longer timeframe (i.e., beyond 2040). Yields also reduce substantially due to modelled weather
extremes. Increases in national average relative yield factors (such as that seen from the late 1950’s
to the 1970’s) are largely due to bringing new ‘virgin’ land into production. As this land ages, the loss
in yield factor resumes (Turner et al., 2016). Emerging ‘regenerative’ farming practices may prove
able to ameliorate or reverse this correlation between time in use and degradation, but this is
MANUSCRIP
T
ACCEPTED
ACCEPTED MANUSCRIPT
23
assumed to be not significant in the scenario period in keeping with the focus on conventional
practices and productivity improvements (Commonwealth of Australia, 2015a).
Figure 12. Average (national area-weighted) multi-factor
crop yield simulated beyond 2040. (Cereals on RHS scale)
Consequently, the possibility of constraints to longer term expansion of agricultural crop land (due
to soil quality limitations and water resource issues) combined with potential falls in multi-factor
crop yield, constrain production volumes beyond the 2040 horizon. Consumption is set to continue
increasing from population growth even if per capita consumption is stabilised. This has the
potential to result in net import requirements for nutritionally important crops (fruit, vegetables and
legumes). A net import situation is more likely given that the population projection and per capita
food consumption rates used in TPWO scenario are conservative estimates.
In production from livestock, exports remain strong in meat from cattle and sheep (Figure 10b),
despite the continuing decline in sheep numbers. However, imports of pork grow to a significant
proportion of Australian consumption. Poultry, eggs and dairy products demonstrate a fine balance
between production and consumption, resulting in small but growing net imports before 2040. In
dairy for example, the recent historical trends of falling production and export shares (which have
declined by a third over the previous decade (DA, 2013)) are broadly reproduced (Figure 11b).
Additionally, the scenario trends of increasing consumption and falling/stagnant production are
sufficiently substantial that net imports are likely within one to two decades of the simulated
trajectory irrespective of uncertainties.
Australia’s dependence on imported fish (especially marine fish, including tunas, and crustaceans)
deepens in the scenario (Figure 10c), due to falling domestic production and increasing
consumption.
In summary, while several of the traditional mainstays of Australian agriculture remain relatively
strong (such as cereals, beef and sheep), Australian food security is potentially undermined since
Australia approaches import dependency for nutritiously important food groups (fruits, nuts, fish,
and dairy). In principle, exporting bulk commodities (like iron ore, coal, wheat and beef) may
support the import of higher value foods, but our economic analysis below indicates that this may
MANUSCRIP
T
ACCEPTED
ACCEPTED MANUSCRIPT
24
not be guaranteed. Alternative socio-economic responses may also eventuate to alleviate the trade
exposure of Australia’s food balance, which we consider in the Discussion below.
3.3 Macro-economic outcomes
The macro-economic outcome of The Path We’re On scenario is a mixed picture. In our modelling,
the prices of goods, commodities, capital stocks and labour (i.e., wages) were not changed from the
values established in the historical calibration. Consequently, the macro-economic indicators reflect
the physical changes embodied in the scenario. This is quite adequate for strategic insights of
business-as-usual conditions.
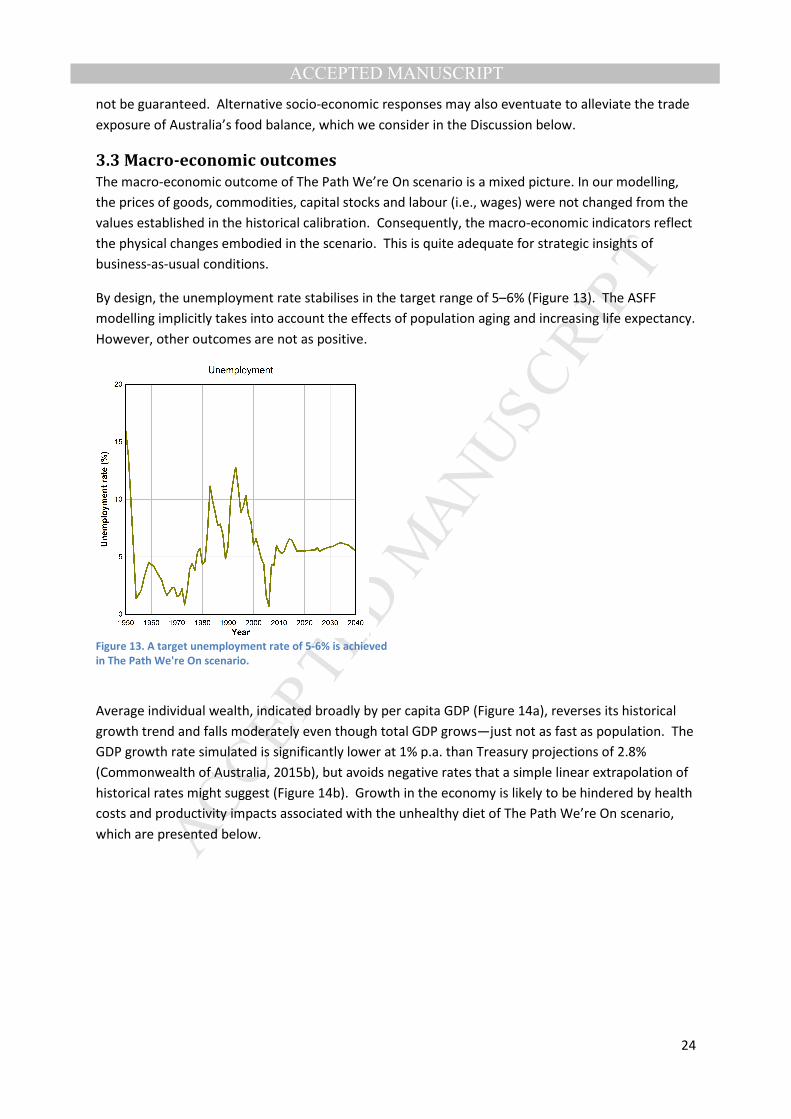
By design, the unemployment rate stabilises in the target range of 5–6% (Figure 13). The ASFF
modelling implicitly takes into account the effects of population aging and increasing life expectancy.
However, other outcomes are not as positive.
Figure 13. A target unemployment rate of 5-6% is achieved
in The Path We're On scenario.
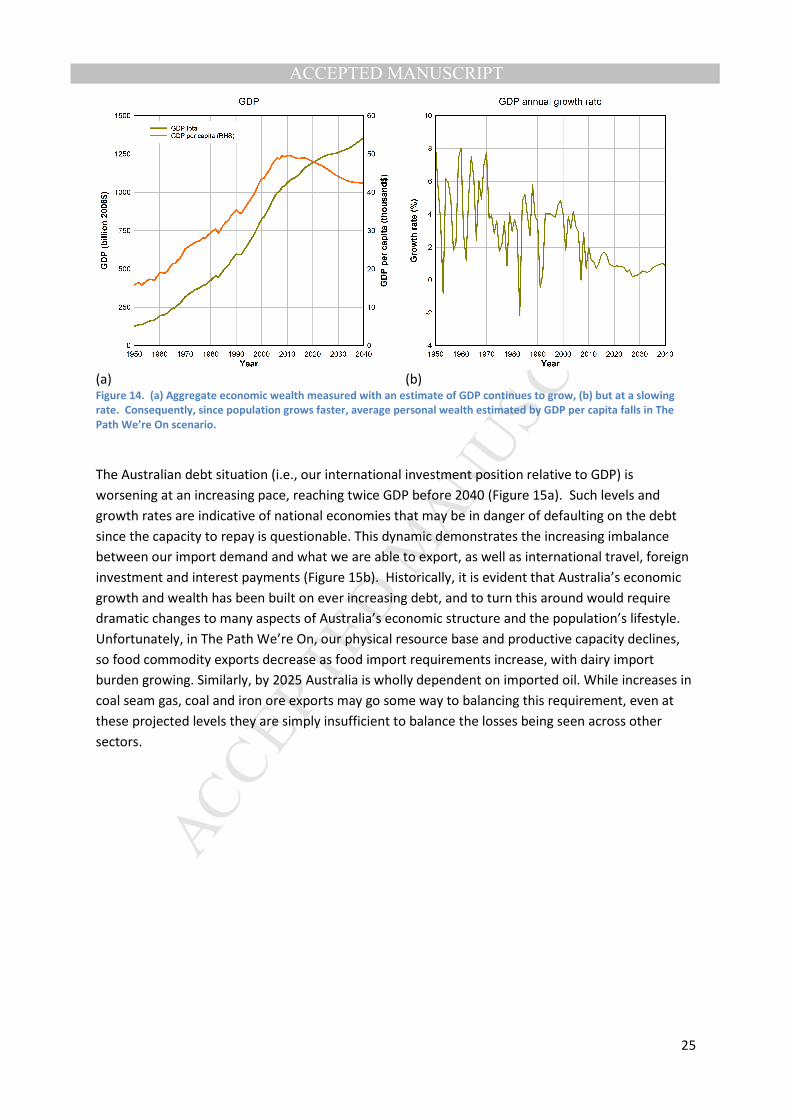
Average individual wealth, indicated broadly by per capita GDP (Figure 14a), reverses its historical
growth trend and falls moderately even though total GDP grows—just not as fast as population. The
GDP growth rate simulated is significantly lower at 1% p.a. than Treasury projections of 2.8%
(Commonwealth of Australia, 2015b), but avoids negative rates that a simple linear extrapolation of
historical rates might suggest (Figure 14b). Growth in the economy is likely to be hindered by health
costs and productivity impacts associated with the unhealthy diet of The Path We’re On scenario,
which are presented below.
MANUSCRIP
T
ACCEPTED
ACCEPTED MANUSCRIPT
25
(a) (b) Figure 14. (a) Aggregate economic wealth measured with an estimate of GDP continues to grow, (b) but at a slowing
rate. Consequently, since population grows faster, average personal wealth estimated by GDP per capita falls in The
Path We’re On scenario.
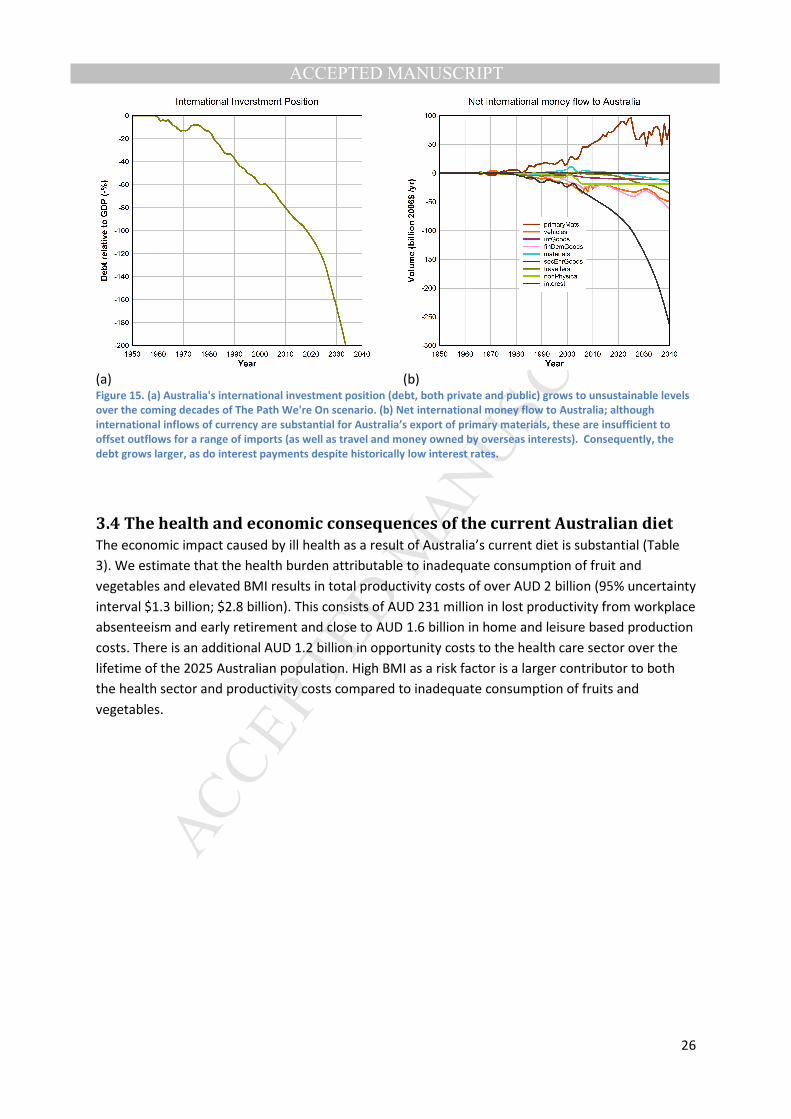
The Australian debt situation (i.e., our international investment position relative to GDP) is
worsening at an increasing pace, reaching twice GDP before 2040 (Figure 15a). Such levels and
growth rates are indicative of national economies that may be in danger of defaulting on the debt
since the capacity to repay is questionable. This dynamic demonstrates the increasing imbalance
between our import demand and what we are able to export, as well as international travel, foreign
investment and interest payments (Figure 15b). Historically, it is evident that Australia’s economic
growth and wealth has been built on ever increasing debt, and to turn this around would require
dramatic changes to many aspects of Australia’s economic structure and the population’s lifestyle.
Unfortunately, in The Path We’re On, our physical resource base and productive capacity declines,
so food commodity exports decrease as food import requirements increase, with dairy import
burden growing. Similarly, by 2025 Australia is wholly dependent on imported oil. While increases in
coal seam gas, coal and iron ore exports may go some way to balancing this requirement, even at
these projected levels they are simply insufficient to balance the losses being seen across other
sectors.
MANUSCRIP
T
ACCEPTED
ACCEPTED MANUSCRIPT
26
(a) (b) Figure 15. (a) Australia's international investment position (debt, both private and public) grows to unsustainable levels
over the coming decades of The Path We're On scenario. (b) Net international money flow to Australia; although
international inflows of currency are substantial for Australia’s export of primary materials, these are insufficient to
offset outflows for a range of imports (as well as travel and money owned by overseas interests). Consequently, the
debt grows larger, as do interest payments despite historically low interest rates.
3.4 The health and economic consequences of the current Australian diet
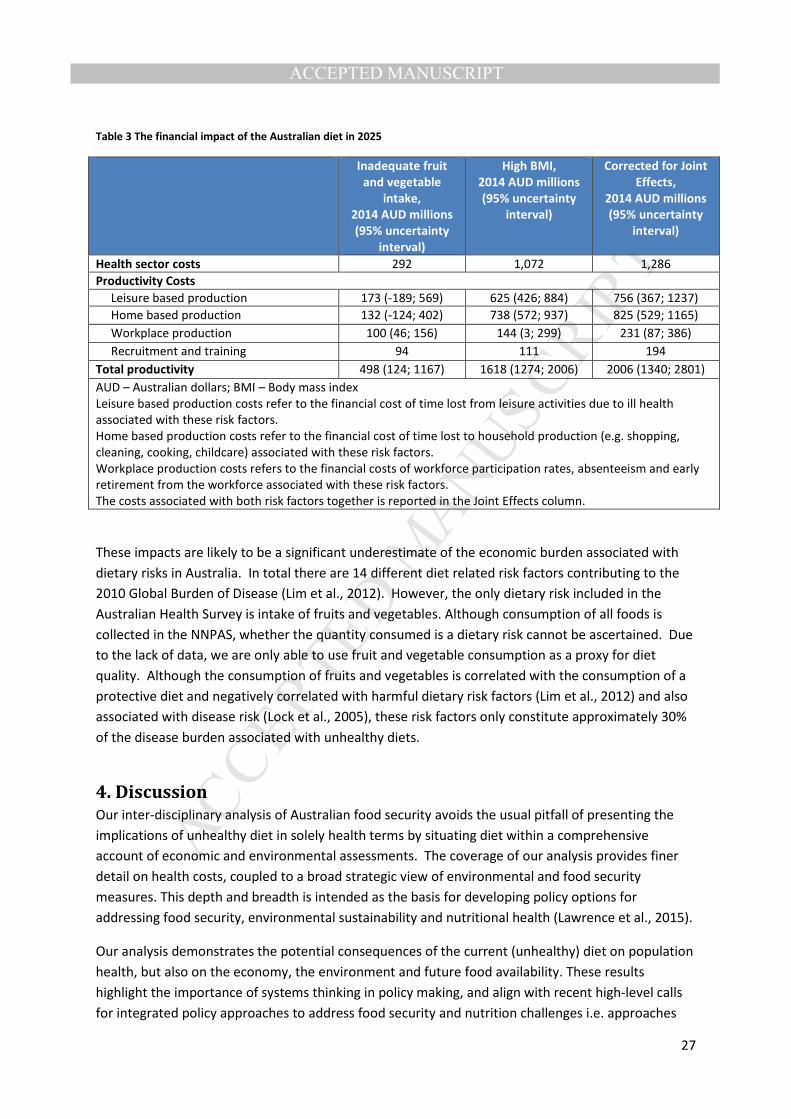
The economic impact caused by ill health as a result of Australia’s current diet is substantial (Table
3). We estimate that the health burden attributable to inadequate consumption of fruit and
vegetables and elevated BMI results in total productivity costs of over AUD 2 billion (95% uncertainty
interval $1.3 billion; $2.8 billion). This consists of AUD 231 million in lost productivity from workplace
absenteeism and early retirement and close to AUD 1.6 billion in home and leisure based production
costs. There is an additional AUD 1.2 billion in opportunity costs to the health care sector over the
lifetime of the 2025 Australian population. High BMI as a risk factor is a larger contributor to both
the health sector and productivity costs compared to inadequate consumption of fruits and
vegetables.
MANUSCRIP
T
ACCEPTED
ACCEPTED MANUSCRIPT
27
Table 3 The financial impact of the Australian diet in 2025
Inadequate fruit
and vegetable
intake,
2014 AUD millions
(95% uncertainty
interval)
High BMI,
2014 AUD millions
(95% uncertainty
interval)
Corrected for Joint
Effects,
2014 AUD millions
(95% uncertainty
interval)
Health sector costs 292 1,072 1,286
Productivity Costs
Leisure based production 173 (-189; 569) 625 (426; 884) 756 (367; 1237)
Home based production 132 (-124; 402) 738 (572; 937) 825 (529; 1165)
Workplace production 100 (46; 156) 144 (3; 299) 231 (87; 386)
Recruitment and training 94 111 194
Total productivity 498 (124; 1167) 1618 (1274; 2006) 2006 (1340; 2801)
AUD – Australian dollars; BMI – Body mass index
Leisure based production costs refer to the financial cost of time lost from leisure activities due to ill health
associated with these risk factors.
Home based production costs refer to the financial cost of time lost to household production (e.g. shopping,
cleaning, cooking, childcare) associated with these risk factors.
Workplace production costs refers to the financial costs of workforce participation rates, absenteeism and early
retirement from the workforce associated with these risk factors.
The costs associated with both risk factors together is reported in the Joint Effects column.
These impacts are likely to be a significant underestimate of the economic burden associated with
dietary risks in Australia. In total there are 14 different diet related risk factors contributing to the
2010 Global Burden of Disease (Lim et al., 2012). However, the only dietary risk included in the
Australian Health Survey is intake of fruits and vegetables. Although consumption of all foods is
collected in the NNPAS, whether the quantity consumed is a dietary risk cannot be ascertained. Due
to the lack of data, we are only able to use fruit and vegetable consumption as a proxy for diet
quality. Although the consumption of fruits and vegetables is correlated with the consumption of a
protective diet and negatively correlated with harmful dietary risk factors (Lim et al., 2012) and also
associated with disease risk (Lock et al., 2005), these risk factors only constitute approximately 30%
of the disease burden associated with unhealthy diets.
4. Discussion Our inter-disciplinary analysis of Australian food security avoids the usual pitfall of presenting the
implications of unhealthy diet in solely health terms by situating diet within a comprehensive
account of economic and environmental assessments. The coverage of our analysis provides finer
detail on health costs, coupled to a broad strategic view of environmental and food security
measures. This depth and breadth is intended as the basis for developing policy options for
addressing food security, environmental sustainability and nutritional health (Lawrence et al., 2015).
Our analysis demonstrates the potential consequences of the current (unhealthy) diet on population
health, but also on the economy, the environment and future food availability. These results
highlight the importance of systems thinking in policy making, and align with recent high-level calls
for integrated policy approaches to address food security and nutrition challenges i.e. approaches
MANUSCRIP
T
ACCEPTED
ACCEPTED MANUSCRIPT
28
that support coordinated action across multiple sectors and at local, national, regional and
international levels (FAO/WHO, 2014a, 2014b).
At the national level, a stand-alone nutrition policy can provide a framework for coordinated action
(FAO/WHO, 2014b). Our conservative estimates suggest that continued consumption of Australia’s
current diet could amount to more than AUD 2 billion in total productivity costs plus an additional
AUD 1.2 billion in opportunity costs to the health care sector. These estimates support recent calls
for a new national nutrition policy for Australia to promote population health and wellbeing and
reduce the burden of diet-related disease (Pulblic Health Association of Australia, 2017).
Recommendations from a recently-released scoping study to inform the development of such a
policy highlight the need for an integrated, multi-sectoral policy approach (Lee et al., 2013). The
authors argue that nutrition and health-related goals cannot be achieved without addressing the
socio-economic disparities and food supply challenges that underpin poor health in Australia. For
this reason, they recommend that a new national nutrition policy includes explicit goals around
social equity and environmental sustainability.
Nutrition objectives can also be incorporated into other national polices (FAO/WHO, 2014b). Trade,
agricultural, economic, social and environmental policies can support food security and public health
nutrition by ensuring a consistent supply of nutritious food is available and accessible to all members
of the population (FAO, 2015c; Friel and Ford, 2015). Regulatory interventions such as changes to
food labelling standards may also play a role in promoting health and environmental sustainability
by supporting consumer behaviour change (Hoek et al., 2017a, 2017b). Our scenario modelling
results suggest that agriculture will continue to be a substantial contributor to increased GHG
emissions and environmental resource use. Results also suggest that Australia may become
increasingly reliant on imported fruit, nuts, fish and dairy, which in the event of global food system
‘shocks’ has the potential to undermine future food security and nutrition (Ericksen, 2008; Lawrence
et al., 2015). These results support criticisms that Australia’s national food and agricultural policies
have focused on the economic value of food production and trade at the expense of public health
and environmental sustainably (Carey et al., 2016; Lawrence et al., 2012; Ridgway et al., 2015).
The complexity and scale of our analysis dictated a scenario modelling approach in order to
incorporate a vast range of influences. The scenario we developed—The Path We’re On—and its
medium timeframe endeavours to avoid a normative position by embodying current trends and
policy directions, and does not attempt to resolve the tensions that arise. Consequently, different
strategies and policy responses can be explored and compared in subsequent modelling. The
detailed numerical nature and deep historical calibration of our modelling allows for rigorous
evaluation, though there is potential for findings to be inappropriately attributed with undue
certainty or precision.
Indeed, we stress that the outcomes of The Path We’re On scenario are not predictions per se, but
rather conditional forecasts, depending entirely on the assumptions used. Considerable effort was
invested in determining settings in the biophysical modelling founded on current policy and
dominant expectations. Nevertheless, uncertainty naturally abounds, not just in the policy domain
but also in background data in the model. In many areas this has little effect on the overall
aggregate modelling outcomes, such as population, gross food production, GDP and debt, due to the
inertia associated with their large driving factors, which overwhelm minor balancing components.
MANUSCRIP
T
ACCEPTED
ACCEPTED MANUSCRIPT
29
Results are more sensitive where a fine balance exists between factors, though broad conclusions
may still be drawn. For instance, a food balance for fruit may shift from net exports to net imports
relatively readily because production and consumption are (historically) close and both are relatively
large volumes so small changes in either produce large net effects. Similarly, several water regions
(particularly around capital cities) may shift between surplus and deficit of net surface flows because
availability and consumption have converged; availability has typically fallen in recent decades
probably due to early climate change impacts and consumption has increased through population
and economic growth. Although the actual timing of a shift from surplus to deficit (or exports to
imports) depends on the precise cross-over of availability and consumption, the shift is inevitable if
the underlying trends continue.
These dynamics illustrate the precarious situation of eroding environmental or resource buffers in
seeking economic efficiency and growth. This finding contrasts with the qualitative outlook of
“stronger farmers, stronger economy” presumed in the government’s recent Agriculture
Productivity Report (Commonwealth of Australia, 2015a). Despite substantial productivity gains in
The Path We’re On scenario, we find Australia has effectively squandered the opportunity for a high
quality sustainable future—our population and economy have expanded, and our climate, land, oil
and water resources have degraded, to the extent that avoidance of some form of socio-economic
decline appears inevitable unless drastic changes are implemented rapidly. It is no longer viable to
pay for environmental remedies by growing the economy, as some argue, since further growth
accelerates our environmental degradation and resource depletion. Unfortunately, growth in
several key factors—especially population and climate change—is virtually inevitable in the short
term. Additionally, higher efficiency and technological advances alone fail to avert our dilemma, not
least because conventionally they help fuel economic growth (Turner, 2011).
Nevertheless, economic growth may not be assured. For instance, the availability of reasonably
priced international oil is not guaranteed if growth of the global economy resumes and a dramatic
shortage of supply or price fluctuations and shifts could significantly worsen Australia’s trade
balance or disrupt the economy. Also, the economic cost of an unhealthy diet is a long term burden,
and although aspects such as medical treatment add to GDP they do not enhance productive
capacity.
It is also clear that past Australian growth has been based on even faster growth in international
debt, but this formula cannot be sustained for long as debt rises above GDP (this is particularly an
issue given the global financial uncertainty). The majority of this debt is private, not public, and has
fuelled potentially unsustainable growth in property values, which does not provide a productive
basis for the economy to repay the debt. In recent years, much reliance was placed on a mining
boom based on Chinese demand to bolster the Australian economy and ease the trade balance.
However, the transition of the Chinese economy from physical investment toward domestic
consumption, and its own economic instability, means that The Path We’re On assumptions of
continued mineral export growth are more uncertain. A resulting escalation in our trade-imbalance
and hence debt could have far-reaching impacts, at least on Australia’s ability to import critical food
commodities and oil, but potentially undermining economic growth. Although a lack of growth may
alleviate some environmental pressures, it may also lead to social unrest.
MANUSCRIP
T
ACCEPTED
ACCEPTED MANUSCRIPT
30
In contrast to the uncertainty surrounding economic conditions, the considerable inertia of the
climate system means that impacts from anthropogenic greenhouse gases are likely to worsen for
some decades, even with a global consensus on emission reductions. Nevertheless, understanding
of the detailed quantitative nature of impacts is still developing and our modelling would benefit
from these. Additionally, we have only applied assumptions of climate change impacts to
agricultural production and water resources. Consequently, the environmental and economic
implications of other factors have not been included, such as bushfire, storm damage, heat-waves,
and flooding. Therefore The Path We’re On simulation outcomes for agriculture and the broader
economy are more positive than can generally be expected.
5. Conclusions This modelling has revealed serious tensions in Australia’s desired energy use, land use, food
production and population health that will emerge by 2025 and subsequent years. Overall, the
environmental, economic and food security outcomes of The Path We’re On scenario are
challenging. Australia becomes substantially reliant on imports before 2040 for many nutritious
food types, particularly nuts, fish and dairy. This situation occurs in the context of the current diet in
which the consumption of many of these food types are significantly below recommended intake.
The current inadequate intake of fruit and vegetables for almost half the population has occurred in
a historic context of abundance, accessibility and affordability (for most of the population) of these
foods and so is more a reflection of strong cultural preferences rather than the artefact of scarcity or
un-affordability of these foods. However, for sections of the population, nutritious food is not
necessarily affordable even now and this may be further exacerbated with scarcity of domestic
supply.
The economic and financial burden associated with the health impact of inadequate consumption of
fruits and vegetables and unhealthy diets resulting in elevated BMI is substantial, with total
opportunity costs estimated to be over AUD 3 billion for the 2025 Australian population. This is
likely to be an under-estimate of the true impact of unhealthy diets, as only two of the fourteen
dietary risks were incorporated into the analysis. A disproportional impact is likely on lower socio-
economic groups, and this will only increase with predicted increases in costs of highly nutritional
foodstuffs into the future. The analysis has shown that the health impacts and the resultant
financial impacts provide adequate incentive for Australian governments to make policy changes to
enable Australians to consume a healthy diet.
Environmentally, water resources become increasingly stressed around most of the capital cities,
and in some regions of Australia’s southern food-bowl, the Murray-Darling Basin. Land degradation
continues to advance and fish stocks decline further, with some heading toward serious over-
exploitation. While many mineral resources are available in such abundance that they could support
long-term growth in mining and exports (provided there is sufficient global demand and ability to
pay), domestic oil resources appear destined to be essentially exhausted within 1–2 decades.
Consequently, Australia would become hostage to international vagaries in the global oil market.
Conventional argument posits that we will simply trade our way out of this dilemma, but this is not
consistent with the economic outcomes of The Path We’re On scenario.
MANUSCRIP
T
ACCEPTED
ACCEPTED MANUSCRIPT
31
Economically, Australia’s current pathway does not appear to be in a position to emerge from the
lingering effects of the GFC in a more prosperous state in coming decades—instead, economic
conditions decline substantially over the scenario period. Average material wealth (indicated
approximately by GDP per capita) actually falls, since population growth is higher than growth in
GDP. This is despite strong advances in efficiencies and productivity across the economy.
Simultaneously, Australia’s relative international debt—which is largely private not public debt—
worsens at an accelerating pace (even as a percentage of GDP), approaching levels by 2040 that
draw into question Australia’s ability to service the debt. This is despite assumed aggressive
expansion of mineral exports. At the very least, this economic outlook does not auger well for
purchasing food, oil or other critical resources on the international market, especially when global
food production is coming under increasing pressure.
In this research, we have deliberately avoided any attempt to address these significant challenges
that result from current trends and policies. Our modelling results provide the foundation for the
next stage of our project, in which alternative future scenarios are explored, seeking to resolve the
physical, environmental and health outcomes, and to ensure Australia is able to provide for a
sustainable and healthy diet for the population. Particular areas identified for further research
include the development of alternative/contrasting scenarios to explore: the environmental
resource and food availability implications of a population-wide shift towards consumption of a
healthier diet; different production methods within the agricultural sector to explore the impact on
land degradation and resource use and; the impacts of implementing technologies with lower
environmental impacts in other sectors, such as energy and transport, to ease overall resource
tensions and take the pressure off agriculture.
MANUSCRIP
T
ACCEPTED
ACCEPTED MANUSCRIPT
32
References ABARES, (2010) Land use in Australia at a glance 2006. Australian Collaborative Land Use and
Management Program (ACLUMP), Australian Bureau of Agriculture and Resource Economics and
Services.
ABS, (2006) 1301.0 - Year Book Australia, 2006 - The Australian Wheat Industry %U
http://www.abs.gov.au/ausstats/[email protected]/Previousproducts/1301.0Feature%20Article212006?ope
ndocument&tabname=Summary&prodno=1301.0&issue=2006&num=&view=.
ABS, (2008) 4613.0 - Australia's Environment: Issues and Trends, 2007 %U
http://www.abs.gov.au/ausstats/[email protected]/7d12b0f6763c78caca257061001cc588/afcfddc135e88a8
cca2573c600103937!OpenDocument.
ABS, (2013a) 3218.0 - Regional Population Growth, Australia, 2011-12 %U
http://www.abs.gov.au/ausstats/[email protected]/Products/3218.0~2011-
12~Main+Features~Main+Features?OpenDocument.
ABS, (2013b) 4364.0.55.003 - Australian Health Survey: Updated Results, 2011-12. The
Commonwealth of Australia, Canberra, Australia.
ABS, (2014) Australian Health Survey: Nutrition First Results – Food and Nutrients, 2011-12.
Australian Bureau of Statistics.
Andreyeva, T., Long, M.W., Brownell, K.D. (2010) The Impact of Food Prices on Consumption: A
Systematic Review of Research on the Price Elasticity of Demand for Food. Am J Public Health 100,
216-222.
anon, (2006) Measures for Improving the Environmental Sustainability of Building Materials -
Scoping study to investigate measures for improving the environmental sustainability of building
materials. Centre for Design at RMIT University, Melbourne.
Asseng, S., Foster, I.A.N., Turner, N.C. (2011) The impact of temperature variability on wheat yields.
Global Change Biology 17, 997-1012.
Australian Institute of Health and Welfare, (2014) Allocated health expenditure 2008-09, in:
Australian Institute of Health and Welfare (Ed.). Australian Institute of Health and Welfare,,
Canberra.
Baynes, T.M., Turner, G.M., West, J., (2009) Historical Calibration of a Water Accounting System;
CSIRO SEED Working Paper 29.
Birnbaum, H. (2005) Friction-Cost Method as an Alternative to the Human-Capital Approach in
Calculating Indirect Costs. Pharmacoeconomics 23, 103-104.
Blewett, N., (2011) Labelling Logic: Review of Food Labelling Law and Policy. Commonwealth of
Australia, Canberra.
Bradbear, C., Friel, S. (2013) Integrating climate change and health into food policy: An analysis of
how climate change can affect food prices and population health. Food Policy 43, 56-66.
MANUSCRIP
T
ACCEPTED
ACCEPTED MANUSCRIPT
33
BREE, (2014a) 2014 Australian Energy Update. Australian Government, Canberra Australia.
BREE, (2014b) Australian Energy Projections to 2049-50. Bureau of Resources and Energy Economics,
Canberra.
Bureau of Infrastructure, T.a.R.E.B., (2014) The evolution of Australian towns. Department of
Infrastructure and Regional Development, Canberra.
Cadilhac, D.A., Cumming, T.B., Sheppard, L., Pearce, D.C., Carter, R., Magnus, A. (2011a) The
economic benefits of reducing physical inactivity: an Australian example. Int J Behav Nutr Phys Act 8,
99.
Cadilhac, D.A., Magnus, A., Cumming, T.B., Sheppard, L., Pearce, D.C., Carter, R., (2009) The heath
and economic benefits of reducing disease risk factors VicHealth, Victoria.
Cadilhac, D.A., Magnus, A., Sheppard, L., Cumming, T.B., Pearce, D.C., Carter, R. (2011b) The societal
benefits of reducing six behavioural risk factors: an economic modelling study from Australia. BMC
Public Health, 11, 483.
Cadilhac, D.A., Sheppard, L., Cumming, T.B., Thayabaranathan, T., Pearce, D.C., Carter, R., Magnus, A.
(2015) The health and economic benefits of reducing intimate partner violence: an Australian
example. BMC Public Health 15, 625.
Candy, S., Biggs, C., Larsen, K., Turner, G. (2015) Modelling food system resilience: a scenario-based
simulation modelling approach to explore future shocks and adaptations in the Australian food
system. Journal of Environmental Studies and Sciences 5.
Cassidy, E.S., West, P.C., Gerber, J.S., Foley, J.A., 2013. Redefining agricultural yields: from tonnes to
people nourished per hectare. Environ. Res. Lett. 8, 034015. doi:10.1088/1748-9326/8/3/034015
Carey, R., Caraher, M., Lawrence, M., Friel, S., 2016. Opportunities and challenges in developing a
whole-of-government national food and nutrition policy: lessons from Australia’s National Food
Plan. Public Health Nutr. 19, 3–14.
Carey, R., Larsen, K., Sheridan, J., Candy, S., 2016. Melbourne’s food future: Planning a resilient city
foodbowl. Victorian Eco-Innovation Lab, The University of Melbourne, Melbourne, VIC.
Ceccarelli, S., Grando, S., Maatougui, M., Michael, M., Slash, M., Haghparast, R., Rahmanian, M.,
Taheri, A., Al-Yassin, A., Benbelkacem, A., et al. (2010) Plant breeding and climate changes. The
Journal of Agricultural Science 148, 627-637.
CEDA, (2012) Australia's Unconventional Energy Options, Melbourne.
Chapman, K., Kelly, B., Bauman, A., Innes-Hughes, C., Allman-Farinelli, M. (2014) Trends in the cost of
a healthy food basket and fruit and vegetable availability in New South Wales, Australia, between
2006 and 2009. Nutrition & Dietetics 71, 117-126.
Chen, C., Randall, A. (2013) The Economic Contest Between Coal Seam Gas Mining and Agriculture
on Prime Farmland: It May Be Closer than We Thought. Journal of Economic and Social Policy 15,
0_1,0_2,1-30.
MANUSCRIP
T
ACCEPTED
ACCEPTED MANUSCRIPT
34
Coates, J. (2013) Build it back better: Deconstructing food security for improved measurement and
action. Global Food Security 2, 188-194.
Commonwealth of Australia, 2015a. Agricultural Competitiveness White Paper - Stronger farmer,
stronger economy. Commonwealth of Australia, Canberra, Australia.
Commonwealth of Australia, 2015b. 2015 Intergenerational Report. The Treasury, Commonwealth of
Australia, Canberra, Australia.
Commonwealth of Australia, 2015c. The Emissions Reduction Fund—What it means for you.
Commonwealth of Australia, Canberra, Australia.
Commonwealth of Australia, 2015d. The Renewable Energy Target (RET) scheme. Commonwealth of
Australia, Canberra, Australia.
Commonwealth of Australia, 2015e. Austrade. Commonwealth of Australia, Canberra, Australia.
DA, (2013) Australian Dairy Industry in Focus 2013. Dairy Australia.
DAFF, (2013) National Food Plan: Our food future. Department of Agriculture, Fisheries and Forestry,
Canberra, Canberra Australia.
DoE, (2015) Watermark Coal Project-the facts. Department of the Environment, Australian
Government.
Dowler, E. (2008) Symposium on 'Intervention policies for deprived households' Policy initiatives to
address low-income households' nutritional needs in the UK. Proc Nutr Soc 67, 289-300.
Edwards, F., Dixon, J., Friel, S., Hall, G., Larsen, K., Lockie, S., Wood, B., Lawrence, M., Hanigan, I.,
Hogan, A., Hattersley, L. (2011) Climate change adaptation at the intersection of food and health.
Asia Pac J Public Health 23, 91S-104.
Ericksen, P.J., Ingram, J.S.I., Liverman, D.M. (2009) Food security and global environmental change:
emerging challenges. Environmental Science & Policy 12, 373-377 %U <Go to
ISI>://WOS:000267515300001.
Ericksen, P.J., 2008. What Is the Vulnerability of a Food System to Global Environmental Change ?
Ecol. Soc. 13.
ESCAP, (2009) Sustainable Agriculture and Food Security in Asia and the Pacific. United Nations
Economic and Social Commission for Asia and the Pacific, Bangkok.
FAO, (2013) Food wastage footprint: Impacts on natural resources - Summary report. Food and
Agriculture Organisation of the United Nations %U
http://www.fao.org/docrep/018/i3347e/i3347e.pdf.
FAO, (2015a) Climate change and food systems: global assessments and implications for food
security and trade.
FAO, (2015b) The FAO-UNEP Sustainable Food Systems Programme. FAO.
MANUSCRIP
T
ACCEPTED
ACCEPTED MANUSCRIPT
35
FAO, (2015c). The state of agricultural commodity markets. Trade and food security: achieving a
better balance between national priorities and the collective good. Food and Agricultural
Organisation of the United Nations, Rome, Italy.
FAO/WHO, 2014a. Rome declaration on nutrition. Second International Conference on Nutrition
(ICN2). Food and Agricultural Organisation of the United Nations / World Health Organisation, Rome,
Italy.
FAO/WHO, 2014b. Framework for action, Second International conference on nutrition (ICN2). Food
and Agricultural Organisation of the United Nations / World Health Organisation, Rome, Italy.
Farmar-Bowers, Q., Higgins, V., Millar, J., (2012) Food Security in Australia. Springer.
Ferguson, M., O'Dea, K., Chatfield, M., Moodie, M., Altman, J., Brimblecombe, J. (2015) The
comparative cost of food and beverages at remote Indigenous communities, Northern Territory,
Australia. Australian and New Zealand Journal of Public Health, n/a-n/a.
Foodbank, (2012) End hunger in Australia. Foodbank Australia, North Ryde, NSW.
Friel, S., Ford, L., 2015. Systems, food security and human health. Food Secur. 7, 437–51.
Friel, S. (2010a) Climate change, food insecurity and chronic diseases: sustainable and healthy policy
opportunities for Australia. New South Wales Public Health Bulletin 21, 129 %U
http://www.publish.csiro.au/?paper=NB10019.
Friel, S. (2010b) Climate change, food insecurity and chronic diseases: sustainable and healthy policy
opportunities for Australia. N S W Public Health Bull 21, 129-133.
Friel, S., Conlon, C. (2004) What is the extent of food poverty in Ireland? European Journal of Public
Health 13, 133-140.
FSANZ, (2015) AUSNUT 2011-13 food recipe file, in: Zealand, F.S.A.N. (Ed.).
Gault, F.D., Hamilton, K.E., Hoffman, R.B., McInnis, B.C. (1987) The design approach to socio-
economic modelling. Futures 19, 3–25.
GISERA, (2014) Frequently asked questions on coal seam gas extraction and fraccing. Gas Industry
Social & Environmental Research Alliance.
Godfray, H.C.J., Beddington, J.R., Crute, I.R., Haddad, L., Lawrence, D., Muir, J.F., Pretty, J., Robinson,
S., Thomas, S.M., Toulmin, C., 2010. Food Security: The Challenge of Feeding 9 Billion People. Science
327, 812–818. doi:10.1126/science.1185383
Godfray, H.C.J., Crute, I.R., Haddad, L., Lawrence, D., Muir, J.F., Nisbett, N., Pretty, J., Robinson, S.,
Toulmin, C., Whiteley, R., 2010b. The future of the global food system. Philos. Trans. R. Soc. B Biol.
Sci. 365, 2769–2777. doi:10.1098/rstb.2010.0180
Gunasekera, D., Kim, Y., Tulloh, C., Ford, M. (2007) Climate change: Impacts on Australian
Agriculture. Australia Commodities 14, 657-676.
Hoek, A.C., Pearson, D., James, S., Lawrence, M.A., Friel, S., 2017a. Healthy and environmentally
sustainable food choices: Consumer responses to point-of-purchase actions. Food Qual. Prefer. 58,
94–106.
MANUSCRIP
T
ACCEPTED
ACCEPTED MANUSCRIPT
36
Hoek, A.C., Pearson, D., James, S., Lawrence, M., Friel, S., 2017b. Shrinking the food-print: A
qualitative study into consumer perceptions, experiences and attitudes towards healthy and
environmentally friendly food behaviours. Appetite 108, 117–31.
Ingram, J. (2011) A food systems approach to researching food security and its interactions with
global environmental change. Food Security 3, 417-431 %U <Go to ISI>://WOS:000297836900004.
Institute for Health Metrics and Evaluation, (2015a) GBD Cause Patterns - % total DALYs. University
of Washington, Seattle.
Institute for Health Metrics and Evaluation, (2015b) GBD Cause Patterns - DALYs. University of
Washington, Seattle.
Institute for Health Metrics and Evaluation, (2015c) GBD Cause Patterns - Deaths. University of
Washington, Seattle.
IPRI, (2015) 2014-2015 Global Food Policy Report. International Food Policy Research Institute
(IFPRI), Washington, DC.
Keating, B.A., Carberry, P.S. (2010) Emerging opportunities and challenges for Australian broadacre
agriculture. Crop and Pasture Science 61, 269 %U http://www.publish.csiro.au/?paper=CP09282.
Kettings, C., Sinclair, A., Voevodin, M. (2009) A healthy diet consistent with Australian health
recommendations is too expensive for welfare-dependent families. Australian and New Zealand
Journal of Public Health 33, 566-572.
Koutsogeorgopoulou, V., Barbiero, O., (2013) Boosting Productivity in Australia, in: Department, O.E.
(Ed.), Working Papers No. 1025 ed.
Larsen, K., Turner, G.M., Ryan, C., Lawrence, M., (2011) Victorian Food Supply Scenarios: Impacts on
availability of a nutritious diet. Victorian Eco-Innovation Lab (VEIL), University of Melbourne,
Melbourne, Australia.
Lawrence G, Richards C, Lyons K (2013) Food security in Australia in an era of neoliberalism,
productivism and climate change. Journal of Rural Studies 29, 30-39.
Lawrence, G., Richards, C., Lyons, K. (2012) Food security in Australia in an era of neoliberalism,
productivism and climate change %U
http://linkinghub.elsevier.com/retrieve/pii/S0743016711001318. Journal of Rural Studies.
Lawrence, M.A., Friel, S., Wingrove, K., James, S.W., Candy, S., 2015. Formulating policy activities to
promote healthy and sustainable diets. Public Health Nutr. 1–8. doi:10.1017/S1368980015002529
Lawrence, M., Worsley, A., 2007. Concepts and Guiding Principles, in: Public Health Nutrition: From
Principles to Practice. Allen & Unwin, Sydney and Open University Press, London, UK.
Lee, A., Baker, P., Stanton, R., Friel, S., O’Dea, K., Weightman, A., 2013. Scoping study to inform
development of the National Nutrition Policy for Australia. Released under FOI, March 2016.
Queensland University of Technology, Brisbane, Australia.
Lim, S.S., Vos, T., Flaxman, A.D., Danaei, G., Shibuya, K., Adair-Rohani, H., Amann, M., Anderson,
H.R., Andrews, K.G., Aryee, M., Atkinson, C., Bacchus, L.J., Bahalim, A.N., Balakrishnan, K., Balmes, J.,
MANUSCRIP
T
ACCEPTED
ACCEPTED MANUSCRIPT
37
Barker-Collo, S., Baxter, A., Bell, M.L., Blore, J.D., Blyth, F., Bonner, C., Borges, G., Bourne, R.,
Boussinesq, M., Brauer, M., Brooks, P., Bruce, N.G., Brunekreef, B., Bryan-Hancock, C., Bucello, C.,
Buchbinder, R., Bull, F., Burnett, R.T., Byers, T.E., Calabria, B., Carapetis, J., Carnahan, E., Chafe, Z.,
Charlson, F., Chen, H., Chen, J.S., Cheng, A.T.-A., Child, J.C., Cohen, A., Colson, K.E., Cowie, B.C.,
Darby, S., Darling, S., Davis, A., Degenhardt, L., Dentener, F., Des Jarlais, D.C., Devries, K., Dherani,
M., Ding, E.L., Dorsey, E.R., Driscoll, T., Edmond, K., Ali, S.E., Engell, R.E., Erwin, P.J., Fahimi, S.,
Falder, G., Farzadfar, F., Ferrari, A., Finucane, M.M., Flaxman, S., Fowkes, F.G.R., Freedman, G.,
Freeman, M.K., Gakidou, E., Ghosh, S., Giovannucci, E., Gmel, G., Graham, K., Grainger, R., Grant, B.,
Gunnell, D., Gutierrez, H.R., Hall, W., Hoek, H.W., Hogan, A., Hosgood, H.D., III, Hoy, D., Hu, H.,
Hubbell, B.J., Hutchings, S.J., Ibeanusi, S.E., Jacklyn, G.L., Jasrasaria, R., Jonas, J.B., Kan, H., Kanis, J.A.,
Kassebaum, N., Kawakami, N., Khang, Y.-H., Khatibzadeh, S., Khoo, J.-P., Kok, C., Laden, F., Lalloo, R.,
Lan, Q., Lathlean, T., Leasher, J.L., Leigh, J., Li, Y., Lin, J.K., Lipshultz, S.E., London, S., Lozano, R., Lu,
Y., Mak, J., Malekzadeh, R., Mallinger, L., Marcenes, W., March, L., Marks, R., Martin, R., McGale, P.,
McGrath, J., Mehta, S., Mensah, G.A., Merriman, T.R., Micha, R., Michaud, C., Mishra, V., Hanafiah,
K.M., Mokdad, A.A., Morawska, L., Mozaffarian, D., Murphy, T., Naghavi, M., Neal, B., Nelson, P.K.,
Nolla, J.M., Norman, R., Olives, C., Omer, S.B., Orchard, J., Osborne, R., Ostro, B., Page, A., Pandey,
K.D., Parry, C.D.H., Passmore, E., Patra, J., Pearce, N., Pelizzari, P.M., Petzold, M., Phillips, M.R., Pope,
D., Pope, C.A., III, Powles, J., Rao, M., Razavi, H., Rehfuess, E.A., Rehm, J.T., Ritz, B., Rivara, F.P.,
Roberts, T., Robinson, C., Rodriguez-Portales, J.A., Romieu, I., Room, R., Rosenfeld, L.C., Roy, A.,
Rushton, L., Salomon, J.A., Sampson, U., Sanchez-Riera, L., Sanman, E., Sapkota, A., Seedat, S., Shi, P.,
Shield, K., Shivakoti, R., Singh, G.M., Sleet, D.A., Smith, E., Smith, K.R., Stapelberg, N.J.C., Steenland,
K., Stöckl, H., Stovner, L.J., Straif, K., Straney, L., Thurston, G.D., Tran, J.H., Van Dingenen, R., van
Donkelaar, A., Veerman, J.L., Vijayakumar, L., Weintraub, R., Weissman, M.M., White, R.A.,
Whiteford, H., Wiersma, S.T., Wilkinson, J.D., Williams, H.C., Williams, W., Wilson, N., Woolf, A.D.,
Yip, P., Zielinski, J.M., Lopez, A.D., Murray, C.J.L., Ezzati, M. (2012) A comparative risk assessment of
burden of disease and injury attributable to 67 risk factors and risk factor clusters in 21 regions,
1990-2010: a systematic analysis for the Global Burden of Disease Study 2010. The Lancet 380, 2224-
2260.
Linehan, V., Thorpe, S., Gunning-Trant, C., Heyhoe, E., Harle, K., Hormis, M., Harris-Adams, K. (2013)
Global food production and prices to 2050. Scenario analysis under policy assumptions. Australian
Government Department of Agriculture, Fisheries and Forestry ABARES: Canberra, ACT.
Lock, K., Pomerleau, J., Causer, L., Altmann, D.R., McKee, M. (2005) The global burden of disease
attributable to low consumption of fruit and vegetables: implications for the global strategy on diet.
World Health Organization. Bulletin of the World Health Organization 83, 100-108.
Lock, K., Stuckler, D., Charlesworth, K., McKee, M. (2009) Rising global food prices: potential causes
and health impacts. British Medical Journal 339, 269-272.
Magnus, A., Cadilhac, D., Sheppard, L., Cumming, T., Pearce, D., Carter, R. (2011) Economic benefits
of achieving realistic smoking cessation targets in Australia. Am J Public Health 101, 321-327.
Magnus, A., Cadilhac, D., Sheppard, L., Cumming, T., Pearce, D., Carter, R. (2012) The economic gains
of achieving reduced alcohol consumption targets for Australia. Am J Public Health 102, 1313-1319.
Mietzner, D., Reger, G., (2005). Advantages and disadvantages of scenario approaches for strategic
foresight. Int. J. Technol. Intell. Plan. 1, 220–239.
Millar, J., Roots, J. (2012) Changes in Australian agriculture and land use: implications for future food
security. International Journal of Agricultural Sustainability 10, 25-39.
MANUSCRIP
T
ACCEPTED
ACCEPTED MANUSCRIPT
38
Moore, A.D., Ghahramani, A. (2013) Climate change and broadacre livestock production across
southern Australia. 1. Impacts of climate change on pasture and livestock productivity, and on
sustainable levels of profitability. Global Change Biology 19, 1440-1455.
Myers, S.S., Zanobetti, A., Kloog, I., Huybers, P., Leakey, A.D., Bloom, A.J., Carlisle, E., Dietterich, L.H.,
Fitzgerald, G., Hasegawa, T. (2014) Increasing CO2 threatens human nutrition. Nature 510, 139-142.
National Land and Water Resources Audit, (2001) Australian dryland salinity assessment 2000.
National Land and Water Resources Audit, Canberra, ACT, .
National Water Commission, 2012. Water Policy and Climate Change in Australia. NWC, Canberra,
Australia.
Nicholls, S., Gwozdz, W., Reisch, L., Voigt, K. (2011) Fiscal food policy: Equity and practice.
Perspectives in Public Health 131, 157-158.
NSW, F., (2012) End Hunger in New South Wales, in: (DAE), D.A.E. (Ed.), End Hunger in Australia
2012.
O'Kane, M., (2014) Independent Review of Coal Seam Gas Activities in NSW Managing
environmental and human health risks from CSG activities. NSW Government Chief Scientist and
Engineer, Sydney.
Parham, D., (2012) Australia's Productivity Growth Slump: Signs of Crisis, Adjustment of Both?, in:
Government, A. (Ed.), Visiting Researcher Paper. Productivity Commission, Canberra.
Parry, M.., Rosenzweig, C., Iglesias, A., Livermore, M., Fischer, G., 2004. Effects of climate change on
global food production under SRES emissions and socio-economic scenarios. Glob. Environ. Change
14, 53–67. doi:10.1016/j.gloenvcha.2003.10.008
PMSEIC, (2010) Australia and Food Security in a Changing World. The Prime Minister's Science,
Engineering and Innovation Council, Canberra, Australia.
Poldy, F., Foran, B., Conroy, J., (2000) Future Options to 2050: Australian Stocks and Flows
Framework; Report to Department of Immigration and Multicultural Affairs; 00/04. CSIRO
Sustainable Ecosystems (previously Wildlife and Ecology), Resource Futures Program, National
Futures, Canberra.
Preston, B.L., Jones, R. (2008) A national assessment of the sensitivity of Australian runoff to climate
change. Atmospheric Science Letters 9, 202-208.
Public Health Association of Australia, 2017. Joint policy statement: Towards a national nutrition
policy for australia. Public Health Association of Australia, National Heart Foundation of Australia,
Dietitians Association of Australia, Nutrition Australia., Canberra, Australia.
Ramsey, R., Gallegos, D., (2011) What are the implications of peri-urban agriculture on food security
in Australia? (Unpublished), Hobart, Tasmania, Australia.
Ridgway, E.M., Lawrence, M.A., Woods, J., 2015. Integrating Environmental Sustainability
Considerations into Food and Nutrition Policies: Insights from Australia’s National Food Plan. Front
Nutr 2, 29. doi:10.3389/fnut.2015.00029
RPS, (2011) Onshore co-produced water: extent and management, Waterlines Report, . National
Water Commission, Canberra.
MANUSCRIP
T
ACCEPTED
ACCEPTED MANUSCRIPT
39
Smith, P., Haberl, H., Popp, A., Erb, K., Lauk, C., Harper, R., Tubiello, F.N., de Siqueira Pinto, A., Jafari,
M., Sohi, S., Masera, O., Böttcher, H., Berndes, G., Bustamante, M., Ahammad, H., Clark, H., Dong, H.,
Elsiddig, E.A., Mbow, C., Ravindranath, N.H., Rice, C.W., Robledo Abad, C., Romanovskaya, A.,
Sperling, F., Herrero, M., House, J.I., Rose, S., 2013. How much land-based greenhouse gas mitigation
can be achieved without compromising food security and environmental goals? Glob. Change Biol.
19, 2285–2302. doi:10.1111/gcb.12160
Snoek, M. (2003) The Use and Methodology of Scenario Making. European Journal of Teacher
Education 26, 9-19.
SOE, (2011) Australia state of the environment 2011. Independent report to the Australian
Government Minister for Sustainability, Environment, Water, Population and Communities, in:
Committee, S.o.t.E. (Ed.), Canberra.
Suweis, S., Carr, J.A., Maritan, A., Rinaldo, A., D’Odorico, P. (2015) Resilience and reactivity of global
food security. Proceedings of the National Academy of Sciences 112, 6902-6907.
Thow, A.M., Jan, S., Leeder, S., Swinburn, B. (2010) The effect of fiscal policy on diet, obesity and
chronic disease: a systematic review. Bulletin of the World Health Organization 88, 609-614.
Turner, G.M., Dunlop, M., Candy, S., 2016. The impacts of expansion and degradation on Australian
cropping yields—An integrated historical perspective. Agric. Syst. 143, 22–37.
doi:10.1016/j.agsy.2015.11.006
Turner, G.M., (2011) Consumption and the Environment: Impacts from a System Perspective, in:
Newton, P.W. (Ed.), Landscapes of Urban Consumption. CSIRO Publishing, Collingwood, pp. 51-70.
Turner, G.M., Hoffman, R., McInnis, B.C., Poldy, F., Foran, B. (2011) A tool for strategic biophysical
assessment of a national economy – The Australian stocks and flows framework. Environmental
Modelling & Software 26, 1134-1149 %U
http://linkinghub.elsevier.com/retrieve/pii/S136481521100082X.
Turner, G.M., Larsen, K.A., Ryan, C., Lawrence, M., (2012) Australian food security dilemmas—
comparing nutritious production scenarios and their environmental, resource and economic
tensions, in: Farmar-Bowers, Q., Higgins, V., Millar, J. (Eds.), Food Security in Australia. Springer.
Wall, J., Mhurchu, C.N., Blakely, T., Rodgers, A., Wilton, J. (2006) Effectiveness of Monetary
Incentives in Modifying Dietary Behavior: A Review of Randomized, Controlled Trials. Nutrition
Reviews 64, 518-531.
Walls, H., Magliano, D., Peeters, A., al., e., (2012) Projected Progression Of The Prevalence Of
Obesity In Australia Wiley-Blackwell, Available from: Deakin Research Online, Ipswich, MA.