Embed Size (px)
Citation preview


E/05/5182 May 13, 2005 03-1417-026
Pacific Salmon Foundation #300 – 1682 West 7th Avenue Vancouver, British Columbia V6J 4S6
Attention: Mr. Alan Kenney
RE: SQUAMISH RIVER SALMON RECOVERY PLAN: FINAL REPORT
Dear Mr. Kenney:
We are pleased to submit four (4) copies of the Squamish River Watershed Salmon Recovery Plan, Final Report. We have also provided electronic copies in PDF and word format.
The Plan provides a compilation of existing information on salmon and steelhead stock status, land and water uses, Squamish Nation cultural values, recreational uses, hatchery enhancements, habitat restoration, fisheries, productive capacities, limiting factors, recovery objectives, targets and strategies, monitoring plan, and recommended projects.
The Squamish River watershed encompasses a large network of rivers and streams, land and water uses, ecological resources, and cultural values. The watershed is also facing rapid rates of population growth and land development pressures. As such, a clear understanding of the status of salmon and steelhead stocks, the identification and protection of critical habitat, public education, and informed and effective fisheries management decisions are essential to the recovery of salmon and steelhead in the watershed.
Golder Associates Ltd. 500 – 4260 Still Creek Drive Burnaby, British Columbia, Canada V5C 6C6 Telephone (604) 296-4200 Fax (604) 298-5253
OFFICES IN AUSTRALIA, CANADA, GERMANY, HUNGARY, ITALY, SWEDEN, UNITED KINGDOM, UNITED STATES


REPORT ON
SQUAMISH RIVER WATERSHED SALMON RECOVERY PLAN
Submitted to:
Pacific Salmon Foundation Suite 300 – 1682 West 7th Avenue
Vancouver, B.C. V6J 4S6 Attention: Alan Kenney
DISTRIBUTION: 4 Copies - Pacific Salmon Foundation, Vancouver, B.C. 1 Copy - Squamish Nation 1 Copy - Squamish River Watershed Committee 1 Copy - North Vancouver Outdoor School 1 Copy - Fisheries and Oceans Canada, Stock Assessment Branch 1 Copy - Fisheries and Oceans Canada, Habitat Assessment Branch 1 Copy - B.C. Ministry Water, Land and Air Protection 2 Copies - Golder Associates Ltd., Burnaby, B.C. May 13, 2005 03-1417-026
Golder Associates Ltd. 500 – 4260 Still Creek Drive Burnaby, British Columbia, Canada V5C 6C6 Telephone (604) 296-4200 Fax (604) 298-5253
OFFICES IN AUSTRALIA, CANADA, GERMANY, HUNGARY, ITALY, SWEDEN, UNITED KINGDOM, UNITED STATES
May 2005 - i - 03-1417-026
Golder Associates
EXECUTIVE SUMMARY
The Squamish River watershed is a large, complex ecosystem with an area of about 3650 km2, located in the Coast Mountains approximately 70 km north of Vancouver. It is the largest watershed within the Strait of Georgia. The river drains directly into Howe Sound, and its estuary provides important habitat for aquatic species such as Pacific salmon and other marine fishes (e.g., eulachon and herring), marine mammals (e.g., harbour seals and river otters), and waterfowl (e.g., blue heron, diving ducks). The Squamish River watershed supports significant populations of coho (Oncorhynchus kisutch), chinook (O. tshawytscha), chum (O. keta), and pink (O. gorbuscha) populations, and small populations of sockeye salmon (O. nerka), steelhead/rainbow trout (O. mykiss) and cutthroat trout (O. clarki), as well as Dolly Varden (Salvelinus malma). Major tributaries to the Squamish River are the Cheakamus, Mamquam, and Elaho rivers and Ashlu Creek. The Stawamus River is also an important salmon-bearing stream in the Squamish area, which drains directly into Howe Sound, rather than the Squamish River.
The Squamish River Watershed is subject to intense land development and growth pressures. Recent land development activities include: the development of a new golf course, a university, continued residential housing, waterfront development, and highway expansion. Tourism and ecotourism interests continue to increase in popularity in the watershed. These activities, coupled with the 2010 Olympics, will undoubtedly increase the level of stress on the environment and on fish and fish habitat. Consequently, there is a need to balance economic advancement with maintaining, restoring, and recovering salmon populations.
The Squamish River Watershed was selected as a priority watershed for the development of a salmon recovery plan by the Pacific Salmon Foundation in 2002. The watershed was identified as a priority based on its mix of salmon species, lack of knowledge of stock status, high levels of enhancement and environmental impacts, high rate of land development and population growth, and high potential for recovery. The Greater Georgia Basin Steelhead Recovery Plan ranked Squamish steelhead as an “extreme conservation concern”. Chinook and pink (and coho) were considered potentially at risk. As such, funding for the development of a Squamish Salmon Recovery Plan was provided through the Pacific Salmon Endowment Fund (PSEF) in late 2003.
The objectives of the Squamish Watershed Salmon Recovery Plan were to:
Objective 1: Identify and set priorities for activities needed to achieve the recovery plan goals by focusing on what is “good” for the fish through an adaptive management process.

May 2005 - ii - 03-1417-026
Golder Associates
Objective 2: Involve and obtain buy-in from community interests to set priorities and implement the recovery plan.
A summary of key information collected during the recovery planning process, and the subsequent plan for recovery of salmon and steelhead in the watershed are provided below.
1. Squamish River Watershed Geology. The Squamish Watershed is defined by volcanic mountains and the impacts of glacial retreat that ended some 13,000 years ago. Mountains are steep, with distinct carved valleys, and glacial materials are present in the valley bottoms. As such, the region is prone to natural slope instability, landslides, frequent debris torrents, and sedimentation. In general, the sediment in the Squamish Valley is nutrient-poor thereby limiting aquatic productivity, with the exception of the Cheakamus Valley which tends to be more nutrient-rich.
2. Squamish River Watershed Hydrology. High flows are typically observed during snow and glacial melt starting in April and peaking in July, and then flowing high again in October and November due to significant rainfall events. Low flows are typically observed during colder winter months and during dry, late summer months. Due to the natural instability of the watershed, mainstems and tributaries are frequently subject to high and flashy flows, and subsequent poor water clarity, increased sedimentation, flooding, and debris torrents.
3. Land Use. There are a number of different land users in the Squamish River Watershed, including: forestry, agriculture, residential, industrial and commercial areas, landfills, resource extraction, parks, reserve lands, and environmentally sensitive lands.
a. Forestry. Historically, the Squamish River Watershed has been heavily logged which has exacerbated slope instability and subsequent downstream impacts. While slope instability remains an issue, more stringent regulations, rehabilitation of access roads and improved harvesting techniques have reduced erosion and sedimentation.
b. Agriculture. Squamish currently has 350 hectares within the Agricultural Land Reserve (ALR) which is primarily used for livestock. Re-zoning of the ALR for development purposes is being considered.

May 2005 - iii - 03-1417-026
Golder Associates
c. Residential Housing. Projected growth of the Squamish population is 25,000-28,000 people by 2019 from 15,000 people recorded in 1999. The largest area of proposed residential housing is in downtown Squamish, in addition to expanding existing residential areas such as, Garibaldi Highlands, Valleycliffe, and Meighn Creek floodplain.
d. Industrial and Commercial Areas. There are currently three industrial areas: Port of Squamish, adjacent to the downtown; Mamquam Blind Channel; and Woodfibre Pulp Mill, located on the west side of Howe Sound. A maze of roads, highways, and railways provides links within Squamish downtown, the District, Whistler and Vancouver.
e. Landfills. The Squamish landfill closed in 1985. The Cheekye fan landfill is currently in operation and is being considered for expansion in 2007 to accommodate waste from the entire Sea to Sky corridor.
f. Resource Extraction. Sand and gravel mining is currently being conducted on the south bank of the Mamquam River, and in Chance Creek and Loggers Lane.
g. Parks. There are ten provincial parks located in the Squamish River watershed and one ecological reserve. These parks provide recreational opportunities to the Squamish communities and to visitors, and a refuge for wildlife.
h. Squamish Nation Indian Reserves. The Squamish River Watershed is located in Squamish Nation Traditional Territory which covers an area of about 6,700 km2. There are 14 Indian Reserves in the watershed.
i. Environmentally Sensitive Sites. There are 27 sites which have been identified by the Federation of B.C. Naturalists’ Land for Nature Initiative as environmentally sensitive and in need of protection, restoration or rehabilitation, including the Squamish Estuary, Baynes Ecological Reserve, and the Wildlife Management Area.
4. Squamish Nation Cultural Values. The Squamish Nation is deeply tied and connected to the land and waters that encompass their traditional territory. Amongst many other activities, fishing is vitally important to the Squamish culture. Well over 60 species of fish, beach foods, and marine mammals are known to the Squamish people. Their traditional Squamish names, methods of utilization and preparation, and the roles these species played in stories and legends are well-documented in both oral history and in written literature. All five species of anadromous salmon, char, and steelhead were traditionally caught in Squamish waters.

May 2005 - iv - 03-1417-026
Golder Associates
Before contact with the white man, salmon were plentiful, quoted as “existing as millions of fish of all species”, as were other environmental resources. Following contact, fish populations and other environmental resources started to decline. With more development and resource extraction from the watershed, the dynamics of the rivers changed dramatically, also impacting the fisheries. The Squamish Nation community wants the land and resources to be protected, managed, and utilized for the benefit of present and future generations. With regard to the fish and aquatic habitat, stream restoration is identified as a priority for Squamish Nation members.
5. Water Uses. There are a number of different water users in the Squamish River Watershed, including: Independent Power Producers, hydroelectric dams, water licences, wastewater treatment facilities, community drinking water, and recreational users.
a. Independent Power Producers. A run-of-the-river hydroelectric project was built in 2004 on the Upper Mamquam River by Canadian Hydro Developers Inc. A second IPP is being proposed on Ashlu River by Ledcor Power Inc., and is currently subject to community approval. There are about 150 proposed IPPs in the Squamish River Watershed.
b. Hydroelectric Dams. BC Hydro operates a hydroelectric facility on the Cheakamus River. The Daisy Dam was built in 1957 and has had significant impacts on fisheries resources downstream on the Cheakamus River. BC Hydro initiated a Water Use Planning process in the mid-1990’s to define how water control facilities would be used based on public values and environmental priorities. The process is currently being reviewed by the Water Comptroller.
c. Water Licences. As of July 2004, 57 water licences and/or applications were listed in the Squamish River Watershed for the purposes of: irrigation, watering, domestic, power production/storage, bottles sales, mining and construction.
d. Wastewater Treatment Facilities. There are two wastewater treatment facilities in Squamish; the downtown outfall discharges into the Squamish River estuary; while the other facility discharges into the Mamquam River. Both provide secondary treatment.
e. Community Drinking Water. The Stawamus River watershed is, at present, the primary surface water supply for the District of Squamish, drawing 912,500,000 gallons/year. The Mashiter Creek watershed is considered a “seasonal” source of water to the District. Future water shortages are a concern, and thus the District is considering submission of groundwater development applications.

May 2005 - v - 03-1417-026
Golder Associates
f. Recreational Users. The Squamish River Watershed is a popular location for recreational users. Recreational water uses include such activities as: fishing, swimming, boating, kayaking, river rafting, canoeing, windsurfing.
6. Squamish River Estuary. The Squamish Estuary is situated at the northernmost point of Howe Sound. The estuary itself features a variety of habitats, including marshland, sand and mudflats, flood channels, and intertidal drainage channels. As such, the Squamish River estuary provides critical habitat for all salmon populations within the Squamish River watershed. Since the late 1800s, the Squamish River estuary has been dyked, drained, and filled for agricultural, industrial, residential, and commercial development such that in 2000, approximately 50% of the original estuary remained usable to salmon.
In 1999, a revised Squamish River Estuary Management Plan was created. This document designated 579 ha for conservation, 350 ha for industrial development, and 8 ha requiring further planning. It is hoped that the adoption of the “Squamish River Estuary Management Plan” will change the trend in habitat conditions within the estuary from salmon habitat damage and destruction to one of restoration, recovery, and protection.
7. Salmon Stock Status in the Squamish Watershed. Adult escapement, juvenile and smolt density data were collected from the literature for chinook, coho, pink, chum and sockeye salmon and steelhead trout to determine stock status for each species. In general, a lack of systematic training and calibration of observation methods, a lack of adequate documentation of data collected, and differences in study objectives and design historically did not allow for a good understanding of stock status for any of the target species. As such, general trends are provided.
a. Chinook salmon. Despite concerns regarding historic estimates and the adequacy of current assessments, the available data suggest that chinook populations were formerly much more abundant than now, and that population abundance has been low since the mid-1970s. The data show a decline from 15,000 in the 1950s to below 500 in the mid-1980s and 1990s. Enhancement by Tenderfoot Hatchery had increased chinook escapements to the Squamish watershed by the mid-1990s, but relative abundances have remained below 1,000 chinook for the watershed between 1997-2000, and were above 1,000 from 2001-2003 before decreasing to less than 500 chinook in 2004.
It is thought that enhancement chinook stocks by the Tenderfoot hatchery resulted in a shift from stream-type chinook to ocean-type chinook in the 1980s.

May 2005 - vi - 03-1417-026
Golder Associates
An assessment of juvenile chinook stock status was not possible given the available data.
b. Coho Salmon. Recent trends suggest that the coho populations in the Mamquam, Cheakamus, and Stawamus systems are generally increasing from lows reached in 1997, primarily as a result of reduced fishing pressures and improvement in habitat and marine survival. However, current numbers have not reached historical highs. Current stock status remains unknown.
The status of juvenile coho in the Squamish River watershed could not be determined based on available data. However, recent studies indicate that juvenile coho are successfully using restored side-channel habitat.
c. Pink Salmon. The Squamish River watershed supported large numbers of pink salmon in the early 1960s. While numbers since then have remained low, 2003 data indicate higher numbers than in previous decades. It is likely that recent enhancement, habitat restoration and the elimination of commercial fisheries may have had a positive impact on these stocks.
A juvenile pink study conducted in new pink spawning channels at the North Vancouver Outdoor School reported close to 1.5 million pink fry in 2003. However, a status of juvenile pink salmon in the watershed was not possible based on available data.
d. Chum Salmon. According to DFO escapement data, chum salmon have not shown a steady decline as was observed for the other salmon stocks, but rather showed high variability between years. Chum escapements to the Cheakamus River have generally increased since the 1970s.
The status of juvenile chum salmon could not be determined based on existing information.
e. Sockeye Salmon. The Squamish River watershed does not support a large sockeye population due to limited accessible lake habitat. As such, little information exists regarding adult or juvenile stock status.
f. Steelhead Trout. Steelhead stocks in the Squamish River Watershed are considered an “extreme conservation concern” as reported in the Greater Georgia Basin Steelhead Recovery Plan published in 2002. Adult or juvenile steelhead stock status could not be determined based on available information.

May 2005 - vii - 03-1417-026
Golder Associates
8. Stock Enhancement. There are two operating hatcheries in the Squamish River Watershed: the Tenderfoot Hatchery, and the North Vancouver Outdoor School hatchery.
a. Tenderfoot Hatchery. A federal facility located along the Cheakamus River that has been used to enhance stocks of chinook, coho, chum, pink and steelhead since 1981.
b. North Vancouver Outdoor School Hatchery. In operation since 1982, the hatchery is a teaching hatchery for thousands of children that visit it every year. The students are involved in all aspects of hatchery operations, from capturing brood stock, to releasing the fry the following spring.
9. Habitat Restoration. Habitat restoration initiatives conducted in the Squamish River Watershed have been extensive since 1979, and include: construction of new channels; complexing channels and mainstem rivers with LWD; excavation of remnant channels; excavation of groundwater channels; stream fertilization; and a combination of all types. Over 160,000 m2 of coho, chinook, pink, chum, and steelhead rearing and spawning habitat has been created.
10. Fishery Use. The Squamish Nation has been fishing salmon for cultural purposes and as a food source for hundreds of years. In addition, the Squamish systems support primarily a recreational steelhead fishery. Squamish salmon have also been caught in marine fisheries, such as in the Strait of Georgia, Northern and Central B.C. troll fishery, Johnstone Strait net fishery, West Coast Vancouver Island troll fishery, Inside Passage sport fishery, the Alaskan fishery, and the Juan de Fuca net and sport fisheries. Overexploitation of the resource has resulted in significant declines salmon stocks. As such, more stringent fishing restrictions have been implemented in order to stabilize and recovery the stocks.
11. Freshwater Habitat. The status of salmon habitat within the Squamish River watershed was described by dividing the watershed into two sub-basins, which are different in past, present, and future projected land use patterns and habitat issues. The upper Squamish River, upstream of the Squamish-Cheakamus River confluence, is dominated by Crown-owned lands that are largely set aside for commercial logging. Changes to salmon habitat in this portion of the watershed have been and will continue to be driven largely by forest practices carried out during commercial logging of the first and second growth forests and IPP developments.
The lower Squamish River watershed comprises the Squamish River mainstem and its tributaries downstream of the Cheakamus-Squamish confluence, including the

May 2005 - viii - 03-1417-026
Golder Associates
Cheakamus River, Mamquam River, and Stawamus River has been extensively developed for human settlement and hydroelectric power generation. The issues relating to salmon habitat in the lower watershed will continue to be driven by these development activities.
12. Productive Capacity. The information collected to date regarding stock status and habitat availability does not allow for an accurate assessment of freshwater or marine productive capacities for Squamish chinook, coho, pink and steelhead. However, an estimate of productive capacity for each species is required to set recovery objectives, targets and strategies. As such, interim productive capacities were established with the caveat that they will be revised as new information becomes available.
a. Chinook. Based on a simple-structured allometric model developed by DFO, the interim chinook productive capacity of the Squamish River Watershed is estimated at 5,000 stream-type spawners.
b. Pink. An interim productive capacity of the Squamish River Watershed for pink salmon could not be determined due to a lack of existing information.
c. Coho. Productive capacities were determined using biostandards for smolts/km as published by Bradford et al. (1997) and Marshall and Britton (1990), and extrapolating to adult spawners based on assumptions for marine survival.
i. Mamquam River: 150 coho spawners/km; 1476 smolts/km.
ii. Cheakamus River: 100 coho spawners/km; 1476 smolts/km.
d. Steelhead. Productive capacities for steelhead in the Cheakamus, Mamquam, and Squamish rivers are provided in the Greater Georgia Basin Steelhead Recovery Plan. Estimated habitat capacities of returning adults (assuming 13% marine survival) and smolts are:
i. Squamish River: 1,000 to 2,000 adults; 7,700 to 15,400 smolts.
ii. Cheakamus River: 700 to 1,000 adults; 5,400 smolts.
iii. Mamquam River: 100 to 200 adults; 1,155 to 1,540 smolts.

May 2005 - ix - 03-1417-026
Golder Associates
13. Information Needs: Data gaps were identified regarding: stock status, marine survival, freshwater habitat conditions, and climate conditions.
a. Stock Status
i. Develop detailed assessment frameworks that explicitly address recovery objectives, targets and strategies.
ii. Re-evaluate existing enumeration methodologies to obtain more robust data so that linkages between adult and juvenile data can be made with more confidence.
iii. Consider the development of new assessment programs or the application of new methodologies.
b. Marine Survival
i. Assess site-specific marine survival in different areas of coastal B.C.; consider use of index systems
c. Freshwater Habitat Condition – Habitat Restoration
i. Identification of critical and valuable habitat
ii. Development, implementation and enforcement of habitat protection measures
d. Freshwater Habitat Condition – Watershed Processes
i. Development and implementation of measures to monitor the recovery of watershed processes.
e. Squamish Estuary
i. Protection and enhancement of the estuary are critical.
ii. Designation and protection of critical habitat should be incorporated into the District of Squamish OCP.

May 2005 - x - 03-1417-026
Golder Associates
iii. Future assessments should focus on gaining a better understanding of salmon status and rearing habitat use in the estuary, particularly by chinook smolts.
f. Climate Conditions
i. Better understanding of effects of climate change on salmonid populations.
ii. Effects of climate change incorporated into recovery plan.
14. Prognosis for a Recovery Plan. The success of the recovery plan depends on understanding of factors limiting salmon populations in the watershed. While a clear understanding of limiting factors in the Squamish River Watershed is currently not possible due to data limitations, general limitations include: biological, physical and socio-economic constraints.
a. Biological factors limiting Squamish salmon populations include: poor marine survival, poor juvenile production, and degraded freshwater and estuarine habitat.
b. Physical factors limiting Squamish salmon populations include: low productivity; unstable stream channels and surrounding terrain; high levels of sedimentation; unstable and degraded floodplain habitat; and frequent flood events.
c. Socio-economic factors limiting Squamish salmon populations include: land development; 2010 Olympics; lack of public understanding of the value of the fishery and impacts of development on fisheries; lack of regulatory enforcement to protect habitat; and the lack of incorporation of protective measures into land use planning.
15. Recovery Plan Objectives, Targets, and Strategies. Based on existing information, an understanding of stock status, critical habitat, specific or key limiting factors, and productivity in the Squamish watershed is lacking. As such, objectives, targets, and strategies provided by the Squamish Salmon Recovery Plan at this time are general in nature, and are focused on gathering additional information to provide a better understanding of salmon in the watershed. More specific objectives and targets will be developed once new information becomes available and through additional community workshops. The plan provides general recovery objectives, targets, and strategies for chinook, coho, pink and steelhead for: salmon populations; habitat; watershed processes; community stewardship; fisheries management.

May 2005 - xi - 03-1417-026
Golder Associates
16. Recommended Recovery Plan Projects. A list of recommended projects to be implemented to fill in the identified information gaps was developed based on the knowledge gained through the development of this recovery plan, suggested projects provided in the reference materials, and on the expert knowledge of members of the TAC and community members who participated in the recovery planning process. The suggested project list is not exhaustive, and it is expected that additional fully technically qualified projects will be brought forth by the Squamish community and other interested stakeholders. Furthermore, it is expected that this list of projects will change regularly as new information becomes available.
17. Monitoring and Evaluation of Recovery Plan Efforts. Monitoring/assessment of salmon recovery will be key to achieving recovery objectives, targets, and strategies. The goal of every recovery team should be to set realistic goals that can be achieved within available funds. Consequently, the monitoring strategy should achieve a high level of effectiveness at low cost and provide data that are consistent with the level of risk to the viability of these populations that fisheries managers are willing to accept. Monitoring costs are controlled primarily by the method, frequency, and intensity of monitoring. The key will be to consider available technologies and to define the frequency and intensity of monitoring within the context of existing enumeration, habitat, and stewardship initiatives underway in the Squamish River watershed.
Monitoring salmon recovery should consist of: 1) stock and habitat assessments (i.e., establishing trends in stocks and habitat condition); 2) establishing habitat-based population goals; 3) monitoring performance of recovery efforts against those goals; and 4) research to improve techniques or approaches to recovery and recovery evaluation (e.g., marine survival) (PSF 2004).

May 2005 - xii - 03-1417-026
Golder Associates
ACKNOWLEDGEMENTS
We would like to thank the Pacific Salmon Foundation for involving Golder Associates Ltd. in the preparation of the Squamish River Watershed Salmon Recovery Plan, and the Pacific Salmon Endowment Fund for providing funding to conduct this important project. Development of this recovery plan would not have been possible without the continued technical support, guidance, and involvement of members of the Technical Advisory Committee (TAC) throughout the life of the project. Members of the TAC included: Randall Lewis, Squamish Nation; Edith Tobe, Squamish River Watershed Society; Carl Halvorson, North Vancouver Outdoor School; Matt Foy, Habitat Branch, Fisheries and Oceans Canada; Neil Schubert, Stock Assessment, Fisheries and Oceans Canada; Greg Wilson and Ross Neumann, Ministry of Water, Land and Air Protection; and Rich Chapple, Alan Kenney, Leigh Martin-Boyd, and Dianne Ramage, Pacific Salmon Foundation. Members of TAC also technically reviewed the recovery plan in its various stages and provided comments. We would also like to thank Mr. Robert Bocking (LGL Ltd.), Mr. Peter Caverhill (formerly BC MWLAP), and Mr. Dana Schmidt (Golder Associates Ltd.) for their technical review and comments; and Kirsty Miskovich (Golder Associates Ltd.) for editorial review. Finally, we would like to thank the many other members of the community, DFO, MWLAP, and NGOs outside of the TAC who shared their knowledge and ideas regarding recovery of salmonids in the Squamish watershed.

May 2005 - xiii - 03-1417-026
Golder Associates
TABLE OF CONTENTS
SECTION PAGE EXECUTIVE SUMMARY ........................................................................................ i ACKNOWLEDGMENT......................................................................................xii GLOSSARY ................................................................................................... xviii 1.0 WATERSHED SELECTION AND RECOVERY PLANNING...................... 1
1.1 The Squamish River Watershed..............................................................1 1.2 A Brief History of the Squamish Watershed Planning .............................3 1.3 Public Participation ..................................................................................4 1.4 Selection of the Squamish Watershed for Salmon Recovery Planning...5 1.5 Guiding Principles for Recovery Planning ...............................................6 1.6 Overview of the Squamish Watershed Salmon Recovery Plan...............8
2.0 THE SQUAMISH RIVER WATERSHED .................................................. 10 2.1 General Description of the Squamish River Watershed ........................10
2.1.1 Squamish River Watershed Boundaries....................................10 2.1.2 Squamish River Watershed Biogeoclimatic Zones....................11
2.2 Squamish River Watershed Geology ....................................................11 2.3 Squamish River Watershed Hydrology..................................................12
2.3.1 Squamish River .........................................................................12 2.3.2 Elaho River ................................................................................13 2.3.3 Ashlu Creek ...............................................................................13 2.3.4 Cheakamus River ......................................................................14 2.3.5 Mamquam River ........................................................................16 2.3.6 Stawamus River.........................................................................17
2.4 Land Use in the Squamish Watershed ..................................................17 2.4.1 Forestry......................................................................................18 2.4.2 Agriculture..................................................................................21 2.4.3 Residential .................................................................................21 2.4.4 Industrial Areas..........................................................................22 2.4.5 Landfills......................................................................................23 2.4.6 Resource Extraction ..................................................................23 2.4.7 Parks..........................................................................................24 2.4.8 Reserves Lands.........................................................................25 2.4.9 Environmentally Sensitive Lands...............................................25
2.5 Squamish Nation Cultural Values of Salmon.........................................27 2.5.1 Fishing Sites ..............................................................................28 2.5.2 Distribution of Fish .....................................................................28 2.5.3 Squamish Nation Community Values and Perspectives............28
2.6 Whistler..................................................................................................28 2.7 Water Use..............................................................................................29
2.7.1 Independent Power Producers ..................................................30

May 2005 - xiv - 03-1417-026
Golder Associates
2.7.2 Dams .........................................................................................30 2.7.3 Water Withdrawal Licenses .......................................................31 2.7.4 Wastewater Treatment Plant .....................................................31 2.7.5 Community Drinking Water........................................................32 2.7.6 Recreational Use .......................................................................33
2.8 The Squamish Estuary ..........................................................................34 3.0 SALMON STOCK STATUS IN THE SQUAMISH WATERSHED ............ 37
3.1 Data Limitations.....................................................................................37 3.1.1 Adult Escapement Data .............................................................37 3.1.2 Juvenile Density Data ................................................................38 3.1.3 Smolt Migration Data .................................................................40
3.2 Chinook Salmon ....................................................................................40 3.2.1 Life History Characteristics ........................................................40 3.2.2 Squamish Chinook Status .........................................................43 3.2.3 Juvenile Chinook Salmon ..........................................................44
3.3 Coho ......................................................................................................45 3.3.1 Life History Characteristics ........................................................45 3.3.2 Squamish Coho Status ..............................................................47 3.3.3 Juvenile Coho Salmon...............................................................49
3.4 Pink........................................................................................................50 3.4.1 Life History Characteristics ........................................................50 3.4.2 Squamish Pink Status................................................................51 3.4.3 Juvenile Pink Salmon ................................................................53
3.5 Chum.....................................................................................................53 3.5.1 Life History Characteristics ........................................................53 3.5.2 Squamish Chum Status .............................................................54 3.5.3 Juvenile Chum Salmon..............................................................55
3.6 Sockeye Salmon....................................................................................55 3.6.1 Life History Characteristics ........................................................55 3.6.2 Squamish Sockeye Status.........................................................56 3.6.3 Juvenile Sockeye Salmon..........................................................57
3.7 Steelhead Trout .....................................................................................57 3.7.1 Steelhead Life History Characteristics.......................................57 3.7.2 Squamish Steelhead Status ......................................................59 3.7.3 Juvenile Steelhead Trout ...........................................................62
4.0 STOCK ENHANCEMENTS ...................................................................... 66 4.1 Tenderfoot Hatchery..............................................................................66 4.2 North Vancouver Outdoor School..........................................................67
5.0 HABITAT RESTORATION........................................................................ 68 6.0 FISHERY USE .......................................................................................... 71
6.1 Native Fishery........................................................................................71

May 2005 - xv - 03-1417-026
Golder Associates
6.2 Recreational Fishery..............................................................................72 6.2.1 In-River Fishery .........................................................................72 6.2.2 Marine Fishery ...........................................................................73
6.3 Commercial Marine Fishery...................................................................74 7.0 FRESHWATER HABITAT......................................................................... 75
7.1 Habitat Status ........................................................................................75 7.2 Upper Squamish River Watershed ........................................................75 7.3 Lower Squamish River Watershed ........................................................79
8.0 PRODUCTIVE CAPACITY ....................................................................... 84 8.1 Chinook .................................................................................................84
8.1.1 DFO Allometric Model................................................................85 8.2 Pink........................................................................................................86 8.3 Coho ......................................................................................................86 8.4 Steelhead ..............................................................................................88
9.0 INFORMATION NEEDS ........................................................................... 90 9.1 Stock Status ..........................................................................................90 9.2 Marine Survival......................................................................................91 9.3 Freshwater Habitat Condition ................................................................92
9.3.1 Habitat Restoration ....................................................................92 9.3.2 Watershed Processes................................................................92 9.3.3 Squamish Estuary......................................................................93
9.4 Climate Conditions ................................................................................93 10.0 PROGNOSIS FOR A RECOVERY PLAN ................................................ 95
10.1 Biological Factors Influencing Recovery................................................96 10.2 Physical Factors Influencing Recovery..................................................97 10.3 Socio-economic Factors Influencing Recovery .....................................97
11.0 RECOVERY PLAN OBJECTIVES, TARGETS, AND STRATEGIES....... 99 11.1 Salmon Population Objectives, Targets, and Strategies .......................99
11.1.1 Salmon Population Objectives.................................................100 11.1.2 Salmon Population Targets .....................................................100 11.1.3 Salmon Population Strategies .................................................101
11.2 Salmon Habitat Objectives, Targets, and Strategies...........................102 11.2.1 Salmon Habitat Objectives ......................................................103 11.2.2 Salmon Habitat Targets ...........................................................103 11.2.3 Salmon Habitat Strategies .......................................................104
11.3 Watershed Process Objectives, Targets, and Strategies ....................106 11.3.1 Watershed Process Objectives................................................106 11.3.2 Watershed Process Targets ....................................................107 11.3.3 Watershed Process Strategies ................................................107
11.4 Community/Stewardship Objectives, Targets, and Strategies ............108 11.4.1 Community/Stewardship Objectives ........................................108

May 2005 - xvi - 03-1417-026
Golder Associates
11.4.2 Community/Stewardship Recovery Targets ............................108 11.4.3 Community/Stewardship Strategies.........................................109
11.5 Fisheries Management Objectives, Targets, and Strategies...............109 11.5.1 Fisheries Management Objectives ..........................................110 11.5.2 Fisheries Management Targets ...............................................110 11.5.3 Fisheries Management Strategies ...........................................110
12.0 MONITORING AND EVALUATION OF RECOVERY PLAN.................. 111 12.1 Monitoring Stock Recovery..................................................................111
12.1.1 Stock Assessment ...................................................................111 12.1.2 Cheakamus River WUP monitoring .........................................112 12.1.3 Habitat Restoration ..................................................................112 12.1.4 Effective Partnerships..............................................................112 12.1.5 Stream Habitat Maps ...............................................................112
12.2 Monitoring Physical Works/Effectiveness............................................113 13.0 IMPLEMENTATION PLAN SUMMARY.................................................. 115 14.0 RECOMMENDED RECOVERY PLAN PROJECTS............................... 116 15.0 CLOSURE............................................................................................... 127 16.0 REFERENCES CITED............................................................................ 128 LIST OF TABLES Table 1 Squamish River Tributaries Table 2 Cheakamus River Tributaries below Daisy Reservoir Table 3 Mamquam River Tributaries Table 4 Downtown Squamish Land Use Activities in 1999 and 2019 (data
obtained from Aplin and Martin et al., 2003) Table 5 Squamish Nation Indian Reserves Table 6 Matrix of Juvenile Salmonid Studies in the Squamish Watershed Table 7 Peak Steelhead Snorkel Counts on the Cheakamus and Mamquam
Rivers (1978-2004) Table 8 Maximum Likelihood Escapement Estimates for Cheakamus River
Steelhead Table 9 Juvenile Steelhead Densities for Selected Streams in the Squamish
River Watershed (1979-2004) Table 10 List of Habitat Restoration Projects Conducted in the Squamish River
Watershed Since 1979 Table 11 Average Indian Food Fishery Catches of Salmon and Steelhead in
Squamish Systems between 1951 and 1991 (DFO data, unpublished) Table 12 Priority Ranking of Assessments in the Squamish River Watershed Table 13 List of Recommended Recovery Plan Projects for the Squamish River
Watershed

May 2005 - xvii - 03-1417-026
Golder Associates
LIST OF FIGURES Figure 1 Squamish River Watershed Figure 2 Squamish River Hydrograph near Brackendale Figure 3 Cheakamus River Hydrograph Figure 4 Mamquam River Hydrograph Figure 5 Stawamus River Hydrograph Figure 6 District of Squamish Public Land Status (provided by the District of
Squamish) Figure 7 Escapement Trends for Chinook Salmon in Selected Squamish River
Systems Figure 8 Escapement Trends for Coho Salmon in Selected Squamish River
Systems Figure 9 Escapement Trends for Pink Salmon in Selected Squamish River
Systems Figure 10 Escapement Trends for Chum Salmon in Selected Squamish River
Systems Figure 11 Escapement Trends for Sockeye Salmon in Selected Squamish River
Systems Figure 12 Steelhead Harvest Analysis (SHA) Data for the Squamish, Mamquam,
and Cheakamus Rivers Figure 13 The Number of Annual Fry/Smolt Releases from the Tenderfoot
Hatchery by Species: a) Chinook; b) Chum; c) Coho; d) Pink; and e) Steelhead
Figure 14 North Vancouver Outdoor School Hatchery Salmon Production LIST OF APPENDICES Appendix I List of Recovery Plan Participants Appendix II Current Water Licences by System in the Squamish River Watershed Appendix III List of Recreational Outfitters in the Squamish River Watershed

May 2005 - xviii - 03-1417-026
Golder Associates
GLOSSARY ALR Agricultural Land Reserve AT Alpine Tundra AUC Area-Under-the-Curve Method BCCF British Columbia Conservation Foundation BCRP Bridge Coastal Restoration Program CIARNS Climate Impacts and Adaptation Research Network CpAD Catch-per-unit-effort CSP Comprehensive Sustainability Plan CWH Coastal Western Hemlock CWT Coded Wire Tag DFO Fisheries and Oceans Canada FBCN The Federation of BC Naturalists FRPA Forest and Range Protection Act GGBSRP Greater Georgia Basin Steelhead Recovery Plan HEB Habitat Enhancement Branch IPP Independent Power Projects ISC Inner South Coast LWD Large Woody Debris MAD Mean Annual Discharge MH Mountain Hemlock MWLAP Ministry of Water, Land and Air Protection NVOS North Vancouver Outdoor School OCP Official Community Plan POHL Post Orbit-Hypural Length PSEF Pacific Salmon Endowment Fund PSF Pacific Salmon Foundation PST Pacific Salmon Treaty REE Routine Effectiveness Evaluations RMOW Resort Municipality of Whistler RST Rotary Screw Trap SECC Squamish Estuary Coordinating Committee SEMP Squamish River Estuary Management Plan SHA Steelhead Harvest Analysis SIL Stream Inspection Log SLRD Squamish-Lillooet Regional District SRWS Squamish River Watershed Society SSHRC Steelhead Society Habitat Restoration Corporation TAC Technical Advisory Committee TSA Timber Supply Area TFL Timber Farm License WCVI West Coast Vancouver Island WMA Wildlife Management Area WUP Water Use Plan

May 2005 - 1 - 03-1417-026
Golder Associates
1.0 WATERSHED SELECTION AND RECOVERY PLANNING
This document provides a recovery plan for salmon, including steelhead, in the Squamish River watershed. The need for such a document has been a significant topic of discussion amongst community members for many years. The recent accelerated growth and land development in the watershed has put increased pressure on ecological resources, such as the fisheries. Although a number of different stock and habitat assessments and monitoring programs have been and continue to be conducted in the watershed, the programs have not been integrated. Protection and recovery of salmon stocks will require the integration of existing programs, proposed land development, and water uses. To this end, the Squamish River watershed was recognized as a priority watershed by the Pacific Salmon Foundation (PSF) and funding was provided through the Pacific Salmon Endowment Fund (PSEF) in late 2003 to develop this recovery plan. The PSF is “an independent, politically neutral organization dedicated to rebuilding healthy sustainable and naturally diverse Pacific salmon stocks” (www.PSF.ca). The PSEF is a long-term funding mechanism designed to achieve sustainable salmon stocks in B.C. and the Yukon (www.PSF.ca).
For the purposes of this document, the term “salmon” includes the five species of Pacific salmon: coho (Onchorhynchus kisutch), chinook (O. tshawytscha), chum (O. keta), pink (O. gorbuscha), and sockeye (O. nerka) salmon; and steelhead trout (O. mykiss). As these are all anadromous fish species, the recovery plan focuses primarily on the anadromous sections of watercourses in the Squamish River watershed. The recovery plan is based on a review and compilation of information and data deemed to be most relevant to salmon recovery as determined by Golder Associates Ltd., the TAC, and members of the community involved in the process. As such, the recovery plan does not represent an exhaustive and comprehensive review of all existing and available information.
1.1 The Squamish River Watershed
The Squamish River watershed is a large, complex ecosystem with an area of about 3650 km2, located in the Coast Mountains approximately 70 km north of Vancouver (Figure 1). It is the largest watershed within the Strait of Georgia. The river drains directly into Howe Sound, and its estuary provides important habitat for aquatic species such as Pacific salmon and other marine fishes (e.g., eulachon and herring), marine mammals (e.g., harbour seals and river otters), and waterfowl (e.g., blue heron, diving ducks). Historically, herring were abundant, spawning on the grasses along the Mamquam Blind Channel, and supported a fishery; however, increased pollution and logging operations and channel in-fill in the estuary have resulted in a significant decline of the herring population. Recently, herring have been observed every year, but spawning location is unknown (R. Lewis, pers. comm., November 2004). The Squamish River also

May 2005 - 2 - 03-1417-026
Golder Associates
supports sturgeon, which have been caught in native fishing nets in the last five years (R. Lewis, pers. comm., November 2004).
Major tributaries to the Squamish River are the Cheakamus, Mamquam, and Elaho rivers and Ashlu Creek. The Stawamus River is also an important salmon-bearing stream in the Squamish area, which drains directly into Howe Sound, rather than the Squamish River.
The Squamish River watershed supports significant populations of coho, chinook, chum, and pink populations, and small populations of sockeye salmon, steelhead/rainbow trout and cutthroat trout (O. clarki), as well as Dolly Varden (Salvelinus malma). Typically, salmon spawning starts in July with Chinook, followed by pink, and chum, and ends in February with coho. General life cycle characteristics of cutthroat trout and Dolly Varden in the watershed are unknown. Steelhead are winter- or summer-run populations typically emigrating freshwater in the spring and returning to spawn in the fall.
The Squamish River and its tributaries support both wild and enhanced salmon populations. Enhancement has been conducted by the North Vancouver Outdoor School (NVOS) (primarily a teaching hatchery located on the Cheakamus River), the Tenderfoot Hatchery, and the Mel Drage Hatchery (located on upper Dryden Creek). The Tenderfoot Hatchery is located on Tenderfoot Creek, which drains into the Cheakamus River. The hatchery has provided mainly smolts to enhance stocks of coho and chinook salmon since 1981. The Tenderfoot Hatchery also produced pink salmon fry for the Mamquam River from 1985 to 1993, and for the Cheakamus River in 1993, 2001, and 2003; and steelhead fry mainly for the upper Squamish areas from 1982 to 1992.
Historical and recent escapement data indicate a concern for the conservation status of steelhead and chinook, in particular. While coho and chum escapements have increased since the late 1990s, mainly due to closure of commercial and recreational fisheries and to habitat restoration enhancements, the sustainability of these species is also a concern. Little information is available regarding the status of pink populations; however, historical data indicate peak numbers in the 1960s.
The town of Squamish lies within the Squamish River watershed and supports a growing population of approximately 15,000 people. Most of the watershed lies within Squamish Nation traditional territory (Figure 1). The Squamish Nation comprises 3,292 people, many of whom reside in the Squamish area. Land development continues at an accelerated rate with the development of a new golf course, a university, continued residential housing and highway expansion. Populations of coho salmon and cutthroat trout in the urban areas are most sensitive to future development. The Squamish and Elaho valleys also support the forest industry; past harvesting practices have impacted channel morphology and hydrology and subsequently fish habitat in these valleys. Tourism and ecotourism interests continue to increase in popularity in the watershed.

May 2005 - 3 - 03-1417-026
Golder Associates
These activities, coupled with the 2010 Olympics, will undoubtedly increase the level of stress on the environment and on fish and fish habitat. Consequently, there is a need to balance economic advancement with maintaining, restoring, and recovering salmonid populations. As such, a plan for recovery of salmon in the watershed is deemed a necessity.
1.2 A Brief History of the Squamish Watershed Planning
Efforts to rebuild salmon stocks through habitat restoration, hatchery enhancements, and harvest management initiatives have been conducted in the past and are ongoing. A draft salmon recovery plan for the Squamish River watershed has been prepared by Fisheries and Oceans Canada (DFO), and a recovery plan for steelhead in the Squamish River, as part of the Great Georgia Basin Steelhead Recovery Plan (GGBSRP 2002). In addition, a draft technical paper on the status of coho in the Squamish River watershed is in preparation (Golder et al., in prep). A number of habitat restoration initiatives have been conducted in the upper and lower watersheds (e.g., NVOS, Interfor, Steelhead Society, DFO, GGBSRP, SRWS), and enhancement efforts have been made by the Tenderfoot Hatchery. Comprehensive studies are underway in the Cheakamus River to determine the status of salmonids, primarily steelhead stocks, and impacts of different flow regimes under B.C. Hydro’s Water Use Planning process. A Squamish Estuary Management Plan (SEMP 1999), a Land Use Management Plan (Squamish Nation 2001), and the District of Squamish Official Community Plan (OCP) have been prepared for the watershed. However, these initiatives lack the adaptive and integrative management process needed to help achieve recovery of the fisheries for the watershed.
This Pacific Salmon Foundation’s Squamish salmonid recovery plan is based on the amalgamation of existing plans and initiatives to create one synthesized document for the watershed. In addition, the amalgamated plan was updated with information provided by the Technical Advisory Committee (TAC) and other parties. The TAC consists of the following members:
• Randall Lewis, Squamish Nation/SRWS; • Edith Tobe, SRWS; • Carl Halvorson, NVOS; • Matt Foy, DFO, Habitat Branch; • Neil Schubert, DFO, Stock Assessment Branch; • Greg Wilson, Ministry, Water, Land and Air Protection (MWLAP); and • Alan Kenney, PSF.
It is the intent that the final recovery plan produced as a result of this PSF initiative will be updated regularly as new data become available, and that recovery strategies, objectives, targets, and goals will be adjusted as appropriate.

May 2005 - 4 - 03-1417-026
Golder Associates
The ultimate success of the salmon recovery plan will depend on how well the federal and provincial governments, the Squamish Nation, the District of Squamish, the Squamish, Lillooet Regional District (SLRD), conservation groups, industry, and the general public work together for the protection of salmon populations and the habitats on which they depend. This process is being facilitated through the Squamish River Watershed Society (SRWS). The SRWS was established in 1998 and its members represent the Squamish Nation, streamkeepers, NVOS, and other community members. Their main role is to act as the lead proponent for projects conducted in the Squamish watershed. The SRWS provides a means of information exchange on at least a quarterly basis regarding the status of environmental initiatives being carried out by various parties within the watershed. As such, the SRWS provides a critical link between the community, scientists, and government, which is needed for the recovery plan to be successful. The missing link remains between industry, the municipality, the regional district, and some members of the community.
1.3 Public Participation
The SRWS, the Squamish Nation, local community groups, and government agencies were involved in the recovery planning process. A public open house was held on November 17, 2003 at the District of Squamish office, not only to provide background on the recovery plan process, but to provide an opportunity for community members to participate in the planning stages related to the Squamish watershed study area. An additional community workshop was held in November 2004 to review the draft recovery plan and to solicit community input, primarily focused on reviewing draft recovery strategies and selecting priority watersheds and projects. Community input is essential to develop recovery objectives and targets and to identify priority projects to be conducted in the future to achieve recovery goals.
During the recovery planning process, a number of meetings were held with the TAC, August 28, 2003; February 25, 2004; April 21, 2004; August 4, 2004; October 12, 2004; December 17, 2004; and January 19, 2005. The objectives of these meetings were to discuss the existing information collected, data gaps, and recovery objectives, and goals. The final recovery plan was submitted in March 2005.
Input was also solicited from individual members of the TAC, provincial, federal, and municipal governments, Squamish Nation, NGOs, and other members of the community via email, telephone and/or face-to-face meetings. A detailed list of participants in the recovery plan process is provided in Appendix I.

May 2005 - 5 - 03-1417-026
Golder Associates
1.4 Selection of the Squamish Watershed for Salmon Recovery Planning
The Pacific Salmon Endowment Fund Society (PSEF) initiated its watershed-based Strategic Salmon Recovery Program in 2000. To assist PSEF with undertaking watershed recovery plans, a five-year agreement with the Pacific Salmon Foundation (PSF) was signed in July 2001, in which the PSF would be PSEF’s Program Manager.
A Technical Committee of federal, provincial, university, and independent technical experts was struck to assist with the evaluation and selection of B.C. watersheds for salmon recovery. The approach used to recovery planning is similar to Stage II of the Watershed-Based Fish Sustainability Planning Guidelines (B.C. Ministry of Fisheries, B.C. Ministry of Environment, Lands and Parks, and Fisheries and Oceans Canada, 2001).
The Technical Committee used a broad matrix of indices to evaluate watersheds, including species mix, species status, levels of enhancement and environmental impacts, and potential for recovery. The PSEFS Technical Committee identified three priority areas to focus its efforts: Central Coast, Georgia Basin, and Thompson-Okanagan. The first two Georgia Basin watersheds selected for recovery plans in 2001 were the Englishman River near Parksville on Vancouver Island and the Coldwater River near Merritt in the Thompson – Okanagan. Recovery plans for Rivers and Smith Inlets on the Central Coast, the Nimpkish River on Northern Vancouver Island, and the Squamish River were subsequently approved in 2002.
The Squamish River watershed was selected in 2002 as the third Georgia Basin candidate for recovery planning by the PSEF Technical Committee. The Greater Georgia Basin Steelhead Recovery Plan, completed in September 2002, provided much of the rationale for the selection of this watershed (GGBSRP, 2002). In its ranking of the status of major steelhead stocks in the Greater Georgia Basin, it found the Squamish River’s steelhead stocks were an “extreme conservation concern”.
The PSEF’s Technical Committee also identified other stocks (i.e., chinook and pink salmon) that were in need of restoration. This, coupled with reasonably good prospects for successful recovery, contributed to the PSEF’s selection of the Squamish River for its Strategic Salmon Recovery Program.

May 2005 - 6 - 03-1417-026
Golder Associates
1.5 Guiding Principles for Recovery Planning
The overall guiding principle that drove the development of the Squamish River salmon recovery plan was based primarily on the PSF/PSEF vision statement, which is:
“To achieve healthy, sustainable and naturally diverse Canadian Pacific salmon stocks.” – Pacific Salmon Foundation Vision Statement”
The mission of the Pacific Salmon Endowment Fund is to:
“Conserve and rebuild Pacific salmon populations through strategic and focused efforts where people and resources are mobilized to work together to achieve common goals.”
The principles of PSEF form the basis upon which policy, priorities, and decisions are made. These guiding principles are, as stated directly on the PSF website (www.psf.ca):
• The approach to salmon recovery will be holistic and supported by realistic goals.
• PSEF initiatives will mobilize and unify people and resources from all sectors to share in the responsibility and challenge of salmon recovery.
• Program focus will be achieved through the identification of priority areas and activities.
• Program areas will be defined in terms of salmonid populations at risk and their habitats.
• Priority activities and specific objectives will be identified through the development of a strategic recovery plan that is consistent with watershed-based approach.
• Recovery plans will be scientifically credible and consistent with the overarching requirement to conserve and rebuild wild stocks and naturally sustaining stream systems.
• Rebuilding activities will be consistent with the goal of reversing the decline in fish habitat and identifying harvest rates adjustments required to be responsive to changes in ocean productivity.
• PSEF activities will be coordinated with those of other groups to ensure that each initiative has the maximum potential of contributing to salmon recovery.

May 2005 - 7 - 03-1417-026
Golder Associates
• PSEF activities will be implemented through projects with the technical and local community support required to meet program goals.
• PSEF projects will be monitored and evaluated with regard to program implementation and short-term and long-term effectiveness.
Guidance was also taken from DFO’s 2004 Draft Wild Salmon Policy (WSP) goals and guiding principles. The goal of the WSP is “to restore and maintain healthy and diverse salmon populations and their habitat for the benefit and enjoyment of the people of Canada in perpetuity” (DFO 2004). Decisions will be based on three principles:
1. Conservation of wild salmon and their habitat is the first priority in resource management decision-making.
2. Resource management decisions will be made in an open, transparent, and inclusive manner.
3. Biological, social, and economic benefits and costs will be balanced.
Three objectives must be fulfilled to achieve the goal of the WSP. These are:
1. Safeguard the genetic diversity of wild Pacific salmon. 2. Maintain habitat and ecosystem integrity. 3. Manage fisheries for sustainable benefits.
Five strategies have been developed that focus on assessments of wild salmon populations, habitat, and their ecosystems to provide an indication of status. This information will form the basis for decision-making and setting long-term strategic goals for management. The final strategy provides guidance on bringing all the information together on an annual basis and on developing and implementing actions to achieve the long-term goals and objectives.
The WSP remains in draft and is subject to further review before finalization. However, its goal, objectives, and strategies have been considered during the preparation of this recovery plan, where applicable.
For steelhead populations, the MWLAP’s Draft Steelhead Stream Classification Policy and procedure was also considered in the development of the recovery plan for the Squamish River watershed. The overall policy objective is “to conserve wild steelhead stocks in BC while allowing for the development and maintenance of angling opportunities through the implementation of consistent management practices that consider and address identified risks” (MWLAP et al., 2004). The MWLAP’s policy, as stated in the document, includes:

May 2005 - 8 - 03-1417-026
Golder Associates
1. All streams containing steelhead will be classified as either wild or hatchery-augmented.
2. Streams will be classified as wild unless specifically designated as hatchery-augmented.
3. Streams designated as “wild” will be managed to maintain and protect the abundance, distribution, and genetic diversity of indigenous steelhead stocks in the province while providing angling opportunities when stock abundance permits.
4. Streams designated as “hatchery-augmented” will be managed to maintain or develop new angling, genetic introgression, and incidental mortality of wild indigenous steelhead.
5. Hatchery-augmentation will not be considered as a substitute for habitat conservation, habitat protection, and habitat restoration.
Under this Policy “Wild stock status” reflects the estimated capacity of watersheds to naturally produce spawning steelhead. As such, individual watersheds are classified as follows:
• “Routine Management” – stocks exceed 30% of habitat capacity; • “Conservation Concern” – stocks are 10% to 30% of habitat capacity; • “Extreme Conservation” – stocks less than 10% of habitat capacity; and • “Special Concern” – stocks are not well documented but believed to be very low.
The principles that provide the basis of the salmon recovery plan also reflect the Squamish Nation Mission Statement.
“Squamish Nation will protect the amalgamation and enhance the Uxwumixw Cultural values through respect, equality and harmony for all” (Squamish Nation).
1.6 Overview of the Squamish Watershed Salmon Recovery Plan
The objectives of the Squamish Watershed Salmon Recovery Plan, based on the guiding principles described above, are to:
• Identify and set priorities for activities needed to achieve the recovery plan goals by focusing on what is “good” for the fish through an adaptive management process.
• Involve and obtain buy-in from community interests to set priorities and implement the recovery plan.

May 2005 - 9 - 03-1417-026
Golder Associates
To move towards achieving these objectives, the recovery plan summarizes:
• fisheries/stock assessment data; • land and water uses; • geology/hydrology; • Squamish Nation cultural values; • Squamish River estuary; • freshwater habitat values; • information gaps; • productivity/habitat capacity estimates; • factors potentially limiting increases in fish stocks; • recovery objectives, targets, and strategies; • proposed future projects; and • proposed monitoring and implementation plan.
The information provided in the recovery plan is presented either by sub-watershed or by salmonid species depending on the nature of the data. For example, the hydrological data were more easily presented by sub-watershed, while the stock status data were more clearly presented by species. It is hoped that this recovery plan will provide a basis from which to launch the recovery process. The recovery plan will be adaptive, evolving over time to incorporate changes (e.g., ecological, land developmental, growth) in the watershed and to adjust objectives, targets, and strategies to ultimately achieve recovery of salmonid stocks. It is anticipated that annual updates of the recovery plan will be conducted.

May 2005 - 10 - 03-1417-026
Golder Associates
2.0 THE SQUAMISH RIVER WATERSHED
The following section provides a general description of the Squamish River watershed, and its geology, hydrology, land use, water use, as well as Squamish Nation cultural values.
2.1 General Description of the Squamish River Watershed
2.1.1 Squamish River Watershed Boundaries
The Squamish River watershed covers an area of about 3650 km2 and includes such major sub-basins as: the Mamquam River, Squamish River including the Elaho River, Cheakamus River, Daisy Reservoir, Cheakamus Lake, Garibaldi Lake, Rubble Creek, Brandywine Creek, and Madeley Creek. The watershed is divided by Daisy Reservoir on the Cheakamus River. The District of Squamish is located downstream of Daisy Reservoir, while the Resort Municipality of Whistler (RMOW) is located upstream of the Reservoir. A natural migration barrier to fish exists in the Cheakamus Canyon located downstream of Daisy Reservoir which prevents access of anadromous fish species to the upper watershed (i.e., above Daisy Reservoir).
Activities within the Whistler area have the potential to significantly impact fisheries resources downstream of the Reservoir. For example, further increases of sewage inputs and urban runoff from land development initiatives have the potential to increase nutrient levels below Daisy reservoir and to impact water quality. While it will be important to address impacts associated with development in the Whistler area on fisheries resources and recovery initiatives downstream of Daisy Reservoir, it was beyond the scope of the Squamish Watershed Salmon Recovery Plan. It is recommended that an assessment of Whistler impacts on downstream resources be considered in the future.
For the purposes of the Squamish Watershed Salmon Recovery Plan, the study area boundaries have been defined as: the Squamish and Elaho rivers and tributaries to the north and west; the Cheakamus River and tributaries downstream of Daisy Reservoir (excluding Rubble Creek and Garibaldi Lake); and the Mamquam River and tributaries to the east (Figure 1). The Stawamus River and tributaries has been included in the study area even though it drains directly into Howe Sound just south of downtown Squamish. The Stawamus River runs through Squamish Nation IR #24 and has significant cultural value.

May 2005 - 11 - 03-1417-026
Golder Associates
2.1.2 Squamish River Watershed Biogeoclimatic Zones
The Squamish watershed lies in three biogeoclimatic zones: Coastal Western Hemlock (CWH), Mountain Hemlock (MH), and Alpine Tundra (AT) (MoF 1991). The CWH zone occupies elevations from sea level to approximately 900 m above sea level. Western hemlock and western red cedar trees are common throughout this zone, with amabilis fir and yellow-cedar common in wetter and cooler areas, red alder on disturbed sites, black cottonwood along rivers, and Sitka spruce in a wide variety of habitats at the northern range of the zone. Wetlands, particularly bogs, are common in coastal lowland areas. The CWH zone is one of Canada’s wettest climates and most productive forest areas, (MoF 1991). The MH zone is found above the CWH zone. This coastal subalpine climate is characterized by short, cool summers, and long, cool, wet winters, with heavy snow cover for several months (Pojar et al., 1991). Mountain hemlock, amabilis fir, and yellow-cedar are the most common tree species found in this zone. Other trees include Western hemlock, Western red cedar, Douglas-fir, and Western white pine. The AT biogeoclimatic zone is located on the high mountain areas, and is, by definition, treeless, although tree species are found at lower elevations. The climate of the AT zone is the harshest of all the zones found in British Columbia and is described as cold, windy , and snowy, and characterized by low growing season temperatures and a short frost-free period (Pojar and Stewart 1991). The average temperature remains below 0ºC for much of the year.
2.2 Squamish River Watershed Geology
The geological characteristics of the Squamish River watershed are defined by volcanic mountains (e.g., Garibaldi, Cayley, and Meager) and the glacial era that ended 13,000 years ago. The mountains are steep, with distinct carved valleys, and glacial materials are present in the valley bottoms. As such, the region is prone to natural instability and frequent debris torrents.
The three main rock types found in the watershed are: granitic, metamorphic, and modern sediment (Goodings 1997). Granitic and metamorphic rocks are volcanic in origin, while sediments are glacial and continue to accumulate today (Goodings 1997). In general, sediments in the Squamish River valley are nutrient-poor, thereby limiting aquatic productivity. In contrast, eastside tributaries to the Cheakamus River, such as Brohm Creek and Rubble Creek, are more productive due to nutrient-rich sediments originating from Mount Garibaldi (G. Wilson, pers. comm., November 2004). Natural sediment deposition and transport occurs in large volumes in most Squamish rivers as a result of the surrounding geology (KWL 1998). Sediment transport on the Cheakamus River has been reduced since the construction of Daisy Reservoir. However, the effects of the dam are considered minimal as the majority of sediment has historically and continues to come from Rubble and Culliton creeks. As late as the mid-1850s a landslide off the

May 2005 - 12 - 03-1417-026
Golder Associates
“Barrier” contributed a large volume of (ca. 15-25 x 106 m3) material into the Cheakamus (Clague et al., 2002). The Culliton Creek watershed has similar cliff structures as the Barrier.
Sediments originate from both the natural landslides and those attributable to forest harvesting practices. Large volumes of sediment accumulate in the Squamish estuary. Increased sediment and debris torrents have had adverse impacts on fish habitat, such as changes in river morphology resulting in the loss of floodplain habitat, the isolation of side- and off-channel habitats and key mainstem spawning or rearing habitat, as well as sediment aggradation resulting in intermittent stream flows. Consequently, many kilometers of fish habitat have been lost over the years.
Aggradation as a result of landslides due to natural sensitivity of the watershed, as well as from forest harvesting can be expected to continue in the future. Aggressive road deactivation and landslide rehabilitation programs will help to reduce the frequency and magnitude of landslides and sediment loading, but the downstream benefits of these initiatives would not be anticipated for years.
2.3 Squamish River Watershed Hydrology
2.3.1 Squamish River
The Squamish River has an area of 2,330 km2 and an overall length of 90 km. It has an accessible length of 70 km for anadromous fish. Its mean annual discharge (MAD) at Brackendale is 238 m3/s and summer base flows average approximately 114% of MAD as a result of summer snow and glacier melt (Lill 2002). Its mean monthly discharge ranges from 86.3 m3/s to 493.5 m3/s (Levy and Davies 1997). High flows are typically observed during snow and glacial melt starting in April and peaking in July, and then flowing high again in October and November due to significant rainfall events. Low flows are typically observed during colder winter months and during dry, late summer months (Figure 2). Low temperatures and nutrients contribute to low productivity in the mainstem. Nutrient levels tend to be higher in tributaries, especially those on the northeast side due to volcanic geology; west side tributaries (e.g., Ashlu Creek) seem to be more nutrient-poor (Slaney 2003).
The major tributaries to the Squamish River contribute significant flows. The Elaho River contributes approximately 50% of the flows to the Squamish River, with the remainder provided by the Cheakamus and Mamquam rivers and other smaller tributaries (Levy and Davies 1997). These tributaries tend to exhibit high and flashy flows at times, and high siltation and subsequent poor water clarity due to the naturally unstable terrain. The Cheakamus power diversion to the Squamish River (at about Mile 22) provides additional

May 2005 - 13 - 03-1417-026
Golder Associates
flow to the Squamish River with a discharge of 63 m3/sec compared to the river’s MAD of 238 m3/s.
A list of Squamish River tributaries extracted from Tobe (1998), from the headwaters to its mouth, is provided in Table 1.
Table 1: Squamish River Tributaries
Thirty-Six Mile Creek Ashlu Creek Evans Creek Elaho River Madden Creek Cheakamus Creek
Twenty-Eight Mile Creek Mawby Creek Thyestes Creek Turbid Creek Zenith Creek Lewis Creek
Shovelnose Crek Spring Creek Fries Creek Chuck Chuck Creek Pilchuk Creek Mamquam River
Coho Creek Tantalus Creek Railway Museum Slough High Falls Creek Serratus Creek Monmouth Creek Branch 100 Creek Alpha Creek July Creek
Lost Creek Chicken Soup Slough Mile 13 Judd (Jimmy Jimmy) Slough Horse Creek June Creek
2.3.2 Elaho River
The Elaho River is a large, glacial stream that joins the Squamish River 53 km upstream at the northern boundary of the study area. Levy and Davies (1997) report mean daily flows ranged from approximately 20 to 200 m3/s, based on data collected from 1955 to 1990. The watershed is largely undeveloped, with the exception of logging and associated road construction. A confined canyon in the lower five kilometers restricts the upstream movement of anadromous salmonids. It is believed that two large boulders and associated debris, possibly from road construction (S. Rochetta, pers. comm., January 2004) at the upper end of the canyon restrict salmon access to the large amounts of suitable habitat; the densities of juvenile coho and chinook in these reaches are low (S. Rochetta, pers. comm., January 2004). The selective removal of debris could improve access (J. Matsen, pers. comm., December 2003). This river has significant potential for the construction of run-of-the-river hydro facilities.
2.3.3 Ashlu Creek
Ashlu Creek drains into the Squamish River approximately 28 km north of Squamish, in the Squamish River Valley. The Ashlu watershed covers about 340 km2, with tributaries to Ashlu Creek including Pokosha, Tatlow, Pykett, Coin, Sigurd, Roaring, Marten, Shortcut, and Red Mountain creeks. Of the tributaries, Sigurd Creek provides wetland
May 2005 - 14 - 03-1417-026
Golder Associates
habitat and valuable fisheries resources. Anadromous salmonids have access to approximately the first 3 km of the Ashlu mainstem before the channel becomes an impassable canyon. Much of the watershed is characterized by steep terrain, a product of glacial carving. Consequently, much of the Ashlu valley has steep and naturally unstable slopes, which have been exacerbated by past logging activities. Ashlu Creek mainstem alters between canyonized and alluvial sections comprised of a meandering channel with boulders and coarse gravel. Steep gradients exist in the canyonized sections. The lower 2.5 km of Ashlu Creek is accessible to anadromous salmon.
Runoff and water flows in the Ashlu and associated tributaries are not measured, however Dillon (1998) report statistical estimates of stream flow from a regional analysis of nearby Water Survey of Canada gauged basins. Based on this information, mean monthly flow estimates for Ashlu Creek ranged from 6.39 m3/s in January to 57.80 m3/s in July. Flows were typically low in January to March and increased in April, peaked in July, and gradually decreased until December. The mean annual monthly flow was 25.44 m3/s. The estimated mean daily maximum flood flows ranged from 350 m3/s for a 10-year flood to 572 m3/s for a 200-year flood (Dillon 1998).
Preliminary baseline flow data were obtained from Ledcor as part of their baseline investigation associated with the proposed Independent Power Project (IPP) on Ashlu Creek. Intermittent flow data collected between 1991-1992, 1992-1993, and 2001-2002 indicate average flows between 24.9 and 29.9 m3/s, maximum flows between 85.3 and 217.3 m3/s, and minimum flows between 1.6 and 4.2 m3/s on an annual basis (K. Boychuk, pers. comm., August 2004).
2.3.4 Cheakamus River
The Cheakamus River is located on the east side of the Squamish River, occurring about 15 km upstream of the Squamish estuary. The Squamish Nation Indian Reserve (IR) #13 (Poquiosin & Skamain) is located at the mouth of the river, while a portion of IR #11 (Cheakamus) is located on the west side of the river (Figure 1). The Cheakamus River, in general terms, can be divided into upper and lower sections. The upper section is comprised of the mainstem and tributaries above the Daisy Lake Dam, built in 1957, including Daisy Reservoir, and receives all of the tertiary treated sewage from the municipality of Whistler. The lower section, approximately 26 km in length, is comprised of all reaches and tributaries below the dam. The anadromous section of the Cheakamus River (approximately 16.5 km long) has been divided into eight reaches under B.C. Hydro’s WUP process, of which reaches 1 through 8 are accessible to anadromous salmon. Upstream of Reach 8, several rapid and fall sequences within a confined bedrock controlled channel exist and prevent further upstream migration of fish.

May 2005 - 15 - 03-1417-026
Golder Associates
Flows from the dam itself are diverted via a power diversion from Shadow Lake Reservoir to the Squamish Valley via a 11-km-long tunnel that runs through Cloudburst Mountain (B.C. Hydro 2003). Water is discharged into the Squamish River after passing through the Cheakamus generating station via twin penstocks (B.C. Hydro 2003). Under normal operating procedures, water levels in Daisy Reservoir fluctuate by 12.35 m between 364.90 m and 377.25 m above sea level (B.C. Hydro 2003).
Prior to dam operation in 1957, the hydrology of the Cheakamus River was driven by climatic and weather changes. Mean annual flow in the Cheakamus River at Brackendale from 1957 to 1990 was 31.5 m3/s, with mean daily flows ranging between 4.81 m3/s to 694 m3/s (Triton 1993). During the typical seasonal cycle, flows would start to increase in April and freshet would peak in June and July as a result of snow and glacial melt. Flows would decrease gradually in August and September, and reach their lowest levels by March. However, sporadic peaks in flow would occur throughout the year, particularly between September and January, as a result of storm events (ESSA 2002). Mean annual flow prior to dam operation was estimated at 64.0 m3/s (Triton 1993).
Since construction of the dam, the hydrology of the lower Cheakamus River has been based on operational flow releases from the dam and input from tributaries below the dam. Approximately 50-75% of flow inputs originated from above the dam, while 25-50% of flows originate from below the dam (ESSA 2002). From 1958 to 1995 the dam operated at full capacity to generate maximum power (ESSA 2002). A hydrograph of the Cheakamus River is provided in Figure 3. Impacts resulting from the dam and dam controlled flow regimes include changes in sediment/gravel recruitment and flow patterns. A report produced by Northwest Hydraulics (NHC) estimated that coarse sediments have been reduced by half between the Culliton and Cheekye rivers and by as much as a third below the Cheekye, although they could not be precise (NHC 2000). Furthermore, channel-forming flows have decreased by up to 15% and the effects of the dam operation in low-flow years effectively eliminates the spring snowmelt freshet from Daisy Reservoir. NHC (2000) theorize “that one consequence of this change is thought to be the establishment and growth of pioneering vegetation (primarily alders) on bar surfaces. This pioneer vegetation traps fine sediment and organic debris and helps stabilize these bars”. There has been marked revegetation of most bars in the river.
Tributaries to the Cheakamus River located downstream of the Daisy Reservoir are presented in Table 2. The three major tributaries that contribute to Cheakamus mainstem base flows are: Rubble Creek; Culliton Creek; and Cheekeye River. These creeks play an important role in maintaining the hydrological conditions in the lower Cheakamus River (ESSA 2002). Rubble Creek provides a stable groundwater flow originating from Garibaldi Lake, and also provides a source of nutrients. Cheekeye River is a major contributor of sediment and gravel to the lower Cheakamus River. However, sediment contributions from the Cheekeye River and other tributaries accumulate and degrade

May 2005 - 16 - 03-1417-026
Golder Associates
habitat further downstream (G. Wilson, pers. comm., November 2004). As such, there is debate regarding the value of the Cheakamus River below the Cheekeye confluence for spawning as it is often blown out and silted over as a result of the volatility of the Cheekeye. According to a report by ESSA (2002), the source of gravel from the Cheekeye has become increasingly important since the dam cut off upstream gravel supplies. Cheekeye gravels likely flushed out of the Cheakamus River during high flows to become an important component of the Squamish River below the Cheakamus.
Table 2: Cheakamus River Tributaries Below Daisy Reservoir
Rubble Creek Hut Creek Chance Creek Tenderfoot Creek Culliton Creek Cheekeye Creek
Swift Creek 2.3.5 Mamquam River
The Mamquam River is a major tributary to the Squamish River, with its confluence located just north of the town of Squamish. The watershed area encompasses approximately 334 km2 and has a mean annual discharge of 25.5 m3/s. According to a 1994 flood hazard management plan prepared for the District of Squamish, potential flood hazards related to the Mamquam River were identified in Garibaldi Estates, North Yards, Dentville, and downtown Squamish (Klohn Leonoff 1994). An Environment Canada water gauge is located above Ring Creek, a tributary to the Mamquam River. A hydrograph is provided in Figure 4.
The upper watershed is the site to past and present timber harvesting activities. An impassable barrier, marking the upper limits of anadromous salmonid distribution, is located approximately 6.6 km upstream from the mouth. There are ten tributaries to the Mamquam River (Table 3). The anadromous barrier lies between Raffuse and Ring creeks.
Table 3: Mamquam River Tributaries
Crawford Creek Ring Creek Meighn Creek/Harris Slough Martin Creek Mashiter Creek
Skookum Creek No-Name Creek Raffuse Creek Thunderbird Creek

May 2005 - 17 - 03-1417-026
Golder Associates
In the mid-1990s, Northern Utilities Inc. constructed a hydroelectric plant adjacent to the anadromous barrier (i.e., upstream of the canyon) on the Mamquam River. A second hydroelectric plant is being developed by Canadian Hydro Developers Inc., and is scheduled to be in operation in June 2005.
2.3.6 Stawamus River
The Stawamus River watershed comprises 40.6 km2 of mountainous terrain immediately east-southeast of the District of Squamish, and southeast of Valleycliffe. The Stawamus River does not lie within the Squamish River watershed, but drains directly into Howe Sound. The lower reach passes through Stawamus IR #24, and flows under Highway 99 and the B.C. Rail line. An impassable barrier marking the upper limits of anadromous salmonid distribution is located approximately 5 km upstream from the mouth. Water flows in the Stawamus River are typical of coastal mountain ranges and are dependent on rainfall, snow melt, and groundwater inputs (Anon 1998). Due to high urban impacts in the watershed, flows are also affected by urban runoff. Water flows are typically low in the summer dry periods and increase with increased rainfall in the winter months (Anon 1998). A low flow rate of 0.20 m3/s was reported based on a one-day measurement; while instantaneous peak flow was estimated to be 110 m3/s for a 20-year return (Anon 1998). A hydrograph is provided in Figure 5.
The Little Stawamus River is the major tributary to the Stawamus River. The two rivers confluence just upstream of the Highway 99 bridge. The Little Stawamus River runs mainly through residential areas in its lower section. The upper section, above an anadromous barrier, is largely unimpacted and supports resident salmonid populations.
2.4 Land Use in the Squamish Watershed
Several sources were consulted regarding land use in the Squamish watershed. Documents reviewed included the District of Squamish (1998), Squamish 2000 Plan (updated July 2003; Aplin and Martin et al., 2003), Squamish Nation Land and Resources Committee (2001), Levy and Davies (1997), The Squamish Downtown Waterfront Concept Plan (UBC 2004), and Tobe (1998). In addition, individuals from the Squamish Nation, District of Squamish, MWLAP, DFO, MoF, and the community were contacted (Appendix I).
There are a number of different land use designations within the Squamish River watershed, including Indian Reserves, Tree Farm Licenses (TFL), provincial park boundaries, municipal land, Crown land, B.C. Hydro land, and B.C. Rail land. Land use designations are depicted in Figures 1 and 6.

May 2005 - 18 - 03-1417-026
Golder Associates
2.4.1 Forestry
The Squamish River watershed lies in the Squamish Forest District, and within a portion of the Soo Timber Supply Area (TSA) and all of TFL 38. The impacts of logging activities on fish and fish habitat have been well documented (Slaney and Martin 1997). On steeper slopes typical in coastal regions of B.C., logging activities and the associated loss of riparian vegetation have caused increased frequencies of landslides and increased peak flows resulting in increased sediment transport from hillslopes and stream banks. The increase in sediment bedload has caused widening of mainstem channels, particularly in unstable and unconfined logged floodplains, infilling of coarser substrate, and blocking of side-channel and off-channel habitat. These conditions have, in turn, contributed to the decline of salmonid stocks by reducing productive capacities of freshwater habitat.
Logging of old-growth forest has also reduced the source of large woody debris (LWD) to streams. Slaney and Martin (1997) stated that the loss of LWD to streams has had the greatest impact on habitat of stream-rearing (e.g., coho, steelhead) and resident fish through a reduction of instream habitat complexity. A lack of LWD and a decrease in habitat complexity has resulted in a decline of juvenile salmonids that overwinter in freshwater habitat. Other changes to stream morphology and fish habitat, as a result of increased logging activities, include changes in water temperature, stream bank vegetation and stability, nutrient supply, and streambed stability and substrate composition.
Recovery of these logging-induced changes in watersheds span decades to centuries. Changes in nutrients or temperature may be observed in the short-term, however, recruitment of LWD from old-growth or mature forests can take centuries. D’Aoust and Millar (1999) predicted full recovery of LWD abundance in streams to pre-logging conditions to take up to 250 years.
Based on observations in Carnation Creek, re-establishment of old growth forest conditions and restabilization of a watershed is a phased approach. The reorganization phase following logging activities likely takes 1 to 20 years (Hartmann and Scrivener 1990). During this period of reorganizing, conditions within a watershed are unstable. Typical changes observed included increases in light and stream temperatures, an imbalance of geochemical conditions (e.g., nutrient loss, erosion), instability in biotic communities (e.g., disequilibrium between nutrient levels, primary and secondary production), and increased variability in fish population numbers (Hartmann and Scrivener 1990). Stabilization of these conditions is anticipated to occur following the period of reorganization, but the process is thought to be long, slow, and intimately tied to forest re-growth (Hartmann and Scrivener 1990). Establishment of riparian vegetation occurs within the first 20 years, and a shift from deciduous to coniferous species has been observed 15 to 25 years following disturbance (Hartmann and Scrivener 1990).

May 2005 - 19 - 03-1417-026
Golder Associates
Establishment of a coniferous forest is anticipated to require 60 to 100 years. As the riparian vegetation grows, water uptake will increase gradually, thereby decreasing flows in the streams. It is anticipated that stream flows during summer will decline over a 50-to-100-year period. In the Carnation Creek system, initiation of bank and channel stabilization was observed 30 years post-harvest, but establishment of streambed structure and composition to pre-logging conditions is likely to take more than 100 years (Hartmann and Scrivener 1990). Given these long time frames for recovery of watershed ecosystems following forest harvest activities, recovery success of a watershed, as well as fish populations, will depend largely on future forest harvest plans.
Historically, timber harvesting has been a major resource development activity within the watershed, with the first commercial logging in the Squamish Valley beginning in the early 1890s. In 1915, with the completion of the Pacific Great Eastern Railroad between Squamish, Pemberton, and the Interior, the pace of the commercial logging activities in the Squamish Valley hastened. In addition, the heightened demand of lumber internationally, as well as the surge for minerals and fish and the new technology industry of pulp and paper, led to an increase in the pace of commercial logging activities. In the 1950s, the methods of logging changed, with the introduction of diesel trucks and chainsaws, which ultimately accelerated commercial logging activities. As such, the Squamish watershed has been heavily logged, and significant impacts to stream channel morphology, floodplain habitat, and to fish populations and fish habitat have been observed in the watershed.
An assessment of the status of logging activities and impacts in each of the major sub-watersheds of the Squamish watershed was provided by S. Rochetta (pers. comm., January 2004).
Elaho River
Portions of the Elaho are heavily logged while other portions remain untouched. As such, fish and fish habitat in the watershed have been affected by increased landslides and sedimentation, reduction of LWD, and reduction of habitat complexity. The second growth in the drainage has attained 75%+ hydrological recovery based on age of trees (S. Rochetta, pers. comm., January 2004). Future forest activities are not proposed for another 40 years.
Squamish River
Areas of the Squamish River are heavily impacted by logging activities. River banks and riparian areas are unstable in some areas resulting in increased sedimentation. The mainstem channel has widened and become unstable, thereby changing the natural river morphology. Side-channel and off-channel habitat have been cut off from mainstem access, reducing available fish habitat (e.g., overwintering and refuge habitat). The west

May 2005 - 20 - 03-1417-026
Golder Associates
side is largely untouched below the Elaho River and contains some areas of high ecological value. The hydrology of the river is expected to continue to improve as second growth development occurs.
Ashlu Creek
Ashlu Creek has been significantly affected by logging and has had problems with road failures. Logging now is limited to small old growth patches and second growth logging is approximately 30 years away. Many of the road problems are being repaired and hydrological recovery in the drainage appears to be occurring.
Cheakamus River
The lower portion of the Cheakamus River has been heavily logged and is in second growth, while the upper portion has been highly impacted and limited logging continues in some places. The sub-watershed is experiencing hydrological recovery and is buffered largely by Daisy Lake Dam (i.e., water levels are controlled). Second growth logging is anticipated in 40 years.
Mamquam River
The majority of the Mamquam River watershed has been logged. This has resulted in a low capacity to absorb precipitation, many kilometers of poorly designed access roads that contribute sediment to downslope fish streams, and many impacts to the riparian areas due to logging in young forests less than 20 years old. Since 1996, under Forest Renewal BC, many of the historically poorly designed roads have been rehabilitated. Present forest harvest consists of small old growth and some limited opportunities in second growth in the lower part of the watershed.
Due to reduced logging pressures, the drainage continues to improve its capacity to retain precipitation, and the lower half of the watershed is largely hydrologically recovered as the replanted forest matures.
Summary and Recommendations
Historically, the Squamish watershed and its fish populations and habitat have suffered the typical impacts associated with logging activities. While slope instability associated with past logging activities remains an issue in the Squamish River Watershed, reduction in the rate of logging combined with more stringent regulatory requirements (e.g., FRPA), rehabilitation of access roads to reduce erosion and sedimentation, and improved harvesting techniques, have resulted in some improvements to the hydrology and stability of historically logged and unstable hillsides. Continued improvements to the

May 2005 - 21 - 03-1417-026
Golder Associates
hydrology and stability of the watershed will assist in the recovery of salmonids as long as this outpaces the rate of future proposed logging activities.
Recommendations:
• To assist with the recovery of salmonids in the watershed, future forest practices and the Forest and Range Practices Act (FRPA) should protect the hydrological values of this drainage to increase hillslide stability, reduce erosion and protect high value ecological areas.
• As future forestry activities will continue, harvest plans should be incorporated into the salmon recovery plan on a regular basis to promote a net improvement in the hydrology and fishery of the watershed.
2.4.2 Agriculture
Squamish currently has 350 hectares within the Agricultural Land Reserve (ALR). These lands are located along the Squamish River valley flats. These lands are used primarily for livestock. However, re-zoning of a portion of the ALR is currently being considered to make this land available for development. Agricultural lots are lost regularly to land development applications.
2.4.3 Residential
In a 1996 Statistics Canada census, the District of Squamish recorded a population of 13,944 in 4,935 dwellings. In 1999, the population of Squamish was estimated at 15,359 and is forecasted to grow to between 25,000 and 28,000 by the year 2019 (Aplin & Martin et al., 2003). The District of Squamish has a land area of 10,853 hectares. “Within this area is a developable land base that can easily accommodate the target population of 30,000 in this Official Community Plan,” (District of Squamish 1998).
The majority of the population resides in the valley flats associated with both the Squamish and the Cheakamus rivers. Newer residential developments are located in Garibaldi Highlands, located on the slopes of Mount Garibaldi to the east of the Squamish and Cheakamus rivers. The floodplain of the Meighn Creek watershed, located at the foot of Mount Garibaldi, continues to be developed for residential and recreational purposes. Additional residential areas are located in Valleycliffe, an area to the southeast of downtown Squamish, and at the foot of the Squamish Chief. Approximately 1,000 people live in the downtown Squamish area, which is slated to undergo tremendous development over the next 20 years. According to a recent study, the plan for downtown Squamish is to ensure that it is recognized as “the heart and soul of the community and

May 2005 - 22 - 03-1417-026
Golder Associates
the place to be whether it is as a shopper, resident, visitor, worker or at play” (Aplin & Martin et al., 2003). Projected 20-year growth estimates that 3,000 people will reside in the downtown area; a 300% increase over 1999 population estimates. The planned development strategy for the downtown Squamish area proposes multiple residential, multiple residential/mixed use, artisan live-work, core mixed use, entertainment mixed use, marine commercial, highway commercial, public institutional, greenspace, and utilities. This proposal is subject to the development of the existing 77.5 acres of vacant downtown land and redevelopment of existing underdeveloped lots (Aplin & Martin et al., 2003).
Land development and associated population growth in the Squamish watershed pose the most significant threat to the recovery of salmonid populations in the watershed.
Recommendation:
• Urban creeks, such as Meighn Creek and Loggers Lane Creek, as well as other “key critical” fish habitat (e.g., urban streams, estuary) in urban Squamish should be protected from further impacts to at least maintain their current productivity and/or to restore or rehabilitate habitat productivities.
2.4.4 Industrial Areas
Within the Squamish River watershed are two industrial areas according to the Squamish Official Community Plan (OCP). Collectively the Port of Squamish, the adjacent Downtown South area, and the area along the Mamquam Blind Channel are considered one of Squamish’s major industrial areas, while the Squamish Industrial Park and the adjacent B.C. Rail yards another industrial area. Industrial activities in these areas include saw mills, log storage and sorting, the Municipality of Squamish, two decommissioned chemical plant sites, and a deep sea port facility. A third industrial area is located south of the study area, on the west side of Howe Sound and is reached only by ferry. Known as the Woodfibre Pulp Mill, this operation was constructed in 1912 and boasted a population of over 1,000 residents in the 1930s. In 1998 it was largest employer in Squamish (District of Squamish 1998). A maze of roadways, highways, and railways provides alignment within the city and district boundaries as well as with Whistler to the north and the Lower Mainland to the south.
The District’s primary commercial business is expected to grow from 32,000 in 1999 to 58,000 in 2019 (Aplin & Martin et al., 2003). As such, a short-term and long-term downtown development strategy has been prepared to develop a desirable and attractive downtown area (Aplin & Martin et al., 2003). According to this plan, to accommodate the projected increase in population growth and commercial businesses, new retail

May 2005 - 23 - 03-1417-026
Golder Associates
floorspace, new office floorspace, and new homes will be constructed in the downtown area (Table 4).
Table 4: Downtown Squamish Land Use Activities in 1999 and 2019 (Data Obtained from Aplin and Martin et al., 2003)
Residential (# of units) Retail (ft2) Office (ft2)
Total 1999 440 340,000 156,000 Total 2019 1425 540,000 226,000 Estimated 20-year growth 985 200,000 70,000 2.4.5 Landfills
Former Squamish Landfill
The former Squamish Landfill, located in the northwest corner of the town, south of Loggers Lane and east of the B.C. Rail tracks, operated from approximately 1958 until sometime between 1978 and 1985. The former landfill footprint occupies around 3.0 hectares within the Squamish River delta.
Cheekeye Fan Landfill
The Cheekye Fan Landfill is located west of Alice Lake Provincial Park, east of the Squamish airport, and south of the Cheekeye River, off the Squamish Valley Road. The landfill has been in operation for approximately 20 years, since the closure of the former Squamish Landfill. Based on the capacity of the landfill, the District of Squamish expects that the Cheekye Landfill will continue to operate until 2008. The landfill is not lined and receives approximately 12,000 tonnes of refuse per year, including domestic, demolition, and other non-hazardous waste materials. A proposal is currently being considered by the District of Squamish to assess the feasibility of expanding and upgrading the existing facility into a modern Regional Waste Disposal facility to accommodate the entire Sea-to-Sky corridor.
2.4.6 Resource Extraction
Information on mining activities was taken from the B.C. Ministry of Energy and Mines website (www.em.gov.bc.ca/mining/geolsurv/minfile). This information indicated that mining activities in the Squamish area have included both mineral and gravel extraction.
The Ashlu Mine is situated at the confluence of Roaring Creek with Ashlu Creek, located 45 km northwest of the town of Squamish. The Ashlu Mine is not active, but in the past was primarily mined for silver and gold and to a lesser extent copper, zinc, and tungsten.

May 2005 - 24 - 03-1417-026
Golder Associates
Underground mining started in 1923. In 1937, a mill was constructed at the mine site and operated intermittently for two years, until the ore was depleted. In 1979, another mill was built at the site, and from 1979 to 1985, an extensive development program was carried out by Osprey Mining and Explorations Ltd., which resulted in a total of 300 m of underground development. The last recorded production at the Ashlu Mine was 36 tonnes in 1984. As of 1994, the former Ashlu Mine is owned by L. Demczuk. The surrounding area was re-staked and geologically mapped as the Ashlu 1 to 5 claims. The mine was located several kilometers up the Ashlu Creek.
Squamish sand and gravel quarry/Saber, located at Evans Lake, is closed and a reclamation plan has been developed. Another quarry is located on the south bank of the Mamquam River, just above the Forest Service Office. Potential impacts to fish populations in the Mamquam River include increased potential for slope failure and erosion. Mining activities are currently being conducted on Chance Creek and Loggers Lane.
2.4.7 Parks
There are ten provincial parks and one ecological reserve located within the Squamish River watershed study area (Figure 1). They include:
• Alice Lake Provincial Park; • Baynes Island Ecological Reserve; • Brackendale Eagles Provincial Park; • Brandywine Falls Provincial Park; • Callaghan Lake Provincial Park; • Clendenning Provincial Park; • Garibaldi Provincial Park; • Shannon Falls Provincial Park; • Stawamus Chief Provincial Park; • Lake Lovely Water Provincial Park; and • Tantalus Provincial Park.
Some of the parks provide ecological protection (e.g., Baynes Island Ecological Reserve), while others provide a host of recreational opportunities for the community and are attractive destinations for visitors to the area.
A portion of Garibaldi Provincial Park and Clendenning Park are also included in the study area. As part of the Protected Area Strategy, Clendenning Park was designated a park in 1998, and consists of 30,000 ha within TFL 38.

May 2005 - 25 - 03-1417-026
Golder Associates
2.4.8 Reserves Lands
The Squamish River watershed is located within the asserted traditional territory of the Squamish Nation. The Squamish Nation traditional territory covers an area of 6,700 km2, of which approximately 28.48 km2 comprise reserve lands. There are fourteen Squamish Nation Reserve Lands within the study area, as presented in Table 5 and shown in Figure 1.
Table 5: Squamish Nation Indian Reserves
Reserve Size (Hectares) Skowishin IR #7 29.7
Chuckchuck IR #8 0.1 Poyam IR #9 0.3
Skowishin Graveyard IR #10 0.04 Cheakamus IR #11 1,638 Yookwitz IR #12 9.3
Poquiosin & Skamain IR #13 45.2 Waiwakum IR #14 15 Aikwucks IR #15 11.1 Seaichem IR #16 27.5 Kowtain IR #17 23.2
Yekwaupsum IR #18 1.6 Yekwaupsum IR #19 0.9
Stawamus IR #24 16.3 Total Area 1,818.24
2.4.9 Environmentally Sensitive Lands
According to the Squamish OCP, environmentally sensitive areas include the Squamish Estuary, Brackendale Eagle Reserve, Baynes Island Ecological Reserve, and the Mamquam Blind Channel. The Squamish Estuary, for example, includes 486 hectares as a Conservation Area to be preserved for recreation, habitat protection, and public education purposes (District of Squamish 1998). The Brackendale Eagle Reserve, located from the mouth of the Mamquam River to beyond the confluence with the Cheakamus River on the Squamish River, consists of a mix of Crown land, Indian Reserves, and private ownership, totaling 647 hectares. Baynes Island, 71 hectares in size, is an ecological reserve located on the Squamish River, downstream of its confluence with the Cheakamus River.
The Federation of B.C. Naturalists’ Land for Nature Initiative (FBCN), with support from Squamish community groups, compiled a list of important natural areas and streams

May 2005 - 26 - 03-1417-026
Golder Associates
within the District of Squamish from 1996 to 1997. Based on the information gathered, 27 sites were selected as sensitive, but not all were deemed as requiring protection. Copies of FBCN Environmentally Sensitive Lands can be obtained directly from the FBCN by calling (604) 737-3057.
The 27 sites included:
• Stawamus Chief Provincial Park, Malamute, and Isolated Marsh; • Cattermole Watershed; • Wilson Crescent Slough; • Dentville Wetland and Connectors; • Little Stawamus Watershed; • Wood’s Woodlot; • Kiewit Marsh; • Upper Mamquam – Blind Channel to Smoke Bluffs; • Lower Mamquam – Blind Channel; • Central Channel Watershed; • Squamish River mouth (estuary); • West Squamish Roost Sites; • Railway Museum Slough; • Loggers Lane and Finch Creek; • Mashiter Creek; • Mamquam River spawning grounds; • Fries Creek mouth; • Squamish River – Meighn Creek and tributaries; • Squamish River – Dryden Creek and tributaries; • Judd Slough and tributaries; • Brackendale Woods; • Baynes Island Ecological Reserve; • Alice Lake Provincial Park; • Evans Creek; • Lower Cheekye and Lower Cheakamus River; • Middle Cheakamus River; and • Brohm Creek Watershed.
The SEMP in 1999 described the designation of a Wildlife Management Area (WMA) encompassing the Squamish River Estuary and comprising 561 ha (1,386 acres). The management area is to be created and managed by MWLAP in conjunction with local interests groups, including the Squamish First Nation. An additional 30 ha (74 acres) is to be transferred to the Squamish Nation and placed under a restrictive “Wildlife Management” covenant. The management objectives for both areas include maintaining and enhancing the productive capacity of the estuary and dealing with public access issues (SEMP, 1999). The Wildlife Management Area Plan is currently being developed and is expected to be completed in 2006 (Bell, 2005).

May 2005 - 27 - 03-1417-026
Golder Associates
Recommendations:
• Those sites requiring protection should be based on their contribution to fish or wildlife productivity in the watershed, and the potential for adverse impacts from proposed land development projects.
• Protective measures of sites deemed as providing key habitat should be implemented prior to disturbance from land development activities.
2.5 Squamish Nation Cultural Values of Salmon
The Squamish Nation is deeply tied and connected to the land and waters that encompass their traditional territory. Amongst many other activities, fishing is vitally important to the Squamish culture. Well over 60 species of fish, beach foods, and marine mammals are known to the Squamish people as reviewed by Kennedy and Bouchard (1979). Their traditional Squamish names, methods of utilization and preparation, and the roles these species played in stories and legends are well-documented in both oral history and in written literature. All five species of anadromous salmon, char, and steelhead were traditionally caught in Squamish waters (Squamish Nation 2001).
All of the Squamish Nation reserves are strategically placed at the confluence of major fish-bearing watercourses, indicative of an area historically abundant in fish. In fact, the traditional meaning of Cheakamus refers to a “place of weirs” (R. Lewis, pers. comm., August 2004). Before contact with the white man, salmon were plentiful, quoted as “existing as millions of fish of all species”, as were other environmental resources (R. Lewis, pers. comm., November 2004). Following contact, fish populations and other environmental resources started to decline. With more development and resource extraction from the watershed, the dynamics of the rivers changed dramatically, also impacting the fisheries.
In an overview study of the status of the marine ecosystem in Howe Sound, Harding (1973) reported that halibut are no longer fished in the Sound and that lingcod populations have declined to levels where recreational fishing restrictions are necessary. Benthic invertebrate communities have been affected by pulp mill fibre beds at Woodfibre, metal leaching from Britannia Mine, domestic and municipal sources, log booming activities, chemical plants, and other industrial uses (Harding 1973). Hunting for humpback whales by the Howe Sound Whaling Company ceased in 1908 when the species was designated as extirpated as a result of overfishing. The commercial salmon fishery in Howe Sound closed in 1971 as a result of mercury contamination from a chlor-alkali plant. The salmon fishery was re-opened later, but was limited to a recreational fishery. Increased industrial pressures also resulted in the elimination of a major herring spawning area in the Squamish Estuary. Increases in metal concentrations

May 2005 - 28 - 03-1417-026
Golder Associates
from Britannia Mine and dioxin and furan concentrations from pulp mill facilities have been observed to bioaccumulate in mussels and oysters, resulting in closures. While new regulations have resulted in the decrease in some of the contaminants of concern, and a re-opening of some fisheries, the marine resources in Howe Sound and the Squamish Estuary continue to be subject to development pressures, and thus also to Squamish Nation cultural values.
2.5.1 Fishing Sites
Suitable locations for fish procurement are still held by individuals/families, passed down through generations. Ownership of fishing sites along the Squamish River is recognized by common consent and is still honoured and respected today. Many of these fishing sites are associated with traditional place names.
2.5.2 Distribution of Fish
The distribution of fish is an important aspect in Squamish Nation culture. As stated in Kennedy and Bouchard’s review of Squamish Nation culture, when a fisher returned with the catch, the “excess” were distributed to other people. This distribution was not only a way of showing respect, but also was a way of not offending the salmon.
2.5.3 Squamish Nation Community Values and Perspectives
The Xay Temíxw Land Use Plan describes how the Squamish Nation community wants the land and resources to be protected, managed, and utilized for the benefit of present and future generations (Squamish Nation 2001). With regard to the fish and aquatic habitat, stream restoration is identified as a priority for Squamish Nation members. The loss of herring, eulachon, loss and damage to fish habitat in the territory, and the reduction in the number of fish caught, to name only a few concerns have been identified by members through a series of community meetings and interviews. As a result, management objectives have been formed to address these concerns, including the restoration, conservation, and rehabilitation of habitat, and rebuilding and enhancement of salmon stocks. Squamish Nation members are currently working in partnership with the Squamish community to restore, protect, and recover salmon populations.
2.6 Whistler
Although the study area boundary defined for the purposes of this salmon recovery plan does not include the Whistler area, there is some concern regarding downstream impacts to the Cheakamus River as a result of Whistler’s continued growth. Whistler currently supports 10,000 permanent residents and two million annual tourists. Due to fast growth rates observed in the 1990s and early 2000s, which are likely to continue, the resulting

May 2005 - 29 - 03-1417-026
Golder Associates
pressures on Whistler’s infrastructure, economy, and environment may reach unsustainable levels. The Municipality is quickly reaching its capacity of 55,000 bed units. As such, land development activities in the Whistler area should be carefully monitored to prevent the potential for adverse effects on the environment, particularly downstream in the Cheakamus River. Two documents that speak to the policies regarding land use, development, long-term vision, priorities, and plan for a sustainable future of the Whistler area include “The Official Community Plan (OCP) for the Resort Municipality of Whistler”, compiled in September 1993 (Consolidation as of March 14, 2002) and the “Comprehensive Sustainability Plan” (CSP), which is currently in a draft stage (RMOW 2004). The CSP outlines Whistler’s strategies on addressing such concerns as wastewater, community water supply, housing, transportation, energy, natural areas protection, and the environment to achieve a sustainable future. Following the adoption of the CSP, amendments to the OCP will be enacted to ensure that municipal policies are aligned.
Recommendation:
• The Squamish community should be informed as to the development plans in Whistler so that they have an opportunity to protect the environment where possible. Perhaps the largest scale development that has the potential to impact water quality and/or habitat in the Cheakamus River and associated tributaries in the area near Whistler is the upcoming Vancouver 2010 Olympics and Paralympic Winter Games.
2.7 Water Use
There are a variety of different water users in the watershed, including Independent Power Producers (IPPs), hydroelectric dams, water licenses, wastewater treatment, community drinking water, and recreational users. With the projected growth in residents and businesses anticipated over the next 20 years, water supply will be in increasing demand. Increases in water withdrawals will continue to have adverse impacts on fish and fish habitat.
Recommendation:
• Assessments of feasible water supply sources will need to be conducted to select and prioritize suitable water sources for human consumption while also protecting aquatic habitat.

May 2005 - 30 - 03-1417-026
Golder Associates
2.7.1 Independent Power Producers
In 1989, British Columbia’s Ministry of Energy instructed B.C. Hydro to issue calls for proposals for private power, and the independent power producer (IPP) industry was launched. It has been estimated that 150 IPP proposals are being considered for the Squamish watershed.
In the 2001/2002 Green Power Generation Call, the Upper Mamquam River run-of-the-river hydroelectric project developed by Canadian Hydro Developers Inc. (Canadian Hydro) was amongst the successful proposals. The project has been approved and is currently under construction. The 25 MW project is expected to produce 140 GWh per year of electricity, which will be sold directly to B.C. Hydro (Canadian Hydro 2002). The project site is located between the Mile 9 Bridge (upstream) and the confluence with Raffuse Creek (downstream). The construction of headworks, a penstock, powerhouse, and powerline are underway. The project will result in negative impacts to fish habitat, water quality, and fish food supply due to reduction of flow downstream of the weir, siltation of spawning beds during construction, and alteration of benthic communities due to changes in flows, sedimentation, and removal of riparian vegetation (Canadian Hydro 2002). A habitat compensation plan has been developed to address impacts.
The Mamquam Hydroelectric Project operated by Northern Utilities Inc. (NUI), is located downstream of the proposed Canadian Hydro facility. It is a 50 MW run-of-river hydroelectric plant, which was built between 1994 and 1996 (Coulter et al., 1998). The NUI facility tunnels water from just downstream of the Mamquam-Raffuse confluence to where water flows re-enter the Mamquam River channel at a powerhouse located just upstream of Ring Creek (Canadian Hydro 2002).
In mid-September 2003, under B.C. Hydro’s 2002/2003 Green Power Generation Call, the Ashlu Creek hydroelectric project development by Ledcor Power Inc. was prequalified. The facility would have a capacity of 42 mw and 200 GWh per year. However, based on recent public hearings, the project has received opposition from the community.
2.7.2 Dams
In 1957, the B.C. Electric Company constructed the Daisy Lake Dam, consisting of a dam across the Cheakamus River, impounding Daisy Lake. Flows are diverted by an 11 km man-made canal under Cloudburst Mountain to the Daisy Lake Reservoir, where a tunnel and two penstocks feed water into two hydraulic turbines housed in the Cheakamus Powerhouse on the Squamish River. The water from the powerhouse is fed through a long channel that enters the Squamish River about 21 km upstream of the Cheakamus confluence. The dam is presently owned and operated by B.C. Hydro and

May 2005 - 31 - 03-1417-026
Golder Associates
generates approximately 750 GWh of energy per year, enough to serve up to 60,000 homes. The reservoir operates as a “peaking plant” providing services during peak hours, typically in the mornings and evenings (ESSA 2002). During periods of lower demand the water is not diverted through the turbines but continues to be stored in the reservoir. The impacts of these operational procedures include: risk of stranding of fish in the Squamish system downstream of the turbine outfalls; and the continued impacts of the impoundment and diversion of water on the Cheakamus River downstream of Daisy Reservoir.
A Water Use Planning (WUP) process was initiated in 1996 for the Cheakamus facilities. Its objective was to define how water control facilities would be used based on public values and environmental priorities. However, a Flow Order issued by DFO in May 1997 halted the WUP process until February 1999 (B.C. Hydro 2003). The consultative process as defined by the Water Use Plan Guidelines was conducted between June 1999 and January 2002 (ESSA 2002). As a result of this process, consensus among parties involved regarding flow regimes was not reached. Consequently, the process is currently under review by the Water Comptroller. In the interim, environmental studies are being conducted to assess the stock status of salmonids in the Cheakamus River.
2.7.3 Water Withdrawal Licenses
Using the Land and Water British Columbia Inc. website (http://lwbc.bc.ca/06search/water.html), active licenses and applications for water licenses in the Squamish watershed were searched. This website provided information on currently active licenses and applications only. To date, 57 water licenses and/or applications are listed in the Squamish watershed. The purposes of such licences/applications include water withdrawals for irrigation, watering, domestic purposes, power production and storage, bottle sales, mining, and construction works for conserving fish or wildlife. Licenses by system are provided in Appendix II.
2.7.4 Wastewater Treatment Plant
The District of Squamish operates two wastewater treatment plants. One is located in downtown Squamish on Fifth Avenue, and the other is located along Mamquam Road, east of the Squamish Valley Golf and Country Club. Both facilities have secondary treatment of wastewater. The outfall pipe for the downtown treatment plant is within the Squamish Estuary, at the mouth of the Squamish River. According to the District of Squamish, this facility is slated to be decommissioned within the next couple of years, at which time all wastewater flow will be diverted to the Mamquam facility and the upgraded Queensway Pump Station. It is anticipated that the Mamquam facility will require expanding to accommodate the increased volumes of wastewater. The outfall for

May 2005 - 32 - 03-1417-026
Golder Associates
the Mamquam facility is located at the mouth of the Mamquam River, across the Squamish River from Yekwaupsum #19 and north of Yekwaupsum #18.
A wastewater facility was built in Whistler in 1976 and upgraded in 1984 and 1997. The current facility has a primary and secondary clarification system capable of servicing 52,000 bed units, and a biological and solids handling system capable of servicing 42,000 bed units; Whistler’s current bed unit capacity. It is a Level 4 facility and the treated wastewater meets the requirements to be classified as safe for recreational use. The facility’s water sources include a variety of creeks and wells. The treated water is discharged into the Cheakamus River. Further upgrades ($2.3 Million) are proposed for 2007 to accommodate the anticipated growth associated with the 2010 Olympics, which would have the potential to impact fisheries resources in the Cheakamus River.
2.7.5 Community Drinking Water
The Stawamus River watershed is, at present, the primary surface water supply for the District of Squamish, drawing 912,500,000 gallons/year (Interfor 1998a). The Mashiter Creek watershed is considered a “seasonal” source of water to the District (Interfor 1998). This system, like the Stawamus River, is subject to fisheries low flow requirements, and quality problems linked to drought, floods, landslides, and contamination due to activities in the watershed. With the growing water supply demands of the community, additional water supplies will be required.
In 1989 the District of Squamish commissioned a study to assess the impacts of a proposed water diversion in Mashiter Creek for domestic purposes (Triton 1989). As Mashiter Creek is known to support populations of anadromous salmon and trout, the study was undertaken to assess the possible impacts to fish and fish habitat, as well as determine the flow requirements needed to support this resource. The study concluded that if stream discharge levels did not fall below 0.76 m3/s, water diversions of up to 3.5 mg/d would result in a reduction of juvenile fish rearing habitat of approximately 1% (Triton 1989). The impacts of flow diversion on spawning habitat were not quantified.
In 1998, the District of Squamish submitted a groundwater development application to the Environmental Assessment Office, identifying two proposed well fields, each containing three wells, at the Power Springs and Mamquam River sites to supply water to the Squamish municipal water distribution system. The Stawamus River surface water source is said to be inadequate to supply the growing community’s need, while the capacity of the pipe system connecting the Mashiter Creek source to the municipal distribution system limits its use. An environmental assessment was completed at both sites, with the report detailing the benefits of the project, including increased water capacity to meet water system demand growth, reduction or elimination of potential

May 2005 - 33 - 03-1417-026
Golder Associates
conflict in the Stawamus and Mashiter systems between fish habitat and potable water demands, improved drinking water, and potential cost savings on future water treatment requirements (District of Squamish 1998a). There are concerns, however, that overuse of the lower Mamquam River well site could deplete the underlying Mamquam aquifer. This aquifer discharges and is responsible for providing flow to all the important salmon side channels along the Mamquam River, Loggers Lane Creek, and Meighn Creek (M. Foy, pers. comm., March 2003).
Potential future water shortages are of concern in many urban areas faced with growth and development. For example, water shortages and protection of groundwater sources were addressed in the Nisqually Watershed Management Plan (Golder 2003). This plan suggests protection of groundwater sources and critical recharge areas, avoidance of land development near critical groundwater sources to minimize the risk of contamination, identification of aquifers in areas not connected to critical fish habitat, and coordination of efforts between land use and water use planning as potential means to balancing water use with protecting environmental resources, particularly fish and fish habitat.
Recommendations:
• More detailed assessments regarding potential impacts of changes in flows in nearby streams and watercourses should be assessed if the potential for extracting water from the lower Mamquam River to meet water supply demands be seriously considered,
• Alternative water supply sources should be investigated and protective measures should be implemented if withdrawal from the lower Mamquam River were to pose a threat to fish and fish habitat and other ecological values.
• Development of protective measures for critical groundwater sources.
• Coordination between land and water use initiatives.
2.7.6 Recreational Use
The Squamish River watershed provides recreational opportunities that involve both land and water users. Recreational land uses include hiking, biking, mountain climbing, camping, golfing, skiing, and snowmobiling. Recreational water uses include fishing, swimming, boating, kayaking, river rafting, canoeing, and water sports. Activities such as wildlife viewing involve both land and water uses. A list of recreational outfitters was compiled from the Squamish Chamber of Commerce website and Squamish phone directory (Appendix III). This is not a comprehensive list, but the number of organizations listed provides an indication of the magnitude of recreational interests in the watershed. Outfitters in Whistler may also conduct activities in the Squamish area. They have not been included in the list.

May 2005 - 34 - 03-1417-026
Golder Associates
A number of facilities support these activities including the provincial parks as listed in Section 2.4.7; Dryden Creek Resorts; Sunwolf Outdoor Center; Alpine Club Cabins; Cat Lake; Brohm Lake; Buck Mountain Campground; and Sea to Sky Trail.
There are number of sport fishing clubs in Squamish, Whistler and Pemberton whose members frequent Squamish systems for fishing. These include:
• Pemberton Sportsmens' Wildlife Association, Pemberton, B.C.; • River’s Edge, Squamish, B.C.; • Whistler Fishing Club,Whistler, B.C.; • Whistler Angling Club, Whistler, B.C.; • Steelhead Society; • Totem Fly Fishers; and • Squamish to Lillooet Sport Fishing Advisory Committee.
Sport fishing is important economically in the Squamish area and has the potential to impact the recovery of salmon in the watershed.
2.8 The Squamish Estuary
The Squamish Estuary is situated at the northernmost point of Howe Sound. Both the Squamish and the Stawamus rivers meet in the estuary. The estuary itself features a variety of habitats, including marshland, sand and mudflats, flood channels, and intertidal drainage channels. As such, the Squamish River estuary provides critical habitat for all salmon populations within the Squamish River watershed. Since the late 1800s, the Squamish River estuary has been dyked, drained, and filled for agricultural, industrial, residential, and commercial development such that in 2000, approximately 50% of the original estuary remains usable to salmon (M. Foy, pers. comm., March 2003).
Dyking of the Squamish River Estuary began in the late nineteenth century and continued through the twentieth century with the last major dyke construction around the community of Squamish occurring in the 1980s and the District of Squamish has been repairing and fortifying some areas up until 2003. Port development during the 1970s and construction of the training dyke in 1972 resulted in the degradation of large areas of remaining fish habitat in the Squamish River estuary that was critically important to juvenile salmon prior to their entry to saltwater (M. Foy, pers. comm., March 2003).
In 1979, an estuary management plan was commissioned by both the federal Minister of Fisheries and Oceans and the provincial Minister of Environment to halt further degradation of the estuary. The plan was completed in 1982 designating 394 ha for conservation, 271 ha for industrial development, and 258 ha for further assessment prior to land use designation (SEMP 1999). In addition, the Squamish Estuary Coordinating Committee (SECC) was formed. Extensive studies were undertaken to document the

May 2005 - 35 - 03-1417-026
Golder Associates
value of the estuary as fish and wildlife habitat. Chinook salmon smolts were found to critically depend on the estuary for extended periods of time prior to their offshore movement into Howe Sound (Levy and Levings, 1978).
In 1992, a revised plan was brought forward by the SECC. The 1992 Plan looked at much of the area designated for further assessment. The results included an increase in the area designated for conservation to 549 ha, increase in the area designated for industrial development to 378 ha, and a reduction of the area for further assessment to 8 ha. It should be noted that for various reasons, the 1992 Plan was never implemented and the estuary continued to be managed under the 1982 Plan (SEMP 1999).
In 1999, a revised Plan was created. This document designated 579 ha for conservation, 350 ha for industrial development, and 8 ha requiring further planning. It is hoped that the adoption of the “Squamish River Estuary Management Plan” will change the trend in habitat conditions within the estuary from salmon habitat damage and destruction to one of restoration, recovery, and protection. Habitat productivity in the estuary is expected to improve as a result over the next number of years. While all species of salmon are expected to benefit from this work, chinook salmon are expected to receive the greatest benefit from estuary restoration and protection (M. Foy, pers. comm., March 2003).
Restoration works in the Squamish River estuary have included a series of culverts, installed from 1995 to 2000, through the Squamish River training dyke constructed in 1972. Tidal channels between the Squamish River and the central estuary were re-established to provide improved opportunities for salmonid fry moving down the Squamish River to access and reside in these estuary habitats that had been poorly utilized since 1972 (M. Foy, pers. comm., March 2003).
In 2000, a restoration project began to remove dredge spoil on a portion of the estuary previously filled for industrial development. As this fill material is removed, the tidal channels and marsh vegetation are being restored. Reclamation of this site was largely completed in 2004, and natural colonization of marsh plants is expected to occur over the next ten years (M. Foy, pers. comm., March 2003).
In 2001, a restoration project began to reconnect isolated tidal channels in the eastern portion of the central estuary to tidal flow. A culvert was placed under the road leading to the West Barr log sort, and new channels were constructed to replace those lost during early development on this portion of the estuary (M. Foy, pers. comm., March 2003).
Confinement of the Squamish River by the estuary dyke constructed in 1971/72 has accelerated the development of delta deposits on the western shore of Howe Sound. The results of this have been to improve and increase near shore habitat for salmon in this part of the Squamish River estuary (M. Foy, pers. comm., March 2003).

May 2005 - 36 - 03-1417-026
Golder Associates
Despite the management plan efforts, future development will continue to threaten the estuary. For example, future development of port facilities adjacent to the Stawamus River estuary will have detrimental impacts on near shore salmon habitats on the eastern shore of upper Howe Sound (M. Foy, pers. comm., March 2003). The District of Squamish is considering the development of a ferry terminal on the Nexen site. The proposed Squamish waterfront development also has the potential to adversely impact fish and fish habitant in the estuary. Development of the Furry Creek foreshore threatens some of the most productive near shore habitat in upper Howe Sound (M. Foy, pers. comm., March 2003). Future opportunities to enhance near shore habitat in Howe Sound would also provide expected benefits to juvenile salmon as they move from the Squamish River through Howe Sound on their oceanic migration (M. Foy, pers. comm., March 2003).

May 2005 - 37 - 03-1417-026
Golder Associates
3.0 SALMON STOCK STATUS IN THE SQUAMISH WATERSHED
Each of the five species of Pacific salmon and steelhead have been documented in the Squamish, Elaho, Ashlu, Cheakamus, Mamquam, and Stawamus rivers and their tributaries (up to the anadromous barrier). The following text provides a summary of the status of Pacific salmon stocks, including steelhead, in the Squamish River watershed, based on existing and available information. This section also discusses data limitations and, by inference, our knowledge of these salmon species in the watershed.
The Greater Georgia Basin Steelhead Recovery Plan provides an assessment of steelhead stock status, steelhead objectives and strategies, and recovery options for the Mamquam, Squamish and Cheakamus rivers (GGBSRP 2002). As such, a comprehensive review of existing historical and current information on steelhead stocks was not warranted under the scope of the Squamish Watershed Salmon Recovery Plan. Rather this plan summarizes most recent data on steelhead in the Cheakamus River, relevant data provided by the MWLAP, and relies on the assessments and recommendations provided by the GGBSRP (2002). It is recognized that additional historical steelhead information is available which has not been presented here. However, it was assumed that this information was interpreted under the GGBSRP, and as such has been indirectly incorporated into this plan.
The assessments of salmon stock status presented in the following section are based on a review of the three indicators of stock status, which include: 1) adult escapement; 2) juvenile density; and 3) smolt density. Adult escapement represents potential egg deposition to the systems; a final product of ocean survival. Juvenile density indicates egg deposition and survival to fry stage (or parr or stage), and can be used to check on adult escapement by back calculating fry to egg to adult using acceptable life stage survival biostandards. If escapements are sufficient to seed available habitat, smolt abundance is a true indicator of freshwater habitat capability (i.e., the product of egg to fry to parr to smolt).
3.1 Data Limitations
3.1.1 Adult Escapement Data
Salmon escapement estimates are available since the mid-1940s for Squamish chinook, coho, pink, chum, and sockeye. Escapement data are recorded in Stream Inspection Logs (SILs), BC16s, annual DFO narrative reports, Fish Wizard, various DFO manuscripts, and Squamish Nation (2000; 2003; 2004; 2005). The estimates compiled here are those reported by Farwell et al., (1987) for 1951-1985 and by Fish Wizard and other consultants’ reports after 1985.

May 2005 - 38 - 03-1417-026
Golder Associates
With the exception of the last decade, most of the available estimates originate from visual surveys conducted by DFO fisheries officers. Such estimates are of uncertain quality for two key reasons:
• Lack of systematic training and calibration of observations: Field observers rarely received anything more than ad hoc on-the-job training, nor were their observations calibrated through visits to sites with known numbers of fish. Consequently, when observers changed, there were often significant changes in the estimates that may not reflect real changes in fish abundance.
• Lack of documentation: There is little or no documentation of the methods used to estimate escapements for individual streams and species. An adequate evaluation of estimate quality requires information on: a) the number, date, type, and extent of each survey; b) how the daily count was adjusted to reflect factors such as visibility or percent of the spawning area covered; and c) the method used to calculate the seasonal escapement estimate from the daily estimates. Because of the lack of documentation, there is no way to evaluate the quality of individual estimates or to know whether systematic changes in the annual estimates reflect true trends rather than procedural changes. For example, estimates for the Squamish River mainstem are believed to be based on observations in the mainstem rather than key side channels, while more recent observations (e.g., Squamish Nation 2004) focus on the side channels.
These deficiencies lead to uncertainty in the interpretation of both the magnitude of historic populations and their trends in abundance. More recent surveys (since 1996) have been better structured and documented, and use consistent crews (although training and calibration may still be an issue); consequently, there is greater certainty regarding magnitudes and trends over this latter period.
Recognizing these limitations, this report presents escapement data by species as a gross indication of abundances and trends relative to recent estimates. Escapement data are graphed in relation to changes in observers to allow the reader to make inferences regarding abrupt changes in trends.
3.1.2 Juvenile Density Data
Few studies have been completed documenting juvenile salmon density in the Squamish River watershed (Table 6). Those that have been conducted have differed in their objectives, methodologies, and timing; consequently, direct comparisons are not feasible and juvenile stock status cannot be adequately assessed. While direct comparison between studies and tracking of stock status may not be possible, an overview of densities available for the Squamish watershed is provided in the following sections. Much of the available fish density information focused on the Squamish, Cheakamus, and Mamquam rivers, with little information available for other streams in the watershed.

- 39 - 03-1417-026
Golder Associates
Data collection and Study Scope Parameters
Triton 1993
ARL 1998
ARL 2000
Sneep 2001
ARL 2002
Foy & Gidora
2002
Hanson 2004a and b
Melville & McCubbing 2000; 2002a&b; 2003
Study Type Historical review x x X x x
Data collection X x x X Salmon Life Stage Steelhead Fry x x X x x x X Parr x x X x x x X Smolt x X Chinook Juv x x x x x X Smolt x X Coho Juv x x x x x X Smolt x x X Chum Fry x x X Pink Fry x x X Methodology Minnow Trapping x x x Seining x x Electrofishing x x x x Rotary Screw Trap X Other x Time of Year Winter x x Spring x x X Summer x x x x x X Fall x x x x x Location Reach/Specific Site x x x Off Channel x x Main Channel x x X Constructed Channel x x X
Table 6: Matrix of Juvenile Salmonid Studies in the Squamish Watershed
May 2005
May 2005 - 40 - 03-1417-026
Golder Associates
Of the studies completed, most are more recent and primarily focused on juvenile steelhead; however, incidental coho and chinook captures are also reported. ARL (1998) completed a review of historical information and an assessment of the status of Squamish River steelhead stocks. Studies completed by ARL (2000; 2002) and one study underway funded by the B.C. Conservation Foundation (Hanson 2004a) (ongoing) have focused on determining juvenile steelhead densities in the Squamish watershed and establishing a feasible, effective annual stock index program employing similar sampling methodology. These studies have focused primarily on the Squamish, Cheakamus, and Mamquam rivers with additional information collected for Brohm, Mashiter, Ashlu, Chuck Chuck, High Falls, and Shovelnose creeks, and a few small tributaries on the west side of the Squamish River. Sneep (2001) conducted a study of juvenile salmonid distribution in the Cheakamus River associated with assessments of habitat use in relation to changes in river flow regime as part of water use planning. Melville and McCubbing, (2000; 2002a and b; 2003), conducted juvenile migration studies in the Cheakamus River under B.C. Hydro’s WUP from 2000 to 2003. Juvenile and adult steelhead data are available prior to 1993 (e.g., Clark, Bech, others); however, as with the recent work status trends were difficult to assess.
3.1.3 Smolt Migration Data
A few published studies have been completed documenting juvenile salmon migration in the Squamish River system. Annual juvenile migration studies using Rotary Screw Traps (RST) were conducted from 2000 to 2003 in the Cheakamus River as part of B.C. Hydro’s WUP process (Melville and McCubbing 2000; 2002a, 2002b; 2003). These studies focused on steelhead, but coho, chinook, chum, and pink salmon were also caught in the RST. Foy and Gidora (2002) monitored coho smolt outmigration from previously constructed off-channel habitat restoration projects in the Cheakamus River in 2001. A coho smolt enumeration study using coded wire tags (CWT) was conducted in 1974 and 1975 in Meighn Creek, the Little Stawamus River, and Tenderfoot Creek (Argue and Armstrong 1977). There is also a significant amount of unpublished historical baseline information derived from downstream fry and smolt trapping programs (M. Foy, pers. comm., March 2003). Data are presented in the sections below.
3.2 Chinook Salmon
3.2.1 Life History Characteristics
Like other Pacific salmon, chinook utilize freshwater habitats for spawning, incubation, rearing, and smoltification, and marine habitats for growth and maturation. The species shows a greater range of variability in freshwater and estuarine utilization, ocean distributions, age at maturity, and spawning season than any other salmon species. Depending on the population, spawning adults can return from the ocean almost any

May 2005 - 41 - 03-1417-026
Golder Associates
month of the year, and spawning can occur from May to January in habitats ranging from small tributaries to the mainstems of large rivers. While they spawn extensively in coastal rivers such as the Squamish, they are powerful swimmers capable of long migrations to the headwaters of major river systems. Some populations prefer to spawn at the outflow of pools, while others construct large, permanent dunes. The fry emerge from March to June and migrate passively downstream at night. After the initial downstream dispersal, individual populations follow one of two distinct life history patterns, termed “stream-type” and “ocean-type.” Stream-type chinook are typical of most northern and headwater tributary populations in North America. The fry reside in freshwater for a year or more before migrating to the estuary during the freshet in late spring; they reside in the estuary briefly, if at all. In the ocean, they make extensive migrations to both coastal and offshore rearing areas in the eastern North Pacific Ocean. Like ocean-type fish, they mature at ages three to five, with a younger age at maturity among males. Stream-type chinook return to their natal stream in the spring or summer of their fifth year and may delay in freshwater for several months before spawning. Like other Pacific salmon species, they die and decompose after spawning.
Ocean-type chinook are typical of most southern North American populations. After the initial downstream dispersal, the fry continue on a sometimes protracted rearing migration for up to three months. They reach the estuary as fingerlings after the freshet in late June to August and rear in the estuary for a few weeks. Their marine distribution is less extensive than stream-type chinook and more closely associated with the coast. They return to their natal streams in the late summer and fall of their fourth year and spawn without significant delays in freshwater.
Comprehensive information is not available for all aspects of the life history of Squamish chinook; however, the following is known:
• Marine Distribution: The marine distribution can be inferred from coded wire tags applied to hatchery chinook and subsequently recovered in fisheries. Squamish chinook extensively utilize the northern portion of the Strait of Georgia, where they appear to reside for several years before returning to spawn. However, a significant proportion of the population (about 50% of the catch) migrates north through B.C. waters and into Alaska.
• Timing: Squamish is a summer run population that returns to Howe Sound from June to August and enters the Squamish River after a short delay near Britannia Beach. The spawning period is variable, but typically begins in July and August and can continue into November (Schubert 1993; Squamish Nation 2004).

May 2005 - 42 - 03-1417-026
Golder Associates
• Spawning Distribution: Significant populations spawn in the Squamish, Cheakamus, and Mamquam rivers and Ashlu Creek. Smaller populations have been observed in Chuck Chuck, High Falls, Shovelnose, Spring, and Twenty-Eight Mile creeks and Brohm and Stawamus rivers. There is speculation that a significant population spawns in the upper Squamish mainstem (Schubert 1993); however, poor visibility has prevented its assessment.
• Age and Size at Maturity: Based on scale analyses all chinook captured had spent one year in freshwater and between 1 to 3 years in the marine environment (Schubert 1993). Prior to enhancement, the majority of chinook spawners were 4 and 5 years (76% of chinook captured); following enhancement, the majority of chinook spawners captured were 3 and 4 years (67% of chinook captured) (Triton 1993).
Post orbit-hypural length (POHL) of Squamish adult chinook ranged from 43.0-82.0 cm. Mean POHL of chinook adult spawners ranged from: 60.3 cm to 75.5 cm in Ashlu Creek; 55.3 cm to 76 cm in the Cheakamus River; and 62.7 cm to 73.0 cm in the Mamquam River between 1988 and 1992 (Schubert 1993).
• Incubation and Juvenile Rearing: The incubation period of Squamish chinook extends into May within most of the watershed. In the Cheakamus River, fry emergence begins in April. Chinook juveniles typically remain in freshwater in the year following emergence (Triton 1993). Juvenile chinook appear to rear along the margins and side channels of the larger tributaries and the Squamish River, and are often associated with the complex habitat that forms around and within log jams (M. Foy, pers. comm., March 2003).
• Juvenile Migration: The majority of emigration of Squamish chinook occurs in the spring, from mid-March to late June, although some emigrate from the Cheakamus River in the fall. The peak generally occurs between April and June (Meville and McCubbing 2000).
• Special Issues: Schubert (1993) reports that chinook salmon have changed from a stream-type life cycle (i.e., chinook remain in freshwater for one year) to an ocean-type life cycle (i.e., chinook migrate to sea during their first year of life) as a result of hatchery enhancement efforts. This occurred as a result of accelerated rearing in the hatchery that permitted the release of 90-day smolts; the returns from these smolts are now predominant in the escapement. This enhancement strategy resulted in a decline in the average age at maturity by one year, and a change from almost entirely stream-type to almost entirely ocean-type fish. This change indicated that hatchery-produced chinook comprised virtually all of the sampled fish. The impacts of the role of enhancement on the rebuilding efforts for Squamish chinook requires further assessment.

May 2005 - 43 - 03-1417-026
Golder Associates
3.2.2 Squamish Chinook Status
North American chinook salmon are managed and assessed according to a framework established under the Pacific Salmon Treaty (PST). Squamish chinook are part of the Lower Georgia Strait aggregate, a group of small and medium size rivers on Vancouver Island from the Puntledge River south to the Cowichan Peninsula and along the southern mainland coast. The aggregate is assessed from harvest (coded wire tag analysis) and escapement trends for the Cowichan and Nanaimo populations. The aggregate is currently in sharp decline due to poor marine survival that has been partially mediated by significant reductions in exploitation rate (PSC 2003).
While Squamish chinook are included in this aggregate because of similar marine distributions and exploitation patterns, differences in run timing and other attributes suggest that they should be aggregated as part of a mainland inlet summer chinook group (N. Schubert, pers. comm., April 2005). The current status of Squamish chinook is uncertain. The Pacific Fisheries Resource Conservation Council suggested that Squamish chinook have the potential to be the largest population in this region, but concluded that “the current assessment programs in the Squamish River are inadequate to effectively manage this potentially important stock.” (PFRCC 2002) An evaluation of past trends in population status is constrained by data limitations (see Section 3.1); some information is available for each of the major sub-basins:
• Cheakamus River: The escapement record shows peaks of 3,500 fish every four years from 1953 to 1971 (Figure 7), declining to <500 fish from 1973 to 1987. A mark-recapture study reported almost 1,000 fish per year from 1989 to 1992, and noted that concurrent visual surveys underestimated the populations by 50% or more (Schubert 1993). Visual surveys reported 122 to 194 fish in 1997 to 1999, and 290 to 447 fish in 2000 to 2003 (Squamish Nation 2004).
• Mamquam River and Ashlu Creek: Escapements were generally below 500 fish in 1951 to 1993, with a peak of 1,500 to 2,000 reported in both systems in 1969 to 1970 (Figure 7).
• Other Areas: Sporadic information is available for a number of small populations, including Stawamus River (Squamish Nation 2004), High Falls, Chuck Chuck, and Spring creeks. In most cases, these populations were estimated at less than 100 spawners.
• Squamish System: In addition to estimates from visual surveys (DFO, unpublished; Squamish Nation 2004), a system-wide mark-recapture study was conducted in 1988 to 1992 as part of an initiative to rebuild southern Strait of Georgia chinook populations (Schubert 1993). The total return was estimated at 7,323 to 9,348 adults, about four times the estimated escapement derived from visual observations for the same time period (Schubert 1993).

May 2005 - 44 - 03-1417-026
Golder Associates
Despite concerns regarding historic estimates and the adequacy of current assessments, the available data suggest that chinook populations were formerly much more abundant than now, and that population abundance has been low since the mid-1970s. The data show a steady decline from 15,000 in the 1950s to below 500 in the mid-1980s and 1990s (Figure 7). While inconsistencies between current and historic assessment methods make a precise quantification of the trend difficult, the magnitude of the difference suggests that historic abundances were substantially larger than those currently observed. Higher historic abundance is supported by Howe Sound commercial fishery catches that frequently exceeded 500 chinook, and is consistent with trends in other southern Strait of Georgia populations with similar marine distributions and exploitation patterns. The Pacific Salmon Commission (PSC 2003) attributes much of the recent decline to reduced marine survivals, while overexploitation and habitat degradation played key roles in earlier decades. The potential for continued decline is especially a concern in light of ongoing enhancement efforts. Schubert (1993) suggest that enhancement by Tenderfoot Hatchery had increased chinook escapements to the Squamish watershed by the mid-1990s, but relative abundances have remained below 1,000 chinook for the watershed between 1997-2000, and were above 1,000 from 2001-2003 before decreasing to less than 500 chinook in 2004 (Squamish Nation 2005).
3.2.3 Juvenile Chinook Salmon
Limited data are available regarding the status of juvenile chinook in the Squamish River watershed. Studies that focused specifically on juvenile chinook were conducted under the Water Use Plan on the Cheakamus River by Melville and McCubbing (2000a ; 2002a and b; 2003). Studies conducted by ARL (1998, 2002) and Sneep (2001) provided anecdotal juvenile chinook data. These studies were heavily biased towards steelhead habitats and timing in the Cheakamus, Squamish and Mamquam rivers, and thus do not adequately address the status of juvenile chinook.
The following bullets provide a summary of juvenile chinook data extracted from the existing literature:
• Under B.C. Hydro’s Water Use Plan for the Cheakamus River, population estimates for chinook fry ranged from approximately 71,500 in 2000 to 212,000 in 2003 (Melville and McCubbing 2000; 2002a and b; 2003). Population estimates for chinook smolts ranged from 3,759 in 2001 to 207 in 2003. Changes in fry or smolt population estimates do not necessarily reflect conditions in the river but rather changes in methods used, assumptions met, and the use of different methods to estimate populations.

May 2005 - 45 - 03-1417-026
Golder Associates
• Chinook juvenile data provided by ARL (2000, 2002) indicated a range of 0-7 fry per unit (FPU) in the Squamish River 1-28 FPU in Ashlu Creek, 0.6-1.3 FPU in the Cheakamus River, and 0-4.0 FPU in the Mamquam River.
• Sampling of mainstem sites along the Cheakamus River by Sneep (2001) in 1999 and 2000 found mean juvenile chinook densities of approximately 5 FPU.
• A study of the juvenile emigration from the Cheakamus River in April and May, 1966, found that virtually all were yearlings (N. Schubert, pers. comm., April 2005). Further, Levy and Levings (1978) reported large smolts but few fry in the estuary in June.
An assessment of juvenile chinook stock status is not possible given the limited data available, the differences in study objectives, methodologies, and timing of sampling between studies. As a result, data generated are not directly comparable and trends over time are difficult to establish. Furthermore, juvenile chinook data extracted from steelhead-focused studies do not provide adequate understanding of stock status as timing of studies and habitat surveyed were not typical of chinook stocks.
3.3 Coho
3.3.1 Life History Characteristics
Coho utilize freshwater habitats for spawning, incubation, rearing, and smoltification, and marine habitats for growth and maturation. In B.C., coho is the most wide-spread of the five species of Pacific salmon, and no one run dominants any particular area. Depending on the population, spawning adults return from the ocean after 18 months or more. Spawning migration usually begins in September/October in southern B.C., and can take from several weeks along coastal routes, or up to several months from the open ocean. Coho migrate further upstream then pink or chum but not as far as chinook or sockeye. Spawning occurs in streams along the coast or in small tributaries of larger mainstem systems and occurs between November and January in most systems.
The fry emerge from March to July and migrate passively downstream at night. Fry initially mill about in an aggregation before swimming to stream banks, quiet backwaters, side-channels, and small creeks with overhanging vegetation for cover. Coho smolts migrate downstream in the spring (March to June) following a year of freshwater residence. A smaller proportion of coho can spend up to two or three years in freshwater. Coho smolts tend to move downstream at night in aggregates, and once they reach the estuary they tend to stay within the vicinity of their natal streams for several months prior to migrating further into the ocean. In B.C., coho migrate into the Strait of Georgia, and depending on feeding conditions and smolt density, they would either stay in the Strait or migrate to outer waters, such as West Coast Vancouver Island, Johnstone Strait and Alaska.

May 2005 - 46 - 03-1417-026
Golder Associates
Comprehensive information is not available for all aspects of the life history of Squamish chinook; however, the following is known:
• Marine Distribution: The marine distribution can be inferred from coded wire tags applied to Tenderfoot hatchery coho and subsequently recovered in fisheries. Most coho populations originating from streams draining into the Strait of Georgia are observed to migrate outside the Strait of Georgia in higher proportions during some years. Return years from 1985-1990 and 1992-1993 were considered inside years whereas 1991 and 1994-2000 were outside years (D. Dobson, pers. comm., August 1999). Squamish coho showed a propensity to migrate in similar patterns during those years. In inside years, Squamish coho spend more time in the Strait of Georgia; whereas in outside years Squamish coho are reported in higher percentages along the West Coast Vancouver Island and in Juan de Fuca Strait based on sport fisheries information. Squamish coho migrate as far as Johnstone Strait, Central and Northern B.C., and Alaska.
In a recent study, preliminary ocean tracking and marine survival studies conducted through the Pacific Salmon Endowment Fund (PSEF) have tracked coho into Howe Sound and into the Strait of Georgia. Preliminary results indicate that approximately 25% of coho that emigrated from the Cheakamus River survived and were tracked in the Strait of Georgia (Welch 2004). None of the Cheakamus River coho were tracked into the Strait of Johnstone (Welch 2004). Continued research will determine the whether the coho migrate into the Strait of Johnstone and do not survive or whether they remain in the Strait of Georgia. Future studies will also focus on marine survival of Squamish River stocks.
• Timing: The timing of coho salmon spawning within the Squamish River and its tributaries is variable. Coho migration begins as early as August in some parts of the Squamish River watershed and continues into October in others. Spawning begins in September in limited areas of the mainstem Squamish River and Ashlu Creek; however, spawning typically commences in October or November in the remainder of the watershed. Spawning is generally completed in all of the watersheds by December or January, although a few coho have been observed in tributaries in early February (Squamish Nation 2004; Wilson et al., 1977).
• Spawning Distribution: Coho salmon are typically found in smaller streams, and tributaries of larger systems, and in log jams and off-channel habitat. Most of the smaller streams that support coho in the District of Squamish boundaries are identified in the “Sensitive Fish Habitat Atlas” (M. Foy, pers. comm., March 2003). Key urban streams supporting coho include, but are not limited to, Meighn Creek, Dryden Creek, and Loggers Lane Creek.

May 2005 - 47 - 03-1417-026
Golder Associates
• Age and Size at Maturity: Age of most returning coho spawners is three years, while jacks return at age two (Triton 1993). Squamish coho spend one year in freshwater.
Coho POHL averaged 45 to 55 cm over a period of nine years (1996 to 2004) (Squamish Nation 2005).
• Incubation and Juvenile Rearing: In the Cheakamus River, coho emergence starts to occur in mid-March and peaks in early May (Triton 1993). Coho fry prefer groundwater side-channels of the Mamquam, Squamish and Cheakamus rivers.
• Juvenile Migration: Coho salmon fry and smolt emigration in the Cheakamus River begins in mid-March and extends to June, with the peak occurring in May (Melville and McCubbing 2000; Triton 1993).
• Special Issues: Currently, little data exist regarding the genetic diversity of Squamish coho. Limited DNA baseline data for the Squamish River system and Howe Sound coho were collected by DFO in the 1990s (J. Tadey, pers. comm., September 2004). These analyses indicate that coho collected from the Ashlu, Mamquam, and Squamish rivers and from Tenderfoot Creek are genetically similar to southern mainland coho (J. Tadey, pers. comm., September 2004). However, the origin of these samples (i.e., whether they were collected from Squamish River mainstem or tributaries) could not be provided. In addition, DNA samples collected from coho captured in Howe Sound may well be from a non-Squamish stock.
3.3.2 Squamish Coho Status
Squamish coho would be considered as part of a larger Strait of Georgia “metapopulation” (i.e., stock group) (J. Tadey, pers. comm., September 2004). Under the PST, Squamish coho would be considered part of the Strait of Georgia Mainland (or Georgia East Basin) Management Unit (J. Tadey, pers. comm., September 2004). This unit excludes coho stocks returning to the Fraser River watershed. Squamish coho contribution to the Strait of Georgia stock group is unknown.
Historical Squamish River coho escapement data (1951-1985) were primarily based on observations conducted by DFO in the Squamish River mainstem, Ashlu Creek, Cheakamus River, Mamquam River, Stawamus Creek, Shovelnose Creek, and Pilchuk Creek.
• Squamish River mainstem and tributaries: Numbers of coho in the Squamish River decreased from approximately 80,000 fish recorded in the early 1950s to <40,000 fish between 1953 and the mid-1970s (Figure 8a). Coho numbers peaked again at just below 80,000 fish in 1973 before crashing to less than 10,000 fish between 1975 and

May 2005 - 48 - 03-1417-026
Golder Associates
1985. DFO extended their observations to include High Falls, 37 Mile, 28.5 Mile, Judd Slough, Dryden, Hop Ranch, Spring, Shop Three, Branch 100, and Chuck Chuck creeks in 1979 to 1985. Despite these additional surveys, the overall number of coho observed in the Squamish River system did not increase during this time period (Figure 8a).
• Stawamus River: Historical DFO coho escapement data for the Stawamus River mainstem are available from 1951 to 1985; while no data are available from 1986 to 1995 (Figure 8b). No historical DFO escapement data are available for the Little Stawamus River. Historical data suggest that coho decreased from approximately 800 fish in the early 1950s to less than 200 fish for most of the 1960s and 1980s. Peaks in numbers were observed in 1969 and 1972, when numbers reached levels reported in the 1950s. A study conducted in 1972, based on coded wire tagging of coho salmon, estimated much lower escapements: 58, 26, and 120 for the Little Stawamus River, Meighn Creek, and Tenderfoot Creek, respectively (Wilson et al., 1977). The Area-Under-the-Curve (AUC) escapement for coho reported by Squamish Nation (2003) which included the Stawamus and Little Stawamus rivers show an increasing trend from 1996 to 2003 (Figure 8b).
• Mamquam River and Ashlu Creek: The coho population in the Mamquam River and Ashlu Creek was generally below 1,500 and 1,000 fish, respectively, from 1951 to 1993 (Figure 8c and d). Peak escapements of approximately 8,000 fish in 1951 and 1971 in the Mamquam River, and peak escapements of 3,500 were observed in 1973 and 1974 in Ashlu Creek. Historical DFO data were collected in the mainstem of both rivers. Recently constructed side-channels were not surveyed at the time.
• Cheakamus River: Historical DFO escapement data for the Cheakamus River suggest that coho populations peaked at approximately 15,000 fish in 1964, 1974, and 1975 (Figure 8e). These data are based on observations conducted primarily in the mainstem. Cheakamus River coho remained near 1,500 fish through the 1980s. Data are not available for the early 1990s, but some escapements estimated based on AUC in the late 1990s and early 2000s show an increasing trend (Figure 8e). The exception was observed in 2004, when number of fish observed declined relative to previous years, likely caused by the October 2003 severe flood event (Squamish Nation 2004).
In summary, available historical escapement data are poor in quality and caution must be exercised when deriving conclusions. Historical data, particularly those from the 1950s and 1960s, appear questionable as the same number of fish were recorded by the same fisheries observer. Nevertheless recent trends suggest that the coho populations in the Mamquam, Cheakamus, and Stawamus systems are generally increasing from lows reached in 1997, primarily as a result of reduced fishing pressures and improvement in habitat and marine survival. However, current numbers have not reached historical
May 2005 - 49 - 03-1417-026
Golder Associates
highs. Ashlu Creek coho escapements remain low. No data exist for Squamish River coho since the early 1990s, and thus a current stock status remains unknown.
3.3.3 Juvenile Coho Salmon
Over the years, there have been a number of studies that have estimated coho juvenile abundance in the Squamish River watershed. Such studies have largely focused on only a few select systems, such as the Cheakamus River, Mamquam River, and Little Stawamus River. Smaller studies, such as one conducted in 1973, focused on Meighn and Tenderfoot creeks. Differences in study objectives, methods used, seasonality, and different systems surveyed between studies made comparisons difficult, and an assessment of coho juvenile stock status for the Squamish watershed was not possible.
In 1973, coho salmon smolts were enumerated on Meighn and Tenderfoot creeks (Argue and Armstrong 1977). The purpose of this study was to collect sufficient numbers of smolts for a coded wire tagging program to assess ocean migration patterns. Using a combination of fence traps and minnow traps, 17,679 coho smolts were trapped in 1973, of which 8,440 smolts were from Meighn Creek, and 9,239 smolts were from Tenderfoot Creek (Argue and Armstrong 1977). In 1974 and 1975, 13,186, 8,327, and 14,014 coho were tagged and released in the Little Stawamus River, Meighn Creek, and Tenderfoot Creek, respectively, over the two-year period. In 1997, the fall standing stock of juvenile coho in the Little Stawamus River were estimated to be 16,511 + 2,236 (14%) fish using stratified random sampling with three-pass removals (Decker et al., 1999). Although different methods were used, the 1974/75 and 1997 juvenile coho counts were similar.
Foy and Gidora (2002) reported approximately 42,000 coho smolts from a constructed side-channel and off-channel habitat area of 62,410 m2 in the Cheakamus River. The coho smolt production rate in 2001 was 5,903 smolts/km of the Cheakamus River mainstem; almost double the rate recorded in 1966 (2,561 coho smolt/km of mainstem). The smolt production rates are based on data collected in constructed side-and off-channel habitat and extrapolated to provide a rate for the Cheakamus River watershed. Estimates of juvenile coho emigration were 54,500 smolt in 2000 as compared to 38,361 smolt in 1966. Coho fry emigration was estimated at 108,800 in 2000.
From September 1999 to July 2000, as part of the Cheakamus River Water Use Plan, a juvenile salmonid distribution assessment was initiated in the Cheakamus River, using a combination of Gee Minnow Traps, pole seining, and snorkel surveys (Sneep 2001). Sampling was conducted seasonally. As a result of this study, 2,064 coho fry were captured. The study determined that coho fry were found in the Cheakamus River mainstem as well as in the side-channels and tributaries. The highest catch rates were not

May 2005 - 50 - 03-1417-026
Golder Associates
observed in one area of the Cheakamus River in particular, but rather varied with the capture method used and the seasons.
Under B.C. Hydro’s Water Use Plan for the Cheakamus River, population estimates for coho smolt in the Cheakamus mainstem and constructed side-channels were determined from 2000 to 2003 (Melville and McCubbing 2000; 2002a and b; 2003). In the Cheakamus River mainstem, population estimates for coho smolts ranged from approximately 35,000 in 2002 to 71,000 in 2003. Population estimates for coho smolts in side-channels ranged from approximately 58,000 in 2000 to 130,000 in 2003. Changes in fry or smolt population estimates do not necessarily reflect conditions in the river but rather changes in methods used, assumptions met, and the use of different methods to capture fish and analytical methodology to estimate populations. Population estimates for coho fry were not determined.
Studies conducted in 1999 and 2000 by ARL (2000, 2002) and Sneep (2001) provided anecdotal juvenile coho data in the Cheakamus and Mamquam rivers, and in several Squamish River tributaries. Although numbers for coho may be misleading regarding stock status of juvenile coho, numbers reported in these studies have been summarized. The range in juvenile coho densities reported by ARL (2000, 2002) and Sneep (2001) were 2.868 FPU in the Cheakamus River; 064.7 FPU in the Mamquam River and up to 302 FPU in Mashiter Creek.
3.4 Pink
3.4.1 Life History Characteristics
Pink salmon utilize freshwater habitats for spawning and marine habitats for growth and maturation. Pink were considered the most abundant of the Pacific salmon species, based on percent contribution to commercial fisheries than any other salmon species. They have a fixed two year life span and are the smallest of the Pacific salmon as adults. Spawning adults return from the ocean after about 18 months. Spawning migration usually begins in July, and spawning occurs in August to October in B.C. Pink salmon tend to spawn closer to the sea then another other of the Pacific salmon species. Upon emergence, which predominantly occurs at night, pink fry migrate quickly to sea. Downstream migration can occur from February to August; in B.C. peak migration occurs between May and June. Pink fry may move quickly from their natal stream or remain to feed along the coastline for several weeks depending on food availability before developing into smolts and moving offshore. Pink salmon migrate into the Strait of Georgia, Juan de Fuca Strait, northern B.C. coast and southwestern Alaska.

May 2005 - 51 - 03-1417-026
Golder Associates
Comprehensive information is not available for all aspects of the life history of Squamish pink; however, the following is known:
No quantitative assessments of Squamish pink salmon in recent years has been conducted and, as a result, comprehensive information on marine distribution, age and size-at-maturity, and incubation and juvenile rearing is no available. The following is known:
• Marine Distribution: Marine distribution of Squamish pink salmon is undocumented.
• Timing: Squamish pink salmon are an odd-year run. The timing of pink salmon spawning is similar throughout the Squamish River and its various tributaries. Pink salmon migration generally occurs in August; spawning begins in August and is generally completed by October.
• Spawning Distribution: Pink salmon spawn within the mainstem Squamish River as well as within a number of major tributaries of the Squamish River, including the Cheakamus and Mamquam rivers. Pink salmon spawning is often confined to distinct areas when populations are low (M. Foy, pers. comm., March 2003). Often these areas are associated with clear water streams that flow into large glacial rivers and side channels associated with the larger rivers; generally shared with chinook (M. Foy, pers. comm., March 2003).
• Age and Size at Maturity: Returning adult spawners are two years of age. Size-at-maturity of pink salmon is undocumented.
• Incubation and Juvenile Rearing: Incubation characteristics of pink salmon in the Squamish watershed is currently undocumented. Juvenile rearing characteristics of pink salmon is undocumented; however, they migrate out to sea immediately following emergence.
• Juvenile Migration: Pink salmon fry emergence typically begins in March, and fry commence downstream migration almost immediately. Emigration extends to late April, with the peak in emigration occurring in early April (Melville and McCubbing 2000; Triton 1993).
3.4.2 Squamish Pink Status
Squamish and other southern Georgia Strait pink stocks are not directly managed; however, these stocks are indirectly influenced by Fraser sockeye and pink management regimes (B. Fanos, pers. comm., November 2004). Fraser River pink stocks comprise over 99% of pink salmon production in the Lower Fraser Area, and as such, pink salmon management is largely focused on this area (B. Fanos, pers. comm., November 2004).

May 2005 - 52 - 03-1417-026
Golder Associates
Non-Fraser River pink stocks are not actively managed beyond addressing basic conservation principles (B. Fanos, pers. comm., November 2004).
Pink escapement data are available in odd years since the mid-1940s; however, there is a high degree of uncertainty associated with historical data due to differences in methods and fisheries observers over the decades. No data are available for even-year pink run as it is not measurable.
• Mamquam and Cheakamus rivers, Ashlu Creek: Escapements peaked in the early 1960s in the Mamquam (100,000 fish) and Cheakamus (555,000 fish) rivers, and in Ashlu Creek (7,000 fish) (Figure 9). Escapements declined significantly (<100 fish) in these systems by 1983 (Figure 9).
• Squamish River: Historical escapements indicate that the pink population in the Squamish River started to decline steadily in the late 1940s (Figure 9). Anecdotal information indicated close to 1 million pinks in 1963 in all Squamish River watershed systems (J. Wright, pers. comm., February 2004). Other early run pink salmon stocks in the region, including those in the Indian River, exhibited a similar pattern, with peak escapements in the 1960s and a subsequent decline (KWL 1998).
• Squamish systems: A record number of pink salmon (24,500) were observed in 2003 in select Squamish systems compared to numbers observed during the previous three decades (Squamish Nation 2004). Although the 2003 escapement estimate is relatively small in comparison to historical data, such a large recent return may indicate recovery of pinks. A directed enhancement program conducted by the Tenderfoot Hatchery on pinks in the Squamish watershed since 1985 may have contributed to this recovery. A strong population of pink salmon has been established in the Mamquam River since 1987, based on returns from the enhancement program in 1985 to 1993. Similar improved pink salmon returns in the Cheakamus River after 1993 are also suspected to be the result of enhancement efforts by Tenderfoot Hatchery. More recent data indicated approximately 15,500 pinks present in new spawning channels at the NVOS in fall 2003 (Melville and McCubbing 2003). Recent, similar spikes in pink stocks were observed in other southern B.C. systems, such as Chilliwack and Allouette systems (G. Wilson, pers. comm., November 2004). The virtual elimination of commercial fisheries directed at pink salmon in recent years due to conservations concerns with late run sockeye and Thompson coho may also play a factor in recent increases (N. Schubert, pers. comm., April 2005).
In summary, it would seem that the Squamish River watershed supported large numbers of pink salmon in the early 1960s. While numbers since then have remained low, 2003 data indicate higher numbers than in previous decades. It is likely that recent

May 2005 - 53 - 03-1417-026
Golder Associates
enhancement, habitat restoration and the elimination of commercial fisheries may have had a positive impact on these stocks.
3.4.3 Juvenile Pink Salmon
Limited information was found regarding the status of juvenile pink salmon. Under BC Hydro’s Water Use Plan for the Cheakamus River, population estimates for pink fry were determined from 2000 to 2003 (Melville and McCubbing 2000; 2002a and b; 2003). As an odd-year run, pink fry population estimates were determined for 2000 and 2002. Pink fry population estimates were 195,000 in 2000 and ranged from 1.1 million to 1.3 million in 2002. Changes in fry population estimates do not necessarily reflect conditions in the river but rather changes in methods used, assumptions met, and the use of different methods to estimate populations. These studies were heavily biased towards steelhead habitats and timing, and thus do not adequately address the status of pink fry.
A juvenile pink monitoring study was conducted in the new pink spawning channels at the NVOS in 2003 (Melville and McCubbing 2003). The study, based on a Petersen mark/recapture estimate, reported approximately 1.5 million pink fry. According to the authors, this estimate is larger than the population estimates in the Cheakamus River mainstem upstream of the RST.
3.5 Chum
3.5.1 Life History Characteristics
Like other Pacific salmon, chum utilize freshwater habitats for spawning, incubation, rearing, and smoltification, and marine habitats for growth and maturation. The species have the widest natural geographic distribution of the five Pacific salmon. Chum are second in size next to chinook, are strong swimmers and capable of swimming in high flows. Depending on the population, spawning adults can return from the ocean between two and five years and in some cases up to seven years. In southern B.C., spawning usually occurs from October to January and can spawn in streams of varying size. Chum fry typically migrate directly to sea, primarily at night, immediately following emergence. Emergence and seaward migration usually occurs from February to May. In southern B.C., chum typically spend three weeks in the estuary before moving offshore. Offshore movement is related to size and food availability in the estuary and offshore areas. Chum typically migrate through the Strait of Georgia north to Alaskan waters.
Comprehensive information is not available for age and size-at-maturity, incubation and juvenile rearing components of the life history of Squamish chum; however, the following is known:

May 2005 - 54 - 03-1417-026
Golder Associates
• Marine Distribution: Chum originating in streams adjacent to the Strait at Georgia usually follow a 3-5 year ocean migration through the Johnstone Strait (Hatfield 1996).
• Timing: The timing of chum salmon spawning within the Squamish River and its tributaries is variable. Chum salmon spawning migration generally occurs within the watershed in September. Spawning begins as early as September in the Mamquam River, but occurs between October and January in most of the watershed (Squamish Nation 2003).
• Spawning Distribution: Chum salmon spawn and rear within the mainstem Squamish River as well as within most of the major tributaries of the Squamish River, including Cheakamus, Brohm, and Mamquam rivers, and Ashlu and Shovelnose creeks. Chum salmon spawning is often confined to distinct areas associated with near surface aquifers and their upwelling discharges (M. Foy, pers. comm., March 2003). Chum fry are also dependent on estuarine habitat for a portion of their life history, albeit less so than chinook (M. Foy, pers. comm., March 2003).
• Age and Size at Maturity: In the Cheakamus River, chum are typically 3 years old when returning from the sea (Triton 1993). Age of Squamish River chum has ranged from 3 to 4 years (DFO, unpublished). Size-at-maturity information is currently undocumented.
• Incubation and Juvenile Rearing: No data are currently documented.
• Juvenile Migration: Chum salmon fry typically begin emergence in March, and fry commence downstream migration almost immediately following emergence. The peak in emigration occurs in April and generally ends in May (Melville and McCubbing 2000; Triton 1993).
3.5.2 Squamish Chum Status
There are two management units for chum in the Canadian Pacific Region: the Inner South Coast Chum Stock (ISC); and the West Coast of Vancouver Island (WCVI) unit. Chum in the Squamish area would be managed within the ISC unit. This aggregate would include chum from Seymour to Belize Inlet, Kingcome Inlet, Burrard Inlet, Fraser River, Boundary Bay, Upper Vancouver Island, and Howe Sound/Sunshine Coast (J. Tadey, pers. comm., September 2004). This unit would include all chum that move through the Strait of Georgia as opposed to the West Coast of Vancouver Island.

May 2005 - 55 - 03-1417-026
Golder Associates
Historical DFO chum escapement data are available from 1947 to 1996 for the Cheakamus, Mamquam, Ashlu, Stawamus, and Squamish mainstems. According to DFO escapement data, chum salmon have not shown a steady decline as was observed for the other salmon stocks, but rather showed high variability between years (Figure 10). Chum escapements to the Cheakamus River have generally increased since the 1970s (KWL 1998).
3.5.3 Juvenile Chum Salmon
Little information regarding juvenile chum salmon was available for the Squamish River watershed. Data were limited to the Cheakamus River where yearly juvenile migration studies were conducted under B.C. Hydro’s WUP. Juvenile salmon migration studies were conducted using Rotary Screw Traps from 2000 to 2003 (Melville and McCubbing 2000; 2002a; 2002b; and 2003). Population estimates ranged from 2.1 million fry in 2001 to 2.9 million fry in 2003. These studies were heavily biased towards steelhead habitats and timing, and thus do not adequately address the status of juvenile chum.
3.6 Sockeye Salmon
3.6.1 Life History Characteristics
Sockeye salmon utilize freshwater habitats for spawning, incubation, and rearing, and marine habitats for growth and maturation. Sockeye exhibit a greater variety of life history patterns of any of the Pacific salmon. Most notably, they use lake habitat as rearing habitat, during their juvenile stages. Although mostly anadromous, sockeye salmon also have a “land-locked” form referred to as kokanee. These are distinct populations that spawn, rear and die-off in freshwater, never having migrated out to sea. Anadromous sockeye salmon typically spend between 1-3 years rearing in lakes and streams before migrating to sea. However, some stocks migrate to sea immediately following emergence. Sockeye spend between 1-4 years in the ocean before returning to their natal streams and lakes. Sockeye salmon generally spawn in late summer (August) to fall (November). Emergence of sockeye fry in southern B.C., generally begins in mid-April and ends in late May to early June. Seaward migration generally begins during the onset of ice break-up in lakes and with the subsequent warming of water temperatures at lake outlets. Sockeye smolts may reside in estuarine and nearshore habitat before moving offshore. In southern B.C., they typically feed in the deep, plankton-rich waters of the Strait of Georgia in April and May, before leaving the Strait in June and July for more open waters north along the coast of B.C., and Alaska.

May 2005 - 56 - 03-1417-026
Golder Associates
No quantitative assessments of Squamish sockeye salmon have been conducted and, as a result, accurate and reliable information on marine distribution, age and size-at-maturity, and incubation and juvenile rearing. The following is known:
• Marine Distribution: Marine distribution of Squamish sockeye is undocumented.
• Timing: The timing of spawning within the tributaries is somewhat variable. Sockeye migration generally occurs within the watershed in June and July, and spawning begins as early as July in the Mamquam River, although it occurs in August and September in Ashlu Creek and the Cheakamus River (Squamish Nation 2003; Triton 1996).
• Spawning Distribution: Spawning is restricted to a few of the tributaries of the Squamish River, including Ashlu Creek and the Mamquam and Cheakamus rivers.
• Age and Size at Maturity: Age and size-at-maturity of Squamish sockeye are currently undocumented.
• Incubation and Juvenile Rearing: Sockeye salmon within the Squamish River watershed are limited in number because of the lack of lake rearing habitat for juveniles. Sockeye juveniles likely rear in quiet areas in the lower Squamish River and estuary (Triton 1993).
• Juvenile Migration: Sockeye emergence in the Cheakamus River generally begins in April, and fry begin downstream migration immediately because of the lack of lake rearing habitat. Emergence and outmigration continues until May (Triton 1993).
3.6.2 Squamish Sockeye Status
Squamish sockeye are not managed but are potentially affected by Fraser River sockeye management, assuming their ocean migration timing makes them vulnerable to Fraser Sockeye harvest activities (J. Tadey, pers. comm., September 2004). Squamish sockeye are considered a unique riverine population that would logically be part of a miscellaneous Georgia Strait sockeye stock aggregate group (J. Tadey, pers. comm., September 2004).
Limited historical escapement data are available for sockeye salmon in the Squamish River watershed. Available data are presented in Figure 11, but no trends are apparent. Historically, the Squamish watershed has not supported a large sockeye salmon population due to limited lake access.

May 2005 - 57 - 03-1417-026
Golder Associates
3.6.3 Juvenile Sockeye Salmon
No juvenile sockeye data for the Squamish River systems were found.
3.7 Steelhead Trout
The Greater Georgia Basin Steelhead Recovery Action Plan provides a general overview of the status of steelhead populations in the Squamish, Cheakamus and Mamquam rivers (GGBSRP 2002). This information has been summarized below. In addition, recent data compiled on the Cheakamus River as part of BC Hydro’s WUP are summarized. The Steelhead Harvest Analysis data from 1986 to 2003 were graphed to provide an assessment of Squamish steelhead stock status. Although this section does not provide a review of all existing and available information regarding Squamish steelhead, with the assist of MWLAP staff the most relevant data were extracted and presented to meet the objectives of this recovery plan. Furthermore, recovery of Squamish steelhead has recently been addressed in GGBSRP (2002), and as such duplication of effort was not warranted.
3.7.1 Steelhead Life History Characteristics
Steelhead/rainbow trout have a complex life history and are thus, typically hard to manage. They can have either an anadromous or a resident life cycle. The anadromous form has a freshwater and ocean phase, but returning adults do not necessarily die after spawning. The resident form, typically referred to as rainbow trout, do not migrate to sea and do not necessarily die after spawning. The Squamish Recovery Plan focuses on anadromous steelhead.
Anadromous steelhead exhibit either a “summer” or a “winter” life cycle. Summer-run steelhead typically enter freshwater in the spring and summer and will remain there until spawning the following spring/summer. Winter-run steelhead will enter freshwater in the fall and winter and will spawn the next spring/summer. Steelhead prefer to spawn in larger, faster flowing streams. Eggs incubate until early summer at which time they emerge. Fry seek shelter in undercut banks, overhanging vegetation, deeps pools, LWD and log jams. Steelhead typically reside in freshwater from one to four years depending on food availability, before migrating to sea as smolts. They typically spend one to three years at sea, but little is known about their residency. They are the least abundant of the Pacific salmon and consequently, relatively less is known about their life cycle.

May 2005 - 58 - 03-1417-026
Golder Associates
Comprehensive information is not available for all aspects of the life history of Squamish steelhead; however, the following is known:
• Marine Distribution: Marine distribution of Squamish steelhead is currently undocumented.
• Timing: Steelhead are present in the river throughout the winter, with mainstem runs returning December through July. Squamish winter-run steelhead are later timed than is typical for Georgia basin winter-run steelhead. Squamish steelhead runs to most tributaries occur between March and June. The timing of steelhead spawning in these tributaries varies considerably, although the steelhead would be considered winter run. In the Mamquam River, the majority of steelhead spawners return between mid-April and mid-May, with the run peaking during the first week of May (ARL 2002). Although late season steelhead have been recorded, the majority of fish leave the river before mid-May (ARL 2002). In the Cheakamus River, steelhead spawning was observed between mid-May and early June (McCubbing and Melville 2000). Spawning in Brohm River, a tributary of the Cheakamus River, was observed to occur as early as late April to late May. Steelhead spawning was observed predominantly in the upper Cheakamus River and in Brohm River (McCubbing and Melville 2000).
• Spawning Distribution: Steelhead spawn and rear within the mainstem Squamish River as well as within a number of its major tributaries, the Cheakamus River, Brohm River, Mamquam River and Mashiter Creek.
• Age and Size at Maturity: Age and size-at-maturity of Squamish steelhead are currently undocumented.
• Incubation and Juvenile Rearing: Steelhead fry begin emergence in July and generally rear within the system for two or three years.
• Juvenile Migration: Smolt emigration in the Cheakamus River generally begins in late March or early April and extends to late June, with the peak in emigration occurring in late April or May (McCubbing and Melville 2000; Triton 1993).
• Special Issues: Survey life (i.e., the time a fish resides in the area surveyed) was determined by radio telemetry studies in 2003 in the Cheakamus River (Korman et al., 2004). Average survey life varied between male and female steelhead and between areas in the Cheakamus River (Korman et al., 2004). In the upper reaches of the anadromous section of the Cheakamus River, average survey life for females was 34 days, while for males it was 51 days. In contrast, in the lower reaches, survey life for males tended to be much lower. The variability in survey life for females

May 2005 - 59 - 03-1417-026
Golder Associates
(CV = 0.71) was higher than for males (CV = 0.21) (Korman et al., 2004). The average survey life for both sexes was 64 days in 2001 and 40 days in 2003.
3.7.2 Squamish Steelhead Status
The longest running steelhead stock abundance indicator is the Steelhead Harvest Analysis (SHA). The SHA is an annual mail survey of angler effort and success. Results are based on voluntary responses to questionnaires sent out to about half of B.C. resident licensees. Methodologies have remained consistent since the survey began in 1967, and results provide a long-term index of abundance across most steelhead streams in B.C. Results show that most rivers on the east coast of Vancouver Island and in the Lower Mainland have been declining since 1989 to 1990 (Smith and Ward, 2000) .
Results from the SHA for the Squamish River and tributaries in particular indicate that values for effort and catch have been steadily declining to only 10 to 20% of values in the early 1980s (Figure 12). For example, in 1985 the catch for the Cheakamus River was 1,997 steelhead, yet in 2003 the catch was only 238 steelhead (Figure 12). For some tributaries, results are more variable (e.g., Mamquam and Elaho) so this trend is not as clear (Figure 12).
Due to declines in adult returns since the mid-1980s, the Lower Mainland Wild Steelhead Conservation Program was undertaken to assess the status of steelhead in the Squamish watershed. Snorkel surveys were used to count adult steelhead in 1978 and 1981, and again from 1999 to present. Details of methodology used in 1978 and 1981 are not available, and parameters such as visibility were not recorded. However, for the purposes of establishing trends between years, it was assumed that methodologies used by both studies were similar and that data were comparable. Steelhead peak counts and steelhead/km values are shown in Table 7.
Table 7: Peak Steelhead Snorkel Counts on the Cheakamus And Mamquam Rivers (1978 to 2004)1
Stream Survey Date Steelhead Count # Steelhead/km Km Swum
Cheakamus River 05/17/78 196 15.50 # sections = 5
05/13/81 155 16.00 # sections = 3
04/22/82 26 5.00 # sections = 3
04/22/83 84 10.50 # sections = 5
1 Data obtained from BC MWLAP; G. Wilson, pers. comm. November 2004.

May 2005 - 60 - 03-1417-026
Golder Associates
Table 7: Peak Steelhead Snorkel Counts on the Cheakamus And Mamquam Rivers (1978 to 2004)2 (cont’d)
Stream Survey Date Steelhead Count # Steelhead/km Km Swum
05/04/84 117 17.00 # sections = 2
05/13/85 179 42.00 # sections = 1
04/30/86 140 16.50 # sections = 8
05/17/96 48 3.84 12.50
04/07/97 56 4.48 12.50
04/14/99 50 4.00 12.50
05/15/00 25 2.00 12.50
04/11/01 108 8.64 12.50
05/07/02 108 8.64 12.50
01/05/03 76 6.1 Na
Mamquam River 05/01/78 18 7.06 2.55
03/19/81 5 0.86 5.79
05/02/97 34 5.87 5.79
05/05/99 9 1.55 5.79
04/25/00 6 1.04 5.79
05/10/01 26 4.49 5.79
05/07/02 44 7.60 5.79
04/19/03 11 1.90 5.79
05/07/04 10 1.73 5.79
The lowest snorkel counts for both streams were recorded in 2000, with some increases since, particularly in the Cheakamus River (Table 7). Counts for the Mamquam River in 2000, 2003, and 2004 are considered to be at-or-below the extreme conservation concern level (G. Wilson, pers. comm., November 2004). Consequently, weak returns are likely to occur for these year classes given that ocean survival is currently very low and shows no signs of improvement.
2 Data obtained from BC MWLAP; G. Wilson, pers. comm. November 2004.

May 2005 - 61 - 03-1417-026
Golder Associates
When conducting snorkel surveys to estimate steelhead abundance, the ability to see the fish will significantly influence the number of fish recorded. On days when turbidity levels are high, visibility will be reduced, and thus, the number of fish missed during the survey will likely be higher than under less turbid conditions. However, every possible attempt is made to conduct surveys when river conditions are most suitable. The Mamquam River is well suited for snorkel surveys and has relatively good visibility for the majority of the steelhead run from February into May.
• Cheakamus River: Historical steelhead escapement data for the Cheakamus River were compiled by the B.C. Ministry of Environment in 1978, and between 1981 and 1985 (Korman and Ahrens 2001). During these earlier years, snorkel surveys were conducted on only one day in each year and covered only a relatively small portion of the river. More recent steelhead surveys were conducted on the Cheakamus River between 1996 and 2004 as part of B.C. Hydro’s WUP process. Between 1996 and 2004 escapements were also based on snorkel counts, but surveys were done more frequently during the run (i.e., regularly between February and May), and over a greater portion of the river than the surveys conducted from 1978 to 1985.
Table 8 summarizes steelhead escapement estimates from 1996 to 2003 as reported in Korman and Ahrens (2001), Korman (2003), and Korman et al., (2004). The escapements presented are based on maximum likelihood estimates (MLE) and 95% confidence limits for Cheakamus River steelhead, incorporating uncertainty in observer efficiency and resident time as determined by telemetry studies conducted in 2001 and 2003. Escapement estimates from 2001, 2002, and 2003 are higher than those estimated from 1996 to 2000 and have greater precision.
Table 8: Maximum Likelihood Escapement Estimates For Cheakamus River Steelhead
Year Maximum Likelihood Escapement Estimate 95% Confidence Limits 1996 300 132-infinity 1997 290 115-882 1999 200 119-655 2000 120 64-402 2001 350 225-475 2002 320a
300b
260-390 250-350
2003c 500 375-725d
a – escapement determined under an unconstrained arrival time model (Korman 2003). b – escapement determined under a constrained arrival time model (Korman 2003). c – escapement estimated from survey life model and combined 2001 and 2003 telemetry data (Korman
et al., 2004). d – based on 90% confidence limits (Korman et al., 2004).

May 2005 - 62 - 03-1417-026
Golder Associates
A trend in steelhead escapement cannot be determined since the data collected in the later years are more precise due to better estimates of number of fish present late in the run (Korman 2003). Thus, confidence limits around escapement estimates in earlier years were wider because fewer swims were completed and they were concentrated over a smaller portion of the total migration/spawning period (Korman and Ahrens 2001).
Winter-run steelhead stock status in the Cheakamus River has been rated as lying between routine management and conservation concern zones (GGBSRP 2002).
• Other Areas: Steelhead escapements in the mainstem Squamish and other larger tributaries, such as the Ashlu and Elaho, are largely unknown. However, escapements for the Cheakamus River and, to a lesser extent, the Mamquam are fairly well understood.
• Squamish River: Winter-run steelhead stocks are rated as extreme conservation concern (GGBSRP 2002).
• Mamquam River: Winter-run steelhead stocks are rated as a conservation concern (GGBSRP 2002).
3.7.3 Juvenile Steelhead Trout
To determine the stock status of steelhead in the Squamish River watershed, a number of juvenile stock assessment initiatives have been conducted. Juvenile density estimates provide an alternative to estimating adult escapement as a means for determining stock status and trends when methods such as snorkel surveys are not practical. In the Squamish River watershed, juvenile surveys have been conducted annually from 1999 to present (ARL 1998 to 2001, Hanson 2004a and b). Historical data are periodically available for 1979 to 2004 (G. Wilson, pers. comm., November 2004). These studies focused on steelhead fry habitat and enumerated fry abundance using triple pass removal (electrofishing) in enclosed areas of approximately 100 m2 in various Squamish tributaries (Table 9).

May 2005 - 63 - 03-1417-026
Golder Associates
Table 9: Juvenile Steelhead Densities for Selected Streams in the Squamish River Watershed (1979 to 2004)3
Stream Year Mean FPU (M) Mean FPU (A) # Sites
Squamish 1979 10 Na 9 1986 10 Na 6 1987 13 Na Na 1999 9 Na 9
Mamquam 1989 30 Na 1 1999 38 62 8 2000 46 59 6 2001 38 60 6
Mashiter 2000 170 222 3 2001 257 478 2 2002 141 335 2
Cheakamus 1982 60 Na 3 1988 120 Na 7 1995 40 Na 12 1999 82 108 8 2000 95 126 10 2001 132 205 9
Brohm 1984 136 Na 1 2000 153 411 2 2001 132 208 3 2002 221 299 2
Ashlu 1986 92 Na 1 2000 10 15 2 2001 21 33 2 2002 28 33 3
High Falls 2000 63 78 2 2001 110 249 1 2002 67 91 1 2003 Shovelnose 1979 45 Na 1 1986 57 Na 1 1999 28 69 1 2000 138 161 2 2001 200 317 2 2002 193 275 2
Kaitlyn 2000 123 128 1 2001 177 213 1 Mean FPU (M) = Mean (of all sites) Fry per 100 m (Measured)
Mean FPU (A) = Mean (of all sites) Fry per 100 m [Adjusted for Habitat Suitability Index Curves (Depth/Velocity] Blank spaces = data (or sites) not completed as of September 17, 2004
2
2
3 Data obtained from BC MWLAP; G.Wilson, pers. comm. November 2004.

May 2005 - 64 - 03-1417-026
Golder Associates
The mean measured steelhead fry density calculated from various mainstem locations in the Squamish River for 1979, 1986, 1987, and 1999 is about 10.5 FPU, notably lower compared to tributary values (Table 9). Mean measured steelhead fry densities from various locations in the Cheakamus River have been compiled for 1982, 1988, 1995, 1999, 2000, and 2001. These range from 40 FPU in 1995 to 132 FPU in 2001. The mean measured steelhead fry density calculated from various locations in the Mamquam River for 1989, 1999, 2000, and 2001 is about 38 FPU.
In the Mamquam River there was no significant change in juvenile densities from 1999 to 2001, with numbers relatively low and consistent with adult counts for the same period. Cheakamus River juvenile densities showed little change between 1999 (108 FPU) and 2000 (126 FPU) and were highest in 2001 (205 FPU), which also agrees with the higher snorkel counts and escapement estimates for 2001. The majority of streams surveyed in the watershed during this time period showed a marked increase in fry densities in 2001. Sampling results from 2002 were similar to 2001, which also agrees with snorkel counts. Juvenile data for streams sampled in 2003 and 2004 (MWLAP in prep) indicate densities have declined since 2001, which follows reduced counts for snorkel surveys on the Mamquam over the last two years (G. Wilson, pers. comm., November 2004). Given that fry are the progeny of adults within the same year, the similar trends in abundance are expected. However, due to data limitations, differences in egg to fry survival, and variable stream habitats from one year to the next, comparisons between data collected from different studies were not always possible.
Juvenile steelhead densities were determined for other Squamish, Mamquam, and Cheakamus River tributaries, including Brohm, Mashiter, Ashlu, High Falls, Shovelnose and Kaitlyn creeks (Table 9). Of these streams, Ashlu Creek consistently had the lowest steelhead fry densities. For the period 2000 to 2002 the mean density was 27 FPU (A). Over this same time frame, Mashiter, Brohm and Shovelnose creeks had the highest mean densities of 345 FPU (A), 306 FPU (A), and 251 FPU (A), respectively. From this comparison, the disparities in steelhead productivity between different streams in the Squamish watershed are very apparent.
Steelhead fry density data are also available for Squamish River tributaries: Chuck Chuck, Last, Mawby, Sigurd, Spring, and Unnammed Creeks, as well as the Elaho River (G. Wilson, pers. comm., November 2004). These data are generally single site records from a single year of sampling and thus, do not provide useful information regarding the status of steelhead stocks in these systems. As such, data have not been provided.

May 2005 - 65 - 03-1417-026
Golder Associates
Based on the juvenile data available trends over time cannot yet be established. It is difficult to conclusively support declining trends in fry abundance over the last two decades. This is likely the result of the limited scope of work, different methodologies used to collect information, and different study objectives, all of which make comparisons and establishing trends difficult. However, information from other sources, including snorkel surveys and angler surveys indicates that current steelhead populations have experienced a significant decline over historical abundances.
Annual juvenile migration studies using RST estimated steelhead populations in the Cheakamus River as part of the WUP (Melville and McCubbing 2000; 2002 (a) and (b); 2003). Population estimates for steelhead smolts ranged from 1,693 in 2001 to 4,892 in 2003. Changes in fry or smolt population estimates can reflect changes in the river, but can also reflect changes in methods used, assumptions met, and the use of different methods to estimate populations.
May 2005 - 66 - 03-1417-026
Golder Associates
4.0 STOCK ENHANCEMENTS
There are three hatcheries located in the Squamish watershed: Tenderfoot Hatchery operated by DFO; the NVOS Hatchery used for educational purposes; and the Mel Drage Hatchery located on upper Dryden Creek (private hatchery, currently not in operation).
4.1 Tenderfoot Hatchery
The Tenderfoot Creek Hatchery is located approximately 15 km north of Squamish, on the east side of Cheakamus River and adjacent to Tenderfoot Lake. Built in 1981, the hatchery is used to enhance stocks of chinook, coho, and steelhead in the Squamish River watershed. The Tenderfoot Hatchery presently produces approximately 1.6 million chinook smolts, 300,000 coho smolts, and 100,000 chum fry each year, depending on the escapement levels and fishery requirements, in some years, pink salmon. Steelhead have not been produced and released by the hatchery since 1992. Details on enhancement operations, including information regarding release numbers from salmon enhancement projects conducted by the Tenderfoot Hatchery were obtained through their website (http://www-heb.pac.dfo-mpo.gc.ca/facilities/tenderfoot/production_e.htm).
The enhancement strategies of the Tenderfoot Hatchery are complex. Coho spawners are captured by drifting gill nets in known holding areas in the Squamish River watershed. Broodstock are captured and their progeny are reared in ponds at the hatchery for 15 months before they are released into their stream of origin as fry or smolts. From 1984 to 1995 fry and smolts were released into the Mamquam River, Squamish River, Ashlu Creek, Tenderfoot Creek and Lake, Dryden Creek, and/or Shovelnose Creek. After 1995, coho were released into Tenderfoot Creek only as it was deemed that survival rates and distribution in fisheries between the systems were similar (R. Cook, pers. comm., October 2004). Hatchery coho were marked with an adipose fin clip, but not on a regular basis. This marking was carried out prior to 1996 and 1997 brood stocks, when coho were generally showing poor survival (R. Cook, pers. comm., October 2004). Squamish coho were considered a conservation concern, and thus were not marked by the hatchery so that all unmarked coho would appear “wild” and thus, would not be eligible for harvest. Consequently, the proportion of wild versus enhanced coho stocks cannot be determined. Adipose fin clips were re-introduced to mark hatchery coho salmon from the Tenderfoot Creek population in 2003, as coho populations increased since 1997 (J. Tadey, pers. comm., September 2004). Steelhead were marked for a period of two years, but the process of detecting marked adult returns was poorly supported (P. Caverhill, pers. comm., March 2005). The hatchery does not mark other salmon species.

May 2005 - 67 - 03-1417-026
Golder Associates
Hatchery chinook were released as juveniles directly into the Squamish River and selected tributaries from 1981 to present. In 1987, chinook smolts were released into net pens at Porteau Cove, where they were held for a short period of time before release (DFO, unpublished). Brood stock were captured from net pens returns that congregated around the Britannia Beach area.
The total number of fry/smolts released per year by species is provided in Figure 13. Fish were released as fed or unfed fry, smolts, or subyearling smolts into a variety of systems in the Squamish watershed, including Ashlu Creek, Squamish River, Mamquam River, Cheakamus River, Tenderfoot Creek and Lake, B.C. Rail Channel, net pens at Porteau Cove, and the Squamish Estuary.
4.2 North Vancouver Outdoor School
The North Vancouver Outdoor School (NVOS) Hatchery was the first of its kind in B.C., built with public and corporate donations through the Vancouver Sun “Save the Salmon” program in 1982. It is not a “production hatchery” per se, but is a teaching hatchery for thousands of children that visit it every year. The students are involved in all aspects of hatchery operations, from capturing brood stock, to releasing the fry the following spring.
The NVOS Hatchery was originally intended to target chinook salmon. It was perceived at the time that they were in steady decline, likely due to loss of habitat and over exploitation (C. Halvorson, pers. comm., November 2004). However, a source of chinook for hatchery rearing was unavailable at the time and thus, enhancement activities focused on chum and coho. In 1992, the hatchery raised pink salmon originating from the Indian River system. In 2001, pink returns were from the NVOS created off-channel habitat (C. Halvorson, pers. comm., November 2004). A compilation of NVOS hatchery releases is shown in Figure 14.

May 2005 - 68 - 03-1417-026
Golder Associates
5.0 HABITAT RESTORATION
For the purposes of this report, habitat restoration is defined as the creation, rehabilitation, and development of habitat in the Squamish River watershed. Habitat restoration initiatives have included construction of new channels, complexing channels and mainstem rivers with LWD, excavation of remnant channels, excavation of groundwater channels, and a combination of all three types. A list of habitat restoration projects supported by DFO was provided by Roberta Cook and is shown in Table 10. While this is not an exhaustive list, it provides a general indication of some of the work that was done. Habitat restoration initiatives have been conducted since 1979 with the construction of the Lower Paradise Channel. Approximately 142,500 m2 of coho, chinook, pink and chum rearing and spawning habitat has been created.
The Steelhead Society of B.C. has also been involved in habitat restoration for steelhead. For example, stream fertilization experiments have been conducted in Shovelnose Creek, and side-channels have been created in the Ashlu River. A number of assessment and restoration initiatives have been completed and are proposed under the GGBSRP (G. Wilson, pers. comm., November 2004), including:
• Mashiter Creek – placement of 9 LWD and 59 boulder clusters over 0.4 km; side-channel development (0.87 km) (complete);
• Mamquam River – placement of 17 LWD; 0.5 km restored; 1.42 km side-channel;
• Lower Cheakamus River – placement of 25 LWD over 2.4 km;
• High Falls Creek – restore/enhance 1-2 km of channel;
• Ashlu Creek – restore/enhance 1.5 km of channel; and
• Shovelnose Extension Project – side-channel development (completed 2003/04); and
• West Side Squamish River tributaries – 2.5 km side-channel development (e.g., July Creek).
The Cheakamus River has received much attention with regard to the creation of constructed groundwater channels. These include the BCR Channel (upper), BCR Mile 49 Channel, Dave’s Pond, and the many channels surrounding the North Vancouver Outdoor School, including the Far Point system, Mykiss, Gorbuscha, Kisutch, Eagle Point, Upper and Lower Paradise, and Moodie’s channels. Annual monitoring data indicate extensive use of these constructed side-channels specifically by coho, chum, and pink (NVOS et al., 2002; Squamish Nation 2004; Foy and Gidora 2002). In 2003,

May 2005 - 69 - 03-1417-026
Golder Associates
approximately 100 chinook salmon were recorded entering the NVOS Gorbuscha Channel on their spawning migration (C. Halvorson, pers. comm., November 2004). In fall 2003, approximately 1.5 million pink fry were observed in the new Gorbuscha Channel (Melville and McCubbing 2003).
Constructed groundwater spawning and winter rearing channels are located on either side of the lower reaches of the Mamquam River, including the Mashiter, Mamquam, and Brennan Park channels on the north side of the river, adjacent to the Squamish Valley Golf Course. These were built in the mid to late 1980s. The Tiempo Channel is located on the south side of the Mamquam River, and was constructed in 1983, adjacent to a gravel quarry. In recent years, the Mamquam Channel has been expanded to the east, which has resulted in a considerable increase in pool or rearing habitat. The most recent project in the Mamquam watershed was a steelhead/coho side-channel, which was completed along the Mashiter River by the Steelhead Recovery Program and Sea-to-Sky University Foundation.
Habitat restoration projects completed along the Squamish River as part of the B.C. Watershed Restoration Program during 1996 to 2001 include (south to north) Ashlu Creek Channel, Chuck-Chuck Creek Ponds, 25.8 Mile Creek, Shovelnose Creek, 36 Mile Creek Channel and Pond, and Shop Creek. A 1.2 km extension of the Shovelnose Creek channel was completed in 2004 as part of the Steelhead Recovery Program.
Habitat restoration efforts conducted by others have also focused on various tributaries of the Squamish River, including Ashlu Creek, High Falls Channel, Judd Slough, Pilchuk Creek, and Shovelnose Creek (Table 10). A rearing pond was also constructed in Shop Creek, a tributary of the Elaho River.

- 70 - 03-1417-026
Golder Associates
Stream Project Name Year Built Channel
Type Spawn
Habitat (m²)
Rearing Habitat (m2)
(inc. Spawning) Spawning Eggs
Deposited # Emerged Stage Migration
# Comment Ashlu Ashlu Channel 1997 surf 13,500 62,550 chinook 250,400 62,600 smolt 31,300 Ashlu Ashlu Channel coho 208,700 62,600 smolt 31,300 Ashlu Ashlu Channel pink 16,875,000 fry 3,375,000 Odd-year only
Cheakamus B.C. Rail Channel 1985 grnd 1,500 3,900 chum 1,875,000 375,000 fry 375,000 Cheakamus B.C. Rail Channel coho 26,000 7,800 smolt 3,900 Cheakamus Far Point Channel and ponds coho 100,000 30,000 smolt 15,000 Cheakamus Gorbuscha Ch 2002 surf 4,500 8,000 coho 26,700 8,000 smolt 4,000Cheakamus Gorbuscha Ch 2003 surf 2,750 3,200 pink 5,625,000 1,125,000 fry 1,125,000 Odd-year onlyCheakamus Kisutch Groundwater Channel 1994 grnd 1,000 4,800 chum 1,250,000 250,000 fry 250,000 Cheakamus Kisutch Groundwater Channel coho 32,000 9,600 smolt 4,800 Cheakamus Mile 49 Channel and Pond 1994 grnd 1,500 3,900 chum 1,875,000 375,000 fry 375,000 Cheakamus Mile 49 Channel and Pond coho 18,000 5,400 smolt 2,700 Cheakamus Moodie's Channel 1986 grnd 3,420 10,200 chum 4,275,000 855,000 fry 855,000Cheakamus Moodie's Channel coho 68,000 20,400 smolt 10,200 Cheakamus Paradise Channel Lower 1979 grnd 2,040 2,040 chum 2,550,000 fry 510,000 Cheakamus Mykiss Channel 2004 surf 2,760 2,840 steelhead Chinook, coho, chum Cheakamus Paradise Channel Lower coho 13,000 4,000 smolt 2,000 Cheakamus Paradise Channel Upper 1981 grnd 2,625 2,625 chum 3,280,000 65,600 fry 656,000Cheakamus Paradise Channel Upper coho 17,400 5,200 smolt 2,600
Elaho Shop 3 Pond 1993 surf 2,000 coho 6,700 2,000 smolt 1,000Mamquam Brennan Park Channel and ponds 1988 grnd 1,500 2,000 chum 1,875,000 375,000 fry 375,000Mamquam Brennan Park Channel and ponds coho 13,000 4,000 smolt 2,000 Mamquam Mamquam Channel 1983 grnd 5,100 10,600 chum 6,375,000 1,275,000 fry 1,275,000Mamquam Mamquam Channel coho 71,000 21,200 smolt 10,600 Mamquam Mashiter Channel 1987 grnd 2,700 13,500 chum 3,375,000 675,000 fry 675,000 Mamquam Mashiter Channel coho 90,000 27,000 smolt 13,500 Mamquam Tiempo Channel 1988 grnd 2,000 2,000 chum 2,500,000 500,000 fry 500,000Mamquam Tiampo Channel coho 13,000 4,000 smolt 2,000 Squamish Highfalls Channel coho 6,700 2,000 smolt 1,000 Squamish Judd Slough 1978 grnd 5,360 5,360 chum 6,700,000 1,340,000 fry 1,340,000Squamish Judd Slough coho 36,000 10,800 smolt 5,400 Squamish Pilchuk Channel 1999 grnd 100 5,000 coho 33,000 10,000 smolt 5,000Squamish Shovelnose Channel 1994 surf 2,000 4,000 chinook 16,000 4,000 smolt 2,000Squamish Shovelnose Channel coho 13,000 4,000 smolt 2,000 Squamish Shovelnose Channel pink 2,500,000 500,000 fry 500,000 Odd-year only Squamish Squamish Estuary Restoration 1994 surf 125,000 chinook 500,000 125,000 smolt 62,500
Table 10: List of Habitat Restoration Projects Conducted in the Squamish River Watershed Since 19794
4 Obtained from Roberta Cook, DFO.
May 2005

May 2005 - 71 - 03-1417-026
Golder Associates
6.0 FISHERY USE
In British Columbia, coho stocks are assessed by using wild and hatchery indicator stocks to gather high quality smolt, catch and escapement data from which marine survival and exploitation rates and abundance trends can be estimated. This information is used to contextualize the more extensive, but less reliable data gathered from annual surveys of adult escapement and juvenile density that are conducted over a broader scale. The indicator stock system assumes that closely located stocks have similar ocean distributions and thus experience similar marine mortality and catch rates. For populations adjacent to the Strait of Georgia, there are currently 6 indicator stocks. These include Black Creek (Vancouver Island) and Salmon River (Lower Fraser), which are wild stocks, and the Inch, Chilliwack, (Lower Fraser) Big Qualicum and Quinsam (Vancouver Island) hatchery stocks. In 2000, a new wild indicator stock, Myrtle Creek, was developed on the Sunshine Coast. There are currently no indicator stocks for coho, chum, pink, or sockeye within the Squamish Basin. Squamish chinook are currently being considered as an indicator stock for the Southern Mainland Inlets, but its representativeness of southern Boundary Bay, Squamish and Capilano watershed remains questionable.
6.1 Native Fishery
The Squamish Nation has been fishing for salmon for cultural purposes and as a food source for hundreds of years. Steelhead are primarily of recreational value, but are also fished by the First Nations. Squamish Nation fishers deploy their nets at about a dozen traditional fishing sites located along the lower Squamish River. Historically, fish were plentiful and the Squamish Nation did not place restrictions on fishing activities. However, from 1951 to 1991, Native fishing efforts were regulated by restriction of fishing times (i.e., days of the week, months of the year); and by restrictions on types and characteristics of fishing gear (i.e., gill nets only; maximum gill net length) (DFO, unpublished). Fishing times varied between three and four days from 1951 to 1978. Seven-day openings on-reserve were implemented from 1978 to 1982, and then again from 1989 to 1991. Complete closures of Native fishery at certain times of the year to three or four day fish openings were re-introduced between 1983 and 1988.
The Squamish Nation and DFO initiated an annual salmon (i.e., coho, chinook, pink and chum) enumeration program in 1996. Monitoring of Native catch data has been incorporated into the annual program. Catch allocation is set on an annual basis through negotiations between the Squamish Nation and DFO, based on the salmon spawner surveys. Since 1996, the Squamish Nation has restricted fishing to a few months of the year, usually for a period in July and then again in October/November. In addition, fishing is restricted to two to four days a week for conservation purposes.
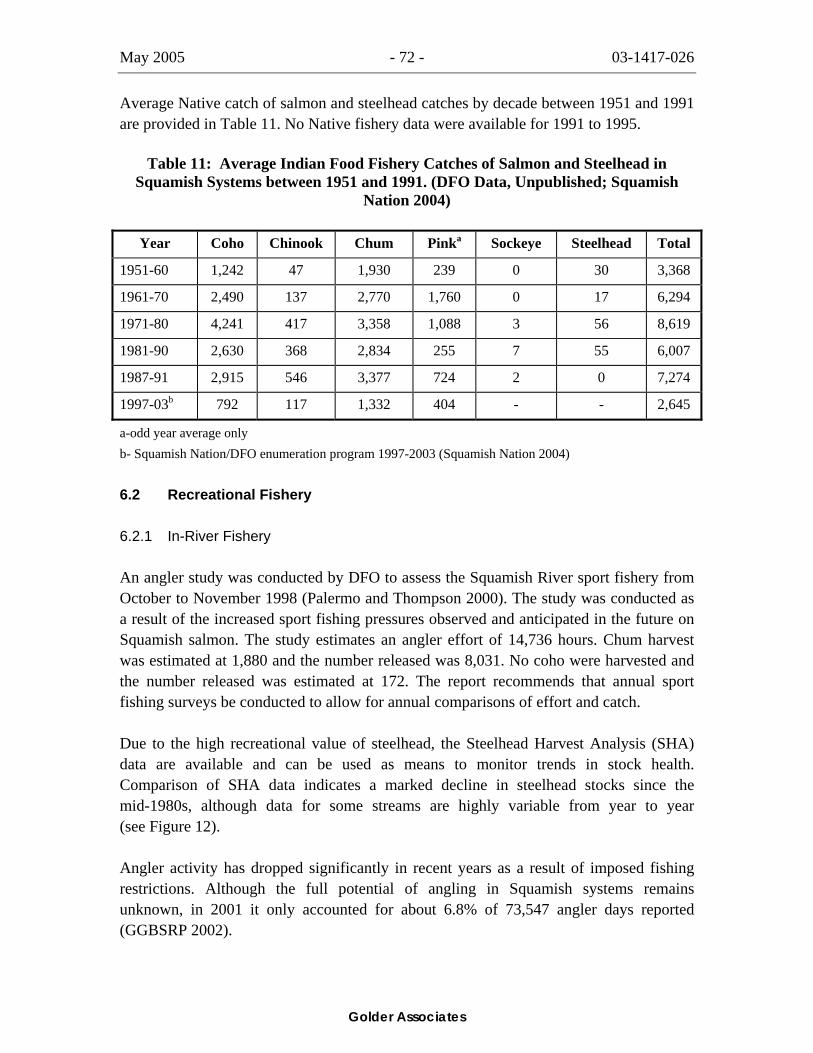
May 2005 - 72 - 03-1417-026
Golder Associates
Average Native catch of salmon and steelhead catches by decade between 1951 and 1991 are provided in Table 11. No Native fishery data were available for 1991 to 1995.
Table 11: Average Indian Food Fishery Catches of Salmon and Steelhead in Squamish Systems between 1951 and 1991. (DFO Data, Unpublished; Squamish
Nation 2004)
Year Coho Chinook Chum Pinka Sockeye Steelhead Total
1951-60 1,242 47 1,930 239 0 30 3,368
1961-70 2,490 137 2,770 1,760 0 17 6,294
1971-80 4,241 417 3,358 1,088 3 56 8,619
1981-90 2,630 368 2,834 255 7 55 6,007
1987-91 2,915 546 3,377 724 2 0 7,274
1997-03b 792 117 1,332 404 - - 2,645
a-odd year average only b- Squamish Nation/DFO enumeration program 1997-2003 (Squamish Nation 2004)
6.2 Recreational Fishery
6.2.1 In-River Fishery
An angler study was conducted by DFO to assess the Squamish River sport fishery from October to November 1998 (Palermo and Thompson 2000). The study was conducted as a result of the increased sport fishing pressures observed and anticipated in the future on Squamish salmon. The study estimates an angler effort of 14,736 hours. Chum harvest was estimated at 1,880 and the number released was 8,031. No coho were harvested and the number released was estimated at 172. The report recommends that annual sport fishing surveys be conducted to allow for annual comparisons of effort and catch.
Due to the high recreational value of steelhead, the Steelhead Harvest Analysis (SHA) data are available and can be used as means to monitor trends in stock health. Comparison of SHA data indicates a marked decline in steelhead stocks since the mid-1980s, although data for some streams are highly variable from year to year (see Figure 12).
Angler activity has dropped significantly in recent years as a result of imposed fishing restrictions. Although the full potential of angling in Squamish systems remains unknown, in 2001 it only accounted for about 6.8% of 73,547 angler days reported (GGBSRP 2002).
May 2005 - 73 - 03-1417-026
Golder Associates
6.2.2 Marine Fishery
Tenderfoot hatchery coded-wire-tagged chinook and coho provided information on the relative contribution of Squamish salmon to the different fisheries along the B.C. coast. In the 1980s typically a high percentage of salmon were captured in the Strait of Georgia, Northern and Central Coast sport fisheries. In the early 1990s, Squamish fish were caught in the Inside Passage sport fisheries, and Washington and Oregon fisheries.
For the time series of available data, most coho originating from the Squamish Basin were caught in either Strait of Georgia sport fisheries (42%) or the West Coast Vancouver Island troll fishery (30%). (Note that these are proportions of marine catch, not estimates of exploitation rates in these fisheries.) However, the relative impact of these fisheries in a given year depends on whether the fish are mostly distributed inside or outside the Strait of Georgia (D. Dobson, pers. comm., August 1999).
Most coho populations originating from streams draining into the Strait of Georgia are observed to migrate outside the Strait of Georgia in higher proportions during some years. Return years from 1985-1990 and 1992-1993 were considered inside years whereas 1991 and 1994-2000 were outside years. Squamish coho showed a propensity to migrate in similar patterns during those years. Therefore, when catch proportions are averaged across inside and outside distribution years and compared, the Strait of Georgia sport fishery has a much greater impact during inside years averaging 60% of the marine catch. In outside years, West Coast Vancouver Island troll fisheries accounted for 51% of the catch and Strait of Georgia sport fisheries only 14%. Juan de Fuca fisheries (net and sport) also have a much greater relative impact in outside years compared to inside (12.3% versus 4.2%). Generally speaking, years of inside distribution resulted in higher overall exploitation rates.
Fisheries having a less significant impact on Squamish coho are the Alaskan troll fisheries and Northern and Central BC troll and net fisheries as well as Johnstone Strait net fisheries.
Squamish chinook were captured in primarily in the Strait of Georgia sport fishery (39%) (Levy and Davies 1997). Levy and Davies (1997) reported other fisheries that captured Squamish chinook in the 1980s included: Northern and Central Coast Net fishery (23%); the Alaskan Commercial fishery (13%); and the Northern and Central Coast sport fishery (9.5%). In the mid 1980’s to mid 1990’s, the majority of Squamish chinook were captured in the Inside Passage sport fishery (36%); in the Northern and Central Coast commercial fishery (26%); in the Squamish terminal fishery (13%); and in the Alaskan fishery (11%) (Levy and Davies 1997). In the early 2000s, the majority of Squamish chinook were captured in the Strait of Georgia sport fishery (N. Schubert, pers. comm., April 2005).

May 2005 - 74 - 03-1417-026
Golder Associates
6.3 Commercial Marine Fishery
The commercial fishery in the Howe Sound area was active until 1956 and 1967, when gillnetting and trolling for salmon, respectively, were closed due to high mercury concentrations. Today, the commercial fishery remains closed in Howe Sound, though Squamish River salmon are caught in other coastal waters where commercial fishing is active. In the 1980s, Squamish fish were captured in Northern and Central Coast Net fishery, the Alaskan Commercial fishery; while in the early 1990s, Squamish fish were captured in the Northern and Central Coast B.C. commercial fishery, the Squamish terminal fishery, the Alaskan fishery, the West Coast Vancouver Island commercial fishery and the Washington and Oregon fisheries (Levy and Davies 1997).
Fishing restrictions implemented in the late 1990s reduced exploitation rates, specifically for chinook and coho, although some fish are still caught as a result of mixed-stock fisheries. Although inadequate information exists to produce reliable exploitation rates for Squamish salmon species, categorical exploitation rates for the aggregate considered to include Squamish chinook, coho, chum, pink and sockeye salmon were provided by N. Schubert (pers. comm., April 2005). Exploitation rates of coho and pink are considered to be very low or <10%; chinook exploitation rates are considered to be high or <60%; chum exploitation rates are considered to be moderate or <40%; and sockeye are considered to range from low to moderate.

May 2005 - 75 - 03-1417-026
Golder Associates
7.0 FRESHWATER HABITAT
7.1 Habitat Status
The status of salmon habitat within the Squamish River watershed can be best described by dividing the watershed into two sub-basins, which are quite different in past, present, and future projected land use patterns and habitat issues. The upper Squamish River, upstream of the Squamish-Cheakamus River confluence, is dominated by Crown-owned lands that are largely set aside for commercial logging. Changes to salmon habitat in this portion of the watershed have been and will continue to be driven largely by forest practices carried out during commercial logging of the first and second growth forests and IPP developments.
The lower Squamish River watershed comprises the Squamish River mainstem and its tributaries downstream of the Cheakamus-Squamish confluence, including the Cheakamus River, Mamquam River, and Stawamus River has been extensively developed for human settlement and hydroelectric power generation. The issues relating to salmon habitat in the lower watershed will continue to be driven by these development activities.
The following section describes habitat losses and restoration activities in the upper and lower Squamish River watershed.
7.2 Upper Squamish River Watershed
Approximately 30% of the chum and pink salmon and 65% of the chinook and coho salmon were historically produced from the upper Squamish River watershed above the Cheakamus River confluence (Hancock and Marshall 1986). Commercial logging over the last 50 years has been a large factor in the degradation of salmon and steelhead spawning habitat within the Squamish River watershed. These spawning areas have experienced increased channel migration rates and sedimentation, loss of side-channel habitat, gravel movement, and overall instability caused by rapid logging of riparian and watershed forests (Dillon 1998).
In the upper Squamish River and its tributaries, loss or isolation of stable off-channel habitat is a factor in coho salmon declines. Coho salmon typically use small tributaries, side-channels, marshes, ponds, and other off-channel habitats during the one or two years they reside in freshwater. The construction of access roads in the floodplain, the placement of culverts, the predominance of early succession forests due to logging and the resulting increase in beaver populations, and the reduction of flood frequency in habitats on the land side of the road have reduced the productivity of many off-channel habitats important to coho salmon (M. Foy, pers. comm., March 2003). Many inactive
May 2005 - 76 - 03-1417-026
Golder Associates
logging roads were rehabilitated or removed in the late 1990s to reduce their potential to initiate slides that could result in large sediment inputs into watercourses. This should accelerate the recovery of watershed processes in streams affected by past logging activities provided future logging activities are conducted in a more environmentally sensitive manner over historical methods. (M. Foy. pers., comm., March 2003).
Chinook and pink salmon are commonly found spawning in main river and large side channel habitats. These habitats are dynamic in nature and do not lend themselves to human intervention for the purpose of improving habitat conditions. Opportunities to improve riverine habitat conditions for pink and chinook salmon are limited by their preference for main river habitats. Recovery of watershed processes to historic levels of flood frequency, riparian forest structure, gravel transport rates, and landslide frequency will ultimately restore these populations in the long term (M. Foy, pers. comm., March 2003).
A series of overview and Level 1 fish habitat, riparian, and channel assessments were conducted in Squamish River tributaries under the B.C. Ministry of Environment, Lands and Parks (now MWLAP) Watershed Restoration Program (WRP) in the 1990s. These studies identified habitat conditions and fish distribution and provided recommendations for habitat restoration initiatives. As a result, a number of different habitat restoration initiatives have been implemented in the Squamish River watershed. Most of these efforts have focused on Squamish River tributaries: Ashlu, Shovelnose, and High Falls creeks, with minimal efforts on Shop, Chuck Chuck, 28.5 Mile, and 36 Mile creeks. All of these tributaries have been affected by logging activities. These habitat restoration initiatives were conducted by the Steelhead Society Habitat Restoration Corporation (SSHRC) in partnership with International Forest Products (Interfor), and DFO since 1996, and were funded by the Watershed Restoration Program (WRP). Restoration efforts focused on enhancing rearing and spawning habitat primarily for steelhead, coho, and pink salmon by creation of groundwater channels where feasible, creation of ponds, placement of LWD and boulder clusters, opposing wing deflectors to promote habitat complexity, placement of habitat reefs, nutrient additions, and beaver management options (SSHRC 1998a and b). A number of “As-Built” reports were developed that provided design details for selected habitat restoration projects (SSHRC 1999). A number of progress reports have also been prepared that provide information on the status of various restoration initiatives. Monitoring reports assessed the degree of success of the habitat restoration initiatives. The SRWS was also involved in WRP-funded restoration initiatives in a number of different systems within the Squamish watershed, including Crawford Creek in the upper Mamquam River, Chance and Lucille creek, and Brohm River, a tributary to the Cheekye River in the Cheakamus River sub-watershed.
Shovelnose Creek, a tributary to the eastside upper Squamish River, located at approximately Mile 31 of the Squamish Valley Road, is a key supporter of steelhead and

May 2005 - 77 - 03-1417-026
Golder Associates
salmon populations. While it has historically been impacted by logging activities and natural landslides, habitat restoration efforts have provided improved spawning and rearing opportunities for salmonids (SSHRC 2001). However, the stream remains plagued by heavy sand and sediment deposits. Deposition of fines was exacerbated by the October 2003 flood event.
High Falls Creek, another tributary on the eastside upper Squamish River, also supports steelhead and salmon populations, specifically chum spawners, albeit at a lower productivity level than Shovelnose Creek. High Falls Creek drains into the Squamish River via the B.C. Hydro powerhouse channel. It also has suffered from logging and natural landslide impacts (IRM 1997). The section downstream of the Squamish Valley Road bridge is accessible to anadromous salmon. The channel in this area is largely undefined and dominated by gravel and boulders. Heavy bedload deposition and accumulation occur all the way to its anadromous limit, resulting in subsurface flows and inaccessibility to fish at certain times of the year (IRM 1997). A groundwater side-channel complex was constructed in the mid-1990s under the Watershed Restoration Program to enhance chum and coho salmon (SSHRC 1998b). Another groundwater channel (Weldwood Channel) was constructed by DFO in the late 1980s.
Ashlu Creek, a tributary on the westside of the Squamish River, also supports steelhead and salmon populations. Historically, sediment supply to Ashlu Creek, which is heavily influenced by glacial processes, appeared to be predominantly by episodic debris flows and colluvial processes, and thus the volume of transportable sediment supply to Ashlu Creek was relatively low (HAYCO 1996). However, impacts from forest practices, largely conducted in highly unstable areas of the watershed, have increased the volume of sediment supply to Ashlu Creek, causing infilling of side-channels, widening of the mainstem, and elevated sediment and water discharges (HAYCO 1996). Increases in the discharge of large bedload material that has accumulated in the upstream end of side-channels in the fan area resulted in the isolation of these side-channels. HAYCO (1996) determined that the number of landslides attributable to forest harvesting per unit area was greater by 1.9/km2 than the number of natural landslides in the unharvested areas. There is the potential for further habitat degradation as a result of the proposed run-of-the-river hydro development project on the Ashlu. A powerhouse is proposed in the upper section of the anadromous area, and a diversion structure and dam in the upper reaches occupied by a headwater steelhead population. To accelerate the recovery of fish habitat and fish populations in the river, two side-channels, the North and South channels, were created to provide stable rearing and spawning habitat for chinook, pink, coho, chum, and steelhead (SSHRC 2001). A third coho channel has been proposed for IPP compensation, along with a west side channel to provide steelhead habitat.
Based on evaluations of restoration projects conducted between 1996 and 1998, habitat restoration efforts in these Squamish River tributaries have generally been successful.

May 2005 - 78 - 03-1417-026
Golder Associates
The design structures evaluated were observed to have the desired effect on channel morphology (i.e., increase habitat complexity) and have remained stable, although a few structural changes were deemed necessary at several locations to further improve functionality (SSHRC 1998a). Utilization of these structures by salmonids as determined by counting fence, mark-recapture, or trapping methods showed an increase in densities of juvenile and adult spawners (SSHRC 1998b).
The most recent effectiveness evaluation of the upper Squamish River watershed projects was conducted by SSHRC in 2001, four years after initial restoration implementation. The objective of this evaluation was to monitor six restoration projects for winter juvenile distribution, spawner use, beaver activity, water quality and function of constructed instream structures. A number of constraints were observed that potentially impacted use of these structures by salmonids. Most notable was the issue of adequate water quality and quantity. The success of groundwater-fed side-channels and over-wintering ponds is contingent on water quality and quantity. Areas of concern included adequate flows during low flow winter months; and adequate oxygenation, pH, and temperature (SSHRC 2001). A limitation of the evaluation was the lack of juvenile fish distribution data prior to habitat restoration for comparative purposes (SSHRC 2001).
Restoration opportunities for coho salmon are common throughout the upper Squamish River watershed. While much of the upper watershed is Provincial Crown land, some important salmon-producing floodplain habitats are located on Squamish Nation lands and scattered private properties. Coho habitat restoration has been carried out both on private lands and Squamish Nation lands, and further opportunities for recovering damaged habitats remain (M. Foy, pers comm., March 2003). DFO’s Habitat Enhancement Branch (HEB) and Squamish First Nation’s staff breach or remove beaver dams on a number of streams to allow coho and chum salmon access to spawning habitats. This is done on an ad hoc basis and requires clearer direction and coordination among the parties involved (M. Foy, pers. comm., March 2003).
Permanent habitat impacts for chinook, coho, pink, chum, and steelhead populations in the upper Squamish River are generally less compared to lower watershed populations as a direct result of decreased logging activities, habitat restoration activities, and lower rates of other land development pressures. Upper watershed salmonid habitats will recover as forests regenerate and hydrological processes moderate. The rate of recovery will depend on future forest harvesting plans. Remaining spawning/rearing habitats are at some risk of future decline if logging on the west side of the upper Squamish River, the Ashlu Creek, and the Elaho River increases river instability (M. Foy, pers comm., March 2003).

May 2005 - 79 - 03-1417-026
Golder Associates
7.3 Lower Squamish River Watershed
Approximately 70% of the chum and pink salmon and 35% of the chinook and coho salmon were historically produced from the lower Squamish River watershed (Hancock and Marshall 1986). The lower Squamish watershed has also supported larger proportions of steelhead (i.e., in the Cheakamus River, Brohm Creek, Mamquam River) compared to the upper Squamish watershed. However, in the lower Squamish River watershed, within the Squamish District Municipality, significant amounts of chinook, coho, chum, pink, and steelhead habitat has been permanently lost or altered due to human encroachment onto historic floodplains. Many of these habitats will not be recovered since the floodplain lands are now developed for commercial, residential, or industrial land uses. Pink salmon populations collapsed in the Squamish River watershed after the large 1975 flood event. The combined effects of past habitat damage, excessive commercial fishing, and low productivity at low population numbers has restricted their recovery since then. A large pink escapement was observed in the fall of 2003. A study conducted by Melville and McCubbing (2003) reported a pink fry yield of approximately 1.5 million fry, and estimated egg to fry survival of 19.6%. Unfortunately, an equally large flood event occurred in October 2003 and threatened many of the pink eggs deposited.
The chinook and pink salmon populations within the Cheakamus and Mamquam rivers appear to be at long-term risk of decline due to the permanent habitat changes within these watersheds, which have reduced their productivity below other habitats within the Squamish River. The Cheakamus River historically provided spawning and rearing habitat for salmonids. The B.C. Hydro hydroelectric facility on the upper Cheakamus River now diverts water from this drainage into the Squamish River, thereby changing water flows in both these rivers. The Daisy Reservoir and flood control structures, such as dykes, have cut off access to side-channels thereby reducing key habitat. The Mamquam River has a hydroelectric facility now operating and a second one under construction. These facilities have the potential to threaten water quality and quantity and impact fish habitat.
Pink salmon populations in the Cheakamus River have also been negatively affected by the diversion of water to the Daisy Reservoir power station (Marshall 1978). A study found that pink salmon fry production from the Cheakamus River had collapsed to low numbers of observed fry compared to the millions of pink fry estimated to have migrated from the Cheakamus River in the spring of 1966. However, record numbers of pink salmon were observed in 2003 in the Squamish River watershed. Some of the increase in spawning return to the Cheakamus River may be the result of the renewal of pink salmon hatchery enhancement. Tenderfoot Hatchery released pink salmon fry in the 2001 brood year; the first time since 1993. Historic highs in pinks were also observed along coastal

May 2005 - 80 - 03-1417-026
Golder Associates
B.C. Increase in pink abundance can also be attributed to the elimination of commercial pink fisheries in southern B.C.
As is the case for most Squamish area streams, habitat conditions in the Cheakamus River are limited by a lack of LWD, resulting in poor instream cover and only fair pool frequencies. A combination of past logging activities and the Daisy Reservoir have reduced the recruitment of LWD and gravel to the lower Cheakamus River. Slaney (2003) rated the overall habitat quality in the Cheakamus River as poor. In an attempt to restore some of the lost habitat, five major habitat off-channel restoration projects have been undertaken on the Cheakamus River since 1978. These projects involved the development and creation of protected groundwater and river-fed habitats located at the floodplain margin that support important populations of coho, chum, and more recently, pink and chinook salmon (M. Foy, pers. comm., March 2003). Additional off-channel restoration opportunities in the Cheakamus River watershed are being pursued on private and Squamish Nation lands before these areas are converted to other uses. These areas include the NVOS side-channel complexes, such as Moody’s Channel, Kisutch Channel, Upper and Lower Paradise Channel, and the Far Point system. Together, these constructed side-channels account for 60,000 m2 of side and off-channel habitat in the Cheakamus River (Foy and Gidora 2002). In 2001, these constructed channels provided about 41% of the total coho smolt production in the Cheakamus River system (Foy and Gidora 2002). Initial work on Mykiss Channel was completed in 2004, with steelhead habitat complexing to be completed in 2005.
Habitat conditions within the Mamquam River appear to be stabilizing after decades of degradation. This trend is primarily a result of decreased logging and recovery of second growth forests and reduced dyking activity now that the river corridor is largely dyked from the canyon at 3.0 km to the Squamish River confluence (M. Foy, pers. comm., 2001). However, despite lower logging and dyking pressures, the quality of habitat in 2 km of assessed reach of the Mamquam River mainstem ranged from poor to good, depending on habitat parameters (Slaney 2003). The Mamquam River lacks a supply of LWD, resulting in poor cover, pool frequency, and low insect abundance (Slaney 2003). Habitat restoration initiatives in the Mamquam River mainstem are considered high risk due to the high flows and unstable nature of the channel. However, the addition of LWD would provide additional habitat for steelhead and chinook, whose habitat preference include these higher flow and velocity conditions typical of the Mamquam mainstem.
Restoration efforts by DFO have focused on the Mamquam River side-channels, where the probability of success is increased considerably over efforts in the mainstem to the benefit of side-channel rearing species such as coho. Four major habitat off-channel restoration projects have been undertaken on the Mamquam River since the 1980s. These projects involved the development and creation of protected groundwater-fed habitats located at the floodplain margin that support important populations of coho and chum

May 2005 - 81 - 03-1417-026
Golder Associates
salmon (M. Foy pers comm., March 2003). In the spring of 2000, a downstream trapping study was undertaken on the Mamquam side-channel complex (M. Foy, pers. comm., March 2003). This area provides the largest component of restored off-channel habitat on the Mamquam River. Approximately 28,000 coho smolts were counted migrating from this area during the spring trapping program (M. Foy, pers. comm., March 2003). DFO monitoring of coho smolt and chum fry migration suggests the majority of Mamquam River coho smolts are produced in these constructed areas (M. Foy, pers comm., March 2003). The groundwater-fed channels are also important for stabilizing chum production from the watershed.
Mashiter Creek is a valuable tributary to the Mamquam River, and a producer of steelhead, chinook, pink, and coho. Urbanization and past logging activities have affected this river, resulting in a loss of habitat complexity. A recent habitat assessment conducted by Slaney (2003) indicates a lack of LWD and associated pool habitat, and a river currently dominated by riffle habitat (90.2%). Overall, Slaney (2003) reported the existing habitat as very poor for steelhead and salmon populations. However, adequate summer base flows (0.5 to 1.0 m3/sec), gradient (average 1.8%), adequate nutrient sources to support aquatic life, and lower risk compared to the Mamquam mainstem make this river a good candidate for restoration work (Slaney 2003).
A District of Squamish domestic water supply well has been developed at the confluence of the Mamquam River and Mashiter Creek. A consultant report indicated the well would not affect nearby Mashiter Creek, a tributary of the Mamquam River (District of Squamish 1998). The report did not address whether it would have the potential to alter groundwater levels to the detriment of nearby groundwater-dependent salmon habitats such as the Mamquam side-channel complex and Meighn Creek. If groundwater levels drop in the Mamquam River aquifer, the future of the coho and chum salmon populations in the Mamquam River and the floodplain streams (up to 10% of the Squamish River watershed populations) may be threatened (M. Foy, pers. comm., March 2003).
Gravel removal for flood control from the Mamquam River, below the Highway 99 bridge during the 1980s and in the vicinity of Mashiter Creek during the 1990s, has reduced gravel supply to the lower Mamquam River and exacerbated a drop in river bed elevation near the Highway 99 bridge. This has resulted in a lowering of the near surface water table, which is presently reducing groundwater flows in the Mashiter and Brennan side-channels and Loggers Lane Creek. Previously excellent salmon habitats now provide poor habitat due to lack of flow. Flows to these groundwater-dependent habitats will be restored if no further instream gravel removal is allowed and gravel beds rebuild to their past elevation (M. Foy, pers. comm., March 2003).

May 2005 - 82 - 03-1417-026
Golder Associates
A run-of-the-river hydro development (IPP) has been constructed on the Mamquam River upstream of the section of the watershed available to anadromous salmonids. The creation of the impounded headpond upstream from the hydro facility intake may exacerbate problems in the lower Mamquam River from reduced gravel transport and associated river downcutting that has led to a lowered water table. The operation of the run-of-the-river hydro plant should be monitored to identify negative impacts to gravel transport to important salmon habitats downstream or juvenile stranding from water level fluctuations (M. Foy, pers. comm., March 2003).
The Mamquam River has been dyked over the past century such that many of the flood channels and tributary streams draining its floodplain are now permanently isolated from the parent stream. Meighn, Loggers Lane, Hop Ranch, and Dryden watersheds now drain directly into the Squamish River or its estuary. Regular flood events prior to floodplain development would have interconnected the populations in these floodplain habitats with the more numerous Mamquam River salmon populations, ensuring both long-term productivity and genetic diversity (M. Foy, pers. comm., March 2003). DFO is looking at the feasibility of reconnecting the upper Loggers Lane Creek with its parent stream, the Mamquam River.
A 1973 to1975 DFO study looked at coho smolt productivity in Meighn Creek and the Little Stawamus River (Argue and Armstrong 1977). Meighn Creek produced from 800 to 2, 650 smolts/km (average 1, 760 smolts/km) in the three years of the study. Little Stawamus Creek produced from 1, 677 to 1, 921 smolts/km, (average 1,800 smolts/km) in two years of study. Both streams were producing coho smolts at slightly above average levels compared to other south coastal coho streams (Argue and Armstrong 1977). A 2001 study revisited coho smolt production from Meighn Creek to identify any changes over the 20 years since the previous study. In 2003 and 2004 coho smolt production from Meighn Creek dropped (M. Foy, pers.comm., November 2004). Time will tell whether this reduction can be attributed to the development of the Garibaldi Spring Golf Course upstream. These data will also be used as a benchmark to track productivity changes over time as the watershed develops (M. Foy, pers comm., November 2004).
The coho and chum salmon populations within the lower Squamish River, Cheakamus River, and Mamquam River appear to be rebuilding from the lows in the 1970s. The enhancement of coho salmon by Tenderfoot Hatchery, closure/curtailment of commercial fishing, and the restoration of a number of groundwater side-channels and other off-channel habitats are adding to this recovery (M. Foy, pers comm., March 2003). Coho and chum salmon populations in the small streams draining the historic floodplain of the Mamquam and Stawamus rivers continue to be affected by habitat losses caused by urban development and will continue to suffer a decrease in productivity as a result. The filling of marshes, ponds, and other seasonal water bodies, dyking of rivers, changes to water run-off rates, deterioration of water quality and quantity, and clearing of riparian

May 2005 - 83 - 03-1417-026
Golder Associates
and other vegetation along streams will continue to contribute to habitat loss. While the numbers of chum salmon produced from these urban streams are small in relation to the Squamish River watershed populations as a whole, up to 5% of the coho salmon in the Squamish River watershed rear in these urban floodplain habitats (Hancock and Marshall 1986). Consequently, remaining critical and restored habitat will need to be protected. Land development will need to strategically protect fish habitat, and compensation requirements to address habitat impacts will need to be strictly enforced to achieve no net loss of habitat.

May 2005 - 84 - 03-1417-026
Golder Associates
8.0 PRODUCTIVE CAPACITY
The following section provides interim productive capacities for Squamish chinook and pink salmon, and for steelhead. Although existing information was collected for all five species of Pacific salmon present in the watershed, recovery efforts will be focused on chinook, pink, and steelhead as these were deemed the species at most risk by PSF and the SRWS. However, coho productive capacities are also provided. It is assumed that some recovery efforts focused on one species may benefit the other species as well.
As a means of setting recovery goals for these three species, productive capacity of the Squamish River watershed is required. Capacity can be established for freshwater or marine productivity. Freshwater productivity can be considered relatively stable based on survivals compared to marine survival, which varies considerably over the short term. Productive capacities based on marine survivals have the potential to change continually and thus lead to continually changing capacities and delayed recovery rates when ocean conditions change (G. Wilson, pers. comm., November 2004).
Productive capacity can be defined in two ways. Capacity can be defined as the average adult spawner abundance that produces an equivalent average number of mature adult spawners in the absence of fishing and it is the point where the Ricker stock-recruitment function crosses the one-to-one replacement line. Capacity defined based on adult spawners would be subject to continually varying marine survival rates. As such, it might be better to base productive capacity on smolt production, which would not be sensitive to marine conditions and would provide a better assessment of freshwater conditions.
The information collected to date regarding stock status and habitat availability does not allow for an accurate assessment of freshwater or marine productive capacities for these species. Consequently, the intent is for the recovery plan to be based initially on “interim” productive capacities based on adult spawners and/or smolt production, where possible. As new data become available, productive capacities and associated recovery targets will be adjusted accordingly.
8.1 Chinook
Little information exists about the productive capacity of the Squamish River watershed for chinook salmon. Hilborn and Walters (1992) suggested that productivities would be relatively similar within a species, yet capacity would be related to the area of the habitat and would vary among stocks. However, insufficient studies were available for salmon species to demonstrate these suggestions until recently. An interim productive capacity for chinook was estimated applying a habitat-based model generated by DFO.

May 2005 - 85 - 03-1417-026
Golder Associates
8.1.1 DFO Allometric Model
A simple-structured allometric model developed by Fisheries and Oceans Canada, it explains about 87% of the variation in capacity for stream-type chinook salmon populations, the main life history of Squamish chinook salmon prior to hatchery production (C. Parken, pers. comm., April 2004). The same general relationship exists for the spawning abundance that produces the maximum sustained yield on average. The relationship is intuitive in that the capacity of watersheds increases with the habitat area, indicated by accessible watershed area, but the proportion of a watershed that contributes to capacity decreases as watershed size increases. For chinook-bearing watersheds, the smallest watershed may contain a single stream and a high percentage of the watershed area would contribute to capacity. Whereas larger watersheds typically have many streams, a proportion of them would not be suitable for spawning or rearing, thus proportionately less area contributes to capacity. The relationship was established or formulated from a meta-analysis of Ricker stock-recruitment relationships developed from 13 stream-type chinook populations ranging from the Columbia River to the Bering Sea in Alaska (C. Parken, pers. comm., April 2004).
Squamish chinook may have had a dominant stream-type life history prior to the hatchery program. Hatchery production of chinook is based on changing the dominant life history to mainly ocean-type (Schubert 1993). The meta-analysis relied on information from natural populations, and for the Squamish River estimates were developed for natural stream-type chinook. About 2,517 km2 of the Squamish River watershed occurs in accessible areas downstream of a man-made dam barrier. An accessible watershed of this size is expected to have a capacity of about 12,540 stream-type fish. A spawning abundance of about 5,109 stream-type fish would produce Maximum Sustained Yield (MSY) on average. In comparison, Fisheries and Oceans Canada developed an interim escapement goal (7,000 fish) for the Squamish River following a stock-recruitment analysis of one aggregate of B.C. chinook populations in 1982, when stocks were considered data-limited (Starr 1982).
There are limitations in the model’s ability to accurately represent watershed productivities and escapement targets. As with most models, the chinook habitat-based model is limited by the information on which it is based. In this case, the model is limited by the habitat types and watershed sizes represented among the 13 streams that were used to develop the model. However, Squamish did fall within the range of habitat types and watershed sizes represented by the 13 streams. The model is a low precision tool and the error rates from the leave-one-out analysis provide some indication of expected errors. In general, in Canadian systems the model tends to underestimate Smsy and capacity, but provides more accurate estimates of Smsy then the interim goal method (C. Parken, pers. comm., April 2004). In the case of the Squamish, such a negative bias in the interim goal would have little consequence to resource planning because current

May 2005 - 86 - 03-1417-026
Golder Associates
population levels are about an order of magnitude lower. Lastly, the model is based on natural populations and its application would be limited to watersheds where enhancements activities may have resulted in changes to chinook life history strategies, such as stream-type to ocean-type populations, as is found in the Squamish watershed (C. Parken, pers. comm., April 2004). Nevertheless, the model provides an interim estimate of chinook productivities, which can be updated as new information becomes available and as model applications are more developed.
Although the allometric model is a novel habitat-based approach to develop productive reference points for chinook salmon, the approach has just recently been accepted in draft by DFO. Until the method is finalized by DFO, the productive reference points are considered preliminary and helpful for resource planning. The interim goals are used for managing fisheries until management objectives and the context of reference points are agreed on.
8.2 Pink
Interim productive capacity for pink salmon in the Squamish River watershed cannot be determined at this time. DFO has not conducted quantitative assessments of Squamish pink salmon in recent years so accurate and reliable information on escapement, timing (migration and spawning), and biological traits is unavailable. Currently, no stock status report is available for Squamish pink salmon. The limited escapement data available for the Squamish system are based primarily on sporadic, low-precision visual estimates made by fisheries officers and hatchery staff (B. Fanos, pers. comm., October 2004). Adult pink surveys are currently conducted in some of the NVOS side-channels on the Cheakamus River and by Squamish Nation field crews as anecdotal data during their adult enumeration program. However, additional surveys are required to provide adequate data for estimating productive capacity.
8.3 Coho
A number of publications exist that have attempted to estimate juvenile smolt or adult spawner productivities based on fish numbers per length of stream. Bradford et al., (1997) in their review of coho salmon smolt productivity data from western North America streams calculated that the annual coho smolt abundance in a British Columbia stream would average 1476 coho smolts produced per kilometer of stream length. The expected 5 and 95 percent ranges of coho smolt abundance would be 435 and 3,650 smolts/km, respectively. Marshall and Britton (1990) in their review of the carrying capacity of coho streams estimated that large streams such as the Mamquam and Cheakamus rivers would produce on average 1894 coho smolts/km of accessible stream length. Marshall and Britton (1990) in their report “Optimum Spawning Density for Coho Salmon” also attempted to calculate the numbers of spawners per stream length that

May 2005 - 87 - 03-1417-026
Golder Associates
would be required to produce enough fry to fill all available habitat to capacity. They proposed that approximately 60-100 spawning coho salmon per kilometer of stream would be adequate to produce enough fry to ensure the habitat would be filled each year. Larger streams would require more spawners.
Existing juvenile smolt and adult spawner data available for the Cheakamus and Mamquam rivers can be used to determine estimated productivities using these published biostandards. Wild coho smolt productivity in the Cheakamus River was estimated to be 4700 smolts/km based on 2000 data (Melville and McCubbing 2001). Coho smolt production had increased from the 3335 smolts/km reported in a 1966 DFO study on the Cheakamus River (M. Foy, pers. comm., March 2003).Comparison to published biostandards would indicate that coho smolts in the Cheakamus are above carrying capacity of the river. Based on Marshall and Britton’s calculations the Cheakamus River would require a minimum of 100 spawners per kilometer to ensure proper seeding of available habitats. Considering Squamish Nation coho spawner estimates (Squamish Nation 2000) and Tenderfoot Creek trap counts then the total (hatchery+wild) coho spawner escapement to the Cheakamus River may be exceeding 250 spawners per kilometer. Given the level of wild coho smolt productivity measured in the Cheakamus River in the spring of 2000, a 3% smolt-adult spawner survival rate would return approximately 141 wild coho spawners per kilometer. Consequently, by comparing to published biostandards it would seem that coho populations in the Cheakamus River are above estimated carrying capacity.
Estimated coho smolt productivities for the Mamquam River watershed based on 5 kilometers of stream accessible to salmon and 28,000 wild coho salmon smolts captured leaving the Mamquam side-channel restoration project (D. Celli, pers. comm., 2001) would exceed 5,000 coho smolts/km. This estimate is more than double Bradford et al., (1997) estimate of carrying capacity of 1,470 smolt/km, and Marshall and Britton’s (1990) estimate of 1,894 smolt/km. Thus, based on published biostandards it would seem that the carrying capacity of the Mamquam River is exceeded. At a 3% smolt-adult spawner survival rate the level of wild coho smolt productivity measured in the Mamquam River in the spring of 2000 would return approximately 150 wild coho spawners per kilometer. Squamish Nation coho spawner estimates suggest that total (hatchery+wild) coho spawner escapement to the Mamquam River may be approaching 300 spawners per kilometer (Squamish Nation 2000).
While the overall estimated coho smolt and adult spawner carrying capacities are above published biostandards, most of the coho are found in constructed side-channels, such as the Mamquam Spawning Channel, and not in the Mamquam River mainstem. Consequently, exceedances of published biostandards should be interpreted with caution as habitat degradation in the mainstem as resulted in limited spawning and rearing habitat for coho. As such, the maximum carrying capacity of the overall Mamquam River

May 2005 - 88 - 03-1417-026
Golder Associates
watershed can be further improved for coho and other species through continued restoration efforts, and limited and carefully planned urban development and forestry practices. One the other hand, the information indicated the success of constructed side-channels in increasing the coho population.
8.4 Steelhead
Productive capacities for steelhead in the Cheakamus, Mamquam, and Squamish rivers are provided in the Greater Georgia Basin Steelhead Recovery Plan (GGBSRP, 2002). Habitat capacities for each watershed were arrived at following regional workshop sessions with Ministry staff. These sessions reviewed relevant inventory data, habitat maps, models, and habitat capacity trends.
It is important to have an estimate of the productive capacity of each watershed, as this is the benchmark upon which wild steelhead stock status can be consistently classified according to the Draft Provincial Steelhead Conservation Policy.
Estimated habitat capacities of returning adults (assuming 13% marine survival) as provided by GGBSRP (2002) are as follows:
• Squamish River: 1,000 to 2,000 adults; • Cheakamus River: 700 to 1,000 adults; and • Mamquam River: 100 to 200 adults.
Data are based on extensive juvenile assessments conducted since the 1980s of fry/parr habitat capacity, mean annual discharge, and stream productivity (G. Wilson, pers. comm., November 2004)
Smolt estimates have been converted to adult returns based on an ocean survival of 13% corresponding to long-term average conditions. Recent ocean survivals have been much lower according to Keogh River studies. For many systems, a marine survival of 4 to 5% is required for stocks to replace themselves. Marine survivals from the 1970s to the present have ranged considerably, from as low as 2% to as high as 26%. Current marine survivals are estimated to be below 4%. When steelhead juveniles are at abundances that use the full productive capacity of their freshwater habitat, resulting returning adults may be a poor indicator of this capacity because of variable marine conditions.

May 2005 - 89 - 03-1417-026
Golder Associates
Due to the variability associated with estimating capacity based on marine conditions, interim steelhead productive capacities are also provided based on smolt production, which reflects freshwater conditions (G. Wilson, pers. comm., November 2004).
• Squamish River: 7,700 to 15,400 steelhead smolts; • Cheakamus River: 5,400 steelhead smolts; and • Mamquam River: 1,155 to 1,540 steelhead smolts.

May 2005 - 90 - 03-1417-026
Golder Associates
9.0 INFORMATION NEEDS
9.1 Stock Status
Despite the volume of information that was gathered and compiled as a result of this recovery plan, a clear understanding of the status of salmon and steelhead stocks in the Squamish River watershed remains to be determined through additional research and studies. Many different studies have and continue to be conducted in the watershed with different objectives, methodologies, assessment locations, and time and frequency of sampling. Changes in funding sources and funding availability have dictated the level of effort and effectiveness of any given project (e.g., visual observation versus tagging study to assess adult escapement). Some studies have not been conducted frequently enough to assess trends or patterns in the data; while others have not assessed baseline conditions (e.g., prior to habitat restoration), making future comparisons difficult.
Interim productive capacities provided in this recovery plan are based on limited data. The habitat model used to estimate chinook productive capacity assumes a stream-type life cycle, and cannot accommodate an ocean-type life cycle. However, data collected between 1978 and 1981 indicate a shift to ocean-type for Squamish chinook as a result of the introduction of cultured fish. Consequently, the productive capacity generated by this model for Squamish chinook will underestimate the capacity by the proportion of the population that exhibits the ocean-type life history.
Identified Information Needs:
• Develop detailed assessment frameworks that explicitly address recovery objectives, targets and strategies.
• Re-evaluate existing enumeration methodologies to obtain more robust data so that linkages between adult and juvenile data can be made with more confidence.
• Consider the development of new assessment programs or the application of new methodologies.
To address these needs a number of different initiatives could be considered. For example, the existing Squamish Nation/DFO coho and chinook spawner enumeration program could be re-evaluated to produce escapements of a higher level of confidence. Conversely, previous experience has proven that escapement estimation in the Squamish system is challenging, especially for species such as chinook salmon utilize mainstem or turbid habitats. The use of new technologies such as the Didson hydroacoustic counter, therefore, should also be considered. Existing juvenile and/or smolt outmigration studies on the Cheakamus River, Mamquam River side-channels, and on Meighn Creek should

May 2005 - 91 - 03-1417-026
Golder Associates
be evaluated for their utility; they may need to be linked to adult surveys, or entirely new studies may be required (e.g., an indicator system located in the lower watershed or lower Squamish River smolt trap) for a more comprehensive and complete assessment of stock status. Tenderfoot Hatchery data should also be included in this assessment, and re-assessment of fish culture practices should be considered to promote the recovery of wild populations. Where uncertainty exists, the hatchery releases should be used to test alternative hypothesis by varying stocking practices using experimental protocols. Without a more complete assessment of salmon stock status than currently exists, assessing recovery of salmonids in the watershed will be difficult.
9.2 Marine Survival
Marine survival of chinook, coho and steelhead populations has declined significantly since the early 1990s. Limited data are available to accurately assess ocean survival rates due to the complexity of the issue and the associated costs. Marine survival information is not currently available for chum and pink salmon.
The Keogh River system has been studied for decades, and sufficient data have been generated on steelhead stocks to estimate marine survival for these species. Historical marine survival rates for steelhead have been approximately 13%, whereas recent rates have ranged from 4 to 5% based on Keogh River studies (Ward 2000; Welch et al., 2000). The range of survival observed has been 2.3 to 26%. MWLAP has conducted more studies on the Keogh River using an array of acoustic receivers to investigate smolt and adult return migrations (GGBSRP 2002; Welch et al., 2000). While the Keogh River data provide a means of assessing stock status for this system, stocks in other watersheds may behave differently (e.g., different smolts outmigration patterns, winter vs. summer run, different habitats), and thus, marine survivals as determined in the Keogh River may not adequately represent the marine survivals in other systems or for other salmon species.
Identified Information Needs:
• Assess site-specific marine survival in different areas of coastal B.C.; consider use of index systems.
The Pacific Salmon Endowment Fund (PSEF) is sponsoring proposals to address the marine survival question. This initiative commenced in July 2001 and studies are underway. Preliminary studies have been conducted using Cheakamus River coho smolts to assess marine survival of Squamish stocks. A preliminary marine tracking study indicated that at least 25% of coho leaving the Cheakamus River survived to leave Howe Sound (Welch, 2004). However, data are preliminary and do not provide marine survival information at this time. Welch (2004) concluded that mortality of salmon occurs

May 2005 - 92 - 03-1417-026
Golder Associates
throughout the freshwater and marine systems, and is not necessarily linked to past assumptions that loss of freshwater habitat and difficulties of smolts to adjust to saltwater conditions were primarily responsible for poor stock status. Further research on marine tracking and survival of coho in the Strait of Georgia will be conducted in the next few years.
9.3 Freshwater Habitat Condition
9.3.1 Habitat Restoration
Habitat restoration initiatives have been conducted in the watershed for the last two decades. These initiatives have largely focused on restoring overwintering, rearing, and spawning habitat primarily for coho and chum, although recently a more directed effort has been made on improving chinook, pink, and steelhead habitat. While these initiatives have been largely successful at increasing habitat, observed as an overall increase in escapement numbers and use by juvenile salmonid, the information available is qualitative and general in nature. Furthermore, the current rate of land development and growth within the Squamish River watershed will further threaten existing key habitat.
Identified Information Needs:
• Identification of critical and valuable habitat.
• Development, implementation and enforcement of habitat protection measures.
To address the information needs, a true assessment of freshwater habitat condition is required, and could perhaps be accomplished by determining the productivity of restored versus unimpacted reaches. A comparison of productivity between these sites would help to assess whether the recovery goals have been reached. Measurement of lower trophic levels, such as benthic invertebrate populations, or physical habitat features (e.g., frequency of LWD) are good indicators of productivity and could be measured and compared to assess changes in productivity over time.
9.3.2 Watershed Processes
Habitat productivity is also influenced by watershed processes such as sedimentation, slope stability/erosion, and hydrology. These processes are affected by forest harvest practices and land development. Negative impacts to fish habitat include: loss of floodplain habitat, isolation of side- and off-channel habitat, channel aggradation and subsurface flows, loss of LWD, and poor water quality and quantity.

May 2005 - 93 - 03-1417-026
Golder Associates
Identified Information Needs:
• Development and implementation of measures to monitor the recovery of watershed processes.
Annual assessments of aerial photos to evaluate such characteristics as road deactivation, percent vegetative cover, riparian areas, and number of landslides should be considered. In addition, the potential for future forest harvesting and land development plans on the recovery of these watershed processes and on habitat conditions should be assessed.
9.3.3 Squamish Estuary
Only about 50% of the historic Squamish estuary remains accessible to juvenile salmonids and other fishes. Losses of tidally influenced sloughs and channels have been particularly acute as the community of Squamish has erected dykes over the years to protect against flooding (SEMP 1999). Although the remaining estuary has been divided into commercial, industrial, and ecologically protected areas, it is likely that habitat conditions for salmonids in the estuary may continue to decline over time as the waterfront and port are developed.
Identified Information Needs:
• Protection and enhancement of the estuary are critical.
• Designation and protection of critical habitat should be incorporated into the District of Squamish OCP.
• Future assessments should focus on gaining a better understanding of salmon status and rearing habitat use in the estuary, particularly by chinook smolts.
9.4 Climate Conditions
It is anticipated that climate change, a phenomenon influencing ecosystems on a global basis, will have a significant effect on Canadian salmon populations. Climate change will most likely impact the physical ocean and river habitat resulting in increased marine and freshwater temperatures, changes in marine stratification and estuary salinity, altered river flow patterns, and increased scouring and sedimentation of spawning habitat (Irvine, 2004). It is anticipated that while inhabiting the marine environment, salmon will be impacted by changes in the food chain, increased competition due to decreasing food availability and increasing numbers of warmer water competitors, and increased predation due to warm water predators migrating further north. Increased flow rates may delay and/or retard upstream migration, and increases in scouring and sedimentation of spawning gravels thus reducing egg survivorship (Irvine 2004). It is believed that

May 2005 - 94 - 03-1417-026
Golder Associates
southern populations will be most greatly affected. Included within these are four endangered populations: Inner Bay of Fundy Atlantic salmon (Salmo salar), Sakinaw Lake and Cultus Lake sockeye salmon, and interior Fraser River coho salmon (Irvine 2004).
Between 1970 and 1990 a natural increase in the ocean surface water temperature occurred providing a temporary window into the effects of global warming. During this time nearly all Canadian salmon populations showed a decline, with the aforementioned four species showing the most drastic changes (Irvine 2004).
Identified Information Needs:
• Better understanding of effects of climate change on salmonid populations.
• Effects of climate change incorporated into recovery plan.
Climate Impacts and Adaptation Research Network (CIARN) is being established worldwide to provide a network for researchers, the public, and stakeholders to share climate change information. C-CIARN, the Canadian chapter of CIARN, is establishing national, provincial, and sector offices across the country to aid in the liaison between researcher and sector leaders to better understand the impacts of climate change (c-ciarn). A better understanding of the effects of climate change on salmonid populations, and adaptation of fisheries management practices will be essential to the future survival and recovery of salmon populations in the Squamish Watershed.

May 2005 - 95 - 03-1417-026
Golder Associates
10.0 PROGNOSIS FOR A RECOVERY PLAN
Based on the information collected and presented in this recovery plan, it is evident that steelhead stocks are in decline. Although pink stocks showed record escapements in 2003 relative to recent years, they are likely an order of magnitude or more less abundant than historic levels. The stock continues to be impacted by development in the watershed, particularly as a result of the B.C. Hydro dam in the Cheakamus River. The effects of the record October 2003 flood on pink salmon recovery have yet to be measured. However, early data from the Cheakamus River B.C. Hydro study indicate that the impact on egg to fry is severe (M. Foy, pers. comm., August 2004). Chinook stocks remain below historical escapements despite habitat restoration and enhancement efforts over the last twenty years. Increasing chinook harvest rates will continue to negatively impact already low chinook stocks. Coho stocks also remain below historical escapements, but have shown an increasing trend since the fishery closures in 1997. Recent studies conducted in select Squamish systems have shown that constructed side-channel habitat successfully supports juvenile coho, and that densities have exceeded existing published biostandards for coho smolt per km of streams along the Pacific coast (Foy and Gidora 2002; Melville and McCubbing 2003). Recovery efforts will focus on chinook and pink salmon, steelhead, and on coho salmon populations, particularly within the developed portion of the watershed, which are expected to suffer further declines due to land development. The recovery of these species will be influenced by biological, physical, and socio-economic constraints present in the watershed.
In addition to obtaining a better understanding of stock status through the implementation of new studies refining existing studies, successful recovery of salmon and steelhead stocks in the watershed will depend on community support and effective management of land development and growth activities with respect to protection of salmon and steelhead stocks and habitat.
Finally, the recovery plan will also need to consider, acknowledge, describe, and estimate the level of uncertainty associated with the data on which decisions about salmon populations are made. Decisions are often made based on a lack of data and understanding of salmon stock and habitat status, watershed processes, and associated human impacts. Recognizing where uncertainty exists (e.g., more data, additional expert opinion) helps to identify where additional resources should be focused. Recognition and understanding of these uncertainties provides a better understanding of the predictions based on limited information. These predictions and their accuracy can then be modified as new information becomes available. Given the wide range and somewhat limited data in terms of understanding stock status in the Squamish River watershed, an adaptive management approach whereby the recovery plan is updated on a regular basis based on new data and information and the subsequent re-evaluation of recovery strategies, goals and objectives is essential.

May 2005 - 96 - 03-1417-026
Golder Associates
10.1 Biological Factors Influencing Recovery
In general, Squamish River watershed salmon and steelhead adult abundances, as in other watersheds, are limited by poor marine survival and poor juvenile production because of degraded freshwater/estuarine habitat. Assessing marine survival of Squamish stocks is currently underway but is costly and labour intensive. Uncertainties regarding the status of populations, a result of inadequate assessments, in conjunction with uncertainty in the productive capacity of the populations can lead to decisions in the regulation of fisheries that will impair the recovery of Squamish stocks.
In general, habitat limitations observed in the Squamish River watershed include: the loss of: LWD, side-channels, off-channels, habitat complexity, adequate water quality and quantity, functional floodplains, riparian vegetation, gravel recruitment, nutrients, and instream cover. Freshwater habitat conditions can be improved by protecting existing critical habitat and by continued restoration and rehabilitation efforts.
In addition to habitat impacts as a result of anthropogenic sources, portions of the Squamish watershed are limited by the natural biological factors such as low productivity (e.g., low temperatures, high turbidity due to glacial silt in some systems). Low nutrients, and subsequent low productivity are characteristic of most of the rivers and creeks in the Squamish River watershed; some noteworthy exceptions are Cheakamus River and Brohm, Shop, Mashiter, and Shovelnose creeks, which have higher nutrient levels than the other systems as a result of geology. Otherwise, low productivity is exacerbated by the significant decrease in salmon carcasses from historic levels. Consequently, nutrient enhancement may need to be considered in some systems to accelerate recovery.
The Squamish Estuary provides habitat for a wide variety of fish and wildlife. The estuary provides critical feeding habitat for salmon and steelhead smolt prior to their migration out to sea. For salmonid species that do not overwinter in freshwater habitat, estuarine habitat becomes more critical. As previously stated, Squamish chinook were thought to be dominated by stream-type fish prior to returns of cultured fish. A study conducted in the late 1980s suggested that chinook salmon are dominated by ocean-type fish following enhancement (Schubert 1993). If this is indeed the case, then the Squamish estuary will play a key role in their survival at sea and their subsequent return as adults to spawn. The life cycle of ocean-type Squamish chinook will have been significantly impacted by the loss of estuarine habitat in Squamish as a result of urbanization. Consequently, efforts to enhance freshwater habitat for chinook would only have limited success in recovering the chinook stocks in Squamish unless co-incident efforts are made to recover and enhance estuarine rearing habitats.

May 2005 - 97 - 03-1417-026
Golder Associates
10.2 Physical Factors Influencing Recovery
Physical factors that may influence the recovery of salmon and steelhead stocks in the Squamish River watershed include:
• low productivity of the systems (low temperatures and high turbidity); • unstable stream channels and surrounding terrain; • high levels of natural sedimentation as a result of unstable terrain; • unstable and degraded floodplain habitat; and • frequent flood events.
These naturally occurring physical factors have been exacerbated by historical and hillslope logging activities, compounding the impacts on the aquatic environment.
The impacts to salmonid habitats as a result of these physical factors include the loss of riparian vegetation, sediment inputs, flooding, reduced flows, aggradation of channel, and loss of habitat complexity and bank stability. While poor marine survival and loss of freshwater habitat have contributed to the decline in salmon and steelhead stocks, these physical limitations will affect the recovery of the stocks. Consequently, recovery initiatives must consider these constraints when setting objectives and targets. Future recovery efforts should focus on watershed/slope stabilization activities.
10.3 Socio-economic Factors Influencing Recovery
The Squamish River watershed and the entire Sea to Sky corridor are undergoing tremendous land development pressures. In addition to the 2010 Olympics and associated development, its proximity to Vancouver and comparatively lower housing costs has made Squamish an attractive location for Lower Mainland residents. Furthermore, the time required for travel to and from Squamish will be reduced once the highway upgrade is completed, making it even more accessible. With the continuing population growth of the Lower Mainland, more and more people will seek residence in Squamish.
The anticipated volume of land development opportunities in the Squamish area has the potential to further degrade salmonid habitat and adversely affect the salmonid populations, as well as impede attempts at recovering the salmonid stocks. Almost all the impacts from land development for human habitation will fall on the small streams and floodplains of the lower watershed, which are primarily inhabited by coho and chum salmon and cutthroat trout. In fact, development of the new golf course in Squamish has had adverse impacts on coho habitat in Meighan Creek. Further proposed development in the Meighan Creek watershed has the potential to adversely impact wetland and fish habitat. Potential impacts of B.C. Hydro’s new flow regime under the WUP on Cheakamus River fisheries resources (particularly pink salmon) remain to be determined.

May 2005 - 98 - 03-1417-026
Golder Associates
IPP impacts will be largely felt on streams used by chinook and pink salmon, steelhead, and to a lesser degree by coho. Forestry will also continue to impact many streams in the watershed. Consequently, strategies must be implemented to protect and restore areas of habitat degradation. Federal and provincial fisheries managers need to maintain sufficient resources so as to adequately fulfill their regulatory monitoring and planning responsibilities. For example, DFO “No Net Loss” policy should be diligently enforced so as not to lose existing valuable habitat. In addition, the District of Squamish should consider incorporating areas of “valued” habitat or areas of special concern or protected areas into their OCP to ensure future protection against impacts and pressures of land development. It is the intent that habitat protection along streams will also be conducted under the new Riparian Area Regulation under the B.C. Fish Protection Act. The recovery plan concepts must also be accepted by the Squamish-Lillooet Regional District. Most importantly, however, the community of Squamish must buy into and take ownership of the recovery plan in order for it to be successful. The key to obtaining community buy-in and support will be through education of the public on the importance of the fisheries resource, its contributions to society, and steps to protection of key habitat.

May 2005 - 99 - 03-1417-026
Golder Associates
11.0 RECOVERY PLAN OBJECTIVES, TARGETS, AND STRATEGIES
Recovery objectives are focused on chinook and pink salmon, and steelhead, in keeping with the original scope of the recovery plan as set out by PSF. However, recognizing the importance of coho in the watershed and the potential for further impacts to the population through land development and urban growth, recovery objectives, targets and strategies for coho have also been provided. Recovery objectives, targets, and strategies, provided herein were based on the PSEF principles, expertise provided by the TAC, the DFO’s Draft Wild Salmon Policy (DFO 2004), the Draft Provincial Steelhead Stream Classification Policy (MWLAP 2004), guidelines provided by other recovery plans in B.C. (e.g., Cultus Sockeye, Sakinaw sockeye, Nimpkish Watershed, Englishman Watershed), and Washington/Oregon salmon recovery plans developed under the US Endangered Species Act (NOAA 2003).
Based on existing information, an understanding of stock status, critical habitat, specific or key limiting factors, and productivity in the Squamish watershed is lacking. As such, objectives, targets, and strategies provided by the Squamish Salmon Recovery Plan are focused on gathering additional information to provide a better understanding of salmonids in the watershed. More specific objectives and targets will be developed once new information becomes available and through additional community workshops.
Recovery objectives, targets, and strategies for salmon populations, habitat, watershed processes, community stewardship, and stock management are provided below. For the purposes of this report, the following definitions for recovery objectives, targets, and strategies based on MWLAP’s Watershed-Based Fish Sustainability Planning document were used:
• Recovery Objectives – “what the Recovery Team/community wants to achieve”;
• Recovery Targets – “how to tell if the Recovery Team/community have achieved their objectives”; and
• Recovery Strategies – “how the Recovery Team/community will achieve these objectives”.
11.1 Salmon Population Objectives, Targets, and Strategies
In order for the salmon populations to recover there needs to be a means of monitoring or predicting how many adult salmon return to the watershed each year and how many salmon are needed for spawning in order to maintain a sustainable population over the long term. A major focus to achieve salmon population recovery will involve developing assessment strategies that are responsive to existing monitoring information regarding

May 2005 - 100 - 03-1417-026
Golder Associates
salmon population trends within the watershed. The first task will be to develop a decision framework which will describe the type of information required to provide advice on salmon recovery, describe a means of acquiring the information, and describe procedures that will be used to generate advice from the information gathered. Subsequently, the potential use and applicability of indicators of salmon abundance recognizing that enumeration data will be limited and imperfect could be considered. Defensible target and limit levels of abundance by species will need to be set to guide salmon management actions in the watershed.
Future studies should consider an indicator system approach and linking adult-smolt outmigration rates in at least the indicator system.
This section provides population recovery objectives, targets, and strategies for chinook, pink and coho salmon, and steelhead trout.
11.1.1 Salmon Population Objectives
General population objectives for Squamish River watershed salmon include:
• Enough spawners return each year to the watershed to sustain salmonid populations in future years.
• Maintain healthy, wild origin spawning populations within the watershed.
11.1.2 Salmon Population Targets
Chinook Salmon
• On an annual basis, meet or exceed the interim habitat-based escapement goals for wild chinook salmon spawning in key areas.
• Adopt a long-term system-wide escapement target of 5,000 chinook as determined by the habitat-based productive capacity model (Section 8.1.1). Because current abundances are well below that level, planners should attempt to achieve cycle-over-cycle growth of the spawning population.
• Increase the proportion of natural origin to hatchery origin chinook salmon in key spawning populations and in the total escapement on a cycle-over-cycle basis.
Coho Salmon
• On an annual basis, meet or exceed the interim habitat-based escapement goals for wild coho salmon spawning in key areas.

May 2005 - 101 - 03-1417-026
Golder Associates
• Increase the proportion of natural origin to hatchery origin coho salmon in key spawning populations and in the total escapement on a cycle-over-cycle basis.
• Identify prime rearing habitat and maintain production at 1,476 smolts/km (Bradford et al., 1997), or at historic productivity levels when known.
Pink Salmon
• Set interim habitat-based escapement and fry production goals.
• On an annual basis, meet or exceed the interim habitat-based escapement and fry production goals for wild pink salmon spawning in key areas. Because current abundances are well below historic levels, planners should attempt to achieve cycle over cycle growth of the spawning population.
Steelhead
• Recover steelhead stocks to the Routine Management Zone (stocks at least 30% of habitat capacity).
• Based on productive capacities provided in Section 8.4, interim targets for steelhead should be:
o Cheakamus River: 700 to 1,000 adults; 5,400 smolts;
o Squamish River: 1,000 to 2,000 adults; 7,700 to 15,400 smolts;
o Mamquam River: 100 to 200 adults; 1,155 to 1,540 smolts.
11.1.3 Salmon Population Strategies
Salmon population strategies in support of the objectives listed above for chinook, coho, and pink salmon, and steelhead are:
• Develop an assessment framework and monitoring plan for adult spawner populations and key juvenile populations that will permit the accurate characterization of the status of each species. Such frameworks and plans will reflect the unique characteristics of each species and will vary by species.
• Monitor the proportion of hatchery and wild salmon in the spawning population of each species.
• Monitor catch and effort in Howe Sound and Squamish system fisheries, including catch and release by species, hatchery incidence.

May 2005 - 102 - 03-1417-026
Golder Associates
• Establish target and limit reference points, including population sizes for each species.
• Develop interim population goals based on system-wide estimates of habitat carrying capacity;
• Develop co-operative monitoring program for steelhead in entire watershed.
• Conduct juvenile steelhead assessments in recently created side-channels to check their effectiveness in producing steelhead.
11.2 Salmon Habitat Objectives, Targets, and Strategies
Without healthy and abundant habitat, wild salmon populations within the watershed will disappear. The application of the federal Fisheries Act guided by the Policy for the Management of Fish Habitat requires a no net loss of habitat as a result of future development within the watershed. This policy directs DFO to work toward a net gain of habitat over the long term. In the Squamish River watershed, past development has both alienated and degraded previously productive salmon habitat. Strategies should be developed that will both conserve and restore salmon habitat within the Squamish River watershed. The strategies for the protection and conservation of existing salmon habitats should focus on preventing future damage. Unfortunately some lost habitats will not be reclaimed in the future and some habitats will only return to productivity over long time periods (50 to 100 years). Strategies for the restoration and creation of salmon habitat should focus on identification and protection of critical habitat, accelerating the recovery of productivity in damaged habitats and the creation of habitat to replace that lost to past development. These actions should promote the net gain of salmon habitat and ultimately the long-term recovery of salmon populations within the watershed.
Habitat protection relies mainly on the laws and guidelines associated with development of land, water and air resources and how these laws are enforced. A thorough understanding of legal intricacies and possibilities associated with federal, provincial and municipal law and guidelines is an important strategy required to successfully achieve protection and recovery of habitat.
This section provides habitat recovery objectives, targets, and strategies for chinook, pink, and coho salmon, and steelhead trout. As habitat preferences differ between species, habitat objectives, targets, and strategies are provided for each target species.

May 2005 - 103 - 03-1417-026
Golder Associates
11.2.1 Salmon Habitat Objectives
All Species
• Review, understand and effectively apply existing federal, provincial and municipal laws and guidelines to protect and recover critical habitat.
Chinook Salmon
• Protect, restore, and enhance critical habitats such as key spawning areas, lateral log jams along large rivers, side-channels of larger rivers, and inter-tidal marsh and tidal channels within the Squamish River estuary.
Coho Salmon
• Protect, restore, and enhance critical habitats such as small streams, lateral log jams along large rivers, riparian and off-channel habitats.
Pink Salmon
• Protect, restore, and enhance critical habitats, key spawning areas for this species of salmon.
Steelhead
• Protect, restore, and enhance critical habitats such as key spawning areas, lateral log jams in large rivers, and side-channels of large rivers.
11.2.2 Salmon Habitat Targets
The following section provides habitat recovery targets in support of objectives and strategies for chinook, coho, and pink salmon, and steelhead.
Chinook Salmon
• Key spawning areas documented, protected, and functioning at levels consistent with historic condition or at average productivity as per literature. Damaged spawning areas are rehabilitated where practicable.
• Lateral log jams protected and numbers increase over time.
• The length of tidal channel habitat and area of inter-tidal marsh increases over time to a level that restores historic conditions as much as practical.

May 2005 - 104 - 03-1417-026
Golder Associates
• Document use of tidal channels and marsh habitat by juvenile chinook. Usage increases over time.
Coho Salmon
• Key small streams important to coho salmon protected and functioning at levels consistent with historic condition or at average productivity as per literature (e.g., 1,476 smolts/km, Bradford et al., 1997).
• Lateral log jams protected and numbers increase over time.
• Loss of existing off channel habitat is arrested with a net increase in restored off-channel. All sites practical for rehabilitation are developed over time.
Pink Salmon
• Key spawning areas documented, protected, and functioning at levels consistent with historic condition, or at average productivity as per literature. Damaged spawning areas are rehabilitated where practicable.
Steelhead
• Key habitat is protected and functioning at levels consistent with historic conditions or estimated productive capacities.
• Lateral log jams protected and numbers increase over time.
11.2.3 Salmon Habitat Strategies
In order to protect existing habitat and to maximize the potential for recovery of salmon in the watershed, the following habitat strategies should be considered:
Chinook Salmon
• Key spawning areas need to be identified, mapped, and protected from adjacent land and water use activities. Where practical, these spawning areas should be restored or enhanced. Spawning chinook salmon within the Squamish River watershed often are found disproportionately in distinct areas associated with the lower reaches of clear water streams that flow into the larger glacial rivers and in the side-channels associated with the larger glacial rivers (M. Foy, pers. comm., March 2003).

May 2005 - 105 - 03-1417-026
Golder Associates
• Protect existing lateral log jams and take the necessary actions to increase frequency of this habitat type. Stable side-channel habitat should be rehabilitated where practical. Juvenile chinook salmon appear to rear along the margins and side channels of the larger tributary streams and the Squamish River (M. Foy, pers. comm., March 2003). These fish often are associated with the complex habitat that forms around and within log jams.
• Protect all existing estuary areas not slated for industrial development. Monitor to confirm chinook juvenile use of inter-tidal habitats to identify access and suitability issues. Chinook salmon are the salmon species most critically dependent on estuary habitat for a portion of their early life history. The Squamish River estuary has suffered significant losses of tidal channel and marsh habitat from past development and will suffer further losses (SEMP 1999).
Coho Salmon
• Identify and protect small streams supporting coho salmon. Many of the small streams supporting coho salmon within the District of Squamish boundaries were identified in the “Sensitive Fish Habitat Atlas” last updated in 1999.
• Protect existing lateral log jams and increase frequency of this habitat type along margins of larger streams where practical.
• Protect existing off-channel habitats and pursue practical opportunities to restore, enhance, and create off-channel habitat. Ensure existing or restored off-channel habitat remain productive, consistent with levels identified (e.g., 0.5 s/m2) in the Watershed Restoration Rehabilitation Circular No.9 (MELP and MoF 1996).
Pink Salmon
• Critical refuge areas for pink salmon need to be identified, mapped and protected from land and water use activities and restored or enhanced as required. Pink salmon spawning occurs throughout the Squamish River watershed but is often confined to distinct areas when populations are low. Often these areas are associated with clear water streams that flow into the larger glacial rivers and in the side-channels associated with the larger rivers and are generally shared with spawning chinook salmon. These areas may provide critical refuges for pink salmon populations during periods of adverse freshwater survival. Without these critical refuge areas pink salmon populations appear to collapse to low levels for long time periods when freshwater survivals are reduced (M. Foy, pers. comm., March 2003).

May 2005 - 106 - 03-1417-026
Golder Associates
Steelhead
• Identify and protect key Squamish River spawning and rearing areas.
• Identify and proceed with mainstem and off-channel stream restoration opportunities.
11.3 Watershed Process Objectives, Targets, and Strategies
Watershed processes, such as sediment supply, gravel and wood recruitment to rivers create and sustain fish habitat over time. Consequently, recovery of salmon populations must also consider the restoration of watershed processes. A current understanding of historical and present conditions of a watershed can improve the effectiveness of recovery planning, implementation, and monitoring of ecosystem functions (Beechie et al., 2003). Beechie et al. (2003) suggest that restoring and protecting watershed processes that create stream habitat leads to a higher success rate of salmon recovery because it focuses on the natural potential of each watershed, and is therefore more likely to restore diversity and abundance of stocks.
The level of sediment delivery should be minimized so as not to further impact fish habitat. Although the watershed is a natural contributor of sediment due to its unstable volcanic nature and glacial influence, additional inputs of sediment should be minimized or prevented altogether. Urban development and forestry have been the main contributors to increased sedimentation in the watershed. While forest harvest practices have declined in the watershed, impacts will be felt for some time, and land development will continue to be a threat to fish habitat and increased sedimentation events. In contrast, gravel recruitment in the Cheakamus River has been limited by the BC Hydro dam, and thus, gravel recruitment in this system needs to be facilitated to improve habitat conditions.
Maintain or improve current hydrological characteristics that are supportive of quality fish habitat. The hydrological conditions on which fish depend affect water quality and quantity, and channel conditions. Changes in water flows as a result of logging, dams, and dyking have resulted in the loss of floodplain habitat and subsequent braiding of the streams. As a result, streams have become channelized and refuge habitat in the form of side-channels and off-channels has been lost.
11.3.1 Watershed Process Objectives
General objectives for the recovery of the watershed are:
• Stabilize impacted watersheds.
• Reduce/minimize sedimentation; enhance/facilitate gravel recruitment.

May 2005 - 107 - 03-1417-026
Golder Associates
• Restore floodplain habitat.
11.3.2 Watershed Process Targets
The following section provides watershed process targets in support of objectives and strategies for the Squamish River watershed.
• Increase log jam frequency, size of riparian buffer and/or the number of landslides that have been stabilized over time or approaching historical conditions. Comparison between historical, current and future habitat conditions (e.g., aerial photos, habitat model) to assess potential productivities of salmon populations and effectiveness of recovery initiatives.
• Determine and monitor watershed conditions on a regular basis to assess recovery of watershed processes. Annual monitoring of watershed conditions, e.g., barrier inventories, erosion inventories, floodplain and riparian characterization, channel and valley type classification, flow reduction or peak flow increase inventories, water quality inventories, and biological indicator inventories.
• Increase in the number of protected upstream areas over time.
11.3.3 Watershed Process Strategies
The following section provides watershed process strategies in support of objectives for the Squamish River watershed.
• Curtail forest harvesting sediment impacts.
• Maintain riparian areas.
• Protect upstream areas (such as Brohm Ridge) to minimize problems.
• Monitor potential impacts of sedimentation should be monitored.
• Determine threshold of sedimentation events in terms of negatively impacting fish habitat should be determined for each sub-basin.
• Protect and stabilize landslides/slopes.

May 2005 - 108 - 03-1417-026
Golder Associates
11.4 Community/Stewardship Objectives, Targets, and Strategies
Public involvement and stewardship activities relating to stream protection, stream signage, habitat restoration, and enhancement projects foster a sense of stream ownership amongst members of the public. Local residents must be educated on the value of these habitats to salmon so they can be effective advocates for responsible development to their elected local government officials. An informed and empowered citizenry can contribute to the public debate on important land use decisions that will affect fish and fish habitat in the watershed.
According to Squamish Nation oral history salmon have provided benefits to the human communities within the Squamish River watershed since Kos, the Chief of the Spring Salmon, first sent his children across the ocean to visit the people that lived on the land, under the shadow of the mountain many residents know today as the Squamish Chief.
Salmon are also keystone species in both terrestrial and aquatic ecosystems in the watershed. The benefits that salmon provide today to the watershed are substantial. Proper protection of this ecological, economic, and social resource will ensure its value to the generations yet to come. The concept of sustainability should include use of the salmon resources such that they provide food, economic, social, and ecological benefits now and in the future. The objective will be to develop strategies that will preserve and enhance the value of the salmon resource to both the human and natural communities in the watershed.
11.4.1 Community/Stewardship Objectives
The community/stewardship recovery objective is to:
• Improve public knowledge, enjoyment, and support for the salmon resources found within the Squamish River watershed.
11.4.2 Community/Stewardship Recovery Targets
Cultural/Community/stewardship targets are:
• Stable or increased community understanding of the importance of protecting and recovering salmonid populations, and involvement and participation of public in salmonid initiatives.
• Increase the number of educational signs posted at key Squamish Nation cultural sites.

May 2005 - 109 - 03-1417-026
Golder Associates
• Increase media attention focused on protection and recovery of salmonids.
• Solicit input from community to assess whether salmon recovery is being achieved. Conduct annual surveys targeted at community members and determine level of knowledge, interest of participants, and perception of whether recovery is being achieved.
• Increase in the number of environmental protection bylaws (e.g., aquatic streamside protection, tree preservation).
11.4.3 Community/Stewardship Strategies
Cultural/Community/Stewardship strategies are:
• Cultural strategy: protect Squamish Nation cultural values based on Pacific salmon.
• Stewardship strategy: Improve public knowledge, enjoyment, and support for the salmon resources found within the Squamish River watershed.
• Community strategy: Focus on involvement of community members in salmon initiatives.
• Community Strategy: Community involvement in the development and participation of public events and media reports relating to salmon and watershed issues.
• Community Strategy: development and implementation of environmental protection bylaws at the municipal level.
11.5 Fisheries Management Objectives, Targets, and Strategies
There are cultural, recreational and commercial pressures on the fishery in the Squamish watershed. Squamish stocks of all species are harvested in mixed-stock commercial fisheries. In the past, restrictions have been placed on the in-river and marine recreational fisheries and the commercial fishery. Native catch allocation of salmon is discussed on an annual basis between the Squamish Nation and DFO. Since 1996, annual salmon spawner surveys have been conducted to assist with determining fishing restrictions. However, existing enumeration programs are based on visual observations once the fish have entered their spawning grounds. Consequently, these assessments do not allow for timely decision-making processes on catch limits. Any observed increases in previous years’ escapements do not necessarily provide confidence in predicting catch limits for the next year given the unpredictability of marine survival rates and uncertainty of the composition of catch from mixed fisheries. Test fisheries in Howe Sound have been tried

May 2005 - 110 - 03-1417-026
Golder Associates
in the past but with limited success. The Squamish Nation, DFO, and MWLAP managers, recreational anglers and the community should continue to collaborate in order to address this issue and be able to manage the fisheries more effectively.
11.5.1 Fisheries Management Objectives
Fisheries management objective is:
• Recovery of salmon to levels that allow adequate allocation to Native fishers and recreational anglers without impacts to the salmonid population objectives.
11.5.2 Fisheries Management Targets
Fisheries management targets are:
• Promote sustainable terminal fisheries by achieving population and habitat recovery goals and ensuring an appropriate balance in the allocation of harvestable surpluses between marine and terminal fisheries.
• Increase enforcement of fishing and forestry regulations.
• In the Mamquam River, support a catch and release steelhead fishery with 400 rod-days.
• In the Cheakamus River, provide minimal-impact steelhead angling opportunities for about 3000 angler days per annum, when and where possible.
11.5.3 Fisheries Management Strategies
Fisheries management strategy is:
• Improve and link monitoring of adult escapements, smolts production, catch, and hatchery releases to provide a better understanding of stock status and management practices.

May 2005 - 111 - 03-1417-026
Golder Associates
12.0 MONITORING AND EVALUATION OF RECOVERY PLAN
12.1 Monitoring Stock Recovery
Monitoring/assessment of salmon recovery will be key to achieving recovery objectives, targets, and strategies. The level of effective monitoring is a topic of discussion in many other watersheds faced with limited and poor quality fisheries data. In fact, the Nimpkish Resource Management Board developed an expert advisory team to discuss monitoring strategies. Initial thoughts on effective monitoring strategies were provided by D. McCorquodale (pers. comm., May 2004). In summary, the goal of every recovery team should be to set realistic goals that can be achieved within available funds. Consequently, the monitoring strategy should achieve a high level of effectiveness at low cost and provide data that are consistent with the level of risk to the viability of these populations that fisheries managers are willing to accept. Monitoring costs are controlled primarily by the method, frequency, and intensity of monitoring. The key will be to consider available technologies and to define the frequency and intensity of monitoring within the context of existing enumeration, habitat, and stewardship initiatives underway in the Squamish River watershed.
Monitoring salmon recovery should consist of: 1) stock and habitat assessments (i.e., establishing trends in stocks and habitat condition); 2) establishing habitat-based population goals; 3) monitoring performance of recovery efforts against those goals; and 4) research to improve techniques or approaches to recovery and recovery evaluation (e.g., marine survival) (PSF 2004).
Some recommendations for monitoring are listed below.
12.1.1 Stock Assessment
A number of different stock assessment initiatives are currently underway in the Squamish River watershed. These include the annual adult salmon escapement surveys conducted by the Squamish Nation and DFO, adult steelhead escapements and juvenile emigration studies conducted in the Cheakamus River under B.C. Hydro’s Water Use Plan, adult (Mamquam) and juvenile steelhead assessment by the GGBSRP throughout the Squamish watershed, stock assessment conducted by DFO and streamkeepers in various urban streams (i.e., Meighn, Mamquam spawning channel), and data recorded by the Tenderfoot Hatchery. To date these initiatives have not been coordinated and data collected have not been integrated to provide an overview of status of salmon stocks in the watershed. An assessment is required to determine which of these programs are effective and have realistic goals that can be achieved within available funds. The integration of the most effective projects could then be considered and potentially produce cost savings that could be reallocated to other high priority projects. It is clear,

May 2005 - 112 - 03-1417-026
Golder Associates
however, that current assessments are inadequate to determine the status of any of the species and that significant improvements will be required.
12.1.2 Cheakamus River WUP monitoring
Some suggestions for monitoring were provided under the Cheakamus WUP process and included the monitoring of salmonid spawning and juvenile production, groundwater levels and fish production in groundwater-fed side channels in the Cheakamus River, stranding of juvenile fish in the Squamish River; riparian vegetation and channel morphology, and benthos, periphyton, and nutrients (ESSA 2002). The monitoring plan should also include the monitoring of Squamish Nation heritage sites and cultural values, as well as the influence of flow and other factors on recreational users.
12.1.3 Habitat Restoration
Habitat restoration initiatives have been conducted since the 1980s. While a number of monitoring studies have been conducted to assess the fish use of these habitat structures, a lack of baseline information exists for comparison of before and after habitat restoration. Continued and improved monitoring of restored, protected and rehabilitated habitat should be considered. Regular monitoring should be considered where appropriate and the use of habitat indicators, such as benthic invertebrates, adult/juvenile abundance and/or frequency of LWD/log jams should be considered.
12.1.4 Effective Partnerships
In addition to assessing stock status in the watershed, successful recovery will also be based on the development of effective partnerships between government and community groups. As a first step, mechanisms for planning and information sharing amongst the different organizations studying the salmon stock status should be developed and implemented. A three-step annual process is recommended, with meetings to discuss pre-season planning, in-season implementation, and post-season review. These meetings would address issues such as compiling all the data collected, data interpretation and identification of information gaps, as well as updating recovery and management objectives on at least an annually basis to incorporate new and available data. A central facility, (e.g., government agencies, SRWS) could house the data collected and be accessible to interested parties.
12.1.5 Stream Habitat Maps
Compilation of existing mapping information is important if effective land use planning is to occur. Stream habitat maps have been developed for the Squamish watershed by a number of groups and agencies. A critical analysis of existing information is needed to

May 2005 - 113 - 03-1417-026
Golder Associates
identify where there are requirements for further information. Up-to-date and accurate information is essential if salmon habitats are to be protected. The Sea to Sky Sensitive Habitat Atlas has recently been designed to assist the Squamish-Lillooet Regional District (SLRD), member local governments, First Nations, and communities with land use decisions and to provide a foundation for future integrated natural resource information management. This resource should be considered as an option for information sharing.
It is expected that the monitoring effort will change over time as new information becomes available, as a better understanding of stock status is obtained, and as recovery objectives are re-evaluated. As such, the proportion of the budget allocated to monitoring is also anticipated to change over time. The level of monitoring would also depend on objectives and life history strategy of target species. Monitoring frequency need not be conducted annually.
12.2 Monitoring Physical Works/Effectiveness
Habitat restoration initiatives have been carried out since the 1980s. While a number of monitoring studies have been conducted to assess the fish use of these habitat structures, a lack of baseline information exists for comparative purposes of before and after. Continued and improved monitoring of restored, protected, and rehabilitated habitat should be conducted. Annual monitoring should be considered where appropriate, and the use of multiple indicators, such as adult and/or juvenile salmon, benthic invertebrates, and the frequency of LWD should be considered.
Monitoring the effectiveness of physical works (e.g., habitat restoration works) is essential for assessing recovery of a species. Monitoring the performance and effectiveness of instream habitat structures in some of the Squamish systems has been conducted in the past. Monitoring objectives included: 1) an assessment of the stability and functionality of constructed works; 2) monitor fish use pre- and post-construction; 3) establishment of fish utilization; and 3) identification of remedial works, if required.
Habitat restoration initiatives have been conducted since the 1980s. Past monitoring has successfully evaluated the effectiveness of physical structures, but fish utilization of new structures has been weak in some cases. A lack of baseline information exists for comparative purposes of before and after construction. Determination of fish presence/absence in and about a newly constructed instream habitat structure without prior baseline knowledge of fish distribution in the area does not adequately evaluate the success of the constructed habitat. Continued and improved monitoring of restored, protected and rehabilitated habitat should be conducted. Annual monitoring should be considered where appropriate, and the use of multiple indicators, such as adult and/or juvenile salmon, benthic invertebrates, and the frequency of LWD should be considered.

May 2005 - 114 - 03-1417-026
Golder Associates
Once priority projects have been selected and implemented, monitoring and effectiveness evaluation will take place. It is anticipated that monitoring will be conducted according to the “Framework for Conducting Effectiveness Evaluation of Watershed Restoration Projects”, by Gaboury and Wong (1999). Routine Effectiveness Evaluations (REE) provide a low intensity, standardized procedure for determining the success of stream and off-channel restoration projects at a broad scale and low cost. The intent of the REE procedure is to examine all sites within restoration projects to determine, at a qualitative level, if physical and biological objectives at the site, component, and watershed level are being met satisfactorily.

May 2005 - 115 - 03-1417-026
Golder Associates
13.0 IMPLEMENTATION PLAN SUMMARY
To move the recovery plan forward the TAC met in January 2005 to identify priority projects and those that should be implemented in 2005. Limited funds will be provided by the PSF and it is expected that additional financial support will come from other sources. The application deadlines for other funds, such as Bridge Coastal Restoration Program, do not occur until the fall. As such, the criteria for priority project selection was based on the following: 1) potential to expand existing and ongoing assessments to address information gaps identified in the recovery plan; 2) key projects identified by the TAC that require short-term attention; and 3) fall within the existing PSF allocated budget for 2005.
Based on this approach, proposal submissions will be made in early spring of 2005 for implementation during the remainder of 2005 to move the recovery plan initiative forward.

May 2005 - 116 - 03-1417-026
Golder Associates
14.0 RECOMMENDED RECOVERY PLAN PROJECTS
The TAC decided to develop a matrix that ranks the importance of different types of assessments that would be required in each of the sub-watersheds or systems to achieve recovery of salmon and steelhead stocks. The main objective of the matrix approach is to provide short-term guidance and focus of projects in areas where they are needed most given the current lack of understanding of stock status, habitat capacity, limiting factors and productive capacities. The intention is that more specific and detailed projects would be defined by the community (i.e., via workshop, open house), through the development of a stock assessment framework, and incorporation of new data into the recovery plan. It is anticipated that this work will be conducted in 2005. The requirement for any particular project or dataset will change on a regular basis based on new information that becomes available, as recovery goals are refined, and on the changing needs of the Squamish community. It is anticipated that the recovery plan will be updated on an annual basis to reflect these changes.
The matrix approach was developed by the TAC, with input from the Squamish community at the November 20, 2004 workshop. The matrix ranks each sub-watershed based on the perceived need for different assessments in different sub-watersheds (e.g., biological monitoring, stock assessment, habitat assessment) and based on the information gathered and assessed in this recovery plan. Ranking of sub-watersheds was based on the following criteria:
• highest level of historical impact;
• highest potential for future land development impacts; and
• potential for species-specific impacts.
The ranking set for each sub-watershed or system and each assessment type was first established by the professional opinion of members of the TAC based on their expert knowledge of fish populations and habitat and cultural values in the Squamish watershed. Members of the Squamish community who participated in the community workshop (November 20, 2004) independently ranked each assessment in each of the sub-watershed or systems. Rankings of the TAC and the community members were then compared and a consensus reached for each ranking during the community workshop. The final matrix is provided in Table 12.
Assessments recommended in each sub-watershed were ranked as either low, medium or high. A low ranking would imply that the level of historical impact, potential for land development, and species-specific impacts were low, and thus a proposal to conduct a particular assessment in such a sub-watershed would be given a lower priority over a

May 2005 - 117 - 03-1417-026
Golder Associates
proposal in an area with a higher ranking. A high ranking would be assigned in areas with a high level of historical impact, potential for land development, and species-specific impacts (e.g., education of community in the protection of urbane streams in Squamish).
In support of the matrix, a list of suggested projects that fall into the assessment types shown in the matrix is provided in Table 13. This list of projects was developed based on the knowledge gained through the development of this recovery plan, suggested projects provided in the reference materials, and on the expert knowledge of members of the TAC and community members who participated in the recovery planning process. This suggested project list is not exhaustive, and it is expected that additional fully technically qualified projects will be brought forth by the Squamish community and other interested stakeholders. Furthermore, it is expected that this list of projects will change regularly as new information becomes available.

May 2005 - 118 - 03-1417-026
Golder Associates
of G
r s
ilita
te F
l s
mpr
ovem
Table 125: Priority Ranking Of Assessments In The Squamish River Watershed Sy
stem
Wat
ersh
ed R
anki
ng
Impr
ove
Inst
ream
Com
plex
ity
Stre
am F
ertil
izat
ion
Ass
essm
ent
ound
wat
er
Aqu
ifer
Reh
aboo
dpla
in
Hab
itat
Pass
age
Impr
ovem
ent
Bio
logi
cal M
onito
ring
Hab
itat A
sses
smen
ts
Sedi
men
t Man
agem
ent
Cha
nnel
Mig
ratio
n I
ent
Fish
Cul
ture
Tra
ditio
nal C
ultu
re R
esou
rce
Stew
ards
hip/
Edu
catio
n
Rip
aria
n R
esto
ratio
n
Stawamus M H L L/M NA L M L M NA M M H MMamquam H/M H L H H L M M H L M H H LSquamish Estuary H L L L H H H M L L L H H HSquamish Urban Streams H H L H H H M H H M H M H H
Cheakamus River H H L M M/H L H H H M H H H LSquamish Floodplain below Cheakamus River
H L
L L M L M M L L L H H L
Squamish Floodplain above Cheakamus River
M L L M M H M M M L M H L L
Ashlu Creek M L M L H L M M M L M M M MHigh Falls Creek M M M L H H M M H M M M L LShovelnose Creek M H M L H L M L H M M M H MUpper Squamish River M L L L H L M M L L M M L L
Elaho River M L L L L H H H L L H M L L
5 L=low, M=medium, H=high

May 2005 - 119 - 03-1417-026
Golder Associates
Table 13: List of Recommended Recovery Plan Projects for the Squamish River Watershed
Sub-basin/System Target Species Recovery Objective Description of Project Matrix Priority Rating
Year
Mamquam River sub-basin Improve Instream Complexity Mashiter Creek Juvenile
salmonids Enhancement of winter and summer habitat for juvenile salmonids
Installation of a series of rootwads, LWD, and boulder clusters, and creation of riffle-pool habitat at selected locations downstream of the anadromous barrier
High
Mashiter Creek Steelhead and coho
Enhancement of steelhead and coho production
Re-adjustment of existing intake to prevent dry conditions in summer months; placement of boulders, rootwads
High
Lower Mamquam River Enhancement of summer
and winter habitat for juvenile steelhead
Placement of LWD in glides lacking depth and cover
High
Rehabilitate Floodplain Habitat Mashiter Creek Steelhead and
coho Enhancement of steelhead and coho production
Rehabilitation of remnant channel at floodplain of Mamquam at fan of Mashiter Creek; placement of LWD, boulder clusters to create riffle-pool sequencing
High

May 2005 - 120 - 03-1417-026
Golder Associates
Table 13: List of Recommended Recovery Plan Projects for the Squamish River Watershed (cont’d)
Sub-basin/System Target Species Recovery Objective Description of Project Matrix Priority Rating
Year
Groundwater Aquifer Assessment Mashiter Creek All salmonids Protection of
groundwater influenced Mamquam tributary and side-channel habitat
Investigation of aquifer levels via groundwater well installation and monitoring to assess baseline conditions
High
Habitat Assessment Mamquam River All salmonids Improve salmonid
productivity Estimate frequency of log jams from aerial photos and set frequency goal to achieve 1960s level; estimate amount of off-channel habitat available to salmon vs potential; assess coho smolt production currently from off-channel habitat as benchmark to compare to future
High
Biological Monitoring Mashiter and Ring creeks All adult
salmonids Increase spawning population
Identify, map, and protect key spawning areas; improve monitoring of escapements to provide a benchmark for future reference
High
Mamquam River Coho, chinook, chum
Improve escapement estimates
Improve precision of annual escapement enumeration program
High 2005
Mamquam River Steelhead Monitor steelhead stocks Snorkel surveys in index stream to estimate relative abundance
Medium

May 2005 - 121 - 03-1417-026
Golder Associates
Table 13: List of Recommended Recovery Plan Projects for the Squamish River Watershed (cont’d)
Sub-basin/System Target Species Recovery Objective Description of Project Matrix Priority Rating
Year
Squamish River Estuary Habitat Assessment Estuary All salmonids Establish current
baseline of available critical habitat; protect critical habitat; restore ecological diversity
Identify critical habitat and protect from further industrial impacts; measure length of tidal channels, area of inter-tidal emergent vegetation;
High 2005/06
Biological Monitoring Estuary Chinook Increase chinook
population using estuary Record number of 0+
chinook fry; determine ratio of chinook fry to parr; measure chinook fry absence/presence as a relative abundance index
High 2005/06
Squamish Urban Streams Rehabilitation Floodplain Habitat All urban streams Coho Protect and increase coho
productivity Rehabilitate and enhance floodplain off-channel habitats in all systems with development
High
Habitat Assessment All urban streams All salmonids Identify, maintain,
protect, restore habitat to increase productivity
Protect critical habitat as part of the OCP; estimate functioning summer and winter habitat; improve fish access (e.g., inspect culverts)
High

May 2005 - 122 - 03-1417-026
Golder Associates
Table 13: List of Recommended Recovery Plan Projects for the Squamish River Watershed (cont’d)
Sub-basin/System Target Species Recovery Objective Description of Project Matrix Priority Rating
Year
Groundwater Aquifer Assessment All urban streams All salmonids Maintain adequate water
quality and quantity Monitor groundwater levels in acquifers; monitor water quality
Medium
Biological Monitoring All urban streams All juvenile
salmonids Increase salmon populations
Monitor smolt outmigration using trapping methods; establish as time series
High
Improve Instream Complexity Lower Cheakamus River Juvenile
salmonids Enhancement of existing juvenile salmonid winter and summer habitat
Placement of LWD in glides and riffles lacking depth and cover
Medium/High
Far Point Channel Steelhead Enhancement of steelhead rearing habitat
Placement of instream boulders
High 2005
Rehabilitation of Floodplain Habitat Lower Cheakamus River Steelhead Enhancement of
steelhead parr habitat Enhancement of an existing dry side-channel on the east and west side floodplain 3.8 km upstream of the Bailey Bridge
Medium/High
Cheakamus River All salmonids Enhancement of spawning/rearing habitat
Identify floodplain areas for potential floodway restoration
Medium/High
Channel Migration Improvements Cheakamus River All salmonids Improve river
movements near NVOS Remove/relocate bridge above NVOS to promote lateral movement of mainstem
Medium Carl

May 2005 - 123 - 03-1417-026
Golder Associates
Table 13: List of Recommended Recovery Plan Projects for the Squamish River Watershed (cont’d)
Sub-basin/System Target Species Recovery Objective Description of Project Matrix Priority Rating
Year
Sediment Management Cheakamus River All salmonids Enhancement of
spawning habitat Maintain sediment (gravel) recruitment
High
Biological Monitoring Cheakamus River All salmonids Improve understanding
of salmonid stock status Improve existing stock assessment methods
High 2005/06
Passage Improvements
All salmonids Enhancement of adult
spawner access and fry, smolt, parr emigration
Strategies for stabilization of creek channel and reduction of bedload deposition
Low/Medium
Shovelnose Creek Improve Instream Complexity
Steelhead, chinook, coho
Enhancement of habitat Further fine-tuning of existing boulder and LWD structures to optimize depth, velocity, cover, and pool habitat
High
Sediment Management All salmonids Reduce degree of
sedimentation to the streambed
Strategic placement of LWD to cause narrowing of the mainstem channel to increase the level of sediment flushing
High
Upper Squamish River/Elaho River Passage Improvements Elaho River Steelhead, coho Facilitate access of
steelhead and coho to the full upper Elaho River
Removal of two large bedrock boulder obstructions in the Elaho River
Medium

May 2005 - 124 - 03-1417-026
Golder Associates
Table 13: List of Recommended Recovery Plan Projects for the Squamish River Watershed (cont’d)
Sub-basin/System Target Species Recovery Objective Description of Project Matrix Priority Rating
Year
Biological Monitoring Upper Elaho River Resident
salmonids Assess population status Adult escapement/smolt
production estimates from resident population above the canyon
Medium
Habitat Assessment Upper Squamish River/Elaho River
Steelhead, coho, chinook
Improve/restore habitat/productivities
Estimate frequency of log jams and off-channel habitat and compare to historical conditions (aerial photos); identify critical steelhead, coho, chinook habitat; estimate habitat use; restrict IPP development
High
All Systems Habitat Assessment Identify and
protect critical habitat
Protect critical habitat Preserve biodiversity and components of watershed ecology and hydrology through appropriate land use decisions
Improve habitatcomplexity
Enumerate all lateral log jams; protect existing log jams; increase frequency
Protect freshwaterresource
Develop a long-term water supply plan for the entire watershed
Medium

May 2005 - 125 - 03-1417-026
Golder Associates
Table 13: List of Recommended Recovery Plan Projects for the Squamish River Watershed (cont’d)
Sub-basin/System Target Species Recovery Objective Description of Project Matrix Priority Rating
Year
Biological Monitoring All salmonids Increase populations Select indicator system(s);
conduct adult, smolt enumeration studies
High 2005
All salmonids Increase adult escapement
Identify and monitor key spawning populations over time
High
Chinook spawners Determine spawning chinook population
ID and document reaches and systems where chinook are >100 spawner/km; map locations; protect habitat
High
Pink spawners Determine spawning pink population
ID and document reaches and systems where pink are >1,000 spawner/km; map locations; protect habitat
High
Traditional Cultural Values Squamish Nation All salmonids Protect cultural resources Conduct a traditional use
study to document; protect cultural resources; put signage in place
High 2005
Stewardship/Education All salmonids Adaptive management to
achieve recovery Annual updates of recovery plan with new information/day
High Annually,starting in 2005
Public education Record public groups actively involved with salmon; public events and media reports relating to salmon and watershed issues
High

- 126 - 03-1417-026
Golder Associates
Sub-basin/System Target Species Recovery Objective Description of Project Matrix Priority Rating
Year
All salmonids Make all data available to community and other interested parties
Central location for all data and information
High
All Systems Fish Culture Coho, chinook,
steelhead Increase wild salmon
and steelhead populations
Monitor proportion of hatchery/natural salmon; increase wild populations
High
Pink Increase pink population Establish a minimum population size; fish culture intervention
High
Fisheries Management All salmonids Protect and improve
Native, recreational, and commercial fishery
Track opportunity for fisheries
High
Steelhead Preserve wild steelhead stocks
Continue with catch-and-release regulations for wild steelhead recreational fishery
High
Sediment Management All salmonids Improve habitat
conditions Estimate current sedimentation rate and compare to pre-logging; develop sediment budget for watershed; restore landslide and stabilize slopes; decrease name of logging roads; plant vegetation
High
Table 13: List of Recommended Recovery Plan Projects for the Squamish River Watershed (cont’d)
May 2005


May 2005 - 128 - 03-1417-026
Golder Associates
16.0 REFERENCES CITED
Anon. 1998. Stawamus River and Mashiter Creek Integrated Watershed Management Plan. Prepared for the BC Ministry of Environment, Lands and Parks, and the BC Ministry of Forests.
Aplin & Martin Consultants Ltd., Hotson Bakker Architects, Coriolis Consulting Corp., and Creative Transportation Solution Ltd. 2003. Squamish 2000 Plan – District of Squamish Comprehensive Downtown Development Strategy. Updated July 2003.
Aquatic Resources Ltd. (ARL). 1998. Wild Steelhead Conservation Planning in the Lower Mainland Region. Prepared for Ministry of Environment, Lands and Parks, Fish and Wildlife Management, Surrey, BC. 71 pp.
ARL. 2000. Wild steelhead Conservation Planning: Squamish River. Prepared by Aquatic Resources Ltd. for the Ministry of Environment, Land and Parks, Surrey, B.C.
ARL. 2001. Mamquam River Adult Steelhead Sampling Program – Snorkel Counts, Spring 2000. Prepared by Aquatic Resources Ltd. for the Ministry of Water, Land and Air Protection, Surrey, B.C. 27 pp. + Appendices.
ARL. 2002. Squamish River System Juvenile Steelhead Sampling Program. Prepared by Aquatic Resources Ltd. for the Ministry of Water, Land and Air Protection, Surrey, B.C.
ARL. 2003. Mamquam River Adult Steelhead Sampling Program – Snorkel Counts, Spring 2002. Prepared by Aquatic Resources Ltd. for the Ministry of Water, Land and Air Protection, Surrey, B.C. 22 pp. + Appendices.
Argue, A.W. and R.W. Armstrong. 1977. Coho smolt coded-wire tagging and enumeration (1971 to 1973 brood) on three small tributaries in the Squamish River system. Fisheries and Environment Canada, Fisheries and Marine Service. Data Report Series PAC/D-77-11. 62 pp. + Appendices.
Bell., T. 2005. Personal Communication. Ministry of Water, Land and Air Protection, Surrey, BC. April 2005.
BC Hydro. 2003. Cheakamus Project Draft Water Use Plan. June 2003. 12 pp. + Appendices.
Boychuk, K. 2004. Personal Communication. Ledcor Construction Inc. August 2004.

May 2005 - 129 - 03-1417-026
Golder Associates
Bradford, M.J., G. Taylor, and J.A. Allan. 1997. Empirical Review of Coho Salmon Smolt Abundance and the Prediction of Smolt Production at the Regional Level. Trans. Am. Fish. Soc. 126: 49-64.
Canadian Hydro Producers Inc. (Canadian Hydro). 2002. Upper Mamquam River Hydroelectric Project Environmental and Socioeconomic Report. February 12, 2002. Prepared for BC Assets and Land Corporation, Victoria, B.C.
Carl, L.M. and M.C. Healey. 1984. Differences in Enzyme Frequency and Body Morphology Among Three Juvenile Life History Types of Chinook (Oncorhynchus tschawytscha) in the Nanaimo River, British Columbia. Can. J. Fish. Aquat. Sci. 41: 1070-1077.
Caverhill, P. 2005. Personal Communication. Retired steelhead biologist with the Ministry of Water, Land and Air Protection. March 2005.
Celli, D. 2001. Personal Communication. Tenderfoot Hatchery, Squamish. May 2001.
Clague, J.J., J.W. Turner, and A.V. Reyes. 2002. Record of Recent River Channel Instability, Cheakamus Valley, British Columbia; Department of Earth Sciences, Simon Fraser University.
Clark, B.J. 1981. The Squamish Steelhead Investigations: 1977-1979. Ministry of Environment, Lands and Parks, Surrey, B.C. Unpublished MS ML 001.
Clark, W.C., R.E. Withler, and J.E. Shelbourn. 1992. Genetic Control of Juvenile Life History Pattern in Chinook Salmon (Onchorynchus tschawytscha). Can. J. Fish. Aquat. Sci. 49: 2300-2306.
Cook, R. 2004. Personal Communication. Fisheries and Oceans Canada, Stock Assessment Branch., Vancouver, B.C.
Coulter, D.E., J.P. Haile, F. Margitan, and G. Dixon. 1998. Design build contractual arrangements for the Mamquam River Hydroelectric Project Power Tunnel. Prepared for Northern Utilities Inc.
D’Aoust S.G. and R.G. Millar. 1999. Large Woody Debris Fish Habitat Structure Performance and Ballasting Requirements. Watershed Restoration Management Report No. 8. Prepared by the Department of Civil Engineering, University of British Columbia, B.C. 119 pp.

May 2005 - 130 - 03-1417-026
Golder Associates
Decker, A.S., J.M. Bratty, S.C. Riley, and J. Korman. 1999. Estimating Standing Stock of Juvenile Coho Salmon (Onchorhynchus kisutch) and Cutthroat Trout (O. clarki) in a Small Stream: A Comparison of Sampling Design. Can. Tech. Rep. Fish. Aquat. Sci. No. 2282.
Dillon Consulting Ltd. (Dillon). 1998. Ashlu Creek Fish Habitat Procedure – Level 1 Assessment. Prepared for the Steelhead Society Habitat Restoration Corporation. Report No. 96-4019. 25 pp. + Appendices.
District of Squamish. 1998. Official Community Plan. On file at the District of Squamish office, Squamish, B.C.
District of Squamish. 1998a. District of Squamish Groundwater Development. Application for a Project Approval Certificate. Volume One. Submitted to the Environmental Assessment Office.
Dobson, D. 1999. Personal Communication. Pacific Biological Station, Nanaimo, B.C. August 1999.
ESSA Technologies Ltd. (ESSA). 2002. Cheakamus River Water Use Plan: Consultative Committee Report. Draft, March 20, 2002. Prepared for The Consultative Committee for the Cheakamus River Water Use Plan. Prepared by ESSA, Vancouver, B.C. 226 pp.
Fanos, B. 2004. Personal Communication. Fisheries and Oceans Canada, Stock Assessment Branch. November 2004.
Farwell, M.K., N.D. Schubert, K.H. Wilson, and C.R. Harrison. 1987. Salmon Escapements to Streams Entering Statistical Areas 28 and 29, 1951 to 1985. Can. Tech. Rep. Fish. Aquat. Sci. No. 601. 166 pages.
Fisheries and Oceans Canada (DFO) 1999. Lower Strait of Georgia chinook salmon. DFO Science Stock Status Report D6-12: 7p.
Fisheries and Oceans Canada (DFO). 2004. A Policy Framework for Conservation of Wild Pacific Salmon. Draft. December 2004. Prepared by Fisheries and Oceans Canada. 53 pp.
Foy, M. 2003. Personal Communication. Fisheries and Oceans Canada, Habitat Branch. March 2003.

May 2005 - 131 - 03-1417-026
Golder Associates
Foy, M. 2004. Personal Communication. Fisheries and Oceans Canada, Habitat Branch. November 2004.
Foy, M. and S. Gidora. 2002. Coho Salmon Production From Constructed Off-Channel Habitat, Cheakamus River, 2001. B.C. Hydro Bridge Coastal, Fish and Wildlife Habitat Restoration Program, Project Report. August 2002. 13 pp.
Gaboury, M and R. Wong. 1999. A Framework for Conducting Effectiveness Evaluations of Watershed Restoration Projects. Watershed Restoration Technical Circular No. 12. Ministry of Environment, Lands and Parks and Ministry of Forests.
Golder Associates Corp. (Golder). 2003. Nisqually Watershed Management Plan. Prepared by Golder Associates Corp., Seattle, WA.
Golder Associates, Squamish Nation, and Fisheries and Oceans Canada. In preparation. Technical Compendium of the Status of Coho Salmon in the Squamish River Watershed. For submission as a DFO technical document.
Goodings, C. 1997. Squamish River Watershed Restoration Program. Submitted to the Squamish River Watershed Society.
Greater Georgia Basin Steelhead Recovery Plan (GGBSRP). 2002. Greater Georgia Basin Steelhead Recovery Action Plan. Prepared for the Pacific Salmon Foundation.
Halvorson, C. 2004. Personal Communication. Property Manager, North Vancouver Outdoor School. November 2004.
Hancock, M.J. and D.E. Marshall. 1986. Catalogue of Salmon Streams and Spawning Escapements of Statistical Area 28 Howe Sound – Burrard Inlet. Can. Data Rep. Fish. Aquat. Sci. 557: 190p.
Hanson, A. 2004a. Squamish River System Juvenile Steelhead Sampling Program. Brohm River and Mashiter, Ashlu, High Falls and Shovelnose Creeks, Fall 2002, 2003 and 2004. Prepared for Ministry of Water, Land and Air Protection, B.C. Conservation Foundation, Surrey, B.C.
Hanson, A. 2004b. Squamish River System Adult Steelhead Sampling Program. Mamquam River, Spring 2002, 2003 and 2004. Prepared for Ministry of Water, Land and Air Protection. B.C. Conservation Foundation. Surrey, B.C.
Hanson, A. and C. Hryhorczuk. 2002. Squamish River System Juvenile Steelhead Sampling Program. Prepared for Ministry of Water, Land and Air Protection.

May 2005 - 132 - 03-1417-026
Golder Associates
Harding, L.E. 1973. Overview of the Marine Ecosystem of Howe Sound. Prepared by Environment Canada. pp. 167-183.
Hartmann, G.F. and J.C. Scrivener. 1990. Ecosystem Perspectives: Time, Similarities, and Diversity. In: “Impacts of Forestry Practices on a Coastal Stream Ecosystem, Carnation Creek, British Columbia.” Can. Bull. Fish. Aquat. Sci. No. 223. pp. 123-131.
Hatfield Consultants Ltd. (Hatfield). 1996. Strait of Georgia Fisheries Sustainability Review. January 1996.
Hay & Company Consultants Inc. (HAYCO). 1996. Ashlu Creek Watershed Hydraulic and Geomorphic Assessment. Prepared for the Steelhead Society of B.C. March 27, 1996. 12 pages + Appendices.
Hilborn, R. and C.J. Walters. 1992. Quantitative Stock Assessment: choice, dynamics, and uncertainty. Chapman and Hall. New York, N.Y.
Integrated Resources Management Ltd. (IRM). 1997. High Falls Creek Integrated Watershed Restoration Report. Prepared for International Forest Products. Ministry of Environment, Lands and Parks (MELP) Report No. SQFD-083. pp. 22-38 + Appendices.
Interfor Forest Products Ltd. (Interfor). 1998. The Stawamus River and Mashiter Creek Integrated Watershed Management Plan. Prepared by Interfor, Squamish, B.C.
Irvine, J.R. 2004. Climate Change, Adaptation, and “Endangered” Salmon in Canada. Proceedings of the Species at Risk 2004 Pathways to Recovery Conference Organizing Committee.
Johnston, N.T., E.A. Parkinson, A.F. Tautz, and B.R. Ward. 2002. A Conceptual Framework for the Management of Steelhead. Fisheries Project Report No. RD101. Water, Land and Air Protection (WLAP).
Kennedy, D. and R. Bouchard. 1979. Utilization of Fish, Beach Foods, and Marine Mammal by the Squamish Indian People of British Columbia. Published by the British Columbia Indian Language Project, Victoria, B.C.
Kerr Wood Leidal Associates Ltd. (KWL). 1998. Review of Cheakamus River Power Project. Prepared for Squamish Nation.

May 2005 - 133 - 03-1417-026
Golder Associates
Klohn Leonoff, K. 1994. Flood hazard management plan. Background report for the District of Squamish.
Korman, J. 2003. Escapement of Winter-Run Steelhead on the Cheakamus River in 2002. Prepared for B.C. Hydro. Prepared by Ecometric Research Inc., Vancouver, B.C. 28 pp.
Korman, J. and R. Ahrens. 2001. Escapement Estimation of Winter-run Steelhead on the Cheakamus River: Stock Assessment and Monitoring Implications. Prepared for B.C. Hydro’s Cheakamus River Water Use Planning. Prepared by Ecometric Research Inc., Vancouver, B.C. 37 pp.
Korman, J. J. Sneep, C. Melville, and D. McCubbing. 2004. Estimation of steelhead escapement to the Cheakamus River in 2003 based on repeat snorkel counts and radio telemetry. DRAFT, March 8, 2004. Prepared by Ecometric Research Inc., Vancouver, B.C., and Instream Fisheries Consultants, Vancouver, B.C. Prepared for B.C. Hydro and B.C. Habitat Conservation Trust Fund. 50 pp.
Levy, D.A. and S. Davies. 1997. Squamish River Watershed Status Report. Prepared for Squamish River Watershed Fisheries Sustainability Forum: November 27-30, 1997. 78 pages.
Levy, D.A. and C.D. Levings. 1978. A Description of the Fish Community of the Squamish River Estuary, British Columbia: Relative Abundance, Seasonal Changes, and Feeding Habitats of Salmonids. Fisheries and Marine Service Manuscript Report No. 1475.
Lewis, R. 2004. Personal Communication. Squamish Nation Environmental Coordinator. November 2004.
Limnotek Research and Development Inc. (Limnotek). 2001. Trophic Structure and Function in the Cheakamus River for Water Use Planning. Final Report. October 21, 2001. Submitted to B.C. Hydro and The Resort Municipality of Whistler. 67 pp.
Marshall, D.E. 1980. Optimum Spawning Density for Coho Salmon. Fisheries and Oceans, Enhancement Services Branch.
Marshall, D. E., and E. W. Britton. 1990. Carrying Capacity of Coho Salmon Streams. Can. Man. Rep. Fish. Aquat. Sci. Report No. 2058.
Matsen, J. 2003. Personal Communication. Squamish Streamkeepers. December 2003.

May 2005 - 134 - 03-1417-026
Golder Associates
McCorquodale, D. 2004. Personal Communication. Nimpkish Watershed Society. May 2004.
McCubbing, D. and C. Melville. 2000. Steelhead trout escapement monitoring on the Cheakamus River – an evaluation of the potential application of automated counter technologies utilizing data from 2000. Prepared for B.C. Hydro by Instream Fisheries Consultants. December 2000.
Melville, C. and D. McCubbing. 2000. Assessment of the 2000 Juvenile Salmon Migration from the Cheakamus River, Using Rotary Traps. Prepared for B.C. Hydro by Instream Fisheries Consultants.
Melville, C. and D. McCubbing. 2002a. Assessment of the 2001 Juvenile Salmon Migration In the Cheakamus River, Using Rotary Traps. Prepared for B.C. Hydro by Instream Fisheries Consultants. June 2002.
Melville, C. and D. McCubbing 2002b. Assessment of the 2001 Juvenile Salmon Migration In the Cheakamus River, Using Rotary Traps. Prepared for B.C. Hydro by Instream Fisheries Consultants. September 2002. Draft Report.
Melville, C. and D. McCubbing 2003. Assessment of the 2003 Juvenile Salmon Migration In the Cheakamus River, Using Rotary Traps. Prepared for B.C. Hydro by Instream Fisheries Consultants. November 2003 Draft Report.
Ministry of Environment, Lands and Parks (MELP), and Ministry of Forests (MoF). 1996. Fish Habitat Rehabilitation Procedures. Watershed Restoration Technical Circular No. 9.
Ministry of Forests (MoF). 1991. Ecosystems of British Columbia. Compiled and edited by Del Meidinger and Jim Pojar. Crown Publications, Victoria, B.C.
Ministry of Water, Land and Air Protection (MWLAP). 2004. Steelhead Stream Classification Policy and Procedure. Draft. April 21, 2004. 5 pp.
MoF, MELP, and DFO. 2001. Watershed-Based Fish Sustainability Planning, Conserving B.C. Fish Population and their Habitat. A Guidebook for Participants. National Library of Canada.
North Vancouver Outdoor School, Fisheries and Oceans Canada, and Bridge Coastal Restoration Program. 2002. Cheakamus River Sidechannel Restoration Project 2002. Final Report.

May 2005 - 135 - 03-1417-026
Golder Associates
National Oceanic and Atmospheric Administration (NOAA). 2003. Ecosystem Recovery Planning for Listed Salmon: An Integrated Assessment Approach for Salmon Habitat. NOAA Technical Memorandum NMFS-NWFSC-58. 185 pp.
Northwest Hydraulics Consultants. (NHC). 2000. Analysis of Channel Morphology and Sediment Transport Characteristics of the Cheakamus River. B.C. Hydro Reference No. CMS-Mrphlgy. Prepared by Northwest Hydraulics Consultants. Report prepared for B.C. Hydro. November 20, 2000. 37 pp. + tables, figures, and appendices.
Pacific Fisheries Resource Conservation Council (PFRCC) 2002. Pacific Fisheries Resource Conservation Council Annual Report 2001-2002. Vancouver, B.C.
Pacific Salmon Commission (PSC). 2003. Catch and Escapement of Chinook Salmon under Pacific Salmon Commission Jurisdiction, 2003. Pacific Salmon Commission, Joint Chinook Technical Committee Report TCCHINOOK (04)-2. Vancouver, B.C.
Pacific Salmon Foundation (PSF). 2004. Strategic Salmon Recovery Plan Team’s Annual Workshop 2004. Vancouver, B.C., November 18-19, 2004.
Palermo, V. and A.S. Thompson. 2000. Angler Effort and Catch in the 1998 Sport Fisheries of the Capilano and Squamish Rivers. Can. Man. Report Fish. Aquat. Sci. 2529.
Parken, C.K. Personal Communication. Acting Head, Salmon Assessment Section, Stock Assessment Division, Science Branch, Fisheries and Oceans Canada. Pacific Biological Station, Nanaimo, B.C. April 2004.
Pojar, J. K. Klinka, and D.A. Demarchi. 1991. Mountain Hemlock Zone in Ecosystems of British Columbia. Compiled and Edited by Del Meidinger and Jim Pojar. Crown Publications, Victoria, B.C.
Pojar, J. and A.C. Stewart. 1991. Alpine Tundra Zone in Ecosystems of British Columbia. Compiled and edited by Del Meidinger and Jim Pojar. Crown Publications, Victoria, B.C.
P. Slaney Aquatic Science Ltd. (Slaney). 2003. Habitat Assessments and Restoration Prescriptions for Recovery of Steelhead Trout in the Mamquam, Lower Cheakamus and Upper Squamish Rivers. Prepared for Ministry of Water, Land and Air Protection. 53 pp. + Photos and Appendices.

May 2005 - 136 - 03-1417-026
Golder Associates
Ptolemy, R.A. 1997. Stream Production Characteristics of the Squamish River and Its Tributaries: What Do We Know of Environmental and Biological Constraints to Sustainable Fisheries? Paper presented to the Squamish River Watershed Forum on Sustainable Fisheries: November 28-30, 1997, Squamish, B.C.
Resort Municipality of Whistler (RMOW). 2004. Whistler 2020. Moving Toward a Sustainable Future. The Comprehensive Sustainability Plan Volume 1.
Rochetta, S. 2004. Personal Communication. Ministry of Water, Land and Air Protection. Squamish B.C., January 2004.
Schubert, N.D. 1993. Enumeration of the 1988-1992 Squamish River chinook salmon escapement. Can. Man. Rep. Fish. Aquat. Sci. No. 2187.
Schubert, N.D. 2005. Personal Communication. DFO Stock Assessment. April 2005.
Slaney, P.A. and A.D. Martin. 1997. “Planning Fish Habitat Rehabilitation: Linking to Habitat Protection.” In: Fish Habitat Rehabilitation Procedures. Watershed Restoration Program Technical Circular No. 9. Prepared by the Ministry of Environment, Lands and Parks and the Ministry of Forests. pp. 1-1 to 1-23.
Smith B.D. and B.R. Ward. 2000. Can J. Fish. Aquat Sci. 57:271-284.
Sneep, D. 2001. Cheakamus River Juvenile Salmonid Distribution Assessment, September 1999 to July 2000. Cheakamus River Water Use Plan Data Report. B.C. Hydro.
Squamish Estuary Management Plan (SEMP). 1999. Draft Squamish Estuary Management Plan. Prepared by the Squamish Estuary Coordinating Committee.
Squamish Nation. 2000. Chinook, Coho, and Chum Salmon Enumeration in the Squamish Watershed: Year 4. Prepared by Golder Associates Ltd., Burnaby, B.C. Prepared for the Squamish Nation and Fisheries and Oceans Canada.
Squamish Nation. 2003. Chinook, Coho, and Chum Salmon Enumeration in the Squamish Watershed: Year 7. Prepared by Golder Associates Ltd., Burnaby, B.C. Prepared for the Squamish Nation and Fisheries and Oceans Canada.
Squamish Nation. 2004. Chinook, Coho, and Chum Salmon Enumeration in the Squamish Watershed: Year 8. Prepared by Golder Associates Ltd., Burnaby, B.C. Prepared for the Squamish Nation and Fisheries and Oceans Canada.

May 2005 - 137 - 03-1417-026
Golder Associates
Squamish Nation 2005. Chinook, Coho, and Chum Salmon Enumeration in the Squamish Watershed: Year 9. Draft Report. Prepared by Golder Associates Ltd., Burnaby, B.C. Prepared for the Squamish Nation and Fisheries and Oceans Canada.
Squamish Nation Land and Resources Committee (Squamish Nation). 2001. Draft Xay Temíxw Land Use Plan. For the Forests and Wilderness of the Squamish Nation Traditional Territor.
Starr, P.J. 1982. Explanation of Stock-Recruitment Analysis for B.C. Wild Stock Chinook. Unpublished memo, Department of Fisheries and Oceans.
Steelhead Society Habitat Restoration Corporation (SSHRC). 1998a. Watershed Restoration Program Progress Report: Squamish River, Shovelnose Creek and Ashlu Creek Restoration 1996/97. Submitted to Ministry of Environment, Lands and Parks. June 1998. 36 pp. + Appendices.
SSHRC. 1998b. Squamish River Monitoring Report. Submitted to Ministry of Environment, Lands and Parks. July 1998. 23 pp. + Appendices.
SSHRC. 1999. Stream As-Built Reports for Squamish Tributaries: 28.5 Mile and 36 Mile Creeks. Prepared for Ministry of Environment, Lands and Parks, Surrey, B.C.
SSHRC. 2001. Squamish River Watershed Projects: Effectiveness Evaluation (Monitoring) Report (FINAL) 2000/2001. Submitted to the Ministry of Environment, Lands and Parks. June 2001. 50 pp. + Appendices.
Tadey, J. 2004. Personal Communication. Fisheries and Oceans Canada, Stock Assessment Branch. September 2004.
Tobe, E.B. 1998. Stream Inventory of Watercourses within Upper Howe Sound. Territorial Lands of Squamish Nation. On file at the Squamish Nation Totem Hall Office, Squamish, B.C. 118 pages + Appendices.
Triton Environmental Consultants Ltd. (Triton). 1989. Mashiter Creek Domestic Water Diversion Assessment of Fish Resources, Habitat and Potential Impacts (draft report). Prepared for the District of Squamish. December 1989. 35 pp. + Appendices.
Triton. 1993. Draft Cheakamus River Fisheries Study: 1991-1993. Prepared for B.C. Hydro, Burnaby, B.C.
University of British Columbia (UBC). 2004. The Squamish Downtown Waterfront Concept Plan. Prepared by UBC, Fraser Basin Council, and the District of Squamish.

May 2005 - 138 - 03-1417-026 Ward, B.R. 2000. Declivity is Steelhead (O. mykiss) Recruitment at the Keogh River
Over the Past Decade. Can. J. Fish. Aquat. Sci. 57: 298-306.
Welch, D.W., B.R. Ward, B.D. Smith, and J.P. Eveson. 2000. “Temporal and Spatial responses of British Columbia steelhead (Oncorhynchus mykiss) population to ocean climate shifts.” Fish. Oceanogr. 9, 17-32.
Welch, D.W. 2004. Pacific Ocean Shelf Tracking Project. Progress Report 31.
Wilson, C.C., R.W. Armstrong, and A.W. Argue. 1977. Squamish River Spawning Ground Recovery of 1972 Brood Coded-Wire-Tagged Coho Salmon. Data Record Series, DFO.
Wilson, G. 2004. Personal Communication. Ministry of Water, Land and Air Protection. November 2004.
Wright, J. 2004. Personal Communication. Sport Fishery Advisory Committee. February 2004.
Golder Associates

N:/B
ur-G
raph
ics/
Pro
ject
s/20
03/1
417/
03-1
417-
026/
GIS
/apr
s/R
epor
t/fig
ure-
01_s
quam
ish-
wat
ersh
ed_2
2x34
.mxd
PACIFIC SALMON FOUNDATIONSALMON RECOVERY PLAN
SQUAMISH, B.C.
SQUAMISH RIVER WATERSHED
CHECK
06 May 2005GW
REVIEW
GIS
TITLE
PROJECT
SCALE AS SHOWNPROJECT No. 03-1417-026
FIGURE 1DESIGN
REV. 0
06 May 200506 May 2005BS
CDB
Stawamus River
Raffuse C
reek
Skookum C
reek
Martin Creek
Crawford Creek
Ring Creek
Mas
hite
r C
reek
Fries Creek
Cheeky
e Riv
er
Bro
hm
Riv
er
Swift C
reek
Culliton Creek
Conroy Creek
Tant
alus
Cre
ekMaw
by C
reek
Pilchuck
Cre
ek Ch
eaka
mu
s R
ive
r
Sigurd Creek
Poko
sha
Cre
ekRoaring C
k
Tatl
ow
Cre
ek
Ashlu Creek
Hig
h Fa
lls C
reek
Chance Creek
Squam
ish River
Dai
sy L
ake
Garibaldi Lake
Shovelhose Creek
Elaho River
Sims Creek
Clendenning Creek
How
e S
oun
d
Squamish Harbour
Mamquam River
Rubble Creek
CHEAKAMUS
MOUNT CURRIE
NESUCH
SKOWISHIN
KOWTAIN
AIKWUKS
WAIWAKUM
KAIKALAHUN
YOOKWITZ
STAWAMUS
LOKLA
CHEKWELP
POQUIOSIN AND SKAMAIN
SEAICHEM
KWUM KWUM
INLAILAWATASH
YEKWAUPSUM
SCHALTUUCH
POYAM
SKOWISHIN GRAVEYARD
DEFENCE ISLAND
CHUCKCHUCK
Garibaldi Provincial Park
Pinecone Burke
ClendinningProvincial Park
Indian Arm
Upper Lillooet Provincial Park
Tetrahedron
Tantalus Provincial Park
Cypress
Birkenhead LakeProvincial Park
Mount Seymour
Callaghan Lake
Alice Lake
StawamusChief
HalkettBay
BrackendaleEagles
Nairn Falls
BlackcombGlacier
ShannonFalls
BrandywineFalls
Porteau Cove
Murrin
Plumper Cove Marine
Baynes IslandEcological Reserve
Burnaby, B.C.
Watershed Data from MSRM, Street Data from DMTI Spatial Inc.Datum: NAD83 Projection: BC Albers
REFERENCE
Sub-basinAshlu Creek
Cheakamus River
Elaho River
Mamquam River
Squamish River
Stawamus River
Highway
RiverWaterbody
Wetland
Road5,000 0 5,0002,500
MetersScale - 1:200,000
LEGENDSquamish River Watershed
Squamish Nation Traditional Territory
Lil’Wat Traditional Territory
Indian Reserve
Provincial Park

PROJECT No.DESIGNCADDCHECK
TASK No. REV.SCALE
TITLE
PROJECT
FIGURE 2
REVISION DATE: May 13, 2005 BY: GGG FILE: FINAL\2003\1417\03-1417-026\FIGURES 2 TO 5.PPT
REVIEW
NTS
Squamish River Hydrograph near Brackendale (08GA022)
Years 1922-2004(Data Obtained from Environment Canada)
PACIFIC SALMON FOUNDATIONSALMON RECOVERY PLAN
SQUAMISH, B.C.
100013MAY04
13MAY04
GGG--
BCS
03-1417-026
BCS 13MAY04
Years 1922-2004 (data obtained from Environment Canada)
0
100
200
300
400
500
600
700
800
Jan Feb Mar Apr May Jun Jul Aug Sep Oct Nov Dec
Month
Flow
(m3/
s)
1922 19231924 19251955 19271956 19571958 19591960 19611962 19631964 19651966 19671968 19691970 19711972 19731974 19751976 19771978 19791980 19811982 19831984 19851986 19871988 19891990 19911992 19931994 19951997 19981999 20002001 20022003 2004

PROJECT No.DESIGNCADDCHECK
TASK No. REV.SCALE
TITLE
PROJECT
FIGURE 3
REVISION DATE: May 13, 2005 BY: GGG FILE: FINAL\2003\1417\03-1417-026\FIGURES 2 TO 5.PPT
REVIEW
NTS
Cheakamus River Hydrograph (08GA043)Years 1996-2003
(Data Obtained from Environment Canada)
PACIFIC SALMON FOUNDATIONSALMON RECOVERY PLAN
SQUAMISH, B.C.
100013MAY04
13MAY04
GGG--
BCS
03-1417-026
BCS 13MAY04
0
20
40
60
80
100
120
140
160
Jan Feb Mar Apr May Jun Jul Aug Sep Oct Nov Dec
Month
Flow
(m3/
s)
19961997199819992000200120022003

PROJECT No.DESIGNCADDCHECK
TASK No. REV.SCALE
TITLE
PROJECT
FIGURE 4
REVISION DATE: May 13, 2005 BY: GGG FILE: FINAL\2003\1417\03-1417-026\FIGURES 2 TO 5.PPT
REVIEW
NTS
Mamquam River Hydrograph (08GA075)Years 1996-2003
(Data Obtained from Environment Canada)
PACIFIC SALMON FOUNDATIONSALMON RECOVERY PLAN
SQUAMISH, B.C.
100013MAY04
13MAY04
GGG--
BCS
03-1417-026
BCS 13MAY04
( )
0
10
20
30
40
50
60
70
80
Jan Feb Mar Apr May Jun Jul Aug Sep Oct Nov Dec
Month
Flow
(m3/
s)
1996
1997
1998
1999
2000
2001
2002
2003

PROJECT No.DESIGNCADDCHECK
TASK No. REV.SCALE
TITLE
PROJECT
FIGURE 5
REVISION DATE: May 13, 2005 BY: GGG FILE: FINAL\2003\1417\03-1417-026\FIGURES 2 TO 5.PPT
REVIEW
NTS
Stawamus River Hydrograph (08GA076)Years 1991-2004
(Data Obtained from Environment Canada)
PACIFIC SALMON FOUNDATIONSALMON RECOVERY PLAN
SQUAMISH, B.C.
100013MAY04
13MAY04
GGG--
BCS
03-1417-026
BCS 13MAY04
( )
0
2
4
6
8
10
12
Jan Feb Mar Apr May Jun Jul Aug Sep Oct Nov Dec
Month
Flow
(m3/
s)
19911992199319941995199619971998199920002001200220032004

AS SHOWN
DISTRICT OF
SQUAMISH PUBLIC LAND STATUS
FIGURE 6a
Provided by the District of Squamish
DRAWING DATE: 17-Feb-05 COREL FILE: N:\Bur-Graphics\Projects\2003\1417\03-1417-026\Drafting\corel\PLAN.cdr
PACIFIC SALMON FOUNDATION
SALMON RECOVERY PLAN
SQUAMISH, B.C.
PROJECT No.
DESIGN
CADD
CHECK
REVIEW
FILE No. PLAN
REV.SCALE
TITLE
PROJECT
17FEB05BS
SS
BS
03-1417-026
17FEB05
17FEB05

DISTRICT OF
SQUAMISH PUBLIC LAND STATUS
FIGURE 6b
AS SHOWN
Provided by the District of Squamish
PACIFIC SALMON FOUNDATION
SALMON RECOVERY PLAN
SQUAMISH, B.C.
DR
AW
ING
DA
TE
:17-F
eb-0
5C
OR
EL
FIL
E:N
:\B
ur-
Gra
phic
s\P
roje
cts
\2003\1
417\0
3-1
417-0
26\D
raftin
g\c
ore
l\P
LA
N2.c
dr
PROJECT No.
DESIGN
CADD
CHECK
REVIEW
FILE No. PLAN 2
REV.SCALE
TITLE
PROJECT
17MAY05BS
SS
03-1417-026
BS
17MAY05
17MAY05

DISTRICT OF
SQUAMISH PUBLIC LAND STATUS
FIGURE 6c
AS SHOWN
Provided by the District of Squamish
PACIFIC SALMON FOUNDATION
SALMON RECOVERY PLAN
SQUAMISH, B.C.
DR
AW
ING
DA
TE
:17-F
eb-0
5C
OR
EL
FIL
E:N
:\B
ur-
Gra
phic
s\P
roje
cts
\2003\1
417\0
3-1
417-0
26\D
raftin
g\c
ore
l\P
LA
N2.c
dr
PROJECT No.
DESIGN
CADD
CHECK
REVIEW
FILE No. PLAN 2
REV.SCALE
TITLE
PROJECT
17MAY05BS
SS
03-1417-026
BS
17MAY05
17MAY05

DISTRICT OF
SQUAMISH PUBLIC LAND STATUS
FIGURE 6d
AS SHOWN
Provided by the District of Squamish
PACIFIC SALMON FOUNDATION
SALMON RECOVERY PLAN
SQUAMISH, B.C.
DR
AW
ING
DA
TE
:17-F
eb-0
5C
OR
EL
FIL
E:N
:\B
ur-
Gra
phic
s\P
roje
cts
\2003\1
417\0
3-1
417-0
26\D
raftin
g\c
ore
l\P
LA
N2.c
dr
PROJECT No.
DESIGN
CADD
CHECK
REVIEW
FILE No. PLAN 2
REV.SCALE
TITLE
PROJECT
17MAY05BS
SS
03-1417-026
BS
17MAY05
17MAY05

DISTRICT OF
SQUAMISH PUBLIC LAND STATUS
FIGURE 6e
AS SHOWNProvided by the District of Squamish
PACIFIC SALMON FOUNDATION
SALMON RECOVERY PLAN
SQUAMISH, B.C.
DR
AW
ING
DA
TE
:17-F
eb-0
5C
OR
EL
FIL
E:N
:\B
ur-
Gra
phic
s\P
roje
cts
\2003\1
417\0
3-1
417-0
26\D
raftin
g\c
ore
l\P
LA
N2.c
dr
PROJECT No.
DESIGN
CADD
CHECK
REVIEW
FILE No. PLAN 2
REV.SCALE
TITLE
PROJECT
17MAY05BS
SS
03-1417-026
BS
17MAY05
17MAY05

Proj
ect N
o.03
-141
7-02
6
Dra
wn:
BC
S
Rev
iew
ed:
BC
S
Dat
e:05
-13-
05Fi
le L
ocat
ion:
N:\F
INA
L\20
03\1
417\
03-1
417-
026\
FIG
-051
3_05
FIG
UR
E 7
-11.
PPT
PROJECT
REV.
TITLE
SCALE. NTS
PROJECT No.
DESIGN
CADD
CHECK
REVIEW
TASK No. 1000
MCM
BCS
BCS
03-1417-026
-
Figure 7
Escapement Trends for Chinook Salmon inSelected Squamish River Systems1
PACIFIC SALMON FOUNDATIONSALMON RECOVERY PLAN
SQUAMISH, BC
1 Data were compiled from historical DFO databases (NUSEDS, FishWizard), and Farwell et al. (1987).
Squamish River Chinook Escapement
05000
10000150002000025000300003500040000
1945 1955 1965 1975 1985 1995Years
Esca
pem
ent N
umbe
rs A. J. Whitmore1949-1959
A. Reynolds1965-1969
F.B. Wheeler1970-1978
J. Wright1979-1983
A. J. Ionson1983-1993
Mamquam River Chinook Escapement
0200400600800
100012001400
1945 1955 1965 1975 1985 1995
Years
Esca
pem
ent N
umbe
rs A. J. Whitmore1949-1959
A. Reynolds1969-1969
F. B. Wheeler1970-1978
J. Wright1979-1983
A.J. Ionson1983-1993
Ashlu River Chinook Escapement
0
500
1000
1500
2000
2500
1945 1955 1965 1975 1985 1995
Year
Esca
pem
ent N
umbe
rs
A.J. Whitmore1949-1959
A. Reynolds1965-1969
F.B. Wheeler1970-1978
J. Wright1979-1983
A.J. Ionson1983-1993
Cheakamus River Chinook Escapement
0500
1000150020002500300035004000
1945 1955 1965 1975 1985 1995
Year
Esca
pem
ent N
umbe
rs
A.J. Whitmore1949-1959
A. Reynolds 1965-1969
F.B. Wheeler1970-1978
J. Wright1979-1983
A.J. Ionson1983-1993

Proj
ect N
o.03
-141
7-02
6
Dra
wn:
BC
S
Rev
iew
ed:
BC
S
Dat
e:05
-13-
05Fi
le L
ocat
ion:
N:\F
INA
L\20
03\1
417\
03-1
417-
026\
FIG
-051
3_05
FIG
UR
E 7
-11.
PPT
PROJECT
REV.
TITLE
SCALE. NTS
PROJECT No.
DESIGN
CADD
CHECK
REVIEW
TASK No. 1000
MCM
BCS
BCS
03-1417-026
-
Figure 8
Escapement Trends for Coho Salmon in Selected Squamish River System2
PACIFIC SALMON FOUNDATIONSALMON RECOVERY PLAN
SQUAMISH, BC
03-1417-026
-
2 Data were compiled from historical DFO databases (NUSEDS, FishWizard), Farwell et al. (1987), and from Squamish Nation (2004). The median escapement value for the range in escapement provided by Squamish Nation (2004) was graphed.
Squamish River Coho Escapement
010000
200003000040000
5000060000
7000080000
1945 1955 1965 1975 1985 1995
Year
Esca
pem
ent N
umbe
rs
A.J. Whitmore1949-1959
A. Reynolds1965-1969
F.B. Wheeler1970-1978
J. Wright1979-1983
A.J. Ionson1983-1993
Stawamus River Coho Escapement
0
200
400
600
800
1000
1200
1940 1950 1960 1970 1980 1990 2000
Year
Esca
pem
ent N
umbe
rs
A.J. Whitmore1949-1959
A. Reynolds1965-1969
F.B. Wheeler1970-1978
J. Wright1979-1983
A.J. Ionson1983-1993
Mamquam River Coho Escapement
0100020003000400050006000700080009000
10000
1945 1955 1965 1975 1985 1995Years
Esca
pem
ents
Num
bers
A.J. Whitmore1949-1959
A. Reynolds1965-1969
F.B. Wheeler1970-1978
J. Wright1979-1983
A.J. Ionson1983-1993
Ashlu River Coho Escapement
0
500
1000
1500
2000
2500
3000
3500
4000
1945 1955 1965 1975 1985 1995
Year
Esca
pem
ent N
umbe
rs
A.J. Whitmore1949-1959
A. Reynolds1965-1969
F.B. Wheeler1970-1978
J. Wright1979-1983
A.J. Ionson1983-1993
Cheakamus River Coho Escapement
0
2000
4000
6000
8000
10000
12000
14000
16000
1945 1955 1965 1975 1985 1995
Year
Esca
pem
ent N
umbe
rsA.J. Whitmore
1949-1959
A. Reynolds1965-1969
F.B. Wheeler1970-1978
J. Wright1979-1983
A.J. Ionson1983-1993

Proj
ect N
o.03
-141
7-02
6
Dra
wn:
BC
S
Rev
iew
ed:
BC
S
Dat
e:05
-13-
05Fi
le L
ocat
ion:
N:\F
INA
L\20
03\1
417\
03-1
417-
026\
FIG
-051
3_05
FIG
UR
E 7
-11.
PPT
PROJECT
REV.
TITLE
SCALE. NTS
PROJECT No.
DESIGN
CADD
CHECK
REVIEW
TASK No. 1000
MCM
BCS
BCS
03-1417-026
-
Figure 9
Escapement Trends for Pink Salmon inSelected Squamish River Systems3
PACIFIC SALMON FOUNDATIONSALMON RECOVERY PLAN
SQUAMISH, BC
3 Data were compiled from historical DFO databases (NUSEDS, FishWizard), and Farwell et al. (1987).
Mamquam River Pink Escapement
05000
10000150002000025000300003500040000
1945 1955 1965 1975 1985 1995
Years
Esca
pem
ent N
umbe
rs 100,000-yr.1963
A. J. Whitmore1949-1959
A. Reynolds1965-1969
F. B. Wheeler1970-1978
J. Wright1979-1983
A.J. Ionson1983-1993
Ckeakamus River Pink Escapement
0
10000
20000
30000
40000
50000
1945 1955 1965 1975 1985 1995
Year
Esca
pem
ent N
umbe
rs
555,000 351,700
A. J. Whitmore1949-1959
A. Reynolds1965-1969
F. B. Wheeler1970-1978
J. Wright 1979-1983
A.J. Ionson1983-1993
Ashlu River Pink Escapement
010002000300040005000600070008000
1945 1955 1965 1975 1985 1995
Year
Esca
pem
ent N
umbe
rs
A. J. Whitmore1949-1959
A. Reynolds1965-1969
F.B. Wheeler1970-1978
J. Wright1979-1983
A.J. Ionson1983-1993
Squamish River Pink Escapement
0
50000
100000
150000
200000
250000
1945 1955 1965 1975 1985 1995
Year
Esca
pem
ent N
umbe
rs
A. J. Whitmore1949-1959
A. Reynolds1965-1969
F.B. Wheeler1970-1978
J. Wright1979-1983
A.J. Ionson1983-1993
Stawamus River Pink Escapement
050
100150200250300350400450
1951 1956 1961 1966 1971 1976 1981 1986 1991 1996 2001
Year
Esca
pem
ent N
umbe
rs
A.J. Whitmore1949-1959
A. Reynolds1965-1969

Proj
ect N
o.03
-141
7-02
6
Dra
wn:
BC
S
Rev
iew
ed:
BC
S
Dat
e:05
-13-
05Fi
le L
ocat
ion:
N:\F
INA
L\20
03\1
417\
03-1
417-
026\
FIG
-051
3_05
FIG
UR
E 7
-11.
PPT
PROJECT
REV.
TITLE
SCALE. NTS
PROJECT No.
DESIGN
CADD
CHECK
REVIEW
TASK No. 1000
MCM
BCS
BCS
03-1417-026
-
Figure 10
Escapement Trends for Chum Salmon inSelected Squamish River Systems4
PACIFIC SALMON FOUNDATIONSALMON RECOVERY PLAN
SQUAMISH, BC
4 Data were compiled from historical DFO databases (NUSEDS, FishWizard), and Farwell et al. (1987).
Ashlu River Chum Escapement
0
1000
2000
3000
4000
5000
6000
7000
8000
9000
1945 1955 1965 1975 1985 1995
Year
Esca
pem
ent N
umbe
rs
A.J. Whitmore1949-1959
A. Reynolds1965-1969
F.B. Wheeler1970-1978
J. Wright1979-1983
A.J. Ionson1983-1993
Cheakamus River Chum Escapement
0
25000
50000
75000
100000
125000
150000
1945 1955 1965 1975 1985 1995
Year
Esca
pem
ent N
umbe
rs
A.J. Whitmore1949-1959
A. Reynolds1965-1969
F.B. Wheeler1970-1978
J. Wright1979-1983
A.J. Ionson1983-1993
Mamquam River Chum Escapement
05000
10000150002000025000
300003500040000
4500050000
1945 1955 1965 1975 1985 1995
Year
Esca
pem
ent N
umbe
rs
A.J. Whitmore1949-1959
A. Reynolds1965-1969
F.B. Wheeler1970-1978
J. Wright1979-1983
A.J. Ionson1983-1993
Squamish River Chum Escapement
0
50000
100000
150000
200000
250000
1945 1955 1965 1975 1985 1995
Year
Esca
pem
ent N
umbe
rs
A.J. Whitmore1949-1959
A. Reynolds1965-1969
F.B. Wheeler1970-1978
J. Wright1979-1983
A.J. Ionson1983-1993
Stawamus River Chum Escapement
0
50
100
150
200
250
300
350
400
1945 1955 1965 1975 1985 1995
Year
Esca
pem
ent D
ata
A.J. Whitmore1949-1959
A. Reynolds1965-1969
F.B. Wheeler
J. Wright1979-1983
A.J. Ionson1983-1993

Proj
ect N
o.03
-141
7-02
6
Dra
wn:
BC
S
Rev
iew
ed:
BC
S
Dat
e:05
-13-
05Fi
le L
ocat
ion:
N:\F
INA
L\20
03\1
417\
03-1
417-
026\
FIG
-051
3_05
FIG
UR
E 7
-11.
PPT
PROJECT
REV.
TITLE
SCALE. NTS
PROJECT No.
DESIGN
CADD
CHECK
REVIEW
TASK No. 1000
MCM
BCS
BCS
03-1417-026
-
Figure 11
PACIFIC SALMON FOUNDATIONSALMON RECOVERY PLAN
SQUAMISH, BC
Escapement Trends for Sockeye Salmon inSelected Squamish River Systems5
5 Data were compiled from historical DFO databases (NUSEDS, FishWizard), and Farwell et al. (1987).
Squamish River Sockeye Escapement
0
50
100
150
200
250
300
350
1945 1955 1965 1975 1985 1995
Year
Esca
pem
ent N
umbe
rs
F.B. Wheeler1970-1978
J. Wright1979-1983
A.J. Ionson1983-1993
Mamquam River Sockeye Escapement
01020304050607080
1945 1955 1965 1975 1985 1995
Year
Esca
pem
ent N
umbe
rs
A. Reynolds1965-1969
F.B. Wheeler1970-1978
A.J.Ionson1983-1993
J. Wright1979-1983
Ashlu River Sockeye Escapement
0
5
10
15
20
25
30
1945 1955 1965 1975 1985 1995
Year
Esca
pem
ent N
umbe
rs
F.B. Wheeler1970-1978
A.J. Ionson1983-1993
Cheakamus River Sockeye Escapement
0
50
100
150
200
250
1945 1955 1965 1975 1985 1995
Year
Esca
pem
ent N
umbe
rs
F.B. Wheeler1970-1978
J. Wright1979-1983
A.J. Ionson1983-1993

Proj
ect N
o.03
-141
7-02
6
Dra
wn:
BC
S
Rev
iew
ed:
BC
S
Dat
e:05
-13-
05Fi
le L
ocat
ion:
N:\F
INA
L\20
03\1
417\
03-1
417-
026\
FIG
-051
3_05
FIG
UR
ES
12-
14.P
PT
PROJECT
REV.
TITLE
SCALE. NTS
PROJECT No.
DESIGN
CADD
CHECK
REVIEW
TASK No. 1000
PACIFIC SALMON FOUNDATIONSALMON RECOVERY PLAN
SQUAMISH, B.C.
MCM
BCS
BCS
03-1417-026
-
Steelhead Harvest Analysis Data For The Squamish, Cheakamus, And Mamquam Rivers6
1
6 Data provided by BC MWLAP (G. Wilson, pers. comm.).
Squamish River (Including Cheakamus, Mamquam, Ashlu and Elaho) Catch and Effort Steelhead Harvest Analysis Data (1968 to 2002)
0
500
1000
1500
2000
2500
3000
3500
4000
Cat
ch
0
2000
4000
6000
8000
10000
12000
14000
Effo
rt (d
ays)
Wild Total Hatchery Total Days Fished
Hat chery Tot al 0 0 0 0 0 0 0 0 0 0 0 0 0 0 20 8 36 123 98 175 28 38 109 20 24 64 64 38 35 39 8 61 17 4 8 14
Wild Tot al 1704 1813 1146 1252 2172 2800 2336 1699 1811 1224 1365 1594 907 1001 1451 762 1138 3386 2888 3399 1466 2132 1826 1274 634 1450 739 1303 1088 1432 757 854 406 402 759 450
DaysFished 10546 12900 12818 9715 10833 10990 10605 9719 9001 10871 8887 9019 6371 5578 4830 3064 2815 3453 2901 5412 3778 4361 4593 3842 2809 4300 3132 3756 4377 3531 4241 2870 2311 2523 2167 2979
1968 1969 1970 1971 1972 1973 1974 1975 1976 1977 1978 1979 1980 1981 1982 1983 1984 1985 1986 1987 1988 1989 1990 1991 1992 1993 1994 1995 1996 1997 1998 1999 2000 2001 2002 2003
Cheakamus River Catch and EffortSteelhead Harvest Analysis Data (1968 to 2003)
0
500
1000
1500
2000
2500
Cat
ch
0
1000
2000
3000
4000
5000
6000
7000
8000
Effo
rt (d
ays)
Wild Total Hatchery Total Days Fished
Hat chery Tot al 0 0 0 0 0 0 0 0 0 0 0 0 0 0 15 0 20 28 57 88 16 21 42 0 24 19 60 32 32 18.11 4.329 50.8 4 4 4 14
Wild Total 760 1132 949 616 1291 1090 551 686 391 725 560 509 202 290 373 274 590 1997 1826 1695 924 1258 929 418 322 962 618 956 683 833.1 436.7 612 207 253 435 238
Days Fished 5411 6579 7135 5571 6373 5138 4025 4864 3609 4641 3908 3273 2303 1746 1811 1244 1175 1636 1451 2694 1836 2137 2133 1404 1112 1847 1878 2249 2084 1732 1553 1442 885 908 773 974
1968 1969 1970 1971 1972 1973 1974 1975 1976 1977 1978 1979 1980 1981 1982 1983 1984 1985 1986 1987 1988 1989 1990 1991 1992 1993 1994 1995 1996 1997 1998 1999 2000 2001 2002 2003
Mamquam River Catch and EffortSteelhead Harvest Analysis Data (1968 to 2003)
0
50
100
150
200
250C
atch
0
200
400
600
800
1000
1200
1400
Effo
rt (d
ays)
Wild Total Hatchery Total Days Fished
Hat chery Tot al 0 0 0 0 0 0 0 0 0 0 0 0 0 0 2 0 8 3 3 0 0 9 4 4 0 0 0 0 0 12.07 0 0 0 0 0 0
Wild Tot al 37 127 38 56 136 129 197 134 48 67 68 122 67 37 17 43 12 22 14 185 48 207 56 69 38 147 11 64 81 175.1 108.2 40.64 13 41 91 5
Days Fished 376 1315 408 355 891 573 909 612 388 645 457 569 272 312 229 225 39 115 68 309 162 402 268 305 216 424 148 233 393 470.9 649.9 261.4 275 205 150 279
1968 1969 1970 1971 1972 1973 1974 1975 1976 1977 1978 1979 1980 1981 1982 1983 1984 1985 1986 1987 1988 1989 1990 1991 1992 1993 1994 1995 1996 1997 1998 1999 2000 2001 2002 2003
Figure 12

Proj
ect N
o.03
-141
7-02
6
Dra
wn:
BC
S
Rev
iew
ed:
BC
S
Dat
e:05
-13-
05Fi
le L
ocat
ion:
N:\F
INA
L\20
03\1
417\
03-1
417-
026\
FIG
-051
3_05
FIG
UR
ES
12-
14.P
PT
PROJECT
REV.
TITLE
SCALE. NTS
PROJECT No.
DESIGN
CADD
CHECK
REVIEW
TASK No. 1000
PACIFIC SALMON FOUNDATIONSALMON RECOVERY PLAN
SQUAMISH, B.C.
MCM
BCS
BCS
03-1417-026
-
The Number Of Annual Fry/Smolt Releases From The Tenderfoot Hatchery By Species7
7 Data obtained from Tenderfoot Hatchery Website (http://www-heb.pac.dfo-mpo.gc.ca/facilities/tenderfoot/tfoot_e.htm) Figure 13
Chinook Salmon
0
500,000
1,000,000
1,500,000
2,000,000
1982 1985 1988 1991 1994 1997 2000 2003
Release Year
Tota
l Rel
ease
d
Chum Salmon
020,00040,00060,00080,000
100,000120,000140,000160,000
1992 1994 1996 2000 2003
Release Year
Tota
l Rel
ease
d
Coho Salmon
0
100,000
200,000
300,000
400,000
500,000
600,000
700,000
1983 1986 1989 1992 1995 1998 2001Release Year
Tota
l Rel
ease
d
Pink Salmon
0
200,000400,000
600,000
800,0001,000,000
1,200,000
1994 2002
Release Year
Tota
l Rel
ease
d
Steelhead Fry
0
50,000
100,000
150,000
200,000
1982 1984 1986 1988 1990 1992
Release Year
Tota
l Rel
ease
d

Proj
ect N
o.03
-141
7-02
6
Dra
wn:
BC
S
Rev
iew
ed:
BC
S
Dat
e:05
-13-
05Fi
le L
ocat
ion:
N:\F
INA
L\20
03\1
417\
03-1
417-
026\
FIG
-051
3_05
FIG
UR
ES
12-
14.P
PT
PROJECT
REV.
TITLE
SCALE. NTS
PROJECT No.
DESIGN
CADD
CHECK
REVIEW
TASK No. 1000
PACIFIC SALMON FOUNDATIONSALMON RECOVERY PLAN
SQUAMISH, B.C.
MCM
BCS
BCS
03-1417-026
-
North Vancouver Outdoor SchoolHatchery Salmon Production8
8 Data provided by C. Halvorson, pers. comm. November 2004. Figure 14
Coho Salmon
0
10000
20000
30000
40000
50000
60000
70000
1981
1984
1987
1990
1993
1996
1999
2002
Release Year
Tota
l Rel
ease
d
Total Released
Chinook and Pink Salmon
0
1000
2000
3000
4000
5000
6000
1990 1993 1996 1999 2002
Release Year
Tota
l Rel
ease
d
Total Chinook ReleaseTotal Pink Release
Chum Salmon
0
1000
2000
3000
4000
5000
6000
1990 1993 1996 1999 2002
Release Year
Tota
l Rel
ease
d
Total Chinook ReleaseTotal Pink Release

APPENDIX I
LIST OF RECOVERY PLAN PARTICIPANTS
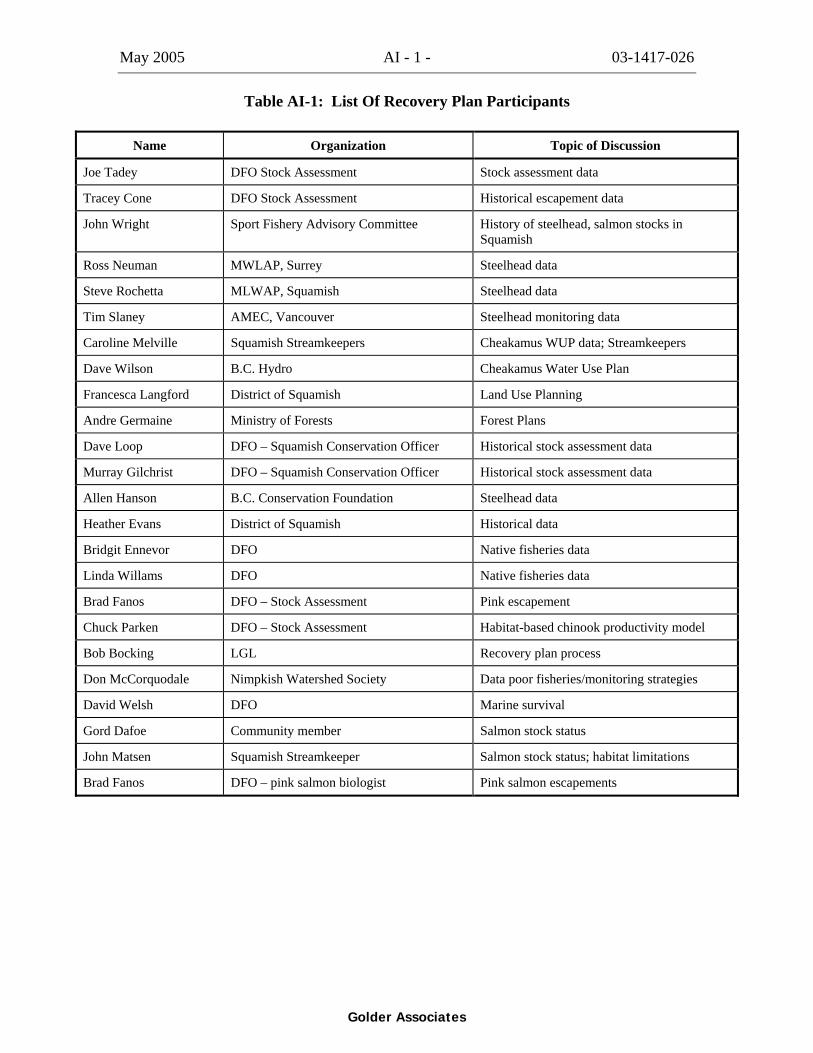
May 2005 AI - 1 - 03-1417-026
Table AI-1: List Of Recovery Plan Participants
Name Organization Topic of Discussion
Joe Tadey DFO Stock Assessment Stock assessment data
Tracey Cone DFO Stock Assessment Historical escapement data
John Wright Sport Fishery Advisory Committee History of steelhead, salmon stocks in Squamish
Ross Neuman MWLAP, Surrey Steelhead data
Steve Rochetta MLWAP, Squamish Steelhead data
Tim Slaney AMEC, Vancouver Steelhead monitoring data
Caroline Melville Squamish Streamkeepers Cheakamus WUP data; Streamkeepers
Dave Wilson B.C. Hydro Cheakamus Water Use Plan
Francesca Langford District of Squamish Land Use Planning
Andre Germaine Ministry of Forests Forest Plans
Dave Loop DFO – Squamish Conservation Officer Historical stock assessment data
Murray Gilchrist DFO – Squamish Conservation Officer Historical stock assessment data
Allen Hanson B.C. Conservation Foundation Steelhead data
Heather Evans District of Squamish Historical data
Bridgit Ennevor DFO Native fisheries data
Linda Willams DFO Native fisheries data
Brad Fanos DFO – Stock Assessment Pink escapement
Chuck Parken DFO – Stock Assessment Habitat-based chinook productivity model
Bob Bocking LGL Recovery plan process
Don McCorquodale Nimpkish Watershed Society Data poor fisheries/monitoring strategies
David Welsh DFO Marine survival
Gord Dafoe Community member Salmon stock status
John Matsen Squamish Streamkeeper Salmon stock status; habitat limitations
Brad Fanos DFO – pink salmon biologist Pink salmon escapements
Golder Associates

APPENDIX II
CURRENT WATER LICENCES BY SYSTEM IN THE SQUAMISH RIVER WATERSHED

May 2005 AII - 1 - 03-1417-026
Golder Associates
Table II-1: Current Water Licences By System In The Squamish River Watershed (As Of July 20, 2004)
System Licencee Purpose Quantity
Cheakamus River Allen, Brian E. Domestic 500 gallons/day
Cheakamus River Fetherstonhaugh, Lyall E. Domestic 500 gallons/day
Cheakamus River Fisheries & Oceans Canada Conservation – Use of Water 15 cubic feet/second
Cheakamus River B.C. Hydro & Power Authority Power – General 2,316.2 cubic feet/second
Cheakamus River Fisheries & Oceans Canada Conservation – Construction Works
10 cubic feet/second
Cheakamus River B.C. Hydro & Power Authority Storage – Power 45,000 acre-feet/annum.
Cheakamus River Fisheries & Oceans Canada Conservation – Construction Works
40 cubic feet/second
Cheakamus River Fulford Lumber Co. Ltd. Domestic 500 gallons/day
Mamquam River Squamish Valley Golf & Country Club
Watering 125 acre-feet/annum
Mamquam River Squamish Valley Golf & Country Club
Watering 110 acre-feet/annum
Mamquam River Canadian Hydro Developers Inc. Power – General 953.49 cubic feet/second
Mamquam River Northern Utilities Inc. Power – General 828.1 cubic feet/second
Mamquam River Northern Utilities Inc. Power – General 918 cubic feet/second
Stawamus River District of Squamish Waterworks Local Authority 912,500,000 gallons/year
Stawamus River Creek Power Inc. Power – General 99 cubic feet/second
High Falls Creek KMC Energy Corp. Power General; Power Storage 137.7 cubic feet/second; 13.78 acre-feet/annum
Ashlu Creek Ministry of Environment, Lands & Parks
Conservation – Construction Works
0 total flow
Ashlu Creek Ledcor Power Inc. Power – General 1,024.12 cubic feet/second
Ashlu Creek Canadian Hydro Developers Inc. Power – General 812 cubic feet/second
Shovelnose Creek Ministry of Environment, Lands & Parks
Conservation – Construction Works
35.33 cubic feet/second
Mashiter Creek District of Squamish Waterworks Local Authority 54,750,000 gallons/year
Mashiter Creek District of Squamish Waterworks Local Authority 766,500,000 gallons/year
Elaho River Canadian Hydro Developers Inc. Power – General; Storage – Power
3,178 cubic feet/second; 160,000 acre-feet/annum
Conroy Creek (trib. of Cheakamus River)
Kella Enterprise Ltd. Domestic 500 gallons/day
Conroy Creek Kella Enterprise Ltd. Power – Residential 3 cubic feet/second

May 2005 AII - 2 - 03-1417-026
Golder Associates
Table II-1: Current Water Licences By System In The Squamish River Watershed (As Of July 20, 2004) (cont’d)
System Licencee Purpose Quantity
Conroy Creek Ledcor Power Inc. Power – General 212 cubic feet/second
Sigurd Creek (trib. of Ashlu Creek)
Ledcor Power Inc. Power – General 84.8 cubic feet/second
Tantalus Creek (trib. of Squamish River
Ledcor Power Inc. Power – General 38.9 cubic feet/second
Cloudburst Creek (trib. of Squamish River)
Oquist, Glen & Allan Domestic; irrigation 500 gallons/day; 8 acre-feet/annum
Cloudburst Creek Gray, Gerald Irrigation 8 acre-feet/annum
Cloudburst Creek Garcia, Ernesto Domestic 500 gallons/day
Cloudburst Creek Oquist, Glen & Allan Domestic 500 gallons/day
Brohm River (trib. of Cheekye River)
577098 BC Ltd. Domestic 1,000 gallons/day
Swift Creek (trib. of Cheakamus River)
Ross, Gordon Domestic 500 gallons/day
Swift Creek Brubacher, Warren & Janice Domestic 500 gallons/day
Swift Creek Ross, Gordon Power – Residential 1.5 cubic feet/second
Swift Creek Tretheway, Donna Domestic; Irrigation 500 gallons/day; 7 acre-feet/annum
Swift Creek Tretheway, Donna Power – Residential 1.25 cubic feet/second
Raffuse Creek (trib. of Mamquam River)
Pamawed Resources Ltd. Power – General 84 cubic feet/second
Rubble Creek (trib. of Cheakamus River)
KMC Energy Corp. Power – General 1 cubic foot/second
Ring Creek (trib. of Mamquam River)
Ring Creek Power Ltd. Power – General 106 cubic feet/second
Culliton Creek (trib. of Cheakamus River
Pamawed Resources Ltd. Power – General 211.9 cubic feet/second
Culliton Creek Ledcor Power Inc. Power – General 212 cubic feet/second
Cheekye River Dittus, Andre Domestic 500 gallons/day
Roaring Creek (trib. of Ashlu Creek)
Slims’ Exploration Co. Ltd. Power – Commercial 1.07 cubic feet/second
Roaring Creek Slims’ Exploration Co. Ltd. Power – Commercial 10 cubic feet/second
Chance Creek (trib. of Cheakamus River)
Fulford Lumber Co. Ltd. Domestic 500 gallons/day
Dryden Creek Drage, Melvyn & Irene Domestic 1,000 gallons/day
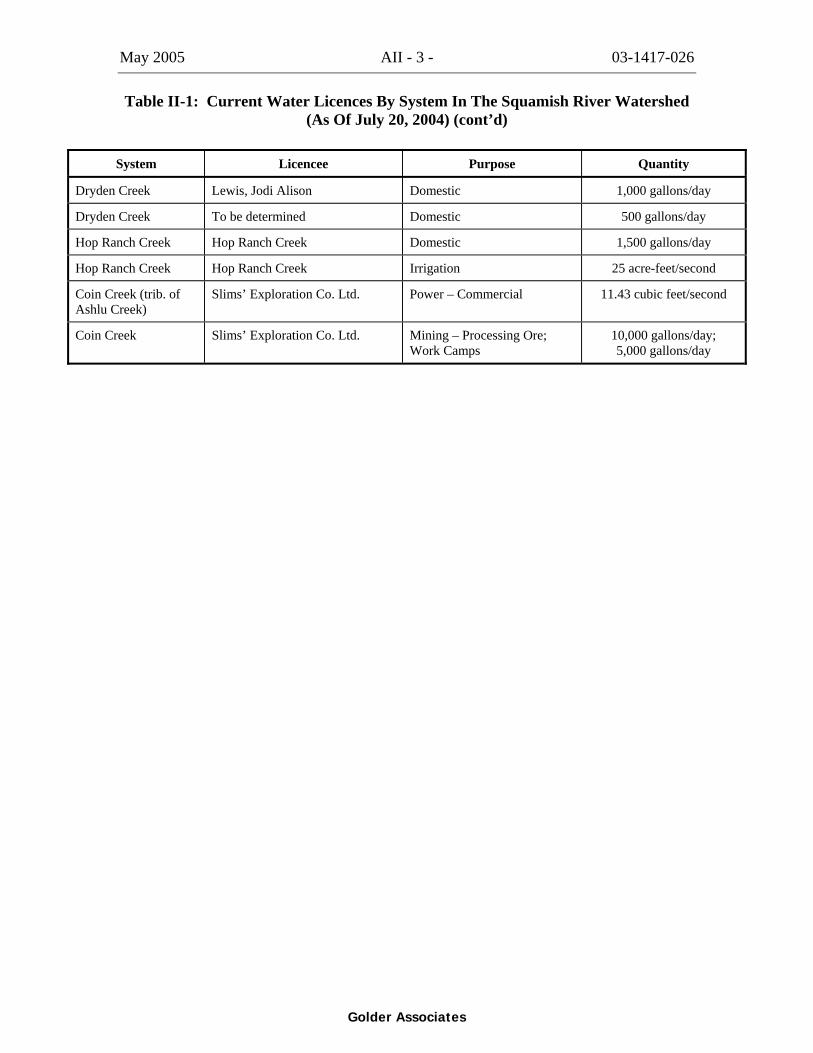
May 2005 AII - 3 - 03-1417-026 Table II-1: Current Water Licences By System In The Squamish River Watershed
(As Of July 20, 2004) (cont’d)
System Licencee Purpose Quantity
Dryden Creek Lewis, Jodi Alison Domestic 1,000 gallons/day
Dryden Creek To be determined Domestic 500 gallons/day
Hop Ranch Creek Hop Ranch Creek Domestic 1,500 gallons/day
Hop Ranch Creek Hop Ranch Creek Irrigation 25 acre-feet/second
Coin Creek (trib. of Ashlu Creek)
Slims’ Exploration Co. Ltd. Power – Commercial 11.43 cubic feet/second
Coin Creek Slims’ Exploration Co. Ltd. Mining – Processing Ore; Work Camps
10,000 gallons/day; 5,000 gallons/day
Golder Associates

APPENDIX III
LIST OF RECREATIONAL OUTFITTERS IN THE SQUAMISH RIVER WATERSHED

May 2005 AIII - 1 - 03-1417-026
Golder Associates
Table III-1: Recreational Outfitters In The Squamish Watershed
Company Type of Activity
Ocean West Expeditions Ltd. Kayaking
River’s End Kayaks Kayaking
Sage Wilderness Experiences Kayaking/Ski touring
Squamish Kayak & Adventure Centre Kayaking/Canoeing
Squamish Whitewater Rafters Rafting
Elaho River Adventures Kayaking/Rafting/Fishing
Rivers & Oceans Expeditions Inc. Kayaking/Rafting/Fishing
Sea to Sky Ocean Sports Kayaking/Rafting/Fishing
Squamish Yacht Club Kayaking/Rafting/Fishing
Sea to Sky Kayak Centre Kayaking/Rafting/Fishing
Rivers Edge Sport Fishing Outfitters Ltd. Kayaking/Rafting/Fishing
Garibaldi Eco Adventure Centre Camping/Hiking/Biking/Kayaking/Climbing/Rafting
Sea to Sky Ocean Sports Fishing/Diving/Kayaking/Windsurfing/Snorkelling
Da-epic Adventure Company Hiking/Canoeing/Camping
Black Tusk Snowmobile Club Snowmobiling
The Tantalus Bike Shop Biking
Squamish Off Road Cycling Association Biking
Corsa Bike Shop Biking
Furry Creek Golf & Country Club Golfing
Garibaldi Springs Golf Resort Golfing
Squamish Valley Golf & Country Club Golfing
Canada West Mountain School Inc. Climbing
Climbon Equipment Climbing
Sierra Climbing Guides Climbing
Slipstream Rock & Ice Climbing
Squamish Rock Guides Ltd. Climbing
Vertical Reality Sports Store Climbing
Wild Rock Adventures Climbing
Vertical Reality Sports Store Climbing/Mountain Biking
Sunwolf Outdoor Centre Rafting/Eagle Viewing/Salmon Viewing
Canadian Outback Adventure Company Kayaking/Rafting/Fishing/Eagle Viewing

May 2005 AIII - 2 - 03-1417-026
Golder Associates
Table III-1: Recreational Outfitters in the Squamish Watershed (cont’d)
Company Type of Activity
Black Tusk Helicopter Inc. Air Tours and Charters
Blackcomb Helicopters Inc. Air Tours and Charters
Coastal Mountain Air Air Tours and Charters
Glacier Air Air Tours and Charters
Helivision Sport Inc. Air Tours and Charters
Omega Aviation Air Tours and Charters