Embed Size (px)
Citation preview

Authored by: AVINASH KUMAR SINGH
COMPANY: PAXCEL TECHNOLOGIES PVT.LTD
SQL SERVER REPORTING
SERVICES 2012 (POWER VIEW)
INSTALLATION AND CONFIGURATION

1
SQ
L S
ER
VE
R R
EP
OR
TIN
G S
ER
VIC
ES
20
12
(P
OW
ER
VIE
W)
SQL SERVER REPORTING SERVICES
2012 (POWER VIEW))
WHAT’S NEW IN SSRS 2012?
SQL Server 2008 R2 was an exciting release for Reporting Services. It gave us features
such as:
- Shared Data Sets
- Report Parts
- New Visualization, including spatial visualizations
There’s are also significant changes and new features to SSRS 2012 – but a some of these
can only be materialized if you are using SSRS 2012 integrated in SharePoint 2010.
Nonetheless these are still pretty exciting changes, and can change the landscape of
reporting for our end users (read: more Self Service BI):
Power View
Power View, a feature of SQL Server 2012 Reporting Services Add-in for Microsoft
SharePoint Server 2010 Enterprise Edition, is an interactive data exploration, visualization,
and presentation experience. It provides drag-and-drop ad hoc reporting for business users
such as data analysts, business decision makers, and information workers. Power View
reports are in a new file format, RDLX.
Power View expands on the self-service BI capabilities delivered with PowerPivot for
Excel and PowerPivot for SharePoint by enabling customers to visualize and interact with
modeled data in a meaningful way, using interactive visualizations, animations, and smart
querying. It is a browser-based Silverlight application launched from within SharePoint
Server 2010 that enables users to present and share insights with others in their organization
through interactive presentations.
Based on Tabular Models
With Power View, customers start from an SQL Server 2012 Analysis Services (SSAS)
tabular model to build their reports. Tabular models use metadata to present an underlying
data source to end users, with predefined relationships and behaviors, in terms they
understand.

2
SQ
L S
ER
VE
R R
EP
OR
TIN
G S
ER
VIC
ES
20
12
(P
OW
ER
VIE
W)
Coexists with Report Builder
Power View does not replace Report Builder, the report authoring tool for richly designed
operational reports. Power View addresses the need for Web-based, ad hoc reporting. It co-
exists with the latest version of Report Builder, which also ships in SQL Server 2012.
SharePoint Mode
SharePoint integration has been re-architected to greatly improve the SharePoint IT
administrator experience, the end user experience, and supportability. The new architecture
is implemented as a SharePoint 2010 shared service. The shared service architecture allows
Reporting Services to leverage many of the IT features of SharePoint products. The
following is a list of some of the benefits from this release:
Configuration of Reporting Services SharePoint mode is now completely supported
through SharePoint Central Administration using management pages for Reporting
Services service applications or using Reporting Services SharePoint mode
PowerShell cmdlets.
Important
Reporting Services Configuration Manager no longer supports Reporting Services
SharePoint mode. Configuration of SharePoint mode is completed using SharePoint
Central Administration.
Leverage SharePoint scale-out functionality for Reporting Services Service
Applications.
The new Reporting Services shared service is hosted in SharePoint Shared Service
Application pool.
The new Reporting Services service applications support Claims based
authentication.
SharePoint cross-farm support for viewing reports.
Support for SharePoint backup and recovery and end-to-end SharePoint ULS
logging.
Data Alerts
Reporting Services data alerts are a data-driven alerting solution that informs you about
changes in report data that are of interest to you, and at a relevant time.
Imagine a sales report that contains information such as year-to-day sales, average monthly
sales, and sales targets for sales persons by territory. As a sales person, you would like to
know how you are doing. By creating a data alert on the sales report, you can receive
messages whenever year-to-date sales exceed or fall below a specified value or contain data

3
SQ
L S
ER
VE
R R
EP
OR
TIN
G S
ER
VIC
ES
20
12
(P
OW
ER
VIE
W)
that you consider noteworthy. Rules in the data alert definition specify the data values to
trigger the data alert. By using AND, OR operators in the rules you can combine many
clauses into complex rules that define precisely the report data values you want to be
notified of.
In some cases, the presence of any data in a report is of interest. For example, a report that
lists cancelled orders becomes interesting when the first cancellation occurs. You can create
data alerts on reports in which the presence of data, rather than specific data values, is
important.
Data alerts messages are sent by email. Depending on the importance of the information,
you can choose to send alert messages more or less frequently and only when results
change. You can specify multiple recipients for the alert messages and this way keep others
informed and enhance efficiency and collaboration. If you want to send alert messages
immediately, you can run data alerts directly instead of waiting for them to run
automatically at the scheduled time.
The following summarizes the key areas of data alerting:
Define and save data alert definitions—User views a report, adds a data alert,
creates rules that identify interesting data values, defines recurrence patterns for
sending the alert, and specifies the recipients of the data alert message.
Run data alert definitions—Alerting service runs data alert definitions at a
scheduled time, retrieves report data, and triggers data alerts based on the rules in
the alert definition.
Deliver data alert messages to recipients—Alerting service creates an alert instance
and sends data alert messages by email to recipients.
Data alerts provide the following tools for creating and managing data alert instances and
definitions:
Data Alert Designer—Users create and edit data alert definitions.
Data Alert Manager for users—Users view information about their data alerts,
delete their data alert definitions, or open alert definitions for editing.
Data Alert Manager for alerting administrators—Alerting administrators view a list
of data alerts created by all users on the SharePoint site and delete alerts.
Report Server Projects in SQL Server Data Tools for Visual Studio
In SQL Server 2012, SQL Server Data Tools (SSDT) is an add-in to Visual Studio. Report
server projects created in SQL Server 2008 R2 can be opened directly into SQL Server
Data Tools (SSDT). Projects created in SQL Server 2008 are automatically upgraded when
opened in SQL Server Data Tools (SSDT). For ease of managing your existing and new
report server projects, you can continue to add projects created in SQL Server 2008 R2 and
SQL Server 2008 to a SQL Server 2012 business intelligence solution.

4
SQ
L S
ER
VE
R R
EP
OR
TIN
G S
ER
VIC
ES
20
12
(P
OW
ER
VIE
W)
You can also continue to open and edit reports that use the 2005 and 2008 RDL schemas in
SQL Server Data Tools (SSDT). However, if you add a report item that is not compatible
with the schema used by a report, the report will be automatically upgraded to the 2010
RDL schema.
Excel Renderer for Microsoft Excel 2007-2010 and Microsoft Excel 2003
The Reporting Services Excel rendering extension, new in SQL Server 2012, renders a
report as an Excel document that is compatible with Microsoft Excel 2007-2010 as well as
Microsoft Excel 2003 with the Microsoft Office Compatibility Pack for Word, Excel, and
PowerPoint installed. The format is Office Open XML and the file extension is XLSX.
This Excel-rendering extension removes limitations of the earlier version, compatible with
Excel 2003. The following lists the improvement in the rendering extension:
Maximum rows per worksheet is 1,048,576.
Maximum columns per worksheet is 16,384.
Number of colors allowed in a worksheet is approximately 16 million (24-bit color).
ZIP compression provides smaller files sizes.
Word Renderer for Microsoft Word 2007-2010 and Microsoft Word 2003
The Reporting Services Word rendering extension, new in SQL Server 2012, renders a
report as a Word document that is compatible with Microsoft Word 2007-2010 as well as
Microsoft Word 2003 with the Microsoft Office Compatibility Pack for Word, Excel, and
PowerPoint installed. The format is Office Open XML and the file extension is DOCX.
In addition to making the features that are new in Word 2007-2010 available to exported
reports, *.docx files of exported reports tend to be smaller. Reports exported by using the
Word renderer are typically significantly smaller than the same reports exported by using
the Word 2003 renderer.
STEP BY STEP INSTALLATION AND CONFIGURATION
SHAREPOINT WITH SQL 2012 POWERPIVOT, POWERVIEW AND
REPORTING SERVICES.
PREREQUISTES: SharePoint Server 2010, SQL Server 2012, PowerPivot add in for
MS Office, Windows Server 2008 R2 standard.
1. Install Windows Server 2008 R2 Standard edition and configure a domain
controller on the Windows Server.

5
SQ
L S
ER
VE
R R
EP
OR
TIN
G S
ER
VIC
ES
20
12
(P
OW
ER
VIE
W)
2. Install Share point 2010 Pre-requisites from the installer as shown in the
following in snapshots

6
SQ
L S
ER
VE
R R
EP
OR
TIN
G S
ER
VIC
ES
20
12
(P
OW
ER
VIE
W)
3. After the pre-requisites are installed restart your server. Again go the
installer and install share-point on the server.
4. Enter the product key of share-point server

7
SQ
L S
ER
VE
R R
EP
OR
TIN
G S
ER
VIC
ES
20
12
(P
OW
ER
VIE
W)
5. Accept the license terms and condition of the Microsoft
6. Install share point server in the server Farm mode as shown below .

8
SQ
L S
ER
VE
R R
EP
OR
TIN
G S
ER
VIC
ES
20
12
(P
OW
ER
VIE
W)
7. After the installation is complete it will ask for running configuration wizard skip that by
unchecking the text box.
8. After this step install share point service pack.
9. Now install SQL-Server 2012, click on the installer choose option of stand- alone server
And follow the following steps as shown

9
SQ
L S
ER
VE
R R
EP
OR
TIN
G S
ER
VIC
ES
20
12
(P
OW
ER
VIE
W)
10. Choose select all option of the SQL Server which install all feature of the SQL Server
2012 as shown
11. Choose default instance id for this instance

10
SQ
L S
ER
VE
R R
EP
OR
TIN
G S
ER
VIC
ES
20
12
(P
OW
ER
VIE
W)
12. Configure the server in the mixed mode authentication although in best practices we
have to configure it in windows authentication mode but here we have configured it in
the mixed mode add the current user by clicking add current user button and click next
13. In analysis services configuration choose multidimensional and data mining mode and
click add current user button to add user for the analysis services as shown below

11
SQ
L S
ER
VE
R R
EP
OR
TIN
G S
ER
VIC
ES
20
12
(P
OW
ER
VIE
W)
14. On reporting services configuration mode choose to install and configure SQL Server in
the native mode and chose reporting services in share point integrated mode as shown
15. Specify the user for the distributed replay controller by clicking on the add current user
button which will add the user

12
SQ
L S
ER
VE
R R
EP
OR
TIN
G S
ER
VIC
ES
20
12
(P
OW
ER
VIE
W)
16. Add the controller name ,Working directory and result directory for distributed replay
client configuration
17. Click on the check box for sending error reports to Microsoft as shown

13
SQ
L S
ER
VE
R R
EP
OR
TIN
G S
ER
VIC
ES
20
12
(P
OW
ER
VIE
W)
18. After this step set will run installation and configuration rules as shown
19. You are now ready to install please verify your SQL Server 2012 features here and click
next

14
SQ
L S
ER
VE
R R
EP
OR
TIN
G S
ER
VIC
ES
20
12
(P
OW
ER
VIE
W)
20. Setup will now install the features now as shown
21. Now after this step you installation is complete and you will get will installation
summary after installation is completed .It is recommended that you restart the server
after this step .

15
SQ
L S
ER
VE
R R
EP
OR
TIN
G S
ER
VIC
ES
20
12
(P
OW
ER
VIE
W)
22. Now after this we will perform another installation of new Instance of SQL Server in
which we will install SQL Server Analysis Services in Tabular Mode by selecting new
installation in the option of SQL Server 2012 as shown
23. In the setup role choose the first option i.e. SQL Server feature as shown below

16
SQ
L S
ER
VE
R R
EP
OR
TIN
G S
ER
VIC
ES
20
12
(P
OW
ER
VIE
W)
24. In feature selection check analysis services on the check box
25. In the instance configuration wizard name it Tabular and click on the Next button

17
SQ
L S
ER
VE
R R
EP
OR
TIN
G S
ER
VIC
ES
20
12
(P
OW
ER
VIE
W)
26. It will compute disk space requirements and after that will ask for the service accounts
which will authenticate user
27. After that it will ask for the analysis services configuration choose here tabular mode

18
SQ
L S
ER
VE
R R
EP
OR
TIN
G S
ER
VIC
ES
20
12
(P
OW
ER
VIE
W)
28. Click on the check box for sending the error report to the Microsoft as shown
29. Set will run Installation configuration rules and now you are ready to install the analysis
services in tabular mode
19
SQ
L S
ER
VE
R R
EP
OR
TIN
G S
ER
VIC
ES
20
12
(P
OW
ER
VIE
W)
30. Setup is now complete for analysis services in tabular mode.
31. Now we will perform installation of another instance of the SQL Server by clicking
perform new installation of the SQL server

20
SQ
L S
ER
VE
R R
EP
OR
TIN
G S
ER
VIC
ES
20
12
(P
OW
ER
VIE
W)
32. Now in the setup role click on the 2nd option SQL Server Power Pivot for Share Point.
Leave the textbox unchecked as we have already configured SQL Server Relational
database engine and click on the next button
33. Now in the feature selection everything is automatically checked you have to just click
on the next button.

21
SQ
L S
ER
VE
R R
EP
OR
TIN
G S
ER
VIC
ES
20
12
(P
OW
ER
VIE
W)
34. Setup will configure installation rules and after that ask for instance name ,Name this
instance as POWERPIVOT as shown
35. After this step set will configure disk space requirements and then will ask for user
configuration as shown in the snap-shot.
22
SQ
L S
ER
VE
R R
EP
OR
TIN
G S
ER
VIC
ES
20
12
(P
OW
ER
VIE
W)
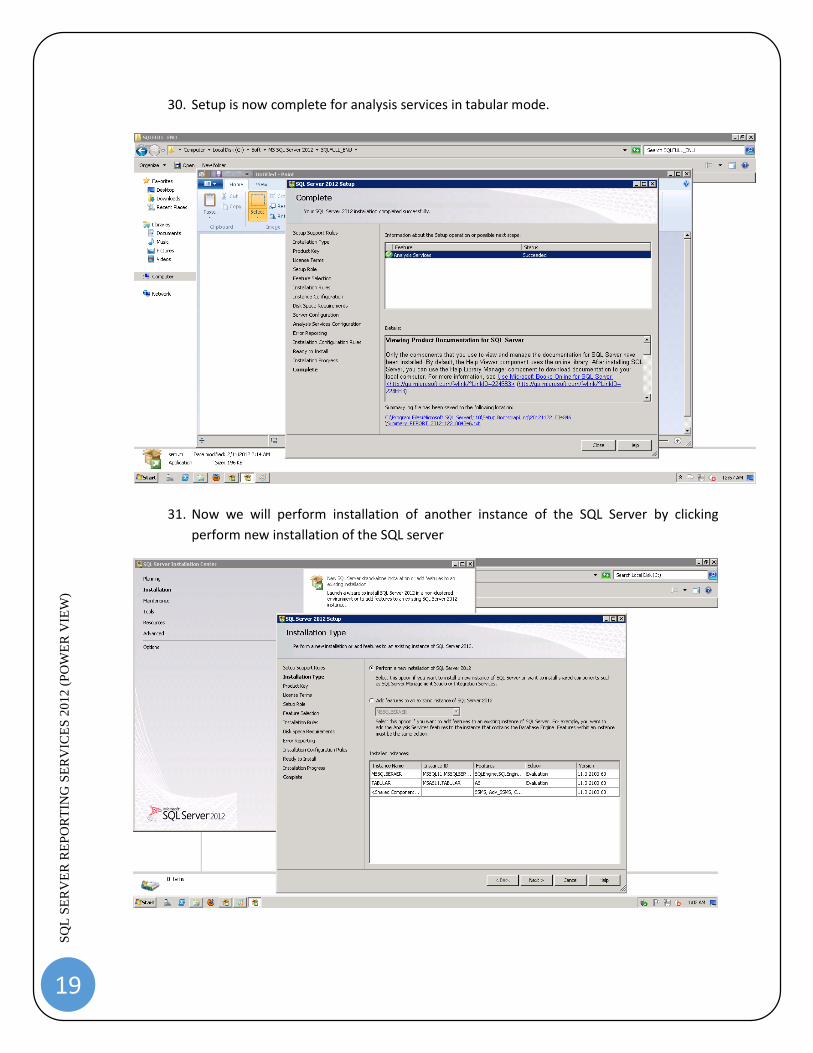
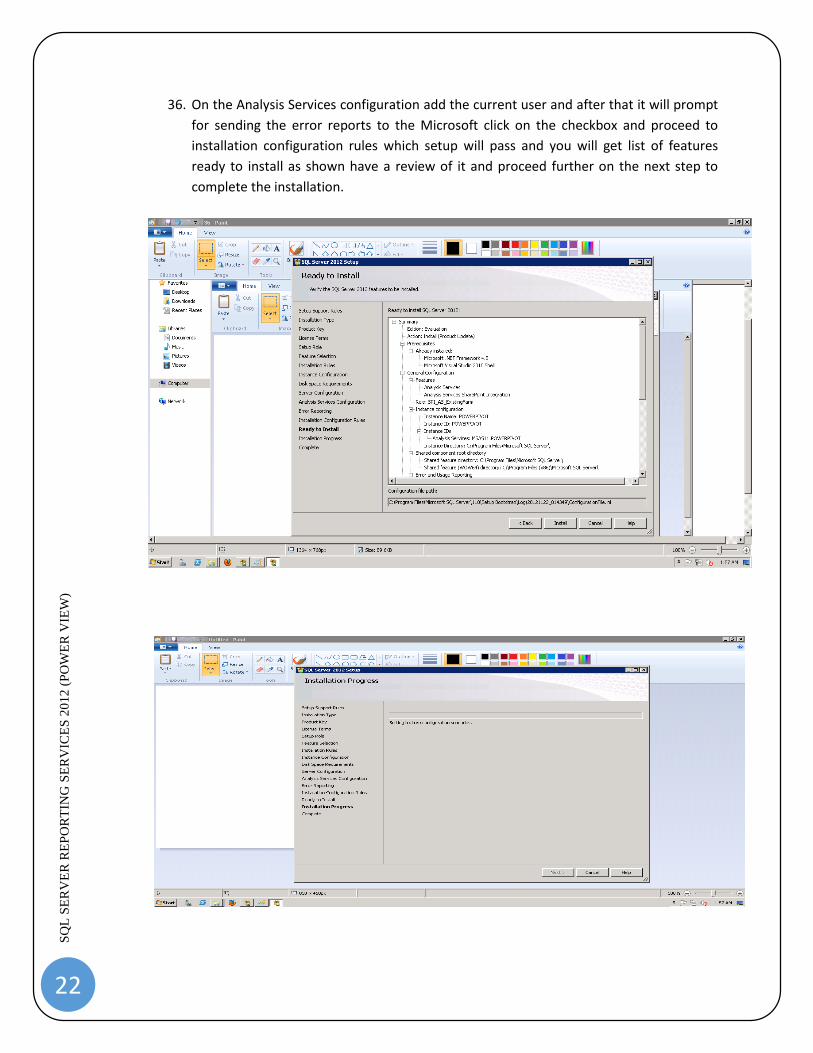
36. On the Analysis Services configuration add the current user and after that it will prompt
for sending the error reports to the Microsoft click on the checkbox and proceed to
installation configuration rules which setup will pass and you will get list of features
ready to install as shown have a review of it and proceed further on the next step to
complete the installation.

23
SQ
L S
ER
VE
R R
EP
OR
TIN
G S
ER
VIC
ES
20
12
(P
OW
ER
VIE
W)
37. Now after this step your installation is complete just few configurations and we are
ready to go with power view. Now go to the start button and run the PowerPivot
configuration Tool as shown add the database server and prophase password and other
authentication for configuring PowerPivot

24
SQ
L S
ER
VE
R R
EP
OR
TIN
G S
ER
VIC
ES
20
12
(P
OW
ER
VIE
W)
38. Now after entering the required fields validate your inputs and after successful
validation by the configuration wizard click on the run button to configure PowerPivot.
39. Now go to the start button and click on the run the option open it as administrator and
run the following command as shown in the snap shot
Now navigate to the following folder in cmd mode
cd C:\Program Files\Common Files\Microsoft Shared\Web Server Extensions\14\BIN
Run the following command:
PSConfig.exe -cmd upgrade -inplace b2b -force -cmd applicationcontent -install -cmd
installfeatures

25
SQ
L S
ER
VE
R R
EP
OR
TIN
G S
ER
VIC
ES
20
12
(P
OW
ER
VIE
W)
40. It will install share point Central Administration web content files.

26
SQ
L S
ER
VE
R R
EP
OR
TIN
G S
ER
VIC
ES
20
12
(P
OW
ER
VIE
W)
41. Now go to the SharePoint Management shell on the start menu and run it as
administrator.
42. Now run the following command in the shell
Install-SPRSService
Install-SPRSServiceProxy
Get-SPServiceInstance -all |where {$_.TypeName -like "SQL Server Reporting*"}
| Start-SPServiceInstance

27
SQ
L S
ER
VE
R R
EP
OR
TIN
G S
ER
VIC
ES
20
12
(P
OW
ER
VIE
W)
43. Now click on the central administration console link in share point tab of start menu. It
will ask for authentication Put in here administrator username and password
44. After this page will be redirected on Central Administration console of the share point
server 2010 as shown below navigate to the application management
28
SQ
L S
ER
VE
R R
EP
OR
TIN
G S
ER
VIC
ES
20
12
(P
OW
ER
VIE
W)
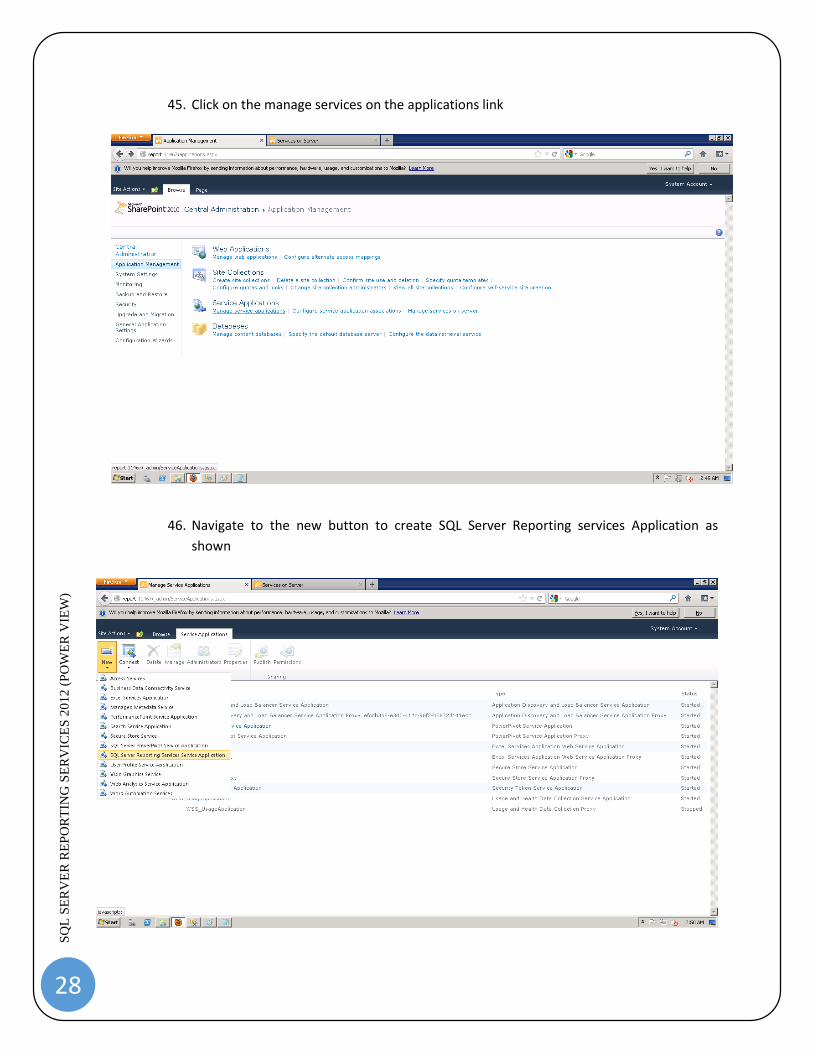
45. Click on the manage services on the applications link
46. Navigate to the new button to create SQL Server Reporting services Application as
shown

29
SQ
L S
ER
VE
R R
EP
OR
TIN
G S
ER
VIC
ES
20
12
(P
OW
ER
VIE
W)
47. Create the SQL Server reporting service application by defining its service application
pool name ,Data-Base Server name, the required authentication for accessing database
and the most important thing web application association click on the check box of
share-point http://report to run the power view as shown below

30
SQ
L S
ER
VE
R R
EP
OR
TIN
G S
ER
VIC
ES
20
12
(P
OW
ER
VIE
W)
48. Click on the Ok Button share point will take while to create a SQL Server Reporting
Services Service Application
49. Click on the ok button and navigate to the Central administration console -> Application
Management -> Create Site collection as shown

31
SQ
L S
ER
VE
R R
EP
OR
TIN
G S
ER
VIC
ES
20
12
(P
OW
ER
VIE
W)
50. Create a power pivot site as for e.g. we have created a site named test, in template
selection select a power pivot site give the administrator id on the primary site
collection administrator option as shown and click on the ok button this will create a
PowerPivot site .
51. This will create the top level site successfully navigate to the site link.

32
SQ
L S
ER
VE
R R
EP
OR
TIN
G S
ER
VIC
ES
20
12
(P
OW
ER
VIE
W)
52. Again it will prompt for id password give the required authentication.
53. After that you will redirected to your site home page navigate to the PowerPivot gallery
as shown

33
SQ
L S
ER
VE
R R
EP
OR
TIN
G S
ER
VIC
ES
20
12
(P
OW
ER
VIE
W)
54. If you have not installed Silverlight it will prompt you to install silver light as shown
55. After installing silver light navigate to the library at the top of the menu bar and then to
the library settings as shown below

34
SQ
L S
ER
VE
R R
EP
OR
TIN
G S
ER
VIC
ES
20
12
(P
OW
ER
VIE
W)
56. Navigate on the advanced setting option as shown
57. Here we have selected all content types of the library documents just for e.g.
mainly we require to select BI Sematic model connection after adding the required
content types click on the ok button.
35
SQ
L S
ER
VE
R R
EP
OR
TIN
G S
ER
VIC
ES
20
12
(P
OW
ER
VIE
W)
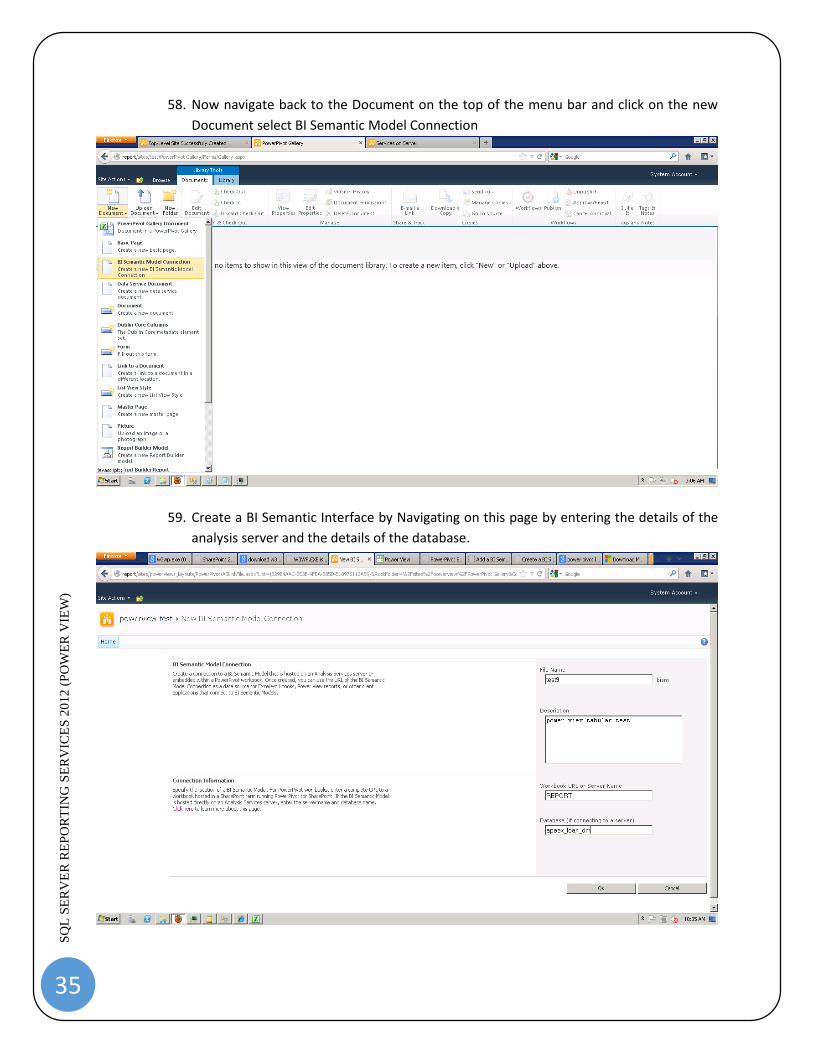
58. Now navigate back to the Document on the top of the menu bar and click on the new
Document select BI Semantic Model Connection
59. Create a BI Semantic Interface by Navigating on this page by entering the details of the
analysis server and the details of the database.

36
SQ
L S
ER
VE
R R
EP
OR
TIN
G S
ER
VIC
ES
20
12
(P
OW
ER
VIE
W)
60. If your database not on the analysis server then we need to work around for running
power view .Install PowerPivot add in for Microsoft Office and follow the following steps
as shown in the screen shot respectively. Open excel and navigate to the PowerPivot
menu click on the PowerPivot Window and navigate to the from SQL Server.

37
SQ
L S
ER
VE
R R
EP
OR
TIN
G S
ER
VIC
ES
20
12
(P
OW
ER
VIE
W)
61. Choose you database from the list.

38
SQ
L S
ER
VE
R R
EP
OR
TIN
G S
ER
VIC
ES
20
12
(P
OW
ER
VIE
W)
62. In this case we have selected all the tables as shown
63. Click on the finish button which will import the entire database in a sheet

39
SQ
L S
ER
VE
R R
EP
OR
TIN
G S
ER
VIC
ES
20
12
(P
OW
ER
VIE
W)
64. Save the sheet and upload on the PowerPivot site by navigating in the Power Pivot
Gallery -> Upload document as shown
65. Upload the doc excel file.

40
SQ
L S
ER
VE
R R
EP
OR
TIN
G S
ER
VIC
ES
20
12
(P
OW
ER
VIE
W)
66. It will prompt for content type choose BI Sematic Model Connection add name and title
of the document in textbox specified and click ok this will publish your document on
your site in PowerPivot Gallery as shown
67. Click on the Create Power View Report Link as shown in the above image that will
redirect the page on the power view link

41
SQ
L S
ER
VE
R R
EP
OR
TIN
G S
ER
VIC
ES
20
12
(P
OW
ER
VIE
W)

42
SQ
L S
ER
VE
R R
EP
OR
TIN
G S
ER
VIC
ES
20
12
(P
OW
ER
VIE
W)
68. Here is the sample report generated by Power View which in full screen mode you can
attach this file to the power point also for presentation purpose .
Note: This installation and configuration steps are bit lengthy and tricky but once you are complete with
the configuration you can create numerous users in your site and create BI Dash-Board were user can
create, edit, update reports in a very simple and easy manners and it just takes minutes to generate
reports using power view tools .