Embed Size (px)
Citation preview
NeuroImage 88 (2014) 79–90
Contents lists available at ScienceDirect
NeuroImage
j ourna l homepage: www.e lsev ie r .com/ locate /yn img
Spurious group differences due to head motion in a diffusion MRI study
Anastasia Yendiki a,⁎, Kami Koldewyn b, Sita Kakunoori a, Nancy Kanwisher b, Bruce Fischl a,c
a Athinoula A. Martinos Center for Biomedical Imaging, Department of Radiology, Massachusetts General Hospital, Harvard Medical School, Boston, MA, USAb Department of Brain and Cognitive Sciences, Massachusetts Institute of Technology, Cambridge, MA, USAc Computer Science and Artificial Intelligence Laboratory, Massachusetts Institute of Technology, Cambridge, MA, USA
⁎ Corresponding author.E-mail address: [email protected] (A. Y
1053-8119/$ – see front matter © 2013 Elsevier Inc. All rihttp://dx.doi.org/10.1016/j.neuroimage.2013.11.027
a b s t r a c t
a r t i c l e i n f oArticle history:Accepted 14 November 2013Available online 21 November 2013
Keywords:Diffusion MRITractographyMotionAutism
Diffusion-weighted MRI (DW-MRI) has become a popular imaging modality for probing the microstructuralproperties of white matter and comparing them between populations in vivo. However, the contrast inDW-MRI arises from the microscopic random motion of water molecules in brain tissues, which makes itparticularly sensitive to macroscopic head motion. Although this has been known since the introductionof DW-MRI, most studies that use this modality for group comparisons do not report measures of head motionfor each group and rely on registration-based correction methods that cannot eliminate the full effects of headmotion on the DW-MRI contrast. In this work we use data from children with autism and typically developingchildren to investigate the effects of headmotion on differences in anisotropy and diffusivity measures betweengroups. We show that group differences in headmotion can induce group differences in DW-MRImeasures, andthat this is the case even when comparing groups that include control subjects only, where no anisotropy ordiffusivity differences are expected. We also show that such effects can be more prominent in some white-matter pathways than others, and that they can be ameliorated by including motion as a nuisance regressor inthe analyses. Our results demonstrate the importance of taking head motion into account in any populationstudy where one group might exhibit more head motion than the other.
© 2013 Elsevier Inc. All rights reserved.
Introduction
Diffusion-weighted MRI (DW-MRI) encodes information on thedirection and speed of the diffusion of water molecules in the intensityvalues of the acquired images. In neuroimaging this has become a toolfor inferring the local orientation of white-matter (WM) pathways atevery voxel in the brain, as well as deriving measures of diffusivity andanisotropy that are thought to reflect the local structure and integrity ofthose pathways. These measures have been used to follow progressivechanges in the brain across the lifespan (Yoshida et al., 2013; Salat, inpress) and to study the effects of a variety of conditions, includingAlzheimer's disease (Stebbins and Murphy, 2009), Huntington's disease(Bohanna et al., 2008), Parkinson's disease (Cochrane and Ebmeier,2013), multiple sclerosis (Inglese and Bester, 2010), schizophrenia(Kubicki et al., 2007), and autism (Travers et al., 2012).
However, the populations compared in such studies may differ notonly in terms ofWM structure, but also in how likely they are to exhibithead motion during the scan. Remaining still in the scanner may bemore challenging for some age groups than others. It may also bemore challenging for subjects with one of the aforementioned disordersthan control subjects. This can make group comparisons of measuresderived from DW-MRI scans problematic. Subject motion during the
endiki).
ghts reserved.
acquisition of a DW-MRI series will not only result in misalignmentbetween the images in the series; but can also alter the intensity valuesin the images, because motion during the diffusion-encoding gradientpulses leads to attenuation of the image intensity. That is, the veryphenomenon that gives rise to the DW-MRI contrast is also whatmakes it particularly sensitive to subject motion. Signal attenuationdue to macroscopic headmotion can confound the measurement of in-terest, which is signal attenuation due tomicroscopic randommotion ofwater molecules in tissues. If a subject moves only during the applica-tion of one diffusion-encoding gradient, this can give the appearanceof preferential diffusion in the direction of that gradient and lead to anoverestimation of diffusion anisotropy. If a subject moves randomlythroughout the scan, this can reduce the contrast between diffusiondirections and lead to an underestimation of diffusion anisotropy.
The deleterious effects of head motion on DW-MRI have been knownsince the early days of its application to neuroimaging (Anderson andGore, 1994). However, the issue has received surprisingly little attentionin the numerous DW-MRI studies of clinical populations that have beenpublished since then. It is common to realign the images in a DW-MRIseries to each other (Andersson and Skare, 2002; Rohde et al., 2004).This will mitigate motion artifacts but not remove them completely, andmost studies do not report the levels of detectedmotion by group. For ex-ample, 48 studies of autism spectrum disorders (ASD) that use DW-MRIare reviewed in Travers et al. (2012). Almost all of these studies report sig-nificant differences in diffusionmeasures between subjects with ASD and

80 A. Yendiki et al. / NeuroImage 88 (2014) 79–90
control subjects. However, onlyfive of the studies evaluate somemeasurerelated to head motion for each group and report that it is comparablebetween groups.
In this work, we use data collected from children with ASD andtypically developing (TD) children to investigate the effects of headmotion on measures of anisotropy and diffusivity derived fromDW-MRI and tractography. We show that group differences in suchmeasures can increase substantially for small increases in the differencein head motion between groups. This is the case not only when thegroups being compared are children with ASD vs. TD children, butalso when both groups include TD children only. We also show thatDW-MRI findings may be more sensitive to head motion for someWM pathways than others. Our results have implications not only forautism studies but for a wide range of neurological and psychiatric ap-plicationswhere the population under study and the control populationare likely to exhibit different levels of head motion.
Materials and methods
Data acquisition
All MRI data was collected at the Massachusetts Institute ofTechnology, using a Siemens 3 T Magnetom Tim Trio scanner (Siemens,Erlangen, Germany) with a custom-made 32-channel pediatrichead coil (Keil et al., 2011). All sessions included DW images andT1-weighted images.
The DW images were acquired using a conventional 2D spin-echoecho-planar imaging (EPI) sequence. The series included 30 imagesacquired with diffusion weighting along non-colinear directions(b = 700 s ⋅ mm−2), and 10 images acquired without diffusionweighting (b = 0). The acquisition parameters were: 2 mm isotropicresolution, matrix size 128 × 128, number of slices ranging from 52 to74 and chosen for full brain coverage, no inter-slice gap, TE = 84ms,TR ranging from 8.04 s to 14.18 s depending on the number of slices,BW = 1395 Hz/px, and GRAPPA acceleration factor 2.
The T1-weighted images were acquired using a 3D multi-echomagnetization-prepared gradient echo (MP-RAGE) sequence withprospective motion correction (van der Kouwe et al., 2008; Tisdall et al.,2012). The acquisition parameters were: 1 mm isotropic resolution,192 × 192 × 176 image matrix, 12 echos with minimum TE = 1.64 msand maximum TE = 27 ms, TR = 2.53 s, BW = 651 Hz/pixel, flipangle 7°, and GRAPPA acceleration factor 3.
Participants
The data described above was collected for 112 children, 50 in theASD group and 62 in the TD group. Several of the subjects were scannedtwice, leading to a total of 165 scans. The subjects' ages were 5–12 years.Their non-verbal IQ was evaluated using the Kaufman brief intelligencetest II (Kaufman and Kaufman, 2004). All subjects included in the studyhad non-verbal IQ of at least 80; no history of birth or brain trauma;and normal or corrected-to-normal vision. The children in the ASDgroup were evaluated using the diagnostic criteria in the DSM-IV, aswell as the autism diagnostic observation schedule (ADOS) (Lord et al.,2000). In addition, all children were evaluated on the social responsive-ness scale (SRS) (Constantino et al., 2007). For more information on thestandardized tests administered as part of this study, see Koldewynet al. (2013).
Image analysis
For eachDW-MRI scan, we aligned all images in the series to thefirstnon-diffusion-weighted image using affine registration (Jenkinsonet al., 2002) and reoriented the corresponding diffusion-weightinggradient vectors accordingly (Rohde et al., 2004; Leemans and Jones,2009). Affine registration between volumes is a processing step that is
commonly applied to DW-MRI data to reduce misalignment betweenthe images due to head motion and eddy currents. To quantify headmotion in each scan, we derived volume-by-volume translation androtation from this affine registration, as well as slice-by-slice signaldrop-out measures that are specific to DW-MRI (Benner et al., 2011).The registration-based measures are better at capturing slower,between-volume motion, whereas the intensity-based measures arebetter at capturing more rapid, within-volume motion. In more detailthe motion measures were:
1. Average volume-by-volume translation: We used the translation com-ponent of the affine registration from each volume to the first volumeto compute the translation vector between each pair of consecutivevolumes. We averaged the magnitude of these translation vectorsover all volumes in the scan.
2. Average volume-by-volume rotation: We used the rotation componentof the affine registration from each volume to the first volume to com-pute the rotation angles between each pair of consecutive volumes.We averaged the sum of the absolute values of these rotation anglesover all volumes in the scan.
3. Percentage of slices with signal drop-out: We computed the signaldrop-out score proposed in Benner et al. (2011) for each slice ineach volume. Slices with a score greater than 1 are considered tohave suspect signal drop-out. We computed the percentage of slicesin the entire scan that had a score greater than 1.
4. Signal drop-out severity: We computed the average signal drop-outscore over all slices in the scan that had a score greater than 1.
We used TRActs Constrained by UnderLying Anatomy (TRACULA) todelineate 18majorWMfascicles in each scan (Yendiki et al., 2011). This isan algorithm for automated global probabilistic tractography that esti-mates the posterior probability of each of the 18 pathways given theDW-MRI data. The posterior probability is decomposed into a data likeli-hood term, which uses the “ball-and-stick” model of diffusion (Behrenset al., 2007), and a pathway prior term,which incorporates prior anatom-ical knowledge on the pathways from a set of training subjects. The infor-mation extracted from the training subjects is the probability of eachpathway passing through (or next to) each anatomical segmentationlabel. This probability is calculated separately for every point along thetrajectory of the pathway. Thus there is no assumption that the pathwayshave the same shape in the study subjects and training subjects, onlythat the pathways traverse the same regions relative to the surroundinganatomy. In other words, TRACULA does not rely on perfect alignmentbetween the study subjects and training subjects. The anatomical seg-mentation labels required by TRACULA were obtained by processingthe T1-weighted images of the study subjects with the automated corti-cal parcellation and subcortical segmentation tools in FreeSurfer (Fischlet al., 2002, 2004a,b). More details on the tractographymethod, as wellas an evaluation of its accuracy on healthy subjects and schizophreniapatients, can be found in Yendiki et al. (2011).
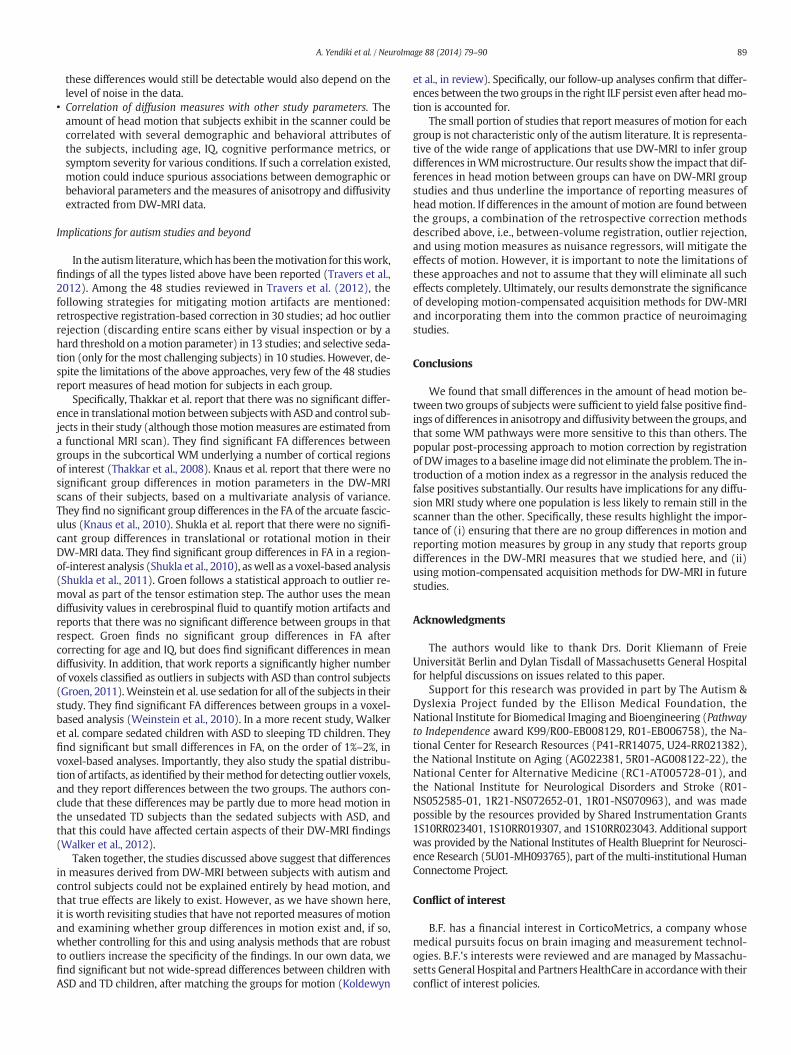
The pathways reconstructed by TRACULA are: corticospinal tract(CST), uncinate fasciculus (UNC), inferior longitudinal fasciculus (ILF), an-terior thalamic radiations (ATR), cingulum–cingulate gyrus bundle (CCG),cingulum–angular bundle (CAB), superior longitudinal fasciculus-parietalterminations (SLFP), superior longitudinal fasciculus-temporal termi-nations (SLFT), corpus callosum–forceps major (FMAJ), and corpuscallosum–forceps minor (FMIN). Other than the corpus callosum, allother pathways are reconstructed for the left (L) and right (R) hemi-sphere. Fig. 1 shows an example reconstruction, where an isosurfaceof the probability distribution of each pathway is displayed.
We obtained mean values of the fractional anisotropy (FA), meandiffusivity (MD), radial diffusivity (RD), and axial diffusivity (AD) ineach of the 18 WM pathways reconstructed by TRACULA for each sub-ject. To compute these mean values, the pathway distributions werethresholded at 20% of their maximum value, and the FA, MD, RD, andAD values at each voxel were weighted by the pathway probability atthat voxel. We also computed the average FA, MD, RD, and AD in the
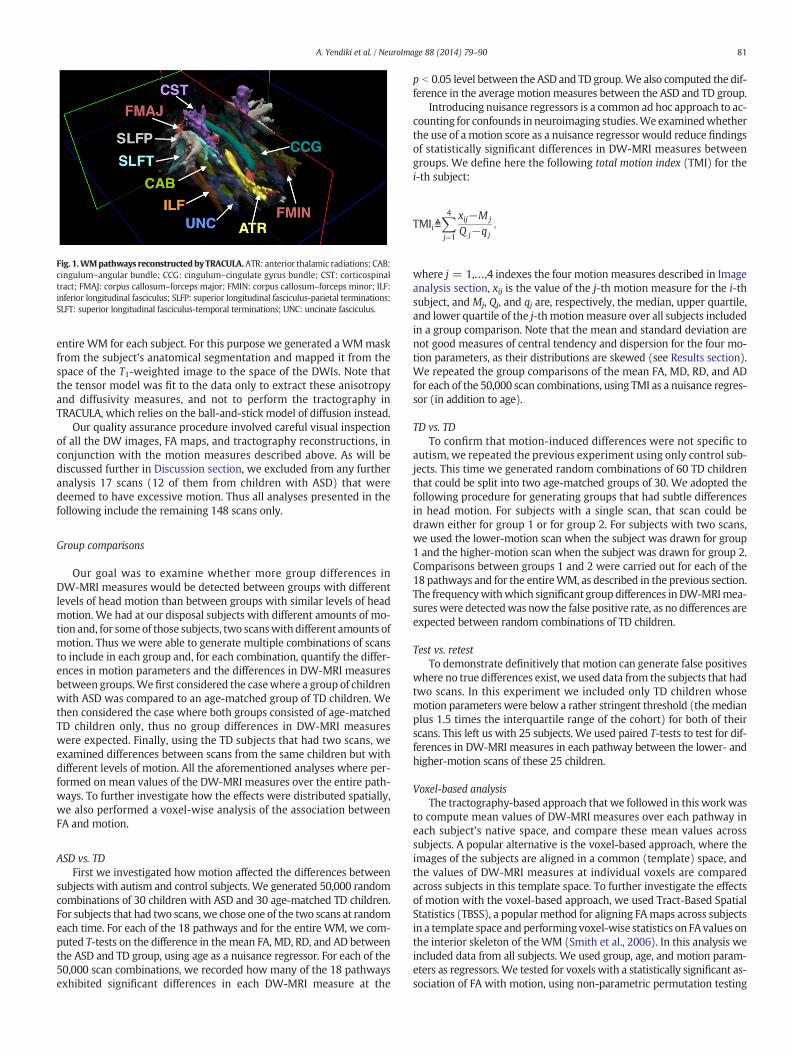
Fig. 1.WMpathways reconstructedbyTRACULA.ATR: anterior thalamic radiations; CAB:cingulum–angular bundle; CCG: cingulum–cingulate gyrus bundle; CST: corticospinaltract; FMAJ: corpus callosum–forceps major; FMIN: corpus callosum–forceps minor; ILF:inferior longitudinal fasciculus; SLFP: superior longitudinal fasciculus-parietal terminations;SLFT: superior longitudinal fasciculus-temporal terminations; UNC: uncinate fasciculus.
81A. Yendiki et al. / NeuroImage 88 (2014) 79–90
entire WM for each subject. For this purpose we generated aWMmaskfrom the subject's anatomical segmentation and mapped it from thespace of the T1-weighted image to the space of the DWIs. Note thatthe tensor model was fit to the data only to extract these anisotropyand diffusivity measures, and not to perform the tractography inTRACULA, which relies on the ball-and-stick model of diffusion instead.
Our quality assurance procedure involved careful visual inspectionof all the DW images, FA maps, and tractography reconstructions, inconjunction with the motion measures described above. As will bediscussed further in Discussion section, we excluded from any furtheranalysis 17 scans (12 of them from children with ASD) that weredeemed to have excessive motion. Thus all analyses presented in thefollowing include the remaining 148 scans only.
Group comparisons
Our goal was to examine whether more group differences inDW-MRI measures would be detected between groups with differentlevels of head motion than between groups with similar levels of headmotion. We had at our disposal subjects with different amounts of mo-tion and, for someof those subjects, two scanswith different amounts ofmotion. Thus we were able to generate multiple combinations of scansto include in each group and, for each combination, quantify the differ-ences in motion parameters and the differences in DW-MRI measuresbetween groups.We first considered the casewhere a group of childrenwith ASD was compared to an age-matched group of TD children. Wethen considered the case where both groups consisted of age-matchedTD children only, thus no group differences in DW-MRI measureswere expected. Finally, using the TD subjects that had two scans, weexamined differences between scans from the same children but withdifferent levels of motion. All the aforementioned analyses where per-formed on mean values of the DW-MRI measures over the entire path-ways. To further investigate how the effects were distributed spatially,we also performed a voxel-wise analysis of the association betweenFA and motion.
ASD vs. TDFirst we investigated how motion affected the differences between
subjects with autism and control subjects. We generated 50,000 randomcombinations of 30 children with ASD and 30 age-matched TD children.For subjects that had two scans, we chose one of the two scans at randomeach time. For each of the 18 pathways and for the entire WM, we com-puted T-tests on the difference in the mean FA, MD, RD, and AD betweenthe ASD and TD group, using age as a nuisance regressor. For each of the50,000 scan combinations, we recorded how many of the 18 pathwaysexhibited significant differences in each DW-MRI measure at the
p b 0.05 level between the ASD and TD group.We also computed the dif-ference in the average motion measures between the ASD and TD group.
Introducing nuisance regressors is a common ad hoc approach to ac-counting for confounds in neuroimaging studies.We examinedwhetherthe use of a motion score as a nuisance regressor would reduce findingsof statistically significant differences in DW-MRI measures betweengroups. We define here the following total motion index (TMI) for thei-th subject:
TMIi≜X4
j¼1
xij−Mj
Q j−qj;
where j = 1,…,4 indexes the four motion measures described in Imageanalysis section, xij is the value of the j-th motion measure for the i-thsubject, and Mj, Qj, and qj are, respectively, the median, upper quartile,and lower quartile of the j-thmotionmeasure over all subjects includedin a group comparison. Note that the mean and standard deviation arenot good measures of central tendency and dispersion for the four mo-tion parameters, as their distributions are skewed (see Results section).We repeated the group comparisons of the mean FA, MD, RD, and ADfor each of the 50,000 scan combinations, using TMI as a nuisance regres-sor (in addition to age).
TD vs. TDTo confirm that motion-induced differences were not specific to
autism, we repeated the previous experiment using only control sub-jects. This time we generated random combinations of 60 TD childrenthat could be split into two age-matched groups of 30. We adopted thefollowing procedure for generating groups that had subtle differencesin head motion. For subjects with a single scan, that scan could bedrawn either for group 1 or for group 2. For subjects with two scans,we used the lower-motion scan when the subject was drawn for group1 and the higher-motion scan when the subject was drawn for group 2.Comparisons between groups 1 and 2 were carried out for each of the18 pathways and for the entireWM, as described in the previous section.The frequencywithwhich significant group differences in DW-MRImea-sureswere detectedwas now the false positive rate, as no differences areexpected between random combinations of TD children.
Test vs. retestTo demonstrate definitively that motion can generate false positives
where no true differences exist, we used data from the subjects that hadtwo scans. In this experiment we included only TD children whosemotion parameters were below a rather stringent threshold (themedianplus 1.5 times the interquartile range of the cohort) for both of theirscans. This left us with 25 subjects. We used paired T-tests to test for dif-ferences in DW-MRI measures in each pathway between the lower- andhigher-motion scans of these 25 children.
Voxel-based analysisThe tractography-based approach that we followed in this workwas
to compute mean values of DW-MRI measures over each pathway ineach subject's native space, and compare these mean values acrosssubjects. A popular alternative is the voxel-based approach, where theimages of the subjects are aligned in a common (template) space, andthe values of DW-MRI measures at individual voxels are comparedacross subjects in this template space. To further investigate the effectsof motion with the voxel-based approach, we used Tract-Based SpatialStatistics (TBSS), a popularmethod for aligning FAmaps across subjectsin a template space and performing voxel-wise statistics on FAvalues onthe interior skeleton of theWM (Smith et al., 2006). In this analysis weincluded data from all subjects. We used group, age, and motion param-eters as regressors.We tested for voxels with a statistically significant as-sociation of FA with motion, using non-parametric permutation testing

1 2 30
5
10
15
20
25
Translation(mm)
0.5 1 1.5 20
5
10
15
20
25
30
35
Rotation(degrees)
2 40
20
40
60
80
100
Portion of sliceswith drop−out (%)
1.2 1.4 1.60
10
20
30
40
50
60
70
80
Drop−out score
OK
Excluded
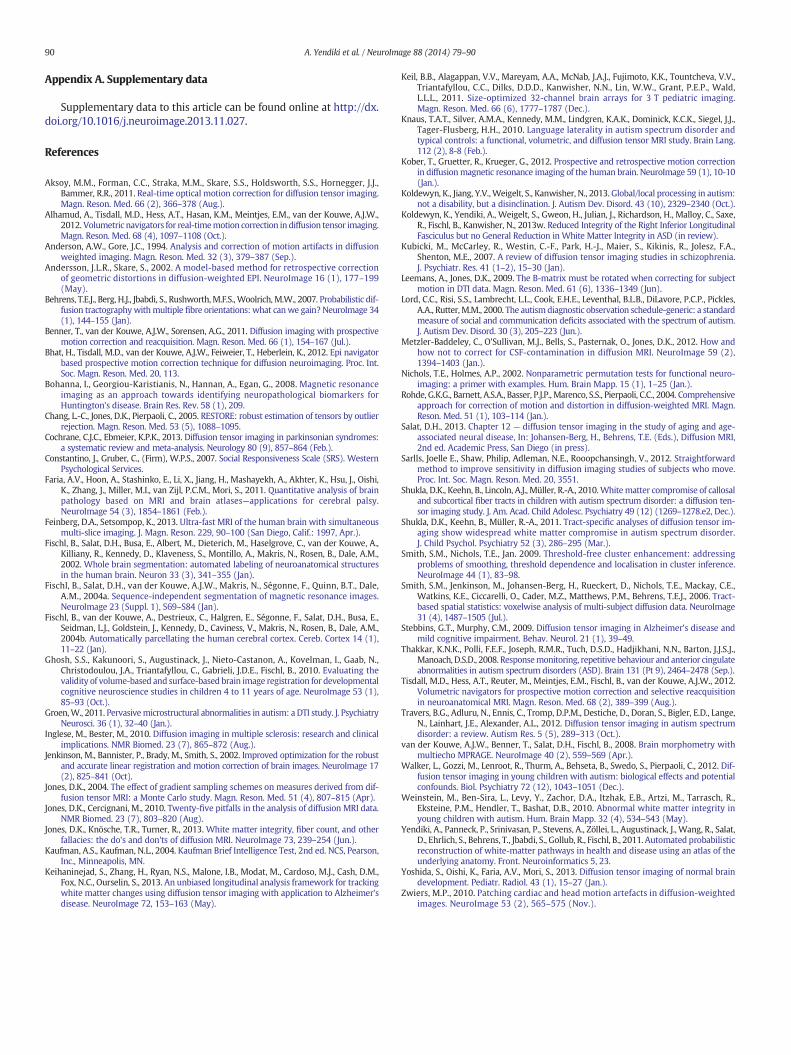
Fig. 2. Overview ofmotionmeasures. Histograms of the four motion measures are shown for the 148 scans that were included in our analyses (green) and 17 scans that were excludeddue to excessive motion (black).
82 A. Yendiki et al. / NeuroImage 88 (2014) 79–90
(Nichols and Holmes, 2002) and threshold-free cluster enhancement(Smith and Nichols, 2009).
Results
Overview of motion in the data
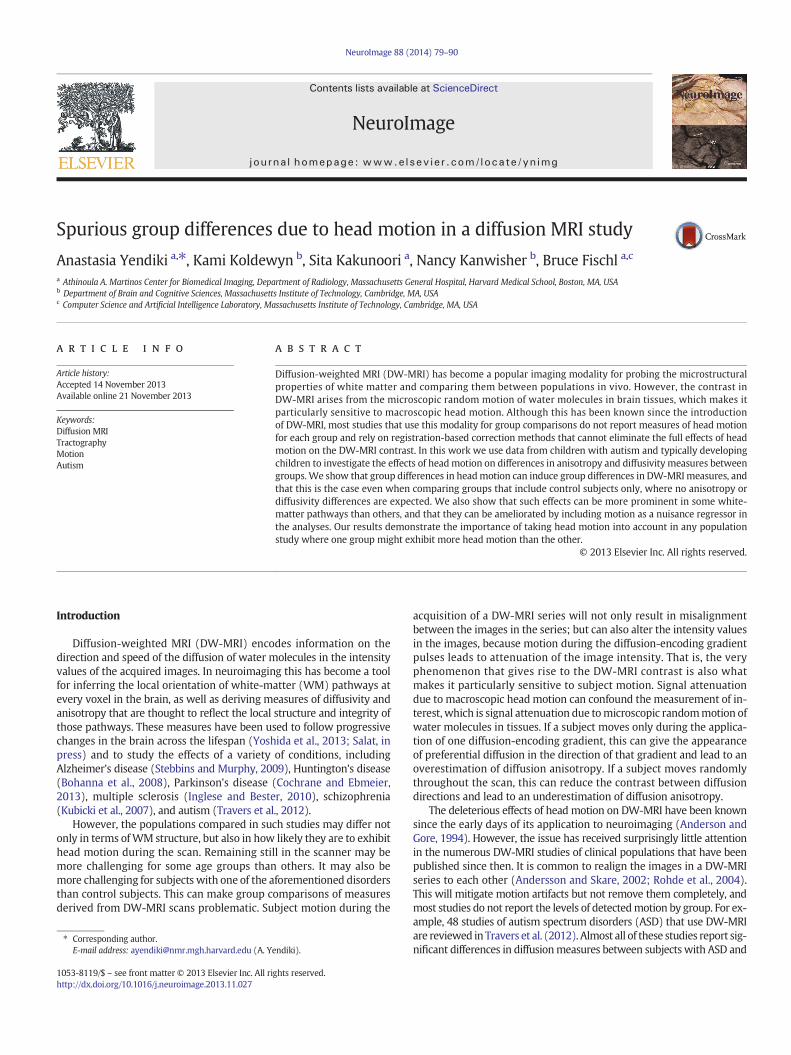
Fig. 2 shows histograms of the four measures of motion described inImage analysis section for the 148 data sets that were included in theanalyses, and for the 17 data sets that were excluded by visual inspectiondue to egregious motion artifacts. Fig. 3 shows box-and-whisker plots ofthese measures by group for the 148 scans that were deemed acceptable.As seen in these plots, themedian of all fourmotionmeasureswas higherin the scans of children with ASD than those of TD children. A Wilcoxonrank-sum test showed statistically significant group differences (transla-tion: p = 0.009; rotation: p = 0.0006; portion of slices with signaldrop-out: p = 0.01; signal drop-out score: p = 0.02). For children thathad two scans, the median time between scans was 29 days and the in-terquartile range was 40 days. There was no general tendency for moreor less motion in the earlier scan compared to the later scan (translation:p = 0.48; rotation: p = 0.57; portion of slices with signal drop-out:p = 0.89; signal drop-out score: p = 0.83). There was no difference inthe time between scans between groups (p = 0.97).
TD ASD
0.5
1
1.5
2
Tra
nsla
tion
(mm
)
TD ASD
0.2
0.4
0.6
0.8
1
1.2
Rot
atio
n (d
egre
es)
Fig. 3. Motionmeasures by group. The fourmotionmeasures are plotted for the 148 scans that wwith ASD than for TD children.
Table 1 contains demographic information on the subjects whosescans were included in the analyses, including age, IQ, SRS score, andADOS score. Pearson correlation coefficients of each of these variablesto translational and rotational motion are also shown. There were nosignificant correlations of age, IQ, or SRS scores with motion measures.However, the ADOS symptom severity scores of the autistic childrenwere positively correlated with rotational motion (p = 0.04).
ASD vs. TD
In Fig. 4 we have grouped the 50,000 random combinations of 30children with ASD and 30 age-matched TD children based on howmany of the 18 pathways reconstructed by TRACULA were found tohave significant FA differences between the ASD and TD group at thep b 0.05 level. The plots show the average difference in motion mea-sures between the groups (ASD-TD), plotted against the number ofpathways that exhibited significant FA group differences. As seen inthe figure, the trials with significantly different FA between the ASDand TD groups in a greater number of pathways were also, on average,the trials with a greater difference in motion measures between thetwo groups. The most frequent outcome was only one pathway with asignificant group difference (10,998 trials with no findings, 21,867 withone, 12,131 with two, 3719 with three, 946 with four, and 339 withfive or more). The one-pathway outcome was also associated with the
TD ASD
0
0.2
0.4
0.6
0.8
Por
tion
of s
lices
with
dro
p−ou
t (%
)
TD ASD
1
1.1
1.2
1.3
1.4
1.5
1.6
Dro
p−ou
t sco
re
ere included in the analyses. Medianmotionmeasures (black dots)were higher for children
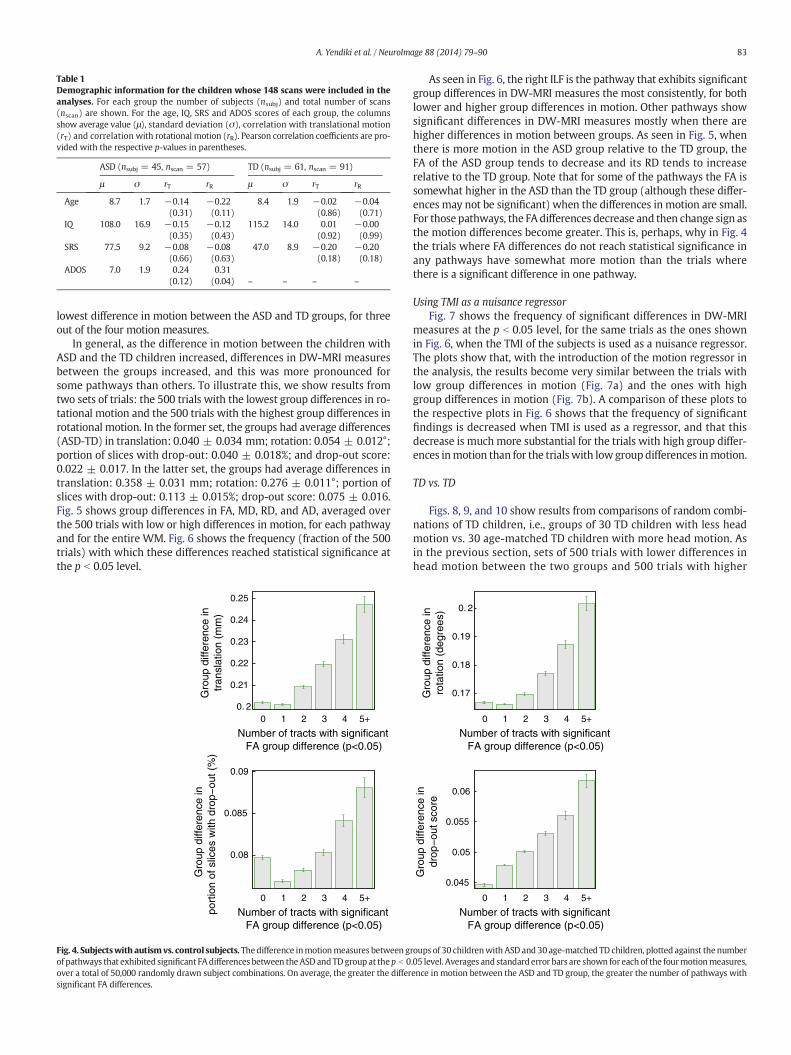
Table 1Demographic information for the children whose 148 scans were included in theanalyses. For each group the number of subjects (nsubj) and total number of scans(nscan) are shown. For the age, IQ, SRS and ADOS scores of each group, the columnsshow average value (μ), standard deviation (σ), correlation with translational motion(rT) and correlation with rotational motion (rR). Pearson correlation coefficients are pro-vided with the respective p-values in parentheses.
ASD (nsubj = 45, nscan = 57) TD (nsubj = 61, nscan = 91)
μ σ rT rR μ σ rT rR
Age 8.7 1.7 −0.14 −0.22 8.4 1.9 −0.02 −0.04(0.31) (0.11) (0.86) (0.71)
IQ 108.0 16.9 −0.15 −0.12 115.2 14.0 0.01 −0.00(0.35) (0.43) (0.92) (0.99)
SRS 77.5 9.2 −0.08 −0.08 47.0 8.9 −0.20 −0.20(0.66) (0.63) (0.18) (0.18)
ADOS 7.0 1.9 0.24 0.31(0.12) (0.04) – – – –
83A. Yendiki et al. / NeuroImage 88 (2014) 79–90
lowest difference in motion between the ASD and TD groups, for threeout of the four motion measures.
In general, as the difference in motion between the children withASD and the TD children increased, differences in DW-MRI measuresbetween the groups increased, and this was more pronounced forsome pathways than others. To illustrate this, we show results fromtwo sets of trials: the 500 trials with the lowest group differences in ro-tational motion and the 500 trials with the highest group differences inrotational motion. In the former set, the groups had average differences(ASD-TD) in translation: 0.040 ± 0.034 mm; rotation: 0.054 ± 0.012°;portion of slices with drop-out: 0.040 ± 0.018%; and drop-out score:0.022 ± 0.017. In the latter set, the groups had average differences intranslation: 0.358 ± 0.031 mm; rotation: 0.276 ± 0.011°; portion ofslices with drop-out: 0.113 ± 0.015%; drop-out score: 0.075 ± 0.016.Fig. 5 shows group differences in FA, MD, RD, and AD, averaged overthe 500 trials with low or high differences in motion, for each pathwayand for the entire WM. Fig. 6 shows the frequency (fraction of the 500trials) with which these differences reached statistical significance atthe p b 0.05 level.
0 1 2 3 4 5+0. 2
0.21
0.22
0.23
0.24
0.25
Number of tracts with significantFA group difference (p<0.05)
Gro
up d
iffer
ence
intr
ansl
atio
n (m
m)
0 1 2 3 4 5+
0.08
0.085
0.09
Number of tracts with significantFA group difference (p<0.05)
Gro
up d
iffer
ence
inpo
rtio
n of
slic
es w
ith d
rop−
out (
%)
Fig. 4. Subjectswith autismvs. control subjects. Thedifference inmotionmeasures between gof pathways that exhibited significant FAdifferences between theASD andTDgroup at thep b 0over a total of 50,000 randomly drawn subject combinations. On average, the greater the differsignificant FA differences.
As seen in Fig. 6, the right ILF is the pathway that exhibits significantgroup differences in DW-MRI measures the most consistently, for bothlower and higher group differences in motion. Other pathways showsignificant differences in DW-MRI measures mostly when there arehigher differences in motion between groups. As seen in Fig. 5, whenthere is more motion in the ASD group relative to the TD group, theFA of the ASD group tends to decrease and its RD tends to increaserelative to the TD group. Note that for some of the pathways the FA issomewhat higher in the ASD than the TD group (although these differ-ences may not be significant) when the differences in motion are small.For those pathways, the FA differences decrease and then change sign asthe motion differences become greater. This is, perhaps, why in Fig. 4the trials where FA differences do not reach statistical significance inany pathways have somewhat more motion than the trials wherethere is a significant difference in one pathway.
Using TMI as a nuisance regressorFig. 7 shows the frequency of significant differences in DW-MRI
measures at the p b 0.05 level, for the same trials as the ones shownin Fig. 6, when the TMI of the subjects is used as a nuisance regressor.The plots show that, with the introduction of the motion regressor inthe analysis, the results become very similar between the trials withlow group differences in motion (Fig. 7a) and the ones with highgroup differences in motion (Fig. 7b). A comparison of these plots tothe respective plots in Fig. 6 shows that the frequency of significantfindings is decreased when TMI is used as a regressor, and that thisdecrease is muchmore substantial for the trials with high group differ-ences inmotion than for the trialswith low groupdifferences inmotion.
TD vs. TD
Figs. 8, 9, and 10 show results from comparisons of random combi-nations of TD children, i.e., groups of 30 TD children with less headmotion vs. 30 age-matched TD children with more head motion. Asin the previous section, sets of 500 trials with lower differences inhead motion between the two groups and 500 trials with higher
0 1 2 3 4 5+
0.17
0.18
0.19
0. 2
Number of tracts with significantFA group difference (p<0.05)
Gro
up d
iffer
ence
inro
tatio
n (d
egre
es)
0 1 2 3 4 5+
0.045
0.05
0.055
0.06
Number of tracts with significantFA group difference (p<0.05)
Gro
up d
iffer
ence
indr
op−
out s
core
roups of 30 childrenwith ASD and 30 age-matched TD children, plotted against thenumber.05 level. Averages and standarderror bars are shown for eachof the fourmotionmeasures,ence in motion between the ASD and TD group, the greater the number of pathways with

−4
−2
0
2
4
6
L−C
ST
R−
CS
T
L−U
NC
R−
UN
C
L−IL
F
R−
ILF
L−A
TR
R−
AT
R
L−C
CG
R−
CC
G
L−C
AB
R−
CA
B
L−S
LFP
R−
SLF
P
L−S
LFT
R−
SLF
T
FM
AJ
FM
IN
WM
Gro
up d
iffer
ence
(%
)
FA MD RD AD
−4
−2
0
2
4
6
L−C
ST
R−
CS
T
L−U
NC
R−
UN
C
L−IL
F
R−
ILF
L−A
TR
R−
AT
R
L−C
CG
R−
CC
G
L−C
AB
R−
CA
B
L−S
LFP
R−
SLF
P
L−S
LFT
R−
SLF
T
FM
AJ
FM
IN
WM
Gro
up d
iffer
ence
(%
)
FA MD RD AD
a) Lower differences in motion between groups
b) Higher differences in motion between groups
Fig. 5. Subjects with autism vs. control subjects. Group differences in FA, MD, RD, andAD, for each of the 18 pathways reconstructed by TRACULA and for the entire WM, aver-aged over 500 trials with low differences in motion (a) and 500 trials with high differ-ences in motion between groups (b). Differences in DW-MRI measures are expressedas 100 ⋅ (xASD − xTD)/xTD, where xASD and xTD are the measures for the ASD and TDgroup, respectively. There were greater group differences in DW-MRI measures forsome pathways when the group differences in motion were higher.
0
0.2
0.4
0.6
L−C
ST
R−
CS
T
L−U
NC
R−
UN
C
L−IL
F
R−
ILF
L−A
TR
R−
AT
R
L−C
CG
R−
CC
G
L−C
AB
R−
CA
B
L−S
LFP
R−
SLF
P
L−S
LFT
R−
SLF
T
FM
AJ
FM
IN
WM
Cha
nce
of
sign
ifica
nt g
roup
diff
eren
ce
FAMDRDAD
0
0.2
0.4
0.6
L−C
ST
R−
CS
T
L−U
NC
R−
UN
C
L−IL
F
R−
ILF
L−A
TR
R−
AT
R
L−C
CG
R−
CC
G
L−C
AB
R−
CA
B
L−S
LFP
R−
SLF
P
L−S
LFT
R−
SLF
T
FM
AJ
FM
IN
WM
Cha
nce
of
sign
ifica
nt g
roup
diff
eren
ce
FAMDRDAD
a) Lower differences in motion between groups
b) Higher differences in motion between groups
Fig. 7. Subjects with autism vs. control subjects, regressingmotion. Frequency of signifi-cant group differences in FA, MD, RD, and AD at the p b 0.05 level, for each of the 18 path-ways reconstructed by TRACULA and for the entire WM. Results are shown for 500 trialswith low differences in motion (a) and 500 trials with high differences in motion betweengroups (b). The horizontal blue line indicates the type-I error rate of 0.05. Introducing themotion regressor led to similar results between trials with low and high group differencesin motion.
84 A. Yendiki et al. / NeuroImage 88 (2014) 79–90
differences in head motion between the two groups were identified.In the former set, the groups had average differences in translation:0.041 ± 0.031 mm; rotation: 0.0003 ± 0.0002°; portion of slices with
0
0.2
0.4
0.6
L−C
ST
R−
CS
T
L−U
NC
R−
UN
C
L−IL
F
R−
ILF
L−A
TR
R−
AT
R
L−C
CG
R−
CC
G
L−C
AB
R−
CA
B
L−S
LFP
R−
SLF
P
L−S
LFT
R−
SLF
T
FM
AJ
FM
IN
WM
Cha
nce
of
sign
ifica
nt g
roup
diff
eren
ce
FAMDRDAD
0
0.2
0.4
0.6
L−C
ST
R−
CS
T
L−U
NC
R−
UN
C
L−IL
F
R−
ILF
L−A
TR
R−
AT
R
L−C
CG
R−
CC
G
L−C
AB
R−
CA
B
L−S
LFP
R−
SLF
P
L−S
LFT
R−
SLF
T
FM
AJ
FM
IN
WM
Cha
nce
of
sign
ifica
nt g
roup
diff
eren
ce
FAMDRDAD
a) Lower differences in motion between groups
b) Higher differences in motion between groups
Fig. 6. Subjects with autism vs. control subjects. Frequency of significant group differ-ences in FA,MD, RD, and AD at the p b 0.05 level, for each of the 18 pathways reconstruct-ed by TRACULA and for the entireWM. Results are shown for 500 trials with low differencesin motion (a) and 500 trials with high differences in motion between groups (b). The hori-zontal blue line indicates the type-I error rate of 0.05. Some pathways showed significantgroup differences in DW-MRI measures more frequently when the group differences in mo-tion were higher.
−4
−2
0
2
4
6
L−C
ST
R−
CS
T
L−U
NC
R−
UN
C
L−IL
F
R−
ILF
L−A
TR
R−
AT
R
L−C
CG
R−
CC
G
L−C
AB
R−
CA
B
L−S
LFP
R−
SLF
P
L−S
LFT
R−
SLF
T
FM
AJ
FM
IN
WM
Gro
up d
iffer
ence
(%
)
FA MD RD AD
−4
−2
0
2
4
6
L−C
ST
R−
CS
T
L−U
NC
R−
UN
C
L−IL
F
R−
ILF
L−A
TR
R−
AT
R
L−C
CG
R−
CC
G
L−C
AB
R−
CA
B
L−S
LFP
R−
SLF
P
L−S
LFT
R−
SLF
T
FM
AJ
FM
IN
WM
Gro
up d
iffer
ence
(%
)
FA MD RD AD
a) Lower differences in motion between groups
b) Higher differences in motion between groups
Fig. 8. Control subjects only. Group differences in FA, MD, RD, and AD, for each of the 18pathways reconstructed by TRACULA and for the entireWM, averaged over 500 trialswithlow differences in motion (a) and 500 trials with high differences in motion betweengroups (b). Differences in DW-MRI measures are expressed as 100 ⋅ (xTD2 − xTD1)/xTD1,where xTD1 and xTD2 are themeasures for the TD groupwith less andmoremotion, respec-tively. There were group differences in DW-MRI measures for some pathways, only whenthe group differences in motion were higher.

0
0.2
0.4
0.6L−
CS
T
R−
CS
T
L−U
NC
R−
UN
C
L−IL
F
R−
ILF
L−A
TR
R−
AT
R
L−C
CG
R−
CC
G
L−C
AB
R−
CA
B
L−S
LFP
R−
SLF
P
L−S
LFT
R−
SLF
T
FM
AJ
FM
IN
WM
Cha
nce
of
sign
ifica
nt g
roup
diff
eren
ce
FAMDRDAD
0
0.2
0.4
0.6
L−C
ST
R−
CS
T
L−U
NC
R−
UN
C
L−IL
F
R−
ILF
L−A
TR
R−
AT
R
L−C
CG
R−
CC
G
L−C
AB
R−
CA
B
L−S
LFP
R−
SLF
P
L−S
LFT
R−
SLF
T
FM
AJ
FM
IN
WM
Cha
nce
of
sign
ifica
nt g
roup
diff
eren
ce
FAMDRDAD
a) Lower differences in motion between groups
b) Higher differences in motion between groups
Fig. 9. Control subjects only. False positive rates for FA, MD, RD, and AD at the p b 0.05level, for each of the 18 pathways reconstructed by TRACULA and for the entire WM. Re-sults are shown for 500 trials with low differences in motion (a) and 500 trials withhigh differences in motion between groups (b). The horizontal blue line indicates thetype-I error rate of 0.05. False positive rates increased for some pathways when thegroup differences in motion increased.
85A. Yendiki et al. / NeuroImage 88 (2014) 79–90
drop-out: 0.013 ± 0.010%; and drop-out score: 0.016 ± 0.012. Inthe latter set, the groups had average differences in translation:0.276 ± 0.047 mm; rotation: 0.204 ± 0.011°; portion of sliceswith drop-out: 0.071 ± 0.013%; and drop-out score: 0.065 ± 0.016.
0
0.2
0.4
0.6
L−C
ST
R−
CS
T
L−U
NC
R−
UN
C
L−IL
F
R−
ILF
L−A
TR
R−
AT
R
L−C
CG
R−
CC
G
L−C
AB
R−
CA
B
L−S
LFP
R−
SLF
P
L−S
LFT
R−
SLF
T
FM
AJ
FM
IN
WM
Cha
nce
of
sign
ifica
nt g
roup
diff
eren
ce
FAMDRDAD
0
0.2
0.4
0.6
L−C
ST
R−
CS
T
L−U
NC
R−
UN
C
L−IL
F
R−
ILF
L−A
TR
R−
AT
R
L−C
CG
R−
CC
G
L−C
AB
R−
CA
B
L−S
LFP
R−
SLF
P
L−S
LFT
R−
SLF
T
FM
AJ
FM
IN
WM
Cha
nce
of
sign
ifica
nt g
roup
diff
eren
ce
FAMDRDAD
a) Lower differences in motion between groups
b) Higher differences in motion between groups
Fig. 10. Control subjects only, regressingmotion. False positive rates for FA,MD, RD, andADat thep b 0.05 level, for eachof the 18pathways reconstructedby TRACULA and for theentireWM.Results are shown for 500 trialswith lowdifferences inmotion (a) and 500 tri-als with high differences inmotion between groups (b). The horizontal blue line indicatesthe type-I error rate of 0.05. Introducing the motion regressor led to similar false positiverates between trials with low and high group differences in motion.
Note that these differences between lower-motion and higher motionscans from TD children are more subtle than the respective differencesbetween scans from childrenwith ASD and TD children, whichwere re-ported in the previous section.
Fig. 8 shows group differences in FA, MD, RD, and AD, averaged overthe 500 trials with low or high differences in motion, for each pathwayand for the entire WM. Fig. 9 shows the frequency (fraction of the 500trials) with which these differences reached statistical significance atthe p b 0.05 level. This frequency is now a false positive rate, as no dif-ferences in DW-MRImeasures are expected between random combina-tions of TD children. As seen in the plots, when the motion differencesbetween the groups of TD children were low, there were no groupdifferences in DW-MRI measures (Fig. 8a) and the false positive ratewas around 5% for all pathways (Fig. 9a). This was consistent with thechosen threshold (p b 0.05) for the probability of detecting a differencebetween groups under the null hypothesis.When themotion differencebetween groups was higher, the false positive rates increased (Fig. 9b),particularly for the forceps major of the corpus callosum and thecingulum bundle. For these pathways, there was an increase in RDand a (smaller) decrease in AD for the groupwith more motion relativeto the groupwith lessmotion (Fig. 8b). As a result, there was a decreasein FA but a much smaller increase in MD in the presence of motion.
Using TMI as a nuisance regressorFig. 10 shows the frequency of significant differences in DW-MRI
measures at the p b 0.05 level, for the same trials as the ones shownin Fig. 9, when the TMI of the subjects is used as a nuisance regressor.The introduction of the motion regressor in the analysis reduced thefalse positives substantially in the trials with high group differences inmotion (Fig. 10b), although it did not bring them quite to the samelevel as the trials with low group differences in motion (Fig. 10a). Thefalse positive rate was decreased, when motion was used as a regressor,even for the trials with low group differences in motion, where it fellslightly below 5%. This may be an indication that themotion regressor in-troduces some noise in the analysis, as the motion parameters are them-selves noisy estimates derived from image data. Thus it is plausible thatthe introduction of motion parameters in the analysis reduces the biasdue to motion at the cost of a small increase in variance due to noise.
Test vs. retest
Herewe used data from 25 TD children only. These children had test–retest scans that did not exceed a stringent motion threshold, so that themaximum translational and rotational motion in any of the scans includ-ed in this analysis was, respectively, 1.17 mm and 0.58°. The mediannumber of days between test–retest scans was 22 and the interquartilerange was 37. Paired T-tests between the earlier and later scans showedno significant change in FA; thus there were no significant longitudinalwithin-subject changes between these scans. The higher- and lower-motion scans of these 25 children had average differences in translation:0.157 ± 0.032 mm; rotation: 0.126 ± 0.020°; portion of slices withdrop-out: 0.025 ± 0.014%; and drop-out score: 0.037 ± 0.017.
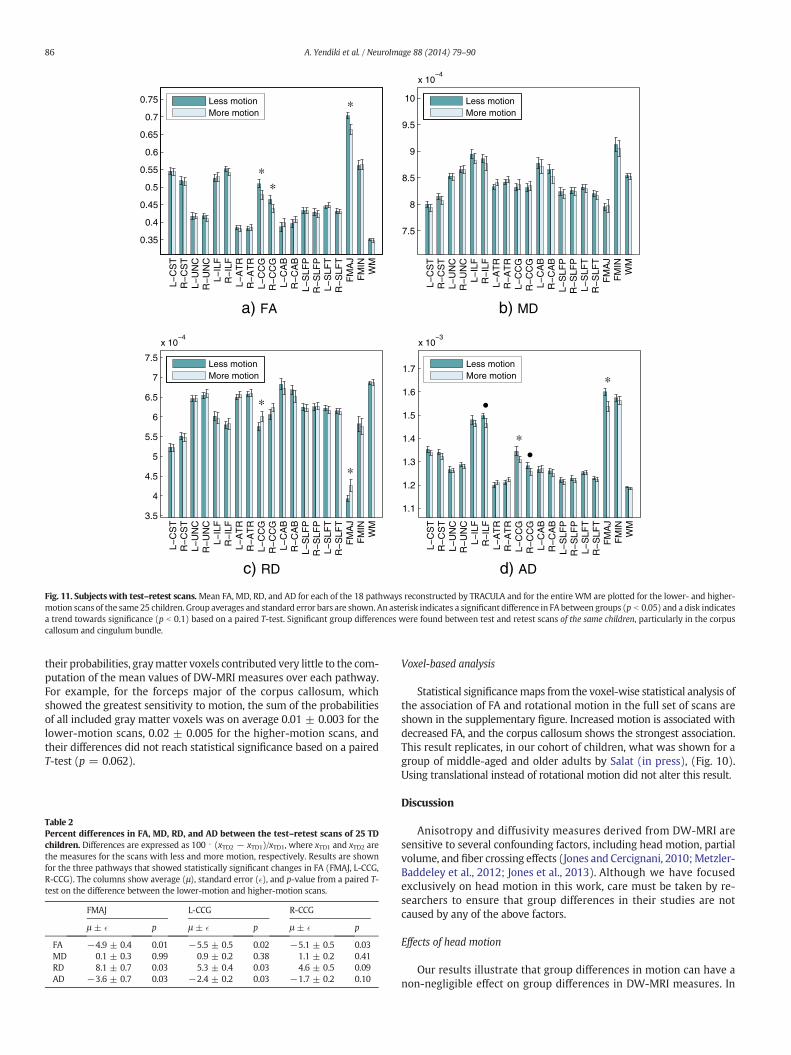
Fig. 11 shows comparisons of FA, MD, RD, and AD, for each of the 18pathways reconstructed by TRACULA and for the entire WM, betweenthe subjects' lower-motion and higher-motion scans. The corpuscallosum and cingulum bundle showed significant differences in FA be-tween the lower-motion and higher-motion scans of these 25 TD chil-dren. The differences followed a similar pattern as the one seen in theprevious section: higher motion led to decreased FA but largely un-changed MD, due to an increase in RD and decrease in AD. The sizes ofthese differences are shown in Table 2.
We also investigated whether the differences in DW-MRI measurescould be caused by the inclusion of more gray matter voxels in the pos-terior probability distributions of the pathways in the presence of moremotion. Due to the fact that the distributionswere thresholded at 20% oftheir maximum value, and the voxels that remained were weighted by
0.35
0.4
0.45
0.5
0.55
0.6
0.65
0.7
0.75
∗∗
∗
L−C
ST
R−
CS
TL−
UN
CR
−U
NC
L−IL
FR
−IL
FL−
AT
RR
−A
TR
L−C
CG
R−
CC
GL−
CA
BR
−C
AB
L−S
LFP
R−
SLF
PL−
SLF
TR
−S
LFT
FM
AJ
FM
INW
M
Less motionMore motion
a) FA
7.5
8
8.5
9
9.5
10
x 10−4
L−C
ST
R−
CS
TL−
UN
CR
−U
NC
L−IL
FR
−IL
FL−
AT
RR
−A
TR
L−C
CG
R−
CC
GL−
CA
BR
−C
AB
L−S
LFP
R−
SLF
PL−
SLF
TR
−S
LFT
FM
AJ
FM
INW
M
Less motionMore motion
b) MD
3.5
4
4.5
5
5.5
6
6.5
7
7.5
x 10−4
∗
∗
L−C
ST
R−
CS
TL−
UN
CR
−U
NC
L−IL
FR
−IL
FL−
AT
RR
−A
TR
L−C
CG
R−
CC
GL−
CA
BR
−C
AB
L−S
LFP
R−
SLF
PL−
SLF
TR
−S
LFT
FM
AJ
FM
INW
MLess motionMore motion
c) RD
1.1
1.2
1.3
1.4
1.5
1.6
1.7
x 10−3
•
∗•
∗
L−C
ST
R−
CS
TL−
UN
CR
−U
NC
L−IL
FR
−IL
FL−
AT
RR
−A
TR
L−C
CG
R−
CC
GL−
CA
BR
−C
AB
L−S
LFP
R−
SLF
PL−
SLF
TR
−S
LFT
FM
AJ
FM
INW
M
Less motionMore motion
d) AD
Fig. 11. Subjects with test–retest scans.Mean FA, MD, RD, and AD for each of the 18 pathways reconstructed by TRACULA and for the entire WM are plotted for the lower- and higher-motion scans of the same 25 children. Group averages and standard error bars are shown. An asterisk indicates a significant difference in FA between groups (p b 0.05) and a disk indicatesa trend towards significance (p b 0.1) based on a paired T-test. Significant group differences were found between test and retest scans of the same children, particularly in the corpuscallosum and cingulum bundle.
86 A. Yendiki et al. / NeuroImage 88 (2014) 79–90
their probabilities, graymatter voxels contributed very little to the com-putation of the mean values of DW-MRI measures over each pathway.For example, for the forceps major of the corpus callosum, whichshowed the greatest sensitivity to motion, the sum of the probabilitiesof all included gray matter voxels was on average 0.01 ± 0.003 for thelower-motion scans, 0.02 ± 0.005 for the higher-motion scans, andtheir differences did not reach statistical significance based on a pairedT-test (p = 0.062).
Table 2Percent differences in FA, MD, RD, and AD between the test–retest scans of 25 TDchildren. Differences are expressed as 100 ⋅ (xTD2 − xTD1)/xTD1, where xTD1 and xTD2 arethe measures for the scans with less and more motion, respectively. Results are shownfor the three pathways that showed statistically significant changes in FA (FMAJ, L-CCG,R-CCG). The columns show average (μ), standard error (�), and p-value from a paired T-test on the difference between the lower-motion and higher-motion scans.
FMAJ L-CCG R-CCG
μ ± � p μ ± � p μ ± � p
FA −4.9 ± 0.4 0.01 −5.5 ± 0.5 0.02 −5.1 ± 0.5 0.03MD 0.1 ± 0.3 0.99 0.9 ± 0.2 0.38 1.1 ± 0.2 0.41RD 8.1 ± 0.7 0.03 5.3 ± 0.4 0.03 4.6 ± 0.5 0.09AD −3.6 ± 0.7 0.03 −2.4 ± 0.2 0.03 −1.7 ± 0.2 0.10
Voxel-based analysis
Statistical significancemaps from the voxel-wise statistical analysis ofthe association of FA and rotational motion in the full set of scans areshown in the supplementary figure. Increased motion is associated withdecreased FA, and the corpus callosum shows the strongest association.This result replicates, in our cohort of children, what was shown for agroup of middle-aged and older adults by Salat (in press), (Fig. 10).Using translational instead of rotational motion did not alter this result.
Discussion
Anisotropy and diffusivity measures derived from DW-MRI aresensitive to several confounding factors, including head motion, partialvolume, and fiber crossing effects (Jones and Cercignani, 2010;Metzler-Baddeley et al., 2012; Jones et al., 2013). Although we have focusedexclusively on head motion in this work, care must be taken by re-searchers to ensure that group differences in their studies are notcaused by any of the above factors.
Effects of head motion
Our results illustrate that group differences in motion can have anon-negligible effect on group differences in DW-MRI measures. In
87A. Yendiki et al. / NeuroImage 88 (2014) 79–90
our comparison of subjects with autism to control subjects, the formeralways exhibited greater motion than the latter. Small increases in thisdifference in motion between the two groups were accompanied byincreases in the number of pathways that had significantly differentFA between the groups (Fig. 4). A comparison of results from trialswith smaller motion differences between groups (Figs. 5a, 6a) to thosefrom trials with larger motion differences between groups (Figs. 5b,6b) showed that the latter were characterized by greater group differ-ences in DW-MRI measures. In particular, more motion in the ASDgroup relative to the TD group was accompanied by an apparent in-crease in RD and decrease in FA in the ASD group relative to the TDgroup. This pattern of group differences in anisotropy and diffusivityhas often been reported in the autism literature (Travers et al., 2012).
However, in the absence of ground truth on the structure of theautistic brain, it is difficult to determine if these findings are false posi-tives. As we found head motion to be correlated with ADOS symptomseverity scores in the childrenwith ASD, in principle one could not elim-inate the possibility of a true biological underpinning for the greater dif-ferences in DW-MRI measures for ASD groups with more head motion.Furthermore, group comparisons of measures derived from the tensormodel of diffusion can be confounded by other factors. For example,subjects from different populations could differ not only in terms ofheadmotion, but also in terms of partial-volume or fiber-crossing effects.To make sure that we can isolate the effects of head motion from otherpossible group differences, we went on to compare groups consisting ofcontrol subjects only.
When we compared groups of randomly drawn, age-matched TDchildren with similar levels of head motion, differences in DW-MRImeasures of anisotropy and diffusivity were close to zero and the falsepositive rate was uniformly at 5% for all 18 pathways (Figs. 8a, 9a).However, the magnitude of the differences increased substantiallywhen one group of TD children exhibited more head motion than theother (Figs. 8b, 9b). The motion differences between these groupswere even subtler than the differences between ASD and TD groups inour previous set of experiments. We were also able to detect within-subject differences between the lower-motion and higher-motionscans of a set of TD children who had received test–retest scans, evenafter removing the subjects with the most head motion (Fig. 11). Thepattern that emerged from our analyses of data from TD children wasthat, asmotion increased, there was an overestimation of RD, accompa-nied by an underestimation of AD. This led to a significant underestima-tion of FA but only a very small (non-significant) overestimation of MD.
The pathways that exhibited the most substantial motion-inducedgroup differences in our datawere the corpus callosum and the cingulumbundle. Perhaps this is related to the proximity of non-brain voxels (suchas the ventricles) to a sizeable portion of those pathways. Furthermore, inour voxel-based analysis of the association of FA and motion, deeperbrain areas appear to be more affected than more superficial ones (seeSupplementary figure). Thus distance from the head coils may also bea factor. Interestingly, anisotropy and diffusivity measures for thecorpus callosum and cingulum bundle have often been reported in theliterature to differ between a variety of clinical populations and healthysubjects (Salat, in press; Stebbins and Murphy, 2009; Bohanna et al.,2008; Cochrane and Ebmeier, 2013; Inglese and Bester, 2010; Kubickiet al., 2007; Travers et al., 2012). This raises questions about the extentto which differences in head motion between the clinical and controlpopulation may be a confound in such studies, particularly given thatreporting levels of head motion by group is not commonplace in theliterature.
Strategies for group comparisons
There are several approaches to comparing DW-MRI measures be-tween groups. In this work, we have focused on mean values of suchmeasures over major WM pathways, as obtained from tractography.Motion will affect these mean values if it affects a large enough portion
of the pathway. As can be seen in the statistical maps produced by avoxel-wise analysis (Supplementary figure), the effects of motion maybe more significant in certain parts of a given pathway than others.Thus, one would expect that if tractography were used to compareDW-MRI measures along the trajectory of a pathway, the effects ofmotion might not be homogeneous over the entire trajectory. In general,wewould not expect results from voxel-wise statistical analysis, which isperformed in a common template space and thus relies on good spatialalignment of subjects in that space, to agree perfectlywith tract-wise sta-tistical analysis, wheremeasures are extracted in the native space of eachsubject.
An alternative approach to defining WM pathways, instead oftractography, is to use regions of interest from an atlas (e.g., Faria et al.(2011); Keihaninejad et al. (2013)). This would rely on accurate reg-istration of the individual to the atlas but it would not rely on theDW-MRI data beyond that. Our approach is an intermediate one, whereprior information from an atlas is used to constrain the tractography so-lutions in areas where there is uncertainty in the DW-MRI data. Finally,if a study were to examine more than one of the pathways includedhere, the p-values would typically be corrected for multiple compari-sons. If we applied Bonferroni correction to the results of Fig. 9, thenboth the blue line indicating the threshold and the bars indicating thefrequency of significant findings would be lower than they are now.However, for the trials with greatermotion differences between groups,the frequency of significant findings would still be above the blue line,and thus greater than what would be expected by random chancealone, for the same pathways.
Our results are based on data from children aged 5–12, a populationthat is particularly challenging to scan regardless of diagnosis. However,our voxel-based analysis (Supplementary figure) replicates a result onthe sensitivity of the corpus callosum to motion that has been shownelsewhere for a group of middle-aged and older adults (Salat, in press,Fig. 10). Importantly, even if the average adult moved less that the sub-jects in our study, studies of adult subjects could still be confounded bydifferent amounts of head motion between groups, such as younger vs.older or clinical vs. control populations.
A potential concernwhen analyzing image data from children is thatanalysis methods that have been developed for adult subjects may notbe appropriate. Our tractography method relies on an automatedsurface reconstruction and segmentation of our subjects' T1-weightedimages. The validity of this particular anatomical data processing streamand its lack of age-related bias have been shown previously for childrenof the same age range (Ghosh et al., 2010). Our tractography algorithmdoes not rely on exact spatial alignment of our subjects to an atlas, as ituses information only about which anatomical labels each pathwaypasses through or next to, and not about the exact spatial coordinatesor shape of the pathways (Yendiki et al., 2011).
Strategies for motion compensation
Having illustrated the impact that headmotion can have onDW-MRIgroup studies, our results underline the importance of accounting formotion in any such studywhere one population is more prone tomotionin the scanner than the other. In general, methods for motion compensa-tion in imaging data are either retrospective, i.e., they are performed as apost-processing step after the images are acquired, or prospective, i.e.,they are built into the image acquisition. In the following we discussthese potential remedies briefly.
The most popular retrospective approach to motion correction inDW-MRI relies on image registration to align the DW images to a base-line image (Andersson and Skare, 2002; Rohde et al., 2004). However,the effects of head motion on DW-MRI are two-fold; it can causemisalignment between different volumes in the DW-MRI series but itcan also alter the intensity values of a specific volume (or,more appropri-ately for a 2D acquisition, a specific slice), if head motion occurs duringthe diffusion-encoding gradient pulse. Although registration-based
88 A. Yendiki et al. / NeuroImage 88 (2014) 79–90
correctionwill address themisalignment between volumes, the drop-outin intensity values will persist. All the results shown in the present studywere obtained after performing registration-based correction.
A common strategy for controlling confounding factors in neuroim-aging group studies is to introduce these factors as linear regressors instatistical analyses. In this work we used TMI, a composite index definedfrom four measures of motion, as a nuisance regressor in the statisticalanalysis of the mean values of FA, MD, RD, and AD in each pathway.The use of this regressor allowedus to reduce the frequency of significantfindings among trials with high motion difference between groups,making it very similar to the respective frequency among trials withlow motion difference between groups. This was the case in compari-sons between children with ASD and TD children (Fig. 7), as well ascomparisons between TD children with lower and higher motion(Fig. 10). We found TMI to be more effective in this regard than theindividual motion measures (results not shown). Of course, any suchlinear regression approach is ad hoc, as anisotropy and diffusivitymeasures are not linear with respect to global motion parameters.Thus regressors cannot be expected to eliminate false positivescompletely. A true model-based approach would involve knowledgeof the trajectory of headmotion during the acquisition of each slice. Fur-thermore, measures of motion may be linearly dependent with respectto other regressors that are often included in DW-MRI group analyses,most notably age.
Another retrospective approach to addressing the effects of motion isoutlier rejection. This can range from a procedure as simple as discardingan entire scan that exceeds acceptable levels of motion, either by visualinspection or based on a hard threshold on motion parameters, to statis-ticalmethods for detecting anddiscarding subsets of the data in each scanas outliers (Chang et al., 2005; Zwiers, 2010).When discarding subsets ofthe data in a scan, i.e., volumes or slices, the amount of redundancy ineach data set is an important consideration. It has been shown that theminimum number of distinct gradient directions that are necessary forrobust estimation of FA values is 30 (Jones, 2004). Thus it is desirable tohave more than 30 gradient directions per data set, so that outliervolumes can be discarded and scans with intermittent head motion canstill be used without introducing bias in the analyses. However, thedata in the present study included only 30 gradient directions. In the ab-sence of redundancy, we chose to discard egregiously poor scans in theirentirety but maintain the full range of data quality in the scans that wereincluded in our analyses.
Specifically, we inspected all scans and discarded only the oneswhere head motion led to visibly poor quality of the FA maps. This wasthe case for 17 scans, or roughly 10% of the full set of data. As seen inFig. 2, the scans that we discarded based on visual inspection includedmost if not all of the scans that would be deemed outliers based on oneof the four measures of motion. (Note that, if a scan had visible signaldrop-out in a slice at the very top or base of the brain that would notaffect the major WM pathways, we did not discard it. Hence a few ofthe scans included in the analyses may score high in terms of signaldrop-out but none scores high in terms of the percentage of affectedslices.) Some of the 17 discarded scans were outliers based on only oneof the four motion measures, some were outliers based on more thanone measure, and some were not outliers based on any of these mea-sures. This illustrates the difficulty in setting a hard threshold on motionmeasures for excluding scans from a study and the importance of takinginto account all such measures, as well as inspecting the data visually.Hard thresholds that have been used in other autism studies are 2 mmof translational motion (Knaus et al., 2010; Shukla et al., 2011) and 2°of rotational motion (Knaus et al., 2010). As seen in Fig. 3, none of thedata sets included in our analyses exceeded the 2° threshold. Only twodata sets exceeded the 2 mm threshold, and excluding them from theanalyses did not change our results.
The approach thatwe followed here, applying one of themostwidelyavailable methods for registration-based correction (Jenkinson et al.,2002) and discarding poor-quality scans based on visual inspection,
is certainly not the only possible route but it is one that we believereflects current common practices. No matter which combination ofregistration-based and outlier-based corrections is used, however, aconcern with all such retrospective methods is that data with differentlevels of motion will also be subjected to different levels of processing.In a group study where subjects from one group tend to move more,scans from this group will have more volumes smoothed due to theinterpolation performed by a registration-based motion correctionmethod, and more data points removed by a method for rejectingoutlier slices or volumes.
A potential remedy for the residual effects of motion that cannot beremoved by retrospective correction methods, as well as the effects oftreating one group more than the other with such methods, is tomake sure that the scans in the two groups are matched with respectto some summary measures of motion. Our results indicate that, whenthe groups do not differ in terms of the motion measures that weconsidered in this work, the chance of false positive findings is reducedsubstantially. However, even if matching groups for motion measurescan decrease false positives, it will not address the potential for falsenegatives due to motion. That is, the contamination of the image datawith motion, even if that motion is comparable between groups, mayocclude true but subtle differences in WM microstructure. For accuratemeasures of this microstructure, one needs not only equal motion arti-facts between groups, but ideally no motion artifacts at all.
An additional drawback of motion correction methods that rely onregistration of DW images is that their performance is dependent onthe b-value. Images acquired with very high b-values do not containenough anatomical features to be registered accurately. For such data,it is not possible to use registration-based approaches, either to correcttranslational and rotational motion, or to quantify it andmatch it acrosspopulations. This makes motion correction particularly problematic forhigh-angular resolution DW-MRI scans that require the acquisition ofdatawith higher b-values than routine scans. Such high-angular resolu-tion acquisitions are at once more sensitive to head motion due tohigher diffusion contrast at high b-values and more likely to includehead motion due to the longer scan time needed to acquire morediffusion-encoding gradient directions.
Prospective methods for motion correction have been proposed toovercome some of the limitations of retrospective methods. Severalmotion-compensated sequences for DW-MRI have been introducedrecently, using volume registration (Benner et al., 2011; Sarlls et al.,2012), external optical tracking systems (Aksoy et al., 2011), free-induction decay navigators (Kober et al., 2012), or volumetric navigators(Alhamud et al., 2012; Bhat et al., 2012). In Aksoy et al. (2011) andAlhamud et al. (2012) the authors compare their methods to standardretrospective methods for motion correction and show that the prospec-tive approach leads to improved performance. A particular benefit of pro-spective motion correction is that it avoids the interpolation of imageintensities performedby registration-based retrospectivemethods. In ad-dition to motion-compensated sequences, a promising development forDW-MRI is accelerated acquisition methods (Feinberg and Setsompop,2013), as reducing the duration of a scanwill alsomake it less susceptibleto subject motion.
Further analyses
The results presented here show the effects ofmotion on group com-parisons of anisotropy and diffusivity. However, there are other types ofanalyses thatwe havenot investigated in thiswork but thatmaybe con-founded by head motion:
• Differences in lateralization of diffusionmeasures between groups. It is notentirely clear how differences in headmotionmight affect differencesin lateralization. If subjects in one group moved more, thus reducingthe apparent anisotropy in both hemispheres, power to detect differ-ences between hemispheres in that group could be reduced.Whether
89A. Yendiki et al. / NeuroImage 88 (2014) 79–90
these differences would still be detectable would also depend on thelevel of noise in the data.
• Correlation of diffusion measures with other study parameters. Theamount of head motion that subjects exhibit in the scanner could becorrelated with several demographic and behavioral attributes ofthe subjects, including age, IQ, cognitive performance metrics, orsymptom severity for various conditions. If such a correlation existed,motion could induce spurious associations between demographic orbehavioral parameters and themeasures of anisotropy and diffusivityextracted from DW-MRI data.
Implications for autism studies and beyond
In the autism literature,whichhas been themotivation for thiswork,findings of all the types listed above have been reported (Travers et al.,2012). Among the 48 studies reviewed in Travers et al. (2012), thefollowing strategies for mitigating motion artifacts are mentioned:retrospective registration-based correction in 30 studies; ad hoc outlierrejection (discarding entire scans either by visual inspection or by ahard threshold on amotion parameter) in 13 studies; and selective seda-tion (only for themost challenging subjects) in 10 studies. However, de-spite the limitations of the above approaches, very few of the 48 studiesreport measures of head motion for subjects in each group.
Specifically, Thakkar et al. report that there was no significant differ-ence in translationalmotion between subjectswith ASD and control sub-jects in their study (although thosemotionmeasures are estimated froma functional MRI scan). They find significant FA differences betweengroups in the subcortical WM underlying a number of cortical regionsof interest (Thakkar et al., 2008). Knaus et al. report that there were nosignificant group differences in motion parameters in the DW-MRIscans of their subjects, based on a multivariate analysis of variance.They find no significant group differences in the FA of the arcuate fascic-ulus (Knaus et al., 2010). Shukla et al. report that there were no signifi-cant group differences in translational or rotational motion in theirDW-MRI data. They find significant group differences in FA in a region-of-interest analysis (Shukla et al., 2010), aswell as a voxel-based analysis(Shukla et al., 2011). Groen follows a statistical approach to outlier re-moval as part of the tensor estimation step. The author uses the meandiffusivity values in cerebrospinal fluid to quantify motion artifacts andreports that there was no significant difference between groups in thatrespect. Groen finds no significant group differences in FA aftercorrecting for age and IQ, but does find significant differences in meandiffusivity. In addition, that work reports a significantly higher numberof voxels classified as outliers in subjects with ASD than control subjects(Groen, 2011).Weinstein et al. use sedation for all of the subjects in theirstudy. They find significant FA differences between groups in a voxel-based analysis (Weinstein et al., 2010). In a more recent study, Walkeret al. compare sedated children with ASD to sleeping TD children. Theyfind significant but small differences in FA, on the order of 1%–2%, invoxel-based analyses. Importantly, they also study the spatial distribu-tion of artifacts, as identified by theirmethod for detecting outlier voxels,and they report differences between the two groups. The authors con-clude that these differences may be partly due to more head motion inthe unsedated TD subjects than the sedated subjects with ASD, andthat this could have affected certain aspects of their DW-MRI findings(Walker et al., 2012).
Taken together, the studies discussed above suggest that differencesin measures derived from DW-MRI between subjects with autism andcontrol subjects could not be explained entirely by head motion, andthat true effects are likely to exist. However, as we have shown here,it is worth revisiting studies that have not reported measures of motionand examining whether group differences in motion exist and, if so,whether controlling for this and using analysis methods that are robustto outliers increase the specificity of the findings. In our own data, wefind significant but not wide-spread differences between children withASD and TD children, after matching the groups for motion (Koldewyn
et al., in review). Specifically, our follow-up analyses confirm that differ-ences between the two groups in the right ILF persist even after headmo-tion is accounted for.
The small portion of studies that report measures of motion for eachgroup is not characteristic only of the autism literature. It is representa-tive of the wide range of applications that use DW-MRI to infer groupdifferences inWMmicrostructure. Our results show the impact that dif-ferences in head motion between groups can have on DW-MRI groupstudies and thus underline the importance of reporting measures ofheadmotion. If differences in the amount of motion are found betweenthe groups, a combination of the retrospective correction methodsdescribed above, i.e., between-volume registration, outlier rejection,and using motion measures as nuisance regressors, will mitigate theeffects of motion. However, it is important to note the limitations ofthese approaches and not to assume that they will eliminate all sucheffects completely. Ultimately, our results demonstrate the significanceof developing motion-compensated acquisition methods for DW-MRIand incorporating them into the common practice of neuroimagingstudies.
Conclusions
We found that small differences in the amount of head motion be-tween two groups of subjects were sufficient to yield false positive find-ings of differences in anisotropy and diffusivity between the groups, andthat some WM pathways were more sensitive to this than others. Thepopular post-processing approach to motion correction by registrationof DW images to a baseline image did not eliminate the problem. The in-troduction of a motion index as a regressor in the analysis reduced thefalse positives substantially. Our results have implications for any diffu-sion MRI study where one population is less likely to remain still in thescanner than the other. Specifically, these results highlight the impor-tance of (i) ensuring that there are no group differences in motion andreporting motion measures by group in any study that reports groupdifferences in the DW-MRI measures that we studied here, and (ii)using motion-compensated acquisition methods for DW-MRI in futurestudies.
Acknowledgments
The authors would like to thank Drs. Dorit Kliemann of FreieUniversität Berlin and Dylan Tisdall of Massachusetts General Hospitalfor helpful discussions on issues related to this paper.
Support for this research was provided in part by The Autism &Dyslexia Project funded by the Ellison Medical Foundation, theNational Institute for Biomedical Imaging and Bioengineering (Pathwayto Independence award K99/R00-EB008129, R01-EB006758), the Na-tional Center for Research Resources (P41-RR14075, U24-RR021382),the National Institute on Aging (AG022381, 5R01-AG008122-22), theNational Center for Alternative Medicine (RC1-AT005728-01), andthe National Institute for Neurological Disorders and Stroke (R01-NS052585-01, 1R21-NS072652-01, 1R01-NS070963), and was madepossible by the resources provided by Shared Instrumentation Grants1S10RR023401, 1S10RR019307, and 1S10RR023043. Additional supportwas provided by the National Institutes of Health Blueprint for Neurosci-ence Research (5U01-MH093765), part of the multi-institutional HumanConnectome Project.
Conflict of interest
B.F. has a financial interest in CorticoMetrics, a company whosemedical pursuits focus on brain imaging and measurement technol-ogies. B.F.'s interests were reviewed and are managed by Massachu-setts General Hospital and Partners HealthCare in accordancewith theirconflict of interest policies.
90 A. Yendiki et al. / NeuroImage 88 (2014) 79–90
Appendix A. Supplementary data
Supplementary data to this article can be found online at http://dx.doi.org/10.1016/j.neuroimage.2013.11.027.
References
Aksoy, M.M., Forman, C.C., Straka, M.M., Skare, S.S., Holdsworth, S.S., Hornegger, J.J.,Bammer, R.R., 2011. Real-time optical motion correction for diffusion tensor imaging.Magn. Reson. Med. 66 (2), 366–378 (Aug.).
Alhamud, A., Tisdall, M.D., Hess, A.T., Hasan, K.M., Meintjes, E.M., van der Kouwe, A.J.W.,2012. Volumetric navigators for real-timemotion correction in diffusion tensor imaging.Magn. Reson. Med. 68 (4), 1097–1108 (Oct.).
Anderson, A.W., Gore, J.C., 1994. Analysis and correction of motion artifacts in diffusionweighted imaging. Magn. Reson. Med. 32 (3), 379–387 (Sep.).
Andersson, J.L.R., Skare, S., 2002. A model-based method for retrospective correctionof geometric distortions in diffusion-weighted EPI. NeuroImage 16 (1), 177–199(May).
Behrens, T.E.J., Berg, H.J., Jbabdi, S., Rushworth,M.F.S.,Woolrich, M.W., 2007. Probabilistic dif-fusion tractographywithmultiple fibre orientations: what canwe gain? NeuroImage 34(1), 144–155 (Jan).
Benner, T., van der Kouwe, A.J.W., Sorensen, A.G., 2011. Diffusion imaging with prospectivemotion correction and reacquisition. Magn. Reson. Med. 66 (1), 154–167 (Jul.).
Bhat, H., Tisdall, M.D., van der Kouwe, A.J.W., Feiweier, T., Heberlein, K., 2012. Epi navigatorbased prospective motion correction technique for diffusion neuroimaging. Proc. Int.Soc. Magn. Reson. Med. 20, 113.
Bohanna, I., Georgiou-Karistianis, N., Hannan, A., Egan, G., 2008. Magnetic resonanceimaging as an approach towards identifying neuropathological biomarkers forHuntington's disease. Brain Res. Rev. 58 (1), 209.
Chang, L.-C., Jones, D.K., Pierpaoli, C., 2005. RESTORE: robust estimation of tensors by outlierrejection. Magn. Reson. Med. 53 (5), 1088–1095.
Cochrane, C.J.C., Ebmeier, K.P.K., 2013. Diffusion tensor imaging in parkinsonian syndromes:a systematic review and meta-analysis. Neurology 80 (9), 857–864 (Feb.).
Constantino, J., Gruber, C., (Firm), W.P.S., 2007. Social Responsiveness Scale (SRS). WesternPsychological Services.
Faria, A.V., Hoon, A., Stashinko, E., Li, X., Jiang, H., Mashayekh, A., Akhter, K., Hsu, J., Oishi,K., Zhang, J., Miller, M.I., van Zijl, P.C.M., Mori, S., 2011. Quantitative analysis of brainpathology based on MRI and brain atlases—applications for cerebral palsy.NeuroImage 54 (3), 1854–1861 (Feb.).
Feinberg, D.A., Setsompop, K., 2013. Ultra-fast MRI of the human brain with simultaneousmulti-slice imaging. J. Magn. Reson. 229, 90–100 (San Diego, Calif.: 1997, Apr.).
Fischl, B., Salat, D.H., Busa, E., Albert, M., Dieterich, M., Haselgrove, C., van der Kouwe, A.,Killiany, R., Kennedy, D., Klaveness, S., Montillo, A., Makris, N., Rosen, B., Dale, A.M.,2002. Whole brain segmentation: automated labeling of neuroanatomical structuresin the human brain. Neuron 33 (3), 341–355 (Jan).
Fischl, B., Salat, D.H., van der Kouwe, A.J.W., Makris, N., Ségonne, F., Quinn, B.T., Dale,A.M., 2004a. Sequence-independent segmentation of magnetic resonance images.NeuroImage 23 (Suppl. 1), S69–S84 (Jan).
Fischl, B., van der Kouwe, A., Destrieux, C., Halgren, E., Ségonne, F., Salat, D.H., Busa, E.,Seidman, L.J., Goldstein, J., Kennedy, D., Caviness, V., Makris, N., Rosen, B., Dale, A.M.,2004b. Automatically parcellating the human cerebral cortex. Cereb. Cortex 14 (1),11–22 (Jan).
Ghosh, S.S., Kakunoori, S., Augustinack, J., Nieto-Castanon, A., Kovelman, I., Gaab, N.,Christodoulou, J.A., Triantafyllou, C., Gabrieli, J.D.E., Fischl, B., 2010. Evaluating thevalidity of volume-based and surface-based brain image registration for developmentalcognitive neuroscience studies in children 4 to 11 years of age. NeuroImage 53 (1),85–93 (Oct.).
Groen,W., 2011. Pervasivemicrostructural abnormalities in autism: a DTI study. J. PsychiatryNeurosci. 36 (1), 32–40 (Jan.).
Inglese, M., Bester, M., 2010. Diffusion imaging in multiple sclerosis: research and clinicalimplications. NMR Biomed. 23 (7), 865–872 (Aug.).
Jenkinson, M., Bannister, P., Brady, M., Smith, S., 2002. Improved optimization for the robustand accurate linear registration and motion correction of brain images. NeuroImage 17(2), 825–841 (Oct).
Jones, D.K., 2004. The effect of gradient sampling schemes on measures derived from dif-fusion tensor MRI: a Monte Carlo study. Magn. Reson. Med. 51 (4), 807–815 (Apr).
Jones, D.K., Cercignani, M., 2010. Twenty-five pitfalls in the analysis of diffusion MRI data.NMR Biomed. 23 (7), 803–820 (Aug).
Jones, D.K., Knösche, T.R., Turner, R., 2013. White matter integrity, fiber count, and otherfallacies: the do's and don'ts of diffusion MRI. NeuroImage 73, 239–254 (Jun.).
Kaufman, A.S., Kaufman, N.L., 2004. Kaufman Brief Intelligence Test, 2nd ed. NCS, Pearson,Inc., Minneapolis, MN.
Keihaninejad, S., Zhang, H., Ryan, N.S., Malone, I.B., Modat, M., Cardoso, M.J., Cash, D.M.,Fox, N.C., Ourselin, S., 2013. An unbiased longitudinal analysis framework for trackingwhite matter changes using diffusion tensor imaging with application to Alzheimer'sdisease. NeuroImage 72, 153–163 (May).
Keil, B.B., Alagappan, V.V., Mareyam, A.A., McNab, J.A.J., Fujimoto, K.K., Tountcheva, V.V.,Triantafyllou, C.C., Dilks, D.D.D., Kanwisher, N.N., Lin, W.W., Grant, P.E.P., Wald,L.L.L., 2011. Size-optimized 32-channel brain arrays for 3 T pediatric imaging.Magn. Reson. Med. 66 (6), 1777–1787 (Dec.).
Knaus, T.A.T., Silver, A.M.A., Kennedy, M.M., Lindgren, K.A.K., Dominick, K.C.K., Siegel, J.J.,Tager-Flusberg, H.H., 2010. Language laterality in autism spectrum disorder andtypical controls: a functional, volumetric, and diffusion tensor MRI study. Brain Lang.112 (2), 8-8 (Feb.).
Kober, T., Gruetter, R., Krueger, G., 2012. Prospective and retrospective motion correctionin diffusionmagnetic resonance imaging of the human brain. NeuroImage 59 (1), 10-10(Jan.).
Koldewyn, K., Jiang, Y.V.,Weigelt, S., Kanwisher, N., 2013. Global/local processing in autism:not a disability, but a disinclination. J. Autism Dev. Disord. 43 (10), 2329–2340 (Oct.).
Koldewyn, K., Yendiki, A., Weigelt, S., Gweon, H., Julian, J., Richardson, H., Malloy, C., Saxe,R., Fischl, B., Kanwisher, N., 2013w. Reduced Integrity of the Right Inferior LongitudinalFasciculus but no General Reduction in White Matter Integrity in ASD (in review).
Kubicki, M., McCarley, R., Westin, C.-F., Park, H.-J., Maier, S., Kikinis, R., Jolesz, F.A.,Shenton, M.E., 2007. A review of diffusion tensor imaging studies in schizophrenia.J. Psychiatr. Res. 41 (1–2), 15–30 (Jan).
Leemans, A., Jones, D.K., 2009. The B-matrix must be rotated when correcting for subjectmotion in DTI data. Magn. Reson. Med. 61 (6), 1336–1349 (Jun).
Lord, C.C., Risi, S.S., Lambrecht, L.L., Cook, E.H.E., Leventhal, B.L.B., DiLavore, P.C.P., Pickles,A.A., Rutter, M.M., 2000. The autismdiagnostic observation schedule-generic: a standardmeasure of social and communication deficits associated with the spectrum of autism.J. Autism Dev. Disord. 30 (3), 205–223 (Jun.).
Metzler-Baddeley, C., O'Sullivan, M.J., Bells, S., Pasternak, O., Jones, D.K., 2012. How andhow not to correct for CSF-contamination in diffusion MRI. NeuroImage 59 (2),1394–1403 (Jan.).
Nichols, T.E., Holmes, A.P., 2002. Nonparametric permutation tests for functional neuro-imaging: a primer with examples. Hum. Brain Mapp. 15 (1), 1–25 (Jan.).
Rohde, G.K.G., Barnett, A.S.A., Basser, P.J.P., Marenco, S.S., Pierpaoli, C.C., 2004. Comprehensiveapproach for correction of motion and distortion in diffusion-weighted MRI. Magn.Reson. Med. 51 (1), 103–114 (Jan.).
Salat, D.H., 2013. Chapter 12 — diffusion tensor imaging in the study of aging and age-associated neural disease, In: Johansen-Berg, H., Behrens, T.E. (Eds.), Diffusion MRI,2nd ed. Academic Press, San Diego (in press).
Sarlls, Joelle E., Shaw, Philip, Adleman, N.E., Rooopchansingh, V., 2012. Straightforwardmethod to improve sensitivity in diffusion imaging studies of subjects who move.Proc. Int. Soc. Magn. Reson. Med. 20, 3551.
Shukla, D.K., Keehn, B., Lincoln, A.J., Müller, R.-A., 2010.Whitematter compromise of callosaland subcortical fiber tracts in children with autism spectrum disorder: a diffusion ten-sor imaging study. J. Am. Acad. Child Adolesc. Psychiatry 49 (12) (1269–1278.e2, Dec.).
Shukla, D.K., Keehn, B., Müller, R.-A., 2011. Tract-specific analyses of diffusion tensor im-aging show widespread white matter compromise in autism spectrum disorder.J. Child Psychol. Psychiatry 52 (3), 286–295 (Mar.).
Smith, S.M., Nichols, T.E., Jan. 2009. Threshold-free cluster enhancement: addressingproblems of smoothing, threshold dependence and localisation in cluster inference.NeuroImage 44 (1), 83–98.
Smith, S.M., Jenkinson, M., Johansen-Berg, H., Rueckert, D., Nichols, T.E., Mackay, C.E.,Watkins, K.E., Ciccarelli, O., Cader, M.Z., Matthews, P.M., Behrens, T.E.J., 2006. Tract-based spatial statistics: voxelwise analysis of multi-subject diffusion data. NeuroImage31 (4), 1487–1505 (Jul.).
Stebbins, G.T., Murphy, C.M., 2009. Diffusion tensor imaging in Alzheimer's disease andmild cognitive impairment. Behav. Neurol. 21 (1), 39–49.
Thakkar, K.N.K., Polli, F.E.F., Joseph, R.M.R., Tuch, D.S.D., Hadjikhani, N.N., Barton, J.J.S.J.,Manoach, D.S.D., 2008. Responsemonitoring, repetitive behaviour and anterior cingulateabnormalities in autism spectrum disorders (ASD). Brain 131 (Pt 9), 2464–2478 (Sep.).
Tisdall, M.D., Hess, A.T., Reuter, M., Meintjes, E.M., Fischl, B., van der Kouwe, A.J.W., 2012.Volumetric navigators for prospective motion correction and selective reacquisitionin neuroanatomical MRI. Magn. Reson. Med. 68 (2), 389–399 (Aug.).
Travers, B.G., Adluru, N., Ennis, C., Tromp, D.P.M., Destiche, D., Doran, S., Bigler, E.D., Lange,N., Lainhart, J.E., Alexander, A.L., 2012. Diffusion tensor imaging in autism spectrumdisorder: a review. Autism Res. 5 (5), 289–313 (Oct.).
van der Kouwe, A.J.W., Benner, T., Salat, D.H., Fischl, B., 2008. Brain morphometry withmultiecho MPRAGE. NeuroImage 40 (2), 559–569 (Apr.).
Walker, L., Gozzi, M., Lenroot, R., Thurm, A., Behseta, B., Swedo, S., Pierpaoli, C., 2012. Dif-fusion tensor imaging in young children with autism: biological effects and potentialconfounds. Biol. Psychiatry 72 (12), 1043–1051 (Dec.).
Weinstein, M., Ben-Sira, L., Levy, Y., Zachor, D.A., Itzhak, E.B., Artzi, M., Tarrasch, R.,Eksteine, P.M., Hendler, T., Bashat, D.B., 2010. Abnormal white matter integrity inyoung children with autism. Hum. Brain Mapp. 32 (4), 534–543 (May).
Yendiki, A., Panneck, P., Srinivasan, P., Stevens, A., Zöllei, L., Augustinack, J., Wang, R., Salat,D., Ehrlich, S., Behrens, T., Jbabdi, S., Gollub, R., Fischl, B., 2011. Automated probabilisticreconstruction of white-matter pathways in health and disease using an atlas of theunderlying anatomy. Front. Neuroinformatics 5, 23.
Yoshida, S., Oishi, K., Faria, A.V., Mori, S., 2013. Diffusion tensor imaging of normal braindevelopment. Pediatr. Radiol. 43 (1), 15–27 (Jan.).
Zwiers, M.P., 2010. Patching cardiac and head motion artefacts in diffusion-weightedimages. NeuroImage 53 (2), 565–575 (Nov.).