Embed Size (px)
Citation preview

Analysis of process parameters during press quenching of bevel gear parts
Mats Bagge 1,2
, Bengt Lindberg2
1 Scania CV AB, Södertälje, Sweden
2 Royal Institute of Technology, KTH Production Engineering, Stockholm, Sweden
Corresponding author: [email protected]
ABSTRACT Defining manufacturing tolerances is an important task for a process planner before starting production of a new product or introducing new processes. One of the more complex processes to handle is the heat treatment of gears. Press quenching is a heat treatment method where the gear is mechanically forced to keep or attain the desired geometry, with less geometrical distortions in comparison to oil bath quenching. The objective of this paper is to discover how design of experiments can be used to scrutinize press quenching of bevel gears. The first part of this investigation shows how different process parameter settings influence geometry of the bevel gear. Based on the results of the experiments, predictions and statistical simulations, the outcome of the press quenching process can be estimated. Estimations for the number of defect parts then form the basis for evaluating whether the proposed tolerances meet the quality requirements.
The work is based on an industrial case where 55 bevel gear crown wheels for heavy trucks are carburized and then case hardened in a Gleason press quenching machine.
Keywords: Press quenching, Bevel gears, Design of experiments, Tolerance analysis
1. INTRODUCTION
Tolerances are used as limits for determining what is correct or incorrect. Tolerances are both defined for the finished part and for each step required during the manufacturing process. It is assumed that manufacturing tolerances will be met; otherwise problems may occur when creating a correct finished part. To form an estimate for the possibility to comply with a certain tolerance, you must be aware of how the manufacturing process behaves and the controlling parameters that can be used. Defining the tolerances is one of the main tasks during process planning.
This research shows how design of experiments can be used to understand the process, even if the underlying physical properties and mechanisms are not fully known, and then when assessing the appropriate tolerances. This is exemplified by investigating press quenching of bevel gear crown wheels for trucks.
The focus of this work is to find possible statistical relations between process control factors and their impact on dimensional properties, not to explain the underlying physical properties and mechanisms, such as material characteristics and phase transformations.
1.1 Press Quenching of Bevel gears
The complete bevel gear set is case hardened to increase both the fatigue strength and wear resistance
of the material [1]. The process of case hardening can be roughly described in two steps: 1) heating and carburizing 2) quenching in oil.
The higher carbon content in the surface region, achieved while carburizing, is together with the quenching important prerequisites to get martensite transformation, which in turn gives the characteristics; strength and wear resistance [2]. As well as the martensite is desirable it will result in, not only favourable residual stresses in the material, but changes in geometrical size and shape of the bevel gear part [3].
During the martensite transformation, conditions such as an inhomogeneous material structure, commencing in the steel works and forge shop, together with asymmetric shape of the gear wheel and variation in the operational setup, potentially alter the results of the geometrical changes in the part [4]. These changes, defined as distortions, cannot be completely eliminated but in some extent controlled.
Distortions appear as either systematic or stochastic shape changes, the latter being the least desirable. Systematic changes are predictable, and in some cases possible to be compensated for in soft machining operations. Stochastic changes are not.
One means of controlling and reducing the proportion of distortions is to place the gear in a hydraulic pressing machine throughout the quenching process [5]. In this

press quenching machine, the idea is mainly to force the crown wheel to keep or attain a certain shape with less distortion compared to quenching in an oil bath.
Different parameters in the press quenching machine can be controlled and set to help achieve the desired geometrical shape of the crown wheel. Typical parameters are press forces, oil flow rate and quenching time. The tool setup may also be changed or adjusted for certain purposes.
Minimizing distortions by force in the press quenching machine is one feature that distinguish this method from oil bath quenching. As the way of quenching is important for the martensite transformation, it is also of great interest to control the appearance, distribution and flow of quench oil around the part to avoid distortions [6] [7]. In a press quenching machine, the possibilities to design the tools and control the settings for oil flow rates, facilitates more controlled quenching and consequently more predictable distortions compared to an oil bath.
1.2 The bevel gear crown wheel
The part used in this investigation is a bevel gear crown wheel, with major dimensions in accordance with Figure 1. The crown wheel is made of case hardening steel similar to 17NiCrMoS6-4 [8].
Figure 1 Major dimensions in millimeters of the bevel gear crown wheel
Two geometrical properties are of special interest and dealt with in this paper:
1. Centre hole diameter 240 mm (Ø240)
2. Conical properties of back face (dishing)
Both the hole with diameter 240 mm and the back face will be machined in hard condition later in the manufacturing process. However it is still important to control these properties by means of machining allowance and finally, how an overall shape change of the part will affect gear quality.
1.3 Issues to solve
Despite the press quenching machine having an expanding mandrel aimed to control Ø240, the effect is not obvious when studying historical production data. Data for Ø240 versus the corresponding expander pressure shown in Figure 2 does not correlate as expected.
Figure 2 Historical production data for diameter 240 mm, compared to the corresponding expander
pressure
This is an example that a manufacturing process is not simple to deduce and understand when only observing existing data. More attention is needed to examine the relation between the process parameter (expander pressure) and the result (Ø240).
With this example in mind, two questions are raised:
1. Is it possible to control Ø240 by adjusting expander pressure in the press quenching machine?
2. Is it possible to control any other important geometrical characteristics by using proper settings in the machine?
In this research, design of experiments is used to answer these questions. Subsequently statistical methods are applied to analyse if proposed tolerances comply with the required quality level, expressed as defects per million opportunities (DPMO).
2. METHOD
2.1 Test procedure
The manufacturing process, including extra measuring efforts for this investigation, is described in Figure 3.
Figure 3 Process for manufacturing of bevel gears
55 crown wheels were soft machined from blanks in forged and annealed condition. The blanks were gathered from two batches of material, produced by two
65
Ø480
Ø240Back face
0
10
20
30
40
50
60
239,5
239,6
239,7
239,8
239,9
240,0
240,1
240,2
240,3
240,4
Pre
ssu
re [
bar
]
Dia
me
ter
[mm
]
Ø240 Tolerance limits Expander pressure
Soft machining:
Turning
Drilling
Gear cutting
Carburizing
Press QuenchingCoordinate measuring
(warm condition)
Part surface
temperature measuringTempering
Steel works
Closed die forging
and Annealing
Hard machining:
Turning
Lapping or grinding
Quench oil
temperature log

different suppliers. 27 pieces were made from material batch M1 and 28 pieces from batch M2.
Soft machining was followed by carburizing. The continuous carburizing pusher furnace has three parallel tracks for charging trays. A typical tray arrangement of gear parts charged on five levels is shown in Figure 4.
Figure 4 Tray charged with bevel gear crown wheels in five levels
Trays are pushed along the furnace tracks at defined rates and unloaded by one automatic manipulator that serves one track at a time. The resulting sequence determines when each of the three Gleason press quenching machines is running or idle.
2.2 Gleason No. 537 press quenching machine
Press quenching has been performed in a Gleason No. 537 machine, built in 1989 using Statoil Quenchway 35B oil [9]. See Figure 5 a-c.
Figure 5 a) Gleason press quenching machine b) Lower die and expander mandrel
c) Carburized bevel gear placed on the lower die.
The machine has an internal quench oil system of 1.3m
3 with an oil pump that provides continuous flow of
1.1m3/min. around the gear part. Tempered oil (58±4°C)
is continuously supplied to the machine from an external 8m
3 reservoir. There are three similar
machines connected to the same external quench oil system.
Three press forces can be applied to the part by an expander mandrel, inner die and outer die as illustrated in Figure 6.
Figure 6 Tool setup, press forces and quench oil flow in the quenching machine
The inner die contains one ring and outer die contains two rings. The outer press force is divided between these two rings by an exchangeable cradle, designed to provide a desired force distribution.
Expander, inner and outer press forces are individually controllable by setting a pressure valve corresponding to each force. The desired pressures are then read (in bars) on pressure gauges. From this point, the pressing forces are referred to as pressures; expressed in bars; expander pressure; inner pressure and outer pressure.
It is possible to pulse the inner and outer pressures during the quenching cycle. This means that the dies still remain in contact with the part but with a short release of pressure every two seconds. The expander pressure cannot be pulsed. Pulsation has been turned on for all experiments in this investigation.
The duration of the quench cycle is approximately 200 seconds. The feature of dividing this time into three intervals with individually eligible durations and different oil flow rates has not been used. All experiments are conducted with oil flow kept constantly at maximum flow rate and for the same cycle duration time.
The lower die, on which the gear part is placed, is fixed to the machine being used and is not adjustable. This lower die is ground to a slightly conical shape as a constant compensation for dishing tendencies of the part while quenching.
5
4
3
2
1
a)
b)
c)
Fexpander
FinnerFouter
Quench oil flow
Cradle
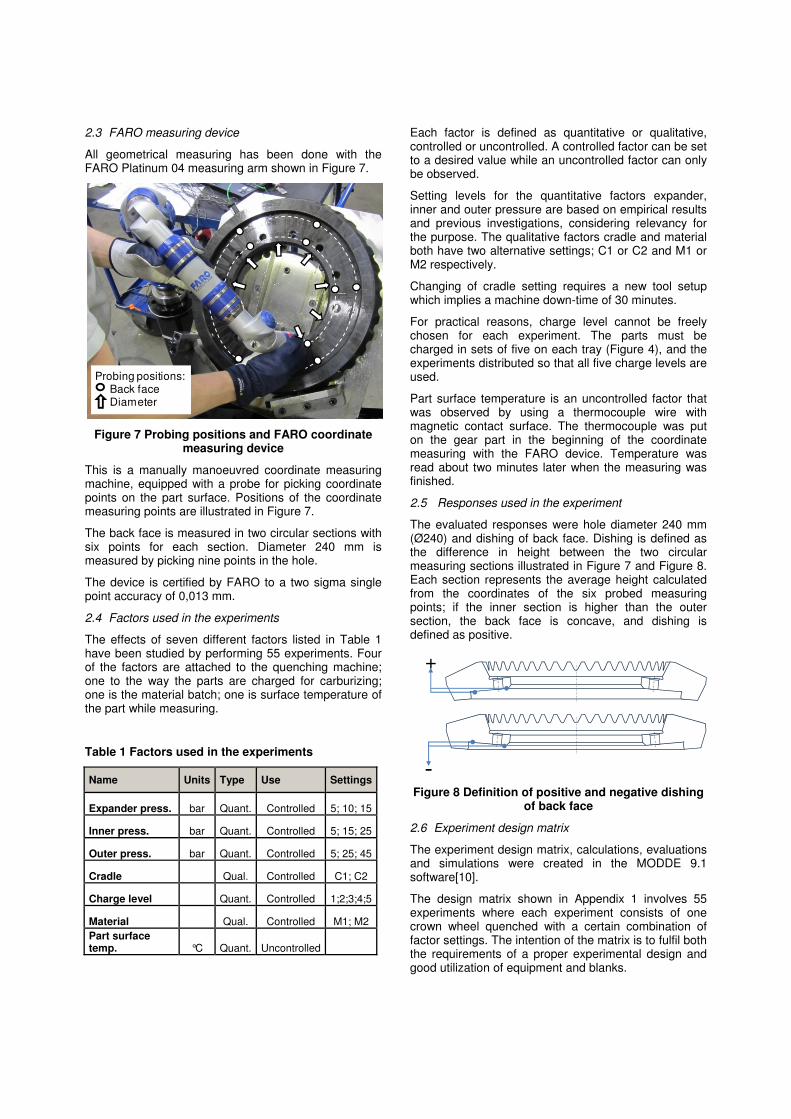
2.3 FARO measuring device
All geometrical measuring has been done with the FARO Platinum 04 measuring arm shown in Figure 7.
Figure 7 Probing positions and FARO coordinate measuring device
This is a manually manoeuvred coordinate measuring machine, equipped with a probe for picking coordinate points on the part surface. Positions of the coordinate measuring points are illustrated in Figure 7.
The back face is measured in two circular sections with six points for each section. Diameter 240 mm is measured by picking nine points in the hole.
The device is certified by FARO to a two sigma single point accuracy of 0,013 mm.
2.4 Factors used in the experiments
The effects of seven different factors listed in Table 1 have been studied by performing 55 experiments. Four of the factors are attached to the quenching machine; one to the way the parts are charged for carburizing; one is the material batch; one is surface temperature of the part while measuring.
Table 1 Factors used in the experiments
Name Units Type Use Settings
Expander press. bar Quant. Controlled 5; 10; 15
Inner press. bar Quant. Controlled 5; 15; 25
Outer press. bar Quant. Controlled 5; 25; 45
Cradle Qual. Controlled C1; C2
Charge level Quant. Controlled 1;2;3;4;5
Material Qual. Controlled M1; M2
Part surface temp. °C Quant. Uncontrolled
Each factor is defined as quantitative or qualitative, controlled or uncontrolled. A controlled factor can be set to a desired value while an uncontrolled factor can only be observed.
Setting levels for the quantitative factors expander, inner and outer pressure are based on empirical results and previous investigations, considering relevancy for the purpose. The qualitative factors cradle and material both have two alternative settings; C1 or C2 and M1 or M2 respectively.
Changing of cradle setting requires a new tool setup which implies a machine down-time of 30 minutes.
For practical reasons, charge level cannot be freely chosen for each experiment. The parts must be charged in sets of five on each tray (Figure 4), and the experiments distributed so that all five charge levels are used.
Part surface temperature is an uncontrolled factor that was observed by using a thermocouple wire with magnetic contact surface. The thermocouple was put on the gear part in the beginning of the coordinate measuring with the FARO device. Temperature was read about two minutes later when the measuring was finished.
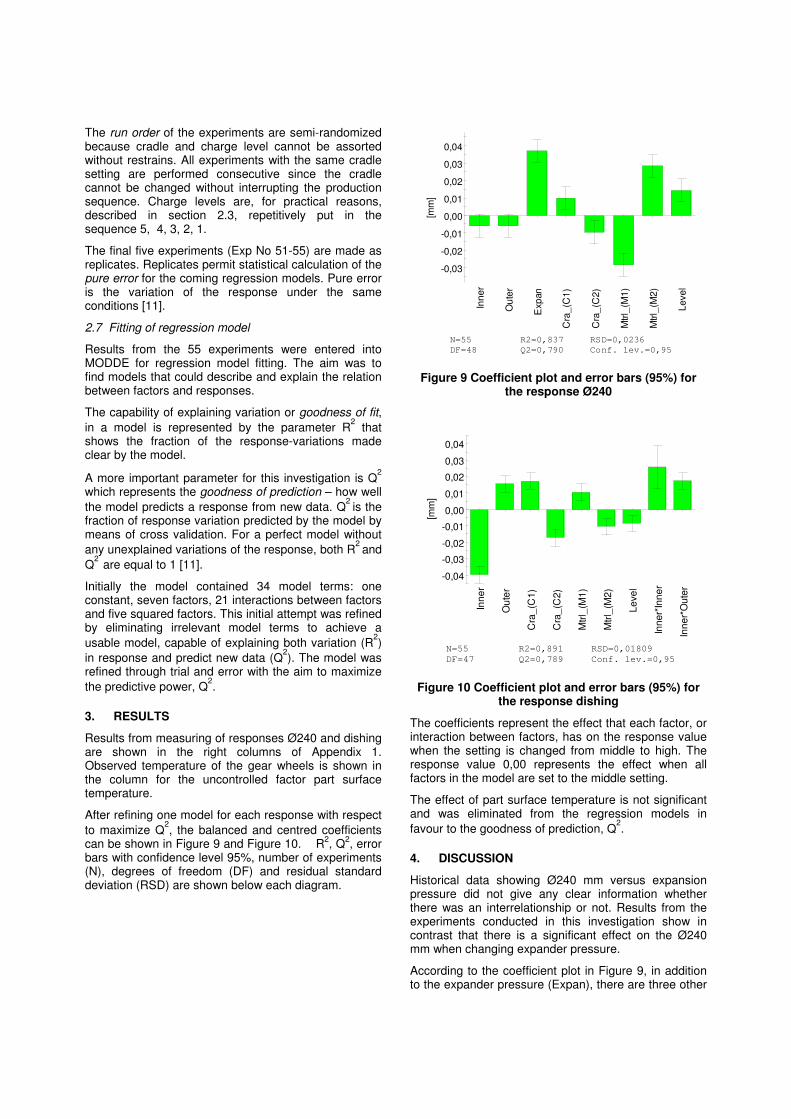
2.5 Responses used in the experiment
The evaluated responses were hole diameter 240 mm (Ø240) and dishing of back face. Dishing is defined as the difference in height between the two circular measuring sections illustrated in Figure 7 and Figure 8. Each section represents the average height calculated from the coordinates of the six probed measuring points; if the inner section is higher than the outer section, the back face is concave, and dishing is defined as positive.
Figure 8 Definition of positive and negative dishing of back face
2.6 Experiment design matrix
The experiment design matrix, calculations, evaluations and simulations were created in the MODDE 9.1 software[10].
The design matrix shown in Appendix 1 involves 55 experiments where each experiment consists of one crown wheel quenched with a certain combination of factor settings. The intention of the matrix is to fulfil both the requirements of a proper experimental design and good utilization of equipment and blanks.
Probing positions:Back faceDiameter
+
-
The run order of the experiments are semi-randomized because cradle and charge level cannot be assorted without restrains. All experiments with the same cradle setting are performed consecutive since the cradle cannot be changed without interrupting the production sequence. Charge levels are, for practical reasons, described in section 2.3, repetitively put in the sequence 5, 4, 3, 2, 1.
The final five experiments (Exp No 51-55) are made as replicates. Replicates permit statistical calculation of the pure error for the coming regression models. Pure error is the variation of the response under the same conditions [11].
2.7 Fitting of regression model
Results from the 55 experiments were entered into MODDE for regression model fitting. The aim was to find models that could describe and explain the relation between factors and responses.
The capability of explaining variation or goodness of fit,
in a model is represented by the parameter R2 that
shows the fraction of the response-variations made clear by the model.
A more important parameter for this investigation is Q2
which represents the goodness of prediction – how well
the model predicts a response from new data. Q2
is the fraction of response variation predicted by the model by means of cross validation. For a perfect model without
any unexplained variations of the response, both R2 and
Q2
are equal to 1 [11].
Initially the model contained 34 model terms: one constant, seven factors, 21 interactions between factors and five squared factors. This initial attempt was refined by eliminating irrelevant model terms to achieve a
usable model, capable of explaining both variation (R2)
in response and predict new data (Q2). The model was
refined through trial and error with the aim to maximize
the predictive power, Q2.
3. RESULTS
Results from measuring of responses Ø240 and dishing are shown in the right columns of Appendix 1. Observed temperature of the gear wheels is shown in the column for the uncontrolled factor part surface temperature.
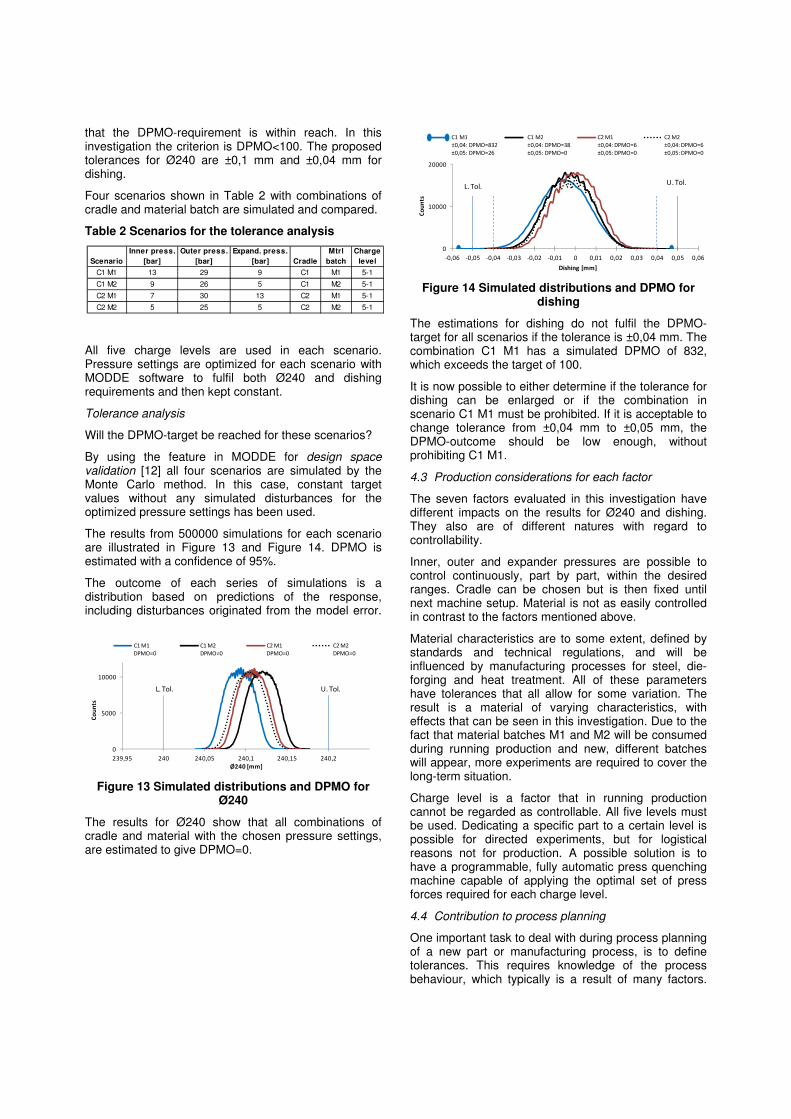
After refining one model for each response with respect
to maximize Q2, the balanced and centred coefficients
can be shown in Figure 9 and Figure 10. R2, Q
2, error
bars with confidence level 95%, number of experiments (N), degrees of freedom (DF) and residual standard deviation (RSD) are shown below each diagram.
Figure 9 Coefficient plot and error bars (95%) for the response Ø240
Figure 10 Coefficient plot and error bars (95%) for the response dishing
The coefficients represent the effect that each factor, or interaction between factors, has on the response value when the setting is changed from middle to high. The response value 0,00 represents the effect when all factors in the model are set to the middle setting.
The effect of part surface temperature is not significant and was eliminated from the regression models in
favour to the goodness of prediction, Q2.
4. DISCUSSION
Historical data showing Ø240 mm versus expansion pressure did not give any clear information whether there was an interrelationship or not. Results from the experiments conducted in this investigation show in contrast that there is a significant effect on the Ø240 mm when changing expander pressure.
According to the coefficient plot in Figure 9, in addition to the expander pressure (Expan), there are three other
-0,03
-0,02
-0,01
0,00
0,01
0,02
0,03
0,04
Inn
er
Ou
ter
Exp
an
Cra
_(C
1)
Cra
_(C
2)
Mtr
l_(M
1)
Mtr
l_(M
2)
Le
ve
l
[mm
]
N=55 R2=0,837 RSD=0,0236
DF=48 Q2=0,790 Conf. lev.=0,95
-0,04
-0,03
-0,02
-0,01
0,00
0,01
0,02
0,03
0,04
Inn
er
Ou
ter
Cra
_(C
1)
Cra
_(C
2)
Mtr
l_(M
1)
Mtr
l_(M
2)
Le
ve
l
Inn
er*
Inn
er
Inn
er*
Ou
ter
[mm
]
N=55 R2=0,891 RSD=0,01809
DF=47 Q2=0,789 Conf. lev.=0,95

evaluated factors that significantly affect Ø240: Cradle (Cra), material (Mtrl) and charge level (Level). Choice of material has an impact nearly as large as the expander pressure.
The second evaluated property, dishing, showed significant influences from five of the factors, see Figure 10. Inner pressure has a non-linear effect, recognizable by the squared term (Inner*Inner) in the coefficient plot, and visualized in Figure 11.
Figure 11 Non-linear effect of Inner pressure on dishing
There is also an effect from the interaction between inner and outer pressure.
Comparing the conclusions that can be drawn from the historical production data with the conclusions from this investigation indicates that historical production data lacks sufficient information. The final regression model for Ø240 involves six factors, compared hypothetically to a maximum of one factor (expander pressure), provided in a model based on the historical data.
4.1 Impact of charge level versus part surface temperature
A strong correlation of 0,90 between charge level and part surface temperature in the design matrix becomes a problem when evaluating these factors in the regression model. It is not possible to separate the effect of choosing a different level from the effect of the temperature. There is still an open question as to which one of them, or both, gives the significant effect. As long as examining the reason for the effect is not important this does not pose a problem. Should this need occur, new experiments with less correlated factors must be performed.
However, there is an explanation for why the surface temperature is higher for level one than for level five (level one is the last to be quenched). Measured surface temperatures on each gear part, together with measured temperature of the quench oil at time of quenching, are shown in Figure 12.
Figure 12 Part surface and quench oil temperature during the test
While running one quenching cycle, the oil in the machine warms up. Insufficient capacity to bring tempered oil to the machine leads to a gradually increasing temperature. However the quench oil temperature in the machine decreases when idle and waiting for next tray. It stabilizes at approximately 60°C after 20 minutes.
4.2 Using results for tolerance analysis
MODDE has so far been used for design and evaluation of the experiments in this investigation. Regression models for Ø240 and dishing are defined with an impact from each factor illustrated by the coefficient plots in Figure 9 and Figure 10.
The responses hereafter can be predicted by using these two models. MODDE is then used to predict responses and estimate the accuracy of each prediction. This error estimation is based on the analysis of variations derived from the experiments and includes both experimental and model errors.
Scenarios to analyse
Since the expander, inner and outer pressures individually are adjustable within a desired range and by this investigation proved to have an influence; they can be used for controlling the outcome of the process.
Despite the fact that the available Gleason press quenching machines are fully automatic due to loading, running a cycle and unloading, pressures must be set manually by an operator. As a result of this, and the fact that the machines are not fully manned, the pressures are yet to be made constant during these time periods, not taking into consideration the different charge levels of the quenched gears.
Cradle has to be chosen before starting a new press quench order. Charge levels cannot be controlled and will repetitively follow the sequence 5, 4,3,2,1. One material batch will be used for one press quench order.
The factor part surface temperature is not used in the models as previously explained.
Some scenarios are now able to be defined, based on how the quenching process is managed. The aim is to evaluate present tolerances for Ø240 and dishing so
-0,04
-0,03
-0,02
-0,01
0,00
0,01
0,02
0,03
0,04
4 5 6 7 8 9 10 11 12 13 14 15 16 17 18 19 20 21 22 23 24 25 26
Ba
ck fa
ce
dis
hin
g [m
m]
Inner pressure [bar]
55
60
65
70
75
80
85
08
:30
10
:54
13
:18
15
:42
18
:06
20
:30
22
:54
01
:18
Te
mp
era
ture
[°C
]
Time [hour:minute]
Gear part surface temp. Quench oil temp.
that the DPMO-requirement is within reach. In this investigation the criterion is DPMO<100. The proposed tolerances for Ø240 are ±0,1 mm and ±0,04 mm for dishing.
Four scenarios shown in Table 2 with combinations of cradle and material batch are simulated and compared.
Table 2 Scenarios for the tolerance analysis
All five charge levels are used in each scenario. Pressure settings are optimized for each scenario with MODDE software to fulfil both Ø240 and dishing requirements and then kept constant.
Tolerance analysis
Will the DPMO-target be reached for these scenarios?
By using the feature in MODDE for design space validation [12] all four scenarios are simulated by the Monte Carlo method. In this case, constant target values without any simulated disturbances for the optimized pressure settings has been used.
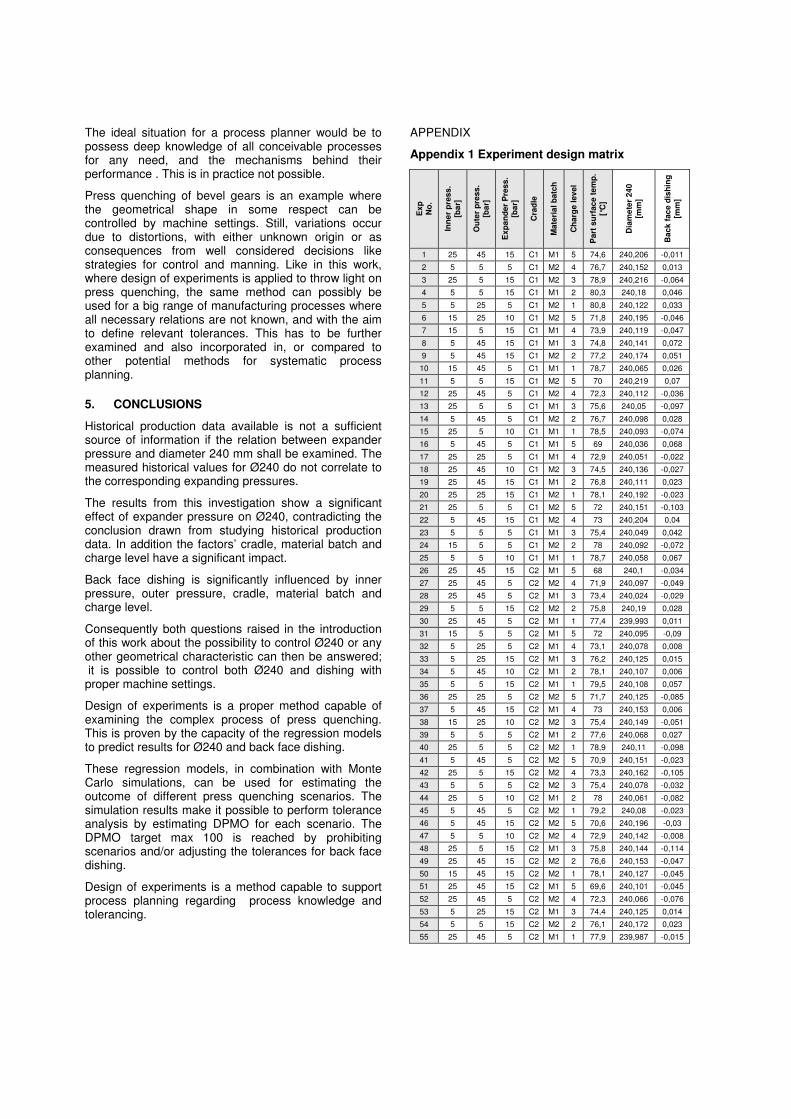
The results from 500000 simulations for each scenario are illustrated in Figure 13 and Figure 14. DPMO is estimated with a confidence of 95%.
The outcome of each series of simulations is a distribution based on predictions of the response, including disturbances originated from the model error.
Figure 13 Simulated distributions and DPMO for Ø240
The results for Ø240 show that all combinations of cradle and material with the chosen pressure settings, are estimated to give DPMO=0.
Figure 14 Simulated distributions and DPMO for dishing
The estimations for dishing do not fulfil the DPMO-target for all scenarios if the tolerance is ±0,04 mm. The combination C1 M1 has a simulated DPMO of 832, which exceeds the target of 100.
It is now possible to either determine if the tolerance for dishing can be enlarged or if the combination in scenario C1 M1 must be prohibited. If it is acceptable to change tolerance from ±0,04 mm to ±0,05 mm, the DPMO-outcome should be low enough, without prohibiting C1 M1.
4.3 Production considerations for each factor
The seven factors evaluated in this investigation have different impacts on the results for Ø240 and dishing. They also are of different natures with regard to controllability.
Inner, outer and expander pressures are possible to control continuously, part by part, within the desired ranges. Cradle can be chosen but is then fixed until next machine setup. Material is not as easily controlled in contrast to the factors mentioned above.
Material characteristics are to some extent, defined by standards and technical regulations, and will be influenced by manufacturing processes for steel, die-forging and heat treatment. All of these parameters have tolerances that all allow for some variation. The result is a material of varying characteristics, with effects that can be seen in this investigation. Due to the fact that material batches M1 and M2 will be consumed during running production and new, different batches will appear, more experiments are required to cover the long-term situation.
Charge level is a factor that in running production cannot be regarded as controllable. All five levels must be used. Dedicating a specific part to a certain level is possible for directed experiments, but for logistical reasons not for production. A possible solution is to have a programmable, fully automatic press quenching machine capable of applying the optimal set of press forces required for each charge level.
4.4 Contribution to process planning
One important task to deal with during process planning of a new part or manufacturing process, is to define tolerances. This requires knowledge of the process behaviour, which typically is a result of many factors.
Scenario
Inner press.
[bar]
Outer press.
[bar]
Expand. press.
[bar] Cradle
Mtrl
batch
Charge
level
C1 M1 13 29 9 C1 M1 5-1
C1 M2 9 26 5 C1 M2 5-1
C2 M1 7 30 13 C2 M1 5-1
C2 M2 5 25 5 C2 M2 5-1
0
5000
10000
239,95 240 240,05 240,1 240,15 240,2
Co
un
ts
Ø240 [mm]
C1 M1
DPMO=0
C1 M2
DPMO=0
C2 M1
DPMO=0
C2 M2
DPMO=0
L. Tol. U. Tol.
0
10000
20000
-0,06 -0,05 -0,04 -0,03 -0,02 -0,01 0 0,01 0,02 0,03 0,04 0,05 0,06
Co
un
ts
Dishing [mm]
C1 M1
±0,04: DPMO=832
±0,05: DPMO=26
C1 M2
±0,04: DPMO=38
±0,05: DPMO=0
C2 M1
±0,04: DPMO=6
±0,05: DPMO=0
C2 M2
±0,04: DPMO=6
±0,05: DPMO=0
L. Tol.U. Tol.
The ideal situation for a process planner would be to possess deep knowledge of all conceivable processes for any need, and the mechanisms behind their performance . This is in practice not possible.
Press quenching of bevel gears is an example where the geometrical shape in some respect can be controlled by machine settings. Still, variations occur due to distortions, with either unknown origin or as consequences from well considered decisions like strategies for control and manning. Like in this work, where design of experiments is applied to throw light on press quenching, the same method can possibly be used for a big range of manufacturing processes where all necessary relations are not known, and with the aim to define relevant tolerances. This has to be further examined and also incorporated in, or compared to other potential methods for systematic process planning.
5. CONCLUSIONS
Historical production data available is not a sufficient source of information if the relation between expander pressure and diameter 240 mm shall be examined. The measured historical values for Ø240 do not correlate to the corresponding expanding pressures.
The results from this investigation show a significant effect of expander pressure on Ø240, contradicting the conclusion drawn from studying historical production data. In addition the factors’ cradle, material batch and charge level have a significant impact.
Back face dishing is significantly influenced by inner pressure, outer pressure, cradle, material batch and charge level.
Consequently both questions raised in the introduction of this work about the possibility to control Ø240 or any other geometrical characteristic can then be answered; it is possible to control both Ø240 and dishing with proper machine settings.
Design of experiments is a proper method capable of examining the complex process of press quenching. This is proven by the capacity of the regression models to predict results for Ø240 and back face dishing.
These regression models, in combination with Monte Carlo simulations, can be used for estimating the outcome of different press quenching scenarios. The simulation results make it possible to perform tolerance analysis by estimating DPMO for each scenario. The DPMO target max 100 is reached by prohibiting scenarios and/or adjusting the tolerances for back face dishing.
Design of experiments is a method capable to support process planning regarding process knowledge and tolerancing.
APPENDIX
Appendix 1 Experiment design matrix
Ex
p
No
.
Inn
er
pre
ss
. [b
ar]
Ou
ter
pre
ss
. [b
ar]
Ex
pa
nd
er
Pre
ss
. [b
ar]
Cra
dle
Ma
teri
al
ba
tch
Ch
arg
e l
ev
el
Pa
rt s
urf
ac
e t
em
p.
[°C
]
Dia
me
ter
24
0
[mm
]
Ba
ck
fac
e d
ish
ing
[m
m]
1 25 45 15 C1 M1 5 74,6 240,206 -0,011
2 5 5 5 C1 M2 4 76,7 240,152 0,013
3 25 5 15 C1 M2 3 78,9 240,216 -0,064
4 5 5 15 C1 M1 2 80,3 240,18 0,046
5 5 25 5 C1 M2 1 80,8 240,122 0,033
6 15 25 10 C1 M2 5 71,8 240,195 -0,046
7 15 5 15 C1 M1 4 73,9 240,119 -0,047
8 5 45 15 C1 M1 3 74,8 240,141 0,072
9 5 45 15 C1 M2 2 77,2 240,174 0,051
10 15 45 5 C1 M1 1 78,7 240,065 0,026
11 5 5 15 C1 M2 5 70 240,219 0,07
12 25 45 5 C1 M2 4 72,3 240,112 -0,036
13 25 5 5 C1 M1 3 75,6 240,05 -0,097
14 5 45 5 C1 M2 2 76,7 240,098 0,028
15 25 5 10 C1 M1 1 78,5 240,093 -0,074
16 5 45 5 C1 M1 5 69 240,036 0,068
17 25 25 5 C1 M1 4 72,9 240,051 -0,022
18 25 45 10 C1 M2 3 74,5 240,136 -0,027
19 25 45 15 C1 M1 2 76,8 240,111 0,023
20 25 25 15 C1 M2 1 78,1 240,192 -0,023
21 25 5 5 C1 M2 5 72 240,151 -0,103
22 5 45 15 C1 M2 4 73 240,204 0,04
23 5 5 5 C1 M1 3 75,4 240,049 0,042
24 15 5 5 C1 M2 2 78 240,092 -0,072
25 5 5 10 C1 M1 1 78,7 240,058 0,067
26 25 45 15 C2 M1 5 68 240,1 -0,034
27 25 45 5 C2 M2 4 71,9 240,097 -0,049
28 25 45 5 C2 M1 3 73,4 240,024 -0,029
29 5 5 15 C2 M2 2 75,8 240,19 0,028
30 25 45 5 C2 M1 1 77,4 239,993 0,011
31 15 5 5 C2 M1 5 72 240,095 -0,09
32 5 25 5 C2 M1 4 73,1 240,078 0,008
33 5 25 15 C2 M1 3 76,2 240,125 0,015
34 5 45 10 C2 M1 2 78,1 240,107 0,006
35 5 5 15 C2 M1 1 79,5 240,108 0,057
36 25 25 5 C2 M2 5 71,7 240,125 -0,085
37 5 45 15 C2 M1 4 73 240,153 0,006
38 15 25 10 C2 M2 3 75,4 240,149 -0,051
39 5 5 5 C2 M1 2 77,6 240,068 0,027
40 25 5 5 C2 M2 1 78,9 240,11 -0,098
41 5 45 5 C2 M2 5 70,9 240,151 -0,023
42 25 5 15 C2 M2 4 73,3 240,162 -0,105
43 5 5 5 C2 M2 3 75,4 240,078 -0,032
44 25 5 10 C2 M1 2 78 240,061 -0,082
45 5 45 5 C2 M2 1 79,2 240,08 -0,023
46 5 45 15 C2 M2 5 70,6 240,196 -0,03
47 5 5 10 C2 M2 4 72,9 240,142 -0,008
48 25 5 15 C2 M1 3 75,8 240,144 -0,114
49 25 45 15 C2 M2 2 76,6 240,153 -0,047
50 15 45 15 C2 M2 1 78,1 240,127 -0,045
51 25 45 15 C2 M1 5 69,6 240,101 -0,045
52 25 45 5 C2 M2 4 72,3 240,066 -0,076
53 5 25 15 C2 M1 3 74,4 240,125 0,014
54 5 5 15 C2 M2 2 76,1 240,172 0,023
55 25 45 5 C2 M1 1 77,9 239,987 -0,015

REFERENCES
[1] Arimoto, K., Yoshii, T., Yokota, H. and Narazaki M. (2011). Experimental and simulation studies on distortions in steel plate specimens carburized on a single side and oil-quenched. In: Proc. 3rd Int. Conf. on Distortion Engineering, September 14-16, 2011, ( ed: H.-W. Zoch and Th. Lübben), pp. 249-258, SFB 570, Bremen, Germany
[2] Lingamanaik, S. N. and Chen, B. K. (2012). The effects of carburising and quenching process on the formation of residual stresses in automotive gears. Computational Materials Science. s.l. : Elsevier B.V. Vol. 62, Sept 2012, pp. 99-104.
[3] Holm, T. (ed.), Olsson, P. (ed.) and Troell, E. (ed.) (2010). Stål och värmebehandling - en handbok. Mölndal : Swerea IVF, ISBN 978-91-86401-04-7.
[4] Rentsch, R. (2011). Parameters of distortion in forging gear wheel blanks. In: Proc. 3rd Int. Conf. on Distortion Engineering, September 14-16, 2011, ( ed: H.-W. Zoch and Th. Lübben), pp. 127-133, SFB 570, Bremen, Germany
[5] Hewitt, G. (1979). The Mechanics of Press Quenching. Heat Treatment of Metals. s.l. : Wolfson Heat Treatment Centre, 1979.4, pp. 88-91.
[6] Funatani, K. (2011). Distortion engineering with quench oil control for quality heat treatment. . In: Proc. 3rd Int. Conf. on Distortion Engineering, September 14-16, 2011, ( ed: H.-W. Zoch and Th. Lübben), pp. 101-108, SFB 570, Bremen, Germany
[7] Canale, L. de C. F. and Totten, G.E. (2005). Quenching Technology: A Selected Overview of the Current State-of-the-art. Materials Reserch. s.l. : The Scientific Electronic Library Online, December 2005. Vol. 8, No. 4, pp. 461-467. ISSN 1516-1439.
[8] Svensk standard SS-EN 10084:2008. Case hardening steels – Technical delivery conditions. s.l. : Swedish Standards Institute, 2008. 2. ICS: 77.140.10.
[9] Statoil lubricants. [Online] Statoil, 03 12, 2012. [Cited: 06 13, 2012.] http://www.statoillubricants.com.
[10] MODDE - Design of Experiments. [Online] Umetrics AB. http://www.umetrics.com/modde.
[11] Eriksson, L., Johansson, E., Kettaneh-Wold, N., Wikström, C. and Wold, S. (2000). Design of experiments - Principles and applications. Umeå : Umetrics AB, ISBN 91-973730-0-1.
[12] Umetrics AB. User guide to MODDE. User Guides and Tutorials. [Online] [Cited: 06 11, 2012.] www.umetrics.com.


![Bevel Gears in ProE[1]](https://img.pdfslide.us/doc/110x75/543da9fbb1af9f3d0a8b4920/bevel-gears-in-proe1.jpg)


![85540168 Bevel Gears in ProE[1]](https://img.pdfslide.us/doc/110x75/544b2fd6b1af9f804f8b4fca/85540168-bevel-gears-in-proe1.jpg)
