Embed Size (px)
Citation preview

4113
SPRINT BIOMECHANICS OF FEMALE NATIONAL COLLEGIATE ATHLETIC ASSOCIATION DIVISION TRACK AND FIELD
ATHLETE
A THESIS SUBMITTED TO THE GRADUATE DIVISION OF
THE UNIVERSITY OF HA WAI'I
IN PARTIAL FULFILLMENT OF
THE REQUIREMENTS FOR THE DEGREE OF
MASTER OF SCIENCE
IN
KINESIOLOGY AND LEISURE SCIENCE
AUGUST 2006
By
Kaori Tamura
Thesis Committee:
Iris Kimura, Chairperson
Ronald Hetzler.
Jan Prins

ii
We certify that we have read this thesis and that, in our opinion, it is satisfactory in scope
and quality as a thesis for the degree of Master of Science in Kinesiology.
THESIS COMMITIEE

Acknowledgements
Dr. Kimura, It has been a life lesson. It has been the biggest challenge in my life.
I worked hard and tried my best. At the end, you gave me a biggest present.
Feeling of Accomplishment.
You made me step up to the next level.
Arigatougozaimashita.
Dr. Helder, Dr. Prins, Thank you for being my committee member.
I truly appreciate your support and encouragement.
Cris, I could not have done this without your help and guidance.
Thank you for being patient and supportive. You are the BEST!
Andrea,
iii
You always unconditionally supported EVERYONE in this program, made this program
so much better and easier to work with. I am so lucky that I had you in my years.
Thank you for your endless dedication and unconditional love.
Yuklya, You don't know how much I feel reassured just by having you in this island.
You are my buddy forever.
Kristen, Ryan, Vanessa, and Kyle, We have encountered a lot of things and overcome a lot of things together. Thank you!
Shannon, Kelly, Goose, Ariel/e, Stephanie, and Bret, Every one of you offered to help. Thank you for your support and encouragement.
It's your turn now!
Joe, Tomoki, Thank you for giving me huge encouragement every time I wanted to give up.
Now I get to write "acknowledgements" and know how this feels like.
This is why you pushed me to finish it. Everything was worth the effort.
Mom and Dad, Thank you for your unconditional LOVE.
Thank you for my LIFE.
My life is good.

iv
Table of Contents
Acknowledgements ................................................................................ .iii
List of Tables ........................................................................................ vii
L · fFO ... ISt 0 Igure ....................................................................................... VIII
Part I. ............................................................................................ 0 •••••• 1
Introduction ................................................................................... 1
Statement of the Problem .......................................................... 3
Research Questions ................................................................. 4
Methodology ................................................................................. s
Subjects .............................................................................. 5
200 m Sprint Trials ................................................................. 5
Data Reduction and Film Analysis ............................................... 6
Statistical Analyses ................................................................. 8
Results ........................................................................................ 9
Discussion ................................................................................... 11
Part II ................................................................................................. 23
Review of Literature ....................................................................... 23
Effects of Lower Extremity Kinematics on sprint Performance ............ 23
Type of foot contact. .............................................................. 29
Influence of fatigue on sprint performance .................................... 31
References .......................................................................................... 37

v
Appendices ........................................................................................ .42
Appendix A Graphs ..................................................................... .42
Appendix 8 INFORMED CONSENT ............................................... .47
Appendix C 200 Meter Sprint Trial Kinematic Data ................................ 51
vi
List of Table
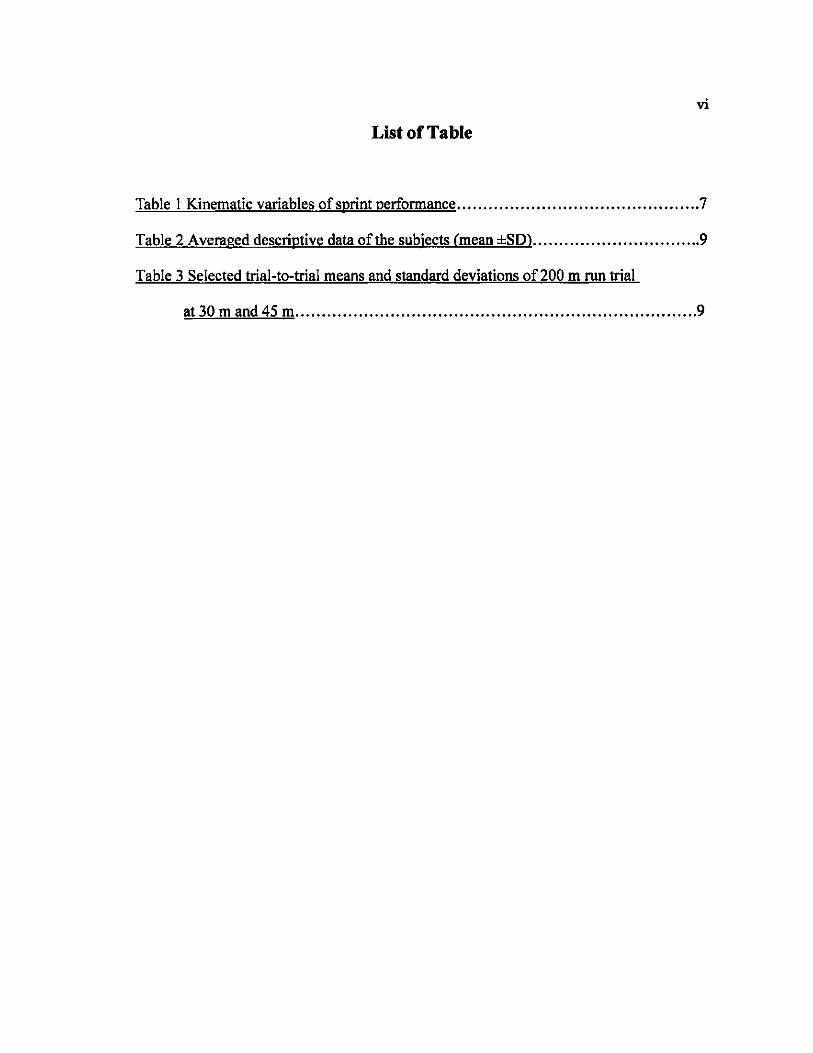
Table I Kinematic variables of sprint performance .............................................. 7
Table 2 Averaged descriptive data oftbe subjects (mean ±SD) ................................ 9
Table 3 Selected trial-to-trial means and standard deviations of 200 m run trial
at 30 m and 45 m ............................................................................ 9

vii
List of Figures
Figure 1 Representation of foot placement at initial ground contact of sprinting ......... 7
Figure 2 Relationship between Contact time and 200 m sprinting time at 30 m ......... 12
Figure 3 Relationship between Contact time and 200 m sprinting time at 45 m ......... 12
Figure 4 Relationship between Touchdown distance and Contact time at 30 m ......... 14
Figure 5 Relationship between Touchdown distance and Contact time at 45 m ......... 14
Figure 6 Relationship between Total vertical displacement and Contact time
at 30 m and 45 m combined ............................................................ 15
Figure 7 Relationship between Mid-stance distance and Contact time at 30 m .......... 19
Figure 8 Relationship between Mid-stance distance and Contact time at 45 m .......... 19
Figure 9 Type offoot contact <Ball of FooVFlat and Flat) and 200 m sprinting time ... 20
Figure 10 Type of foot contact and contact time ............................................. 21
Figure 11 Relationship between Touchdown distance and 200 m sprinting time
at 30 m ..................................................................................... 42
Figure 12 Relationship between Touchdown distance and 200 m sprinting time
at 45 m ..................................................................................... 42
Figure 13 Relationship between Mid-stance distance and 200 m sprinting time
at 30 m ..................................................................................... 43
Figure 14 Relationship between Mid-stance distance and 200 m sprinting time
at 45 m ..................................................................................... 43
Figure 15 Relationship between Push-off distance and 200 m sprinting time
at 30 m ..................................................................................... 44

viii
Figure 16 Relationship between Push-off distance and 200 m sprinting time
at 45 m ..................................................................................... 44
Figure 17 Relationship between Total vertical displacement and 200 m sprinting time
at 30 m ................................................................................... .45
Figure 18 Relationship between Total vertical displacement and 200 m sprinting time
at 45 m ................................................................................... .45
Figure 19 Relationship between Push-off distance and Contact time at 30 m ............ 46
Figure 20 Relationship between Push-off distance and Contact time at 45 m ............ 46

Part I Introduction
1
Sprinting success is achieved by a fast start such that maximal horizontal velocity
can be achieved and maintained (Johnson and Buckley, 2000; Mann and Herman, 1985).
Sprint velocity can be defined as the product of stride rate and stride length.
Consequently, velocity can be increased by increasing stride rate or stride length or both;
however, both factors are interdependent and individual morphologic and physiologic
characteristics may influence the individual's motor abilities and utilization of the energy
system (Coh et. aI., 2001). It has been reported that world class sprinters demonstrate
increases in stride length and stride rate, landing angle, thigh acceleration, trunk
inclination, and decreases in components such as thigh angle and ground contact time
(Kunz and Kaufinann, 1981). However, it is the ratio between the contact time and the
flight time that is the most crucial factor in the kinematic structure of the sprinting stride.
Successful sprinters demonstrated shorter contact phases and longer flight phases than
less successful sprinters (Coh et. al., 2001). Reaction time, technique, electromyographic
(EMG) activity, force production, neural factors, and musculoskeletal structures are other
biomechanical factors that can influence sprint performance (Mero et. al., 1992).
Hypothetically, successful sprinters must have the ability to exert large ground-reaction
forces (GRF) in shorter time periods than a less successful sprinters (Alexander, 1989;
Kunz and Kaufinann, 1981; Weyand et. al., 2000).
Ground reaction forces are only achievable when the body is instantaneously in
contact with the surface of the ground (contact phase). The contact phase can be divided
into braking and propulsion phases according to the vertical movement of whole body
center of gravity (CG) or the negative and positive horizontal reaction forces during foot

2
contact (Luhtanen & Komi, 1978). The braking phase starts from initial foot contact to
the lowest position of CG, during which the extensor muscles of the stance leg work
eccentrically (Luhtanen & Komi, 1978; Miller, 1983). The velocity of the CG decreases
following initial foot impact then the velocity increases during the subsequent propulsion
phase (Cavanagh, 1980). It has been reported that the angle between the horizontal
running surface and the line from CG to initial foot contact point (landing angle) can
affect contact times and CG velocity during the braking phase. In order to minimize
decreases in velocity during the braking phase it is crucial to keep the CG close to the
point of initial foot contact at touchdown resulting in large landing angles. (Deshon &
Nelson, 1964; Kunz & Kaufman, 1981)
Payne (1983) reported that the type of foot contact influenced the braking force.
He found that running with no heel contact demonstrated the absence of the first vertical
force peak and smoother force Itime patterns. This type of foot contact was mainly seen
in 400 to 800 m specialists and should be considered mechanically more efficient than
foot contacts causing high impact forces where the CG was behind the contact foot
(payne, \983). Nett (1964) studied type offoot contact during sprinting and reported that
running speed influenced ground contact. He reported that initial foot contact occurred
on the lateral aspect of the Sth metatarsophalangeal joint, high on the ball of the foot. As
the running speed decreased, the contact point shifted to a more posterior position, or
toward the heel. This can be seen in the 400 m run, where the initial foot contact point
shifts back toward the heel and foot plant is somewhat flatter. In distances greater than
I SOO m, the initial foot contact occurs on the lateral edge of the longitudinal arch between

3
the heel and the head of 5th metatarsal. Nett further noted that during the load-phase of
the contact foot, the heel strikes the ground, even in the case of sprinters; especially when
the sprinters are fatigued (1964). Conversely, Mann (1980) and Novacheck (1998)
reported that the heel of sprinters did not or "may not" touch the ground throughout the
sprint, and that initial ground contact was dependent on gait speed. Consequently, as
speed increased initial contact changed from the hind-foot to the forefoot. This issue
remains unclear because only five studies have involved examination of type of foot
contact during sprinting and its effect on the biomechanics of sprint performance (Nett,
1964; Mann. 1980; Payne, 1983; Novacheck, 1995; Novacheck, 1998)
Differences between levels of elite sprinters have been observed
biomechanically (Alexander, 1989; Kunz & Kaufman, 1981; Luhtanen & Komi, 1978;
Mann, 1981; Mann and Herman, 1985). However, present kinematic research generally
does not extend to the influence of type of foot contact during the ground contact phase
of the sprint gait cycle. Although two main biomechanical factors - stride length and
stride rate - have been widely accepted by researchers as key factors in sprint
performance, foot contact type during the contact phase is unclear and controversial.
Therefore, the purpose of this research study was to investigate type offoot contact
during the contact phase and its effect on the biomechanics of the 200 m sprint.
Statement of the Problem
The purpose of this study was to investigate selected kinematic variables and
initial foot contact types during the ground contact phase of the sprint and their effect on

sprint perfonnance of female National Collegiate Athletic Association Division I track
and field athletes.
Research Questions
(I) How does ground contact time affect 200 m sprint time?
(2) How does touchdown distance (TDD) affect contact time?
(3) How does TDD affect 200 m sprint time?
(4) How does vertical displacement (VD) affect contact time?
(5) How does VD affect 200 m sprint time?
4
(6) How does initial foot contact type: Heel and ball-of-foot landing, Flat, Ball-of
footJFlat landing, and Ball-of-foot-only landing, affect kinematic variables during the
200 m sprint?
(7) How do kinematic variables of sprinting found in elite athletes compare to those
found in collegiate sprinters.

5
Methodology Subjects
A total of thirteen (n = 13) welI conditioned National ColIegiate Athletic
Association (NCAA) Division I female track and field athletes participated in this study.
Subjects in our study consisted offour sprinters, four middle distance runners, three field
events athletes, one heptathlete, and one long distance runner. Prior to participation,
subjects were screened for musculoskeletal and medical pathologies via medical history,
P AR-Q, and a physical examination. Consent forms approved by the University of
Hawai'i, Committee on Human Studies were signed by alI subjects.
200 meter Sprint Trials
AlI 200 m sprint trials were performed on a Mondo track (Mondo USA,
Lynnwood. WA). Sprint performance protocol included a 5 m warm up,S m rest and
stretching period, followed by the sprint trial. Subjects were positioned in a standing
start, without starting blocks and instructed to sprint as hard and as fast as possible
throughout the entire 200 m distance. The sprint trials involved a standard track gun
start. Sprint times were recorded using Speedtrap II (Brower Timing Systems, Draper,
UT, USA) photoelectric timing cells placed at 25, SO, 100, 150, 175, and 200 m to
determine the points of peak velocity. Timing was initiated automatically as the cells
were triggered by the starting gun and split times were collected as subjects disrupted the
infrared signal between timing cells. A Skymate wind meter (Speedtech, Great Falls,
V A, USA) was also used to factor out wind assistance (<2.0 mph). Subjects participated
in two 200 m sprint trials. separated by a 20 m rest period. Track competition footwear
(e.g. spikes) were worn by all subjects during both 200 m trials.

6
Data Reduction and Film Analysis
Film data were collected in the sagittal plane with two high speed analog video
cameras (ViconlPeak Performance Technologies, Inc., Centennial, Colorado, USA)
placed at the 30 m and 45 m marks of the 200 m sprint. The speed of both cameras was
set at 180 fps and positioned with their optical axes centered on the plane of motion of
the runner (center oflane 3) at a distance of 5.7 m, and a height of80 cm (field of view
sufficient to record the foot placement of the right leg of the subjects) on tripods (Model
3221, Bogen Photo Corp., Ramsey, NJ, USA). Horizontal scale length (2.0 m) and
vertical scale length (1.0 m) were adopted for calibration by using a custom made
calibration frame (2.0 x 1.0 m). Semi-hemisphere reflectors (peak Performance
Technologies, Inc., Centennial, Colorado, USA) were placed on subjects' hip (greater
trochanter), knee (lateral epicondyle offemur), ankle (lateral maleolus), forefoot (head of
5th metatarsal), and heel (calcaneus) by the same Board of Certification, certified athletic
trainer.
The kinematic data (Table 1) were reduced from the video and analyzed via the
Peak Motus motion measurement system Version 8.0 (ViconlPeak Performance
Technologies, Inc., Centennial, Colorado, USA). The segmental center of gravity
locations and the segmental weight from Clauser (1969) was used for the calculation of
the whole body center of gravity. Processing of kinematics data via the motion
measurement system involved scaling the raw coordinates and interpolating gaps in the
scaled data but not to extrapolate gaps at the endpoints. The cubic spline filter was used
to smooth the row data. Output data rate (Hz) of the scaled data were set at 60 Hz.

Foot placement was analyzed both qualitatively and quantitatively and
categorized into four ground contact types: Heel and ball-of-foot landing (HBF), Flat
(FLAT) landing, Bail-of-footIFlat landing (BFF), and Ball-of-foot-only (BFO).
\~\. ....... ) •.••.•.. :J ( .~ .. , .,.
HBF (Heel and OOIl-of-foot)
FLAT (Flat. Foot)
BFF (Ball-of-FootJFlat)
BFO (BaII-of-Foot-Only)
FIgure 1 Representation of foot placement at Initial gronnd contact of sprinting
Table 1 Kinematic variables of sprint performance
Terminology Definition
Inilial contact The part of the ground contacl phase during which any portion of the fool conlaets the ground.
Mid-stance The part of the ground contact phase during which the patella of one knee overlaps the patella of the opposite knee in the sagittal view.
Push-off The part of the ground contact phase during which the forefoolleaves the ground. (for the pnrposes of this analysis. the poinl at which the head of 5th melalarsal completely leaves the ground)
Ground contact Also known as the support phase or stance phase.
Contact time The total time that the fool conlaets the ground Total vertical The total amount of vertical displacemenl during the ground contact. diSlllacemenl HBF A type of fool landing in which inilial contact of the fool on the ground is (Heel and Ball-of-foot) made with the heel followed by the ball-of·foot
BFF A type of fool landing in which initial contact of the fOOl on the ground is (Ball-of-footIFlat) made with the ball-of-fool followed by the heel.
BFO A type of foot landing in which initial contact of the fOOl on the ground is (Ball-of-fool-Dnly) made with the ball-of-fooland the heel never touches the ground.
FLAT A type of fool landing in which initial contact of the foot on the ground is made with the mid-portion or plantar surface of the foot
TOO The horizontal distance between the Initial fOOl contact point and the body (Touch down distance) Center of Gravity at Initial contact.
MSD The horizontal distance between the foot contact point and the body Center (Mid-stance distance) of Gravity at Mid-stance.
POD The horizontal distance belween the foot contact point and the body Center (Push-off distance) of Gravity at Push-off.
7

8
Statistical Analyses
Statistical computer software Statistical Analysis System Version 9.0 English
Software Package (SAS Institute Inc. Cary, North Carolina, USZ) was used to analyze
the data. One-way ANOV A was used to determine differences in each variable between
200 m sprint trials I and 2. Pearson product moment correlations were used to examine
the relationship between each variable. Regression analysis was used for further
examination on the variables that were significantly correlated. The alpha level was set at
p<O.OS.
9
Results
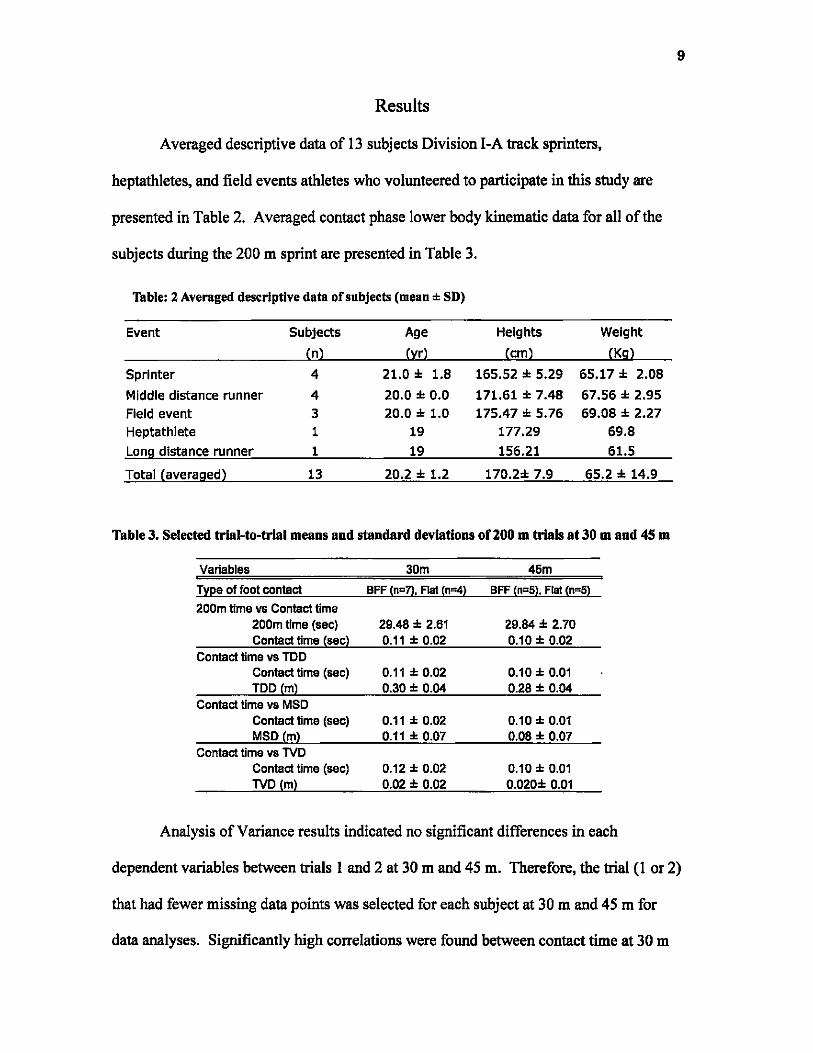
Averaged descriptive data of 13 subjects Division I-A track sprinters,
heptathletes, and field events athletes who volunteered to participate in this study are
presented in Table 2. Averaged contact phase lower body kinematic data for all of the
subjects during the 200 m sprint are presented in Table 3.
Table: 2 Averaged descriptive data of subjects (mean ± SD)
Event Subjects Age Heights Weight
(n) (~r) (cm) (Kg)
Sprinter 4 21.0:1: 1.8 165.52 :I: 5.29 65.17:1: 2.08
Middle distance runner 4 20.0 :I: 0.0 171.61:1: 7.48 67.56:1: 2.95
Field event 3 20.0 :I: 1.0 175.47:1: 5.76 69.08 :I: 2.27
Heptathlete 1 19 177.29 69.8
Long distance runner 1 19 156.21 61.5
Total (averaged) 13 20.2 :I: 1.2 170.2:1: 7.9 65.2 :I: 14.9
Table 3. Selected trlal-to-trlal means and standard deviations of200 m trials at 30 m and 45 m
Vanables 30m 46m
T~e of foot contact BFF (naZ). Flat (n=4) BFF (na5). Flat (n=5)
200m time vs Contact time 200m time (sec) 29.48 :I: 2.61 29.84 :I: 2.70 Contact time !sec) 0.11 :I: 0.02 0.10:1: 0.02
Contact time vs TOO Contact time (sec) 0.11 :I: 0.02 0.10:1: 0.01 TOO 1m) 0.30 :I: 0.04 0.28 :I: 0.04
Contact time VB MSO Contact time (sec) 0.11 :I: 0.02 0.10:1: 0.01 MSO 1m) 0.11 :I: 0.07 0.08 :I: 0.07
Contact time VB TVO Contact time (sec) 0.12 :I: 0.02 0.10:1: 0.01 TVO 1m) 0.02 :I: 0.02 0.020:1: 0.01
Analysis of Variance results indicated no significant differences in each
dependent variables between trials 1 and 2 at 30 m and 45 m. Therefore, the trial (lor 2)
that had fewer missing data points was selected for each subject at 30 m and 45 m for
data analyses. Significantly high correlations were found between contact time at 30 m

10
and 200 m time (r= .79, p= .0065), and contact time at 45 m and 200 m time (r= .85, p=
.0018). A significant negative correlation was found (r= -.7, p= .03) between mid-stance
distance (MSD) and contact time at the 45 m point. The relationship between touchdown
distance (TOD) and contact time at 30 m (r= .62, p= .09 at 30 m) and 45 m (r= .13, p= .57
at 45 m) was not significant. Vertical displacement (VD) and contact time was
moderately correlated but was not significant (r= .60, p= .051) when the data from 30 m
and 45 m were combined. Type of foot contact did not correlate with any of the other
variables.

11
Discussion
A thorough understanding of the biomechanical factors involved in sprinting is
necessary for optimizing performance in a variety of sport activities. Mero et al (1992)
conducted an extensive review of factors affecting sprint performance of elite (world
class) sprinters and found that they shared common biomechanical sprinting
characteristics. It included long stride lengths; high stride rates; short: contact times,
vertical peak-to-peak CO displacements, and touchdown distances. Other factors that
influenced sprint performance were reaction time, technique, electromyographic activity,
force production. neural factors. musculoskeletal structures. height and leg length.
Similar relationships were found, in our study, between performance success and
biomechanical characteristics of 13 National Collegiate Athletic Association (NCAA)
Division I female track and field athletes.
The highest correlation revealed in the present study was between 200 m sprint
times and contact times, 30 m (r= .79, p= .007) and 45 m (r= .85, p= .002). Luhtanen and
Komi (1978), Kunz and Kaufmann (1981), and Mann and Herman (1985), all found that
contact time decreased as running speed increased in world-class sprinters. Our findings
strongly agreed with the aforementioned studies. Successful sprinters have the ability to
exert large ground- reaction forces (ORF) in short time periods, which results in long
stride lengths and fast sprint times (Kunz and Kaufmann, 1981; Luhtanen and Komi,
1980).

0.160
0.140
0.120
" E 0.100 ., g 0.080
c .3 0.060
0.040
0.020
0.000
Contact time vs 200 m time at 30 m
20.00 22.00 24.00 26.00 28.00 30.00 32.00 34.00
200 mtime
Figure 2 Relationship between contact time and 200 m sprinting time in second at 30 m. (r = .79, p=.OO7)
Contact time vs 200 m time at 4S m
IV
0.160
0.140
0.120
E :;:; 0.100
~ 0.080 ... g 0.060
u 0.040
0.020
0.000
20.00 25.00 30.00
200 mtime
•
35.00
Figure 3 Relationship between contllct time and 200 In sprinting tim e in seco nd at 45 m (0- .85, p= .002)
12

13
Contact times and touch down distance (TDD) in the present study showed a
moderate, but not statistically significant relationship (r= .62, p= .09). Touch down
distance (TDD) has been identified as the primary reason for decreases in running
velocity during the contact phase of running (Mero, 1992). Since TDD represents the
horizontal distance between the initial foot contact point and the CG of the body
decreases in running velocity may be attributed to the opposing horizontal forces the
ground exerts on the foot (GRF) (Hay, 1993). Consequently, placement of the foot as
closely as possible beneath the CG at initial foot contact decreases the amount of negative
acceleration seen during the contact phase (Deshon and Nelson, 1964). Mann and
Herman (1985) noted that Olympic Gold medalists demonstrated small TDDs. Similar
findings were documented by Kunz and Kaufinann (1981) who reported world-class
sprinters demonstrated larger landing angles than decathletes. These authors stated that
large landing angles represented small TDDs. Furthermore, Alexander (1989) found that
TDD was one of the best predictors of sprint speed (~= .86, p= .0001) of male sprinters.
He suggested that slight differences in male and female sprinters affected the kinematic
variables of running however, these differences were not clear. The non-significant
correlation in the present study may have been due to our utilization of females.

Touchdown distance vs Contact time at 30 m
0.160
0.140
0.120
~ E 0.100
:;:;
N 0.080 c 8 0.060
0.040
0.020
0.000 0.000
......-
0.100
-~ :..----
0.200 0.300 00400
Touchdown distance
... -
-
0.500
Figure 4 Relationship between Touchdown dista nce (Horizontal distance between foot and CG at initial contact) in meter and contact time in second at 30 m. (r= .62, p= .10)
Touchdown distance vs Contact time at 4S m
0.140
0.120
0.100 .. E
:;:; 0 .080 jj .. 'C 0.060 c u
0.040
0.020
0.000 0 0.1 0.2 0.3 0.4 0.5
Touchdown distance
Figure 5 Rehttionship between Touchdown distance (Horizontal distance between foot and CG at initial contact) in meter and Contact time in second at 45 m. (r= .57, p= . 14)
14

15
Contact times and vertical displacement (YO) in the present study also showed a
moderate, but not statisticall y significant relationship (r= .5 1, p= .60). OUf findings were
consistent with those of Mero (1983), and Luhtanen and Komi (J 980). These authors
found that the contact time was short when the vertical di splacement of CG was small.
Mero further noted that contact time increases were due to large inferior displacements of
CG during the braking phase. Luhtanen and Komi (1980) reported that when vertical
displacement was small and contact time was short, the spring constant (the combined
elasticity of muscles, tendons and bones) was large. The authors suggested that
successful sprinters may utili ze extensor muscle elastic ity more efficiently, allowing
larger G RFs in short contact times, resulting in a smaller fall of CG during the contact
phase (braking phase).
Vertical Displacement vs Contact Time
0.160
0.140 • 0.120
• 0.100 E -~--
." • 1:1 0.080 Jl --. ---' 0 0 u 0.060
0 .040
0.020
0 .000
o 0.01 0.02 0.03 0.04 0.05 0.06
Vertical Displacement
Figure 6 Relationship between vert ica l displacement in meter and contact time in second :.130 m and 45 m combined. (r= .71, p= .18)
16
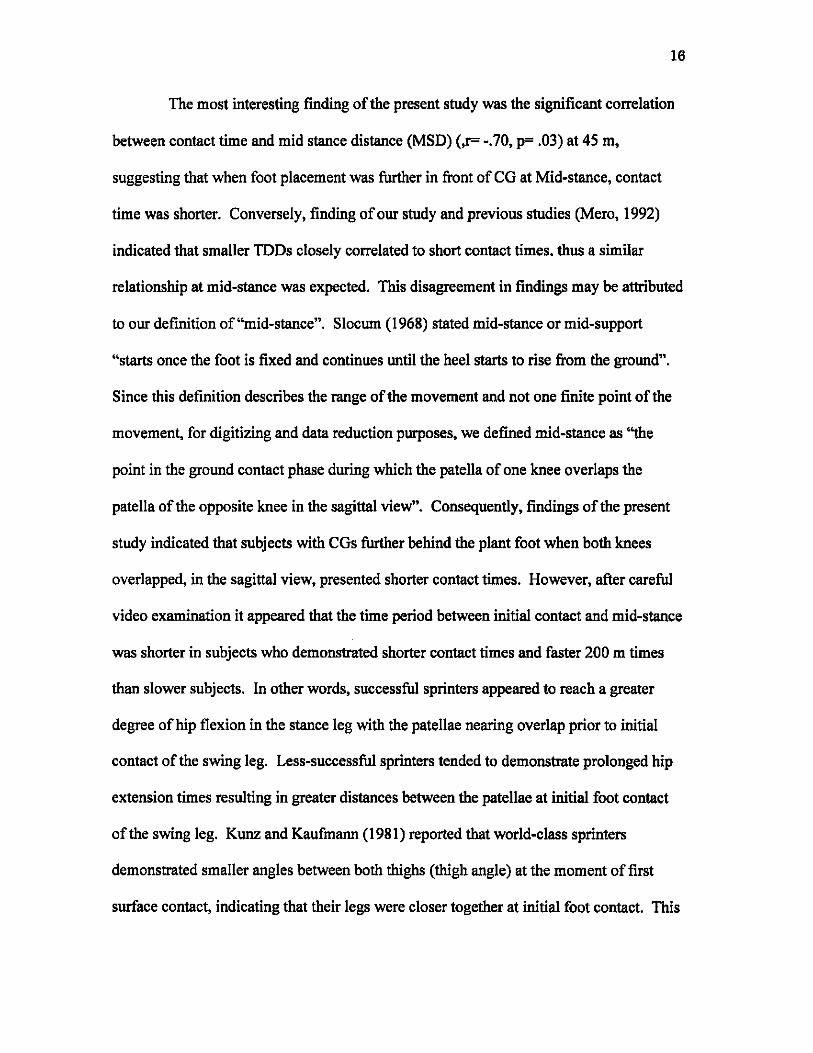
The most interesting finding of the present study was the significant correlation
between contact time and mid stance distance (MSD) (,r= -.70, p= .03) at 45 m,
suggesting that when foot placement was further in front of CO at Mid-stance, contact
time was shorter. Conversely, finding of our study and previous studies (Mero, 1992)
indicated that smaller TDDs closely correlated to short contact times. thus a similar
relationship at mid-stance was expected. This disagreement in findings may be attributed
to our definition of "mid-stance". Slocum (1968) stated mid-stance or mid-support
"starts once the foot is fixed and continues until the heel starts to rise from the ground".
Since this definition describes the range of the movement and not one finite point of the
movement, for digitizing and data reduction purposes, we defined mid-stance as ''the
point in the ground contact phase during which the patella of one knee overlaps the
patella of the opposite knee in the sagittal view". Consequently, findings of the present
study indicated that subjects with COS further behind the plant foot when both knees
overlapped, in the sagittal view, presented shorter contact times. However, after careful
video examination it appeared that the time period between initial contact and mid-stance
was shorter in subjects who demonstrated shorter contact times and faster 200 m times
than slower subjects. In other words, successful sprinters appeared to reach a greater
degree of hip flexion in the stance leg with the patellae nearing overlap prior to initial
contact of the swing leg. Less-successful sprinters tended to demonstrate prolonged hip
extension times resulting in greater distances between the patellae at initial foot contact
of the swing leg. Kunz and Kaufmann (1981) reported that world-class sprinters
demonstrated smaller angles between both thighs (thigh angle) at the moment of first
surface contact, indicating that their legs were closer together at initial foot contact. This

17
smaller thigh angle would result in reaching the "mid-stance" sooner after the initial foot
contact. In the present study, it appeared that since initial contact and mid-stance were
so close to each other in more successful sprinters, very little horizontal translation of CO
occurred between these two points. As a result. the placement of CO at mid-stance was
further behind the contact foot in successful sprinters than in less-successful sprinters
whose increased time period between initial contact and mid-stance allowed for greater
horizontal translation.
Kunz and Kaufmann (1981) stated that a smaller thigh angle helped to increase
the stride landing angle and also to decrease the contact time and increase the sprint
speed. Further video examination in our study also revealed a common characteristic of
the swing leg in successful sprinters which would contribute to decreased thigh angle at
initial contact. Novacheck (1995) defined swing phase reversal as the instantaneous
event in which hip flexion occurring during the initial swing phase changes to
progressive hip extension during the terminal swing phase prior to initial contact. This
definition suggests overall movement of the foot that is in the same horizontal direction
relative to CO prior to swing phase reversal and in the opposite horizontal direction
relative to CO after. In the present study, successful sprinters appeared to reach swing
phase reversal earlier than less-successful sprinters whose swing phase reversal occurred
closer in time or not at all before initial contact. Hay (1993) described the ability to
sustain forward momentum during the support phase based on the horizontal ground
reaction forces at initial contact relative to the direction of foot movement. He asserted
that a foot moving forward at the moment of initial contact will exert a backward

18
horizontal ground-reaction force and serve to decrease momentum while a foot moving
backward at first contact will exert a forward ground-reaction force creating increased
momentum. In this way, the early swing phase reversal demonstrated in our study by
successful sprinters should contribute to horizontal ground reaction forces at initial
contact that are not only in the proper direction to increase momentum, but are greater in
magnitude than those exerted by those runners whose swing phase reversal came later or
not at all prior to initial contact. These horizontal ground reaction forces occurring
opposite the horizontal direction of CG and the magnitude of these forces should serve to
decrease contact time and increase overall sprint speed.

Mid-stance distance vs Contact time at 30 m
0.160
0.140
0.120
" E 0.100 .. N 0.080
c 8 0.060
0.040
0.020
-
•
,--.
0.000 -0.050 0.000
.--•
• * • • •
0.050 0.100 0.150 0.200
Mid-stance distance
19
--
0.250
Figure 7 Relationship bet ween mid-s tance dista nce (Ho rizonta l distance between foot and CG at midstance) in meter and contact time in seco nd at 30 m. (r= -.32, p= .44)
Mid-stance distance vs Contact time at 45 m
0.140
0.120
0.100
" E :;; 0.080 tl ~ c 0.060 o u
0.040
0.020
0.000 -0. 1 -0.05 o 0.05 0.1 0.15 0.2 0.25 0.3
Mid-stance distance
Figure 8 Relationship between mid-s tance distunce (Horizonta l distance between foot and CG at middistance) in meter and contact time in meier at 45 m. (r= -.75. p= .03)

20
In the present study, two initial foot contact types were observed, ball of footlflat
and flat. All subjects demonstrated heel contact at 30 m and 45 m marks in the 200 m
sprint. Since, only 4 of our 13 subjects were sprinters, it was difficult to compare our
results to those orNett (1964), Payne (1983), and Mann (1980) who studied elite
sprinters. However, our results appear to coincide with Nett's observation that the heel
contacts the ground during sprinting. The present study failed to detect any significant
correlations between foo t contact type and other variables such as contact time and 200 m
sprint time.
Foot contact vs 200 m time
31.00 r------~-------------__.
30.50
3 30.00
• ~ 29.50 +-----E o ~ 29.00 +---1--
28.50 .1----1
28.00 -1-_-"-__ -'"
30m 45m
Figure 9 Type of foat contact (B:,II of Foot/Flat and Fla l) and 200 m sprinting tim e. (averaged within group)

Type of foot contact vs Contact time
0. 108 r----------------------,
0. 107
0 .106 +---1
E 0.105 +---1 ., ~ 0.104 +---1 ~ c 8 0 .103 +---1
0.102
0.101 +-----1
0 .100 -I----L---30m 4sm
Figure to Type of foot contact (Ball o f FootfF lut Rnd Flat) and contact time. (averaged within group)
21
Finally, it should be noted that the results presented in thi s paper were specific to
30 m and 45 m points of a 200 m sprint trial. Mero et al (1992) reported that world-class
elite sprinters reached their max imal velocity between 50 m and 60 m distances during a
100 m sprint. Since the subjects of the present study were collegiate athletes, and not
elite athletes we hypothesized that they would reach maximal velocity sooner than the
elite athletes. Therefore, 30 m and 45 m points were chosen as maximal velocity
observation points during 200 m sprint trials. No significant differences were found in
our study between the 30 m and 45 m observation points in all dependent variables,
however, kinemati c characteri stics associated with maximal velocity were likely to
change with fatigue development. Chapman (1982) and Nummela (1994) reported that
the development of fa tigue decreased stride length and stride rate and increased contact
time. Therefore further research is needed to investigate how fati gue changes these
kinematic variables.

22
In conclusion, contact time was significantly related to 200 m sprint time.
Contact time was also moderately correlated with TDD and VD. These findings agreed
with previous studies conducted on elite athletes. Results of the present study suggest
that kinematic characteristics predictive of success in non-elite collegiate athletes are
similar to those previously identified in elite sprinters. In addition, the present study
revealed a significant negative correlation between MSD and contact time. This finding
may be due to a shorter time period between initial foot contact and mid-stance
suggesting successful sprinters appeared to begin knee flexion and hip extension in the
swing leg in preparation for the contact phase prior to initial foot contact, in order to keep
the CO behind or above foot contact. This faster preparation for contact phase may result
in an increased stride landing angle and also decreased contact time leading to increased
sprinting speed (Kunz and Kaufinann, 1981). However, further research is needed to
investigate the relationship ofMSD to the kinematic characteristics of sprinting.

Part II
Review of Literature
Effect oflower leg Kinematics on sprinting
23
Deshon and Nelson (1964) investigated the relationship between running velocity
and kinematic variables. Subjects were 19 college varsity athletes, ten sprinters and nine
baseball players who all performed an all-out 40 yd sprint. The first 25 yd was used to
attain maximum velocity and the last 15 yd was filmed with a 16mm Bolex Camera at 64
frames per sec. The camera was placed ISS ft from the perpendicular to the center of the
15 ft filming zone. The films were analyzed with a Bell and Howell motion analysis
projector. Kinematic variables included: runner velocity over 100 frames of the film,
cycle velocity, cycle length, leg lift angle, and touchdown leg angle. Leg lift angle was
defined as "the angle between a line drawn along the top edge of the thigh and the
horizontal". Touchdown leg angle was defined as "the angle made by a parailelline with
the ground through the lateral malleolus and a line through the approximate location of
the center of gravity to the lateral malleolus". Intercorrelations between all variables
indicated that all correlations were statistically significant with the exception of the
relationship between mean leg lift angle and mean touchdown leg angle. Mean cycle
length and the mean touchdown leg angle were significantly related to cycle velocity.
The author concluded that the results of the study supported the concept that efficient
running is characterized by a high knee lift, long running stride, and placement of the foot
as closely as possible beneath the center of gravity of the runner. He further noted that
encouraging a performer to lengthen his stride or raise the knees higher would be
advisable since these movements might be the result of the propulsive force of the rear

leg. He also noted the conflict between stride length and touchdown angle since
lengthening ones stride would increase speed but the reduction touchdown angle would
decrease speed.
24
Luhtanen and Komi (1978) studied one-step cycle and the relationship between
running speed and various kinematic parameters. Six national level track and field
athletes (two sprinters, two jumpers, one decathlonist, and one thrower) were asked to run
at 40, 60, 80, and 100% of maximum speed on an indoor track. Film data were collected
at 100 frames/sec with a Locam 51-0003 camera. Results indicated that both stride
length and stride rate increased as running speed increased, however, stride length leveled
off at higher speeds while stride rate increased. Peak to peak vertical oscillation of the
center of gravity was highest at the lowest speed and lowest at the highest speed. Step
cycle, total contact time, and flight time decreased as running speed increased from 40%
to maximum. Flight time was first shorter than total contact time at the lowest speed, but
was reversed as speed increased. When total contact time was divided into a negative
phase (from the beginning of the first contact to the lowest position of center of gravity,
when extensor muscles of the contact leg worked eccentrically) and a positive phase
(portion of contact time that extensor muscles of the contact leg were contracting
concentrically), both decreased with increased running speed but the relative proportions
of contact time did not change. The author concluded that stride length seemed to be a
limiting factor for increases in velocity, in that the compensatory mechanism to increase
running speed at higher velocities would be to increase stride frequency at a greater rate
than that of stride length.

25
Kunz and Kaufmann (1981) conducted a kinematic analysis of two groups of
elite athletes: sixteen Swiss national decathletes and three world class American sprinters.
Video-recorded data were used to compare the selected kinematic variables to determine
what kinematic parameters distinguished world class performance in the 100m. Results
indicated that American sprinters produced longer strides, higher stride rates, shorter
support phases, larger landing angles, smaller upper leg angles, greater upper leg
accelerations, larger trunk inclinations, and greater trunklthigh angles than the Swiss
decathletes. The larger landing angle of the world class sprinters indicated that their foot
touch-down was closer to their centers of gravity than the Swiss decathletes. Stride
length and stride rate are primary kinematic variables that influence running speed and
since both variables are interdependent of each other, a delicate balance of both factors
should be maintained.
Mann (1981) conducted a kinetic analysis of sprint performance via investigation
of the muscle activity about the hip, knee, ankle, shoulder, and elbow. Fifteen elite
sprinters were filmed in the sagittal plane during a maximal effort sprint. A force
platform was used to record the vertical and horizontal components to determine the non
body ground forces on the body. Results indicated that elite sprinters produced larger hip
extensor and knee flexor impulses to minimize the horizontal braking force. Sprinters
who best succeeded in generating productive moments of propulsive ground-reaction
force (GRF) utilized the entire ground contact phase. Conversely premature termination
of propulsive GRF of the recovery leg activity prior to toe-off was seen in the less skilled
sprinters.
26
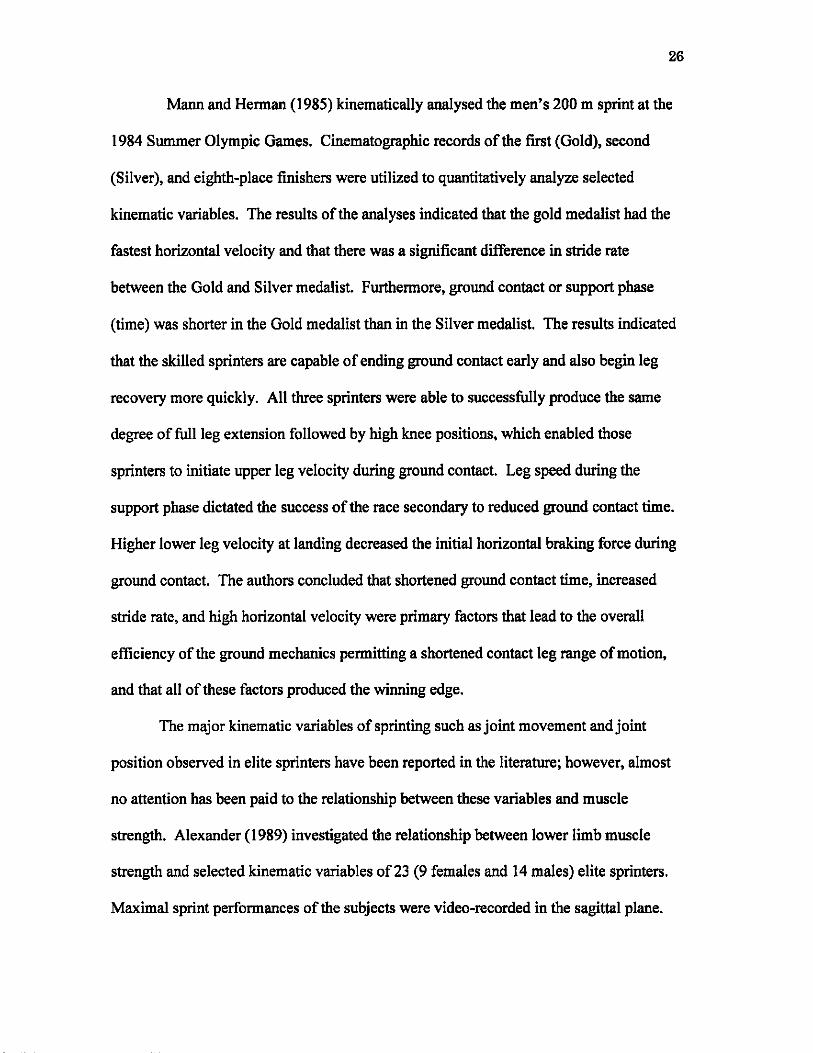
Mann and Hennan (1985) kinematically analysed the men's 200 m sprint at the
1984 Summer Olympic Games. Cinematographic records of the first (Gold), second
(Silver), and eighth-place finishers were utilized to quantitatively analyze selected
kinematic variables. The results of the analyses indicated that the gold medalist had the
fastest horizontal velocity and that there was a significant difference in stride rete
between the Gold and Silver medalist. Furthennore, ground contact or support phase
(time) was shorter in the Gold medalist than in the Silver medalist. The results indicated
that the skilled sprinters are capable of ending ground contact early and also begin leg
recovery more quickly. All three sprinters were able to successfully produce the same
degree of full leg extension followed by high knee positions, which enabled those
sprinters to initiate upper leg velocity during ground contact. Leg speed during the
support phase dictated the success of the rece secondary to reduced ground contact time.
Higher lower leg velocity at landing decreased the initial horizontal bmking force during
ground contact. The authors concluded that shortened ground contact time, increased
stride rete, and high horizontal velocity were primary factors that lead to the overall
efficiency of the ground mechanics pennitting a shortened contact leg range of motion,
and that all of these factors produced the winning edge.
The major kinematic variables of sprinting such as joint movement and joint
position observed in elite sprinters have been reported in the Iitereture; however, almost
no attention has been paid to the relationship between these variables and muscle
strength. Alexander (1989) investigated the relationship between lower limb muscle
strength and selected kinematic variables of23 (9 females and 14 males) elite sprinters.
Maximal sprint perfonnances of the subjects were video-recorded in the sagittal plane.

27
The position of the camera was set 50m from the start line where the subjects were
expected to reach their maximum speeds. Kinematic variables such as stride length,
stride rate, horizontal and vertical velocity of the body's center of the gravity (CG),
support time, non-support time, angular kinematics (position, displacement, and velocity)
of the lower limb segments and trunk, and the touchdown distance of the plant foot to the
CG were determined with the film analysis. Torque, power and range of motion of the
major muscle groups of the lower body required for sprinting were measured with a
Kinetic Communicator isokinetic dynamometer. Results of the correlations between
peak torque values and sprinting speed indicated that those correlations were statistically
significant. The results of the stepwise multiple linear regression procedures indicated
that there was a multiple correlation (If = 0.99) between sprint speed and five kinematic
variables (stride length, thigh displacement, peak angular velocity oflower let, recovery
time, and upper arm maximum displacement) of the female sprinters. Male sprinter
results revealed multiple correlations (If = 0.98) between the sprint speed and six
kinematic variables (stride length, upper arm displacement, touchdown distance to center
of gravity, lower leg displacement, peak angular velocity oflower leg, and peak thigh
velocity in push-oft). The researcher concluded that sprint kinematic variables produced
by the stepwise multiple regression analysis for the female and male were similar.
KyrllUlinen et al. (2001) investigated intra-individual differences in running
economy of 17 middle-distance runners. Subjects performed nine submaximal run trials
and four maximal sprints on an indoor track. Kinematic data, 3-D ground reaction forces
(GRF), and EMG recordings of selected leg muscles were recorded during the

28
performances. Results indicated that contact times shortened as the running speed
increased. Other kinematic variables such as stride rate and length also increased with
running speed. Ankle and knee joint angular displacements decreased during the contact
phase as running speed increased while hip angle increased. Ankle, knee, and hip peak
and average angular velocities increased only during the push-off phase. The EMG
activity of the biceps femoris muscle was correlated with the energy expenditure (r =
0.48, P < 0.05). Biceps femoris EMG activity was highest in the swing and contact
phases during maximal running. Gastrocnemius muscle activity increased in the late
swinging and braking phases. Minor angular displacements in the ankle and knee joint in
the braking phase were associated with shortened contact times and increased stride rate,
which indicated an increased functional contribution of the stretch reflexes. Tendon
muscular elasticity around the ankle and knee joints in the braking phase contributed to
force production in the push-off phase, which appeared to indicate that proper
coactivation of agonist and antagonist muscles around these joints were required to
increase the joint stiffuess to meet the requirements of increased running speed.
In summary, step length and the step rate increased and contact time decreased as
running speed increased (Luhtanen & Komi, 1978; Kunz & Kaufinann, 1981; Mann &
Herman, 1985; Kyrolainen, 2002). Elite sprinters produced larger hip extensor and knee
flexor impulses to minimize the horizontal braking forces (Mann, 1981) and placed their
contact feet as close as possible beneath their center of gravity (Deshon & Nelson, 1964;
Kunz & Kaufmann, 1981). Researchers noted that stride length and stride rates were the
two main kinematic variables that dictated running speed, and since both variables were
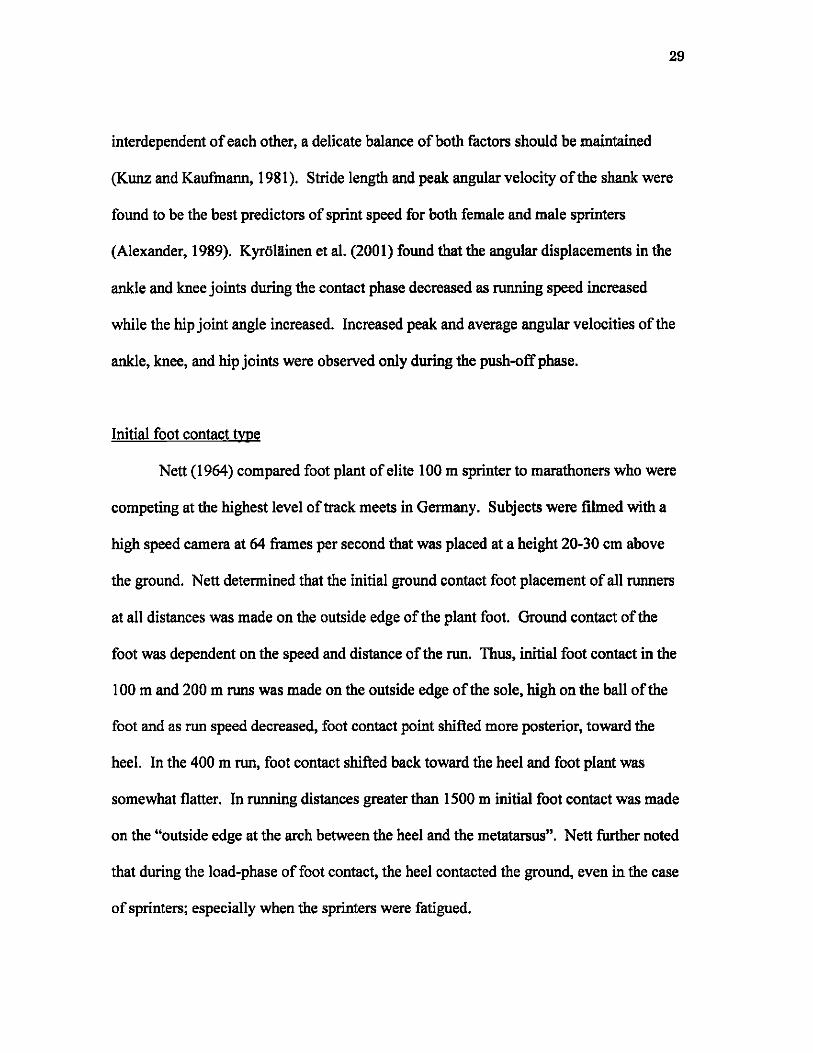
29
interdependent of each other, a delicate balance of both factors should be maintained
(Kunz and Kaufmann, 1981). Stride length and peak angular velocity of the shank were
found to be the best predictors of sprint speed for both female and male sprinters
(Alexander, 1989). Kyrtlillinen et al. (2001) found that the angular displacements in the
ankle and knee joints during the contact phase decreased as running speed increased
while the hip joint angle increased. Increased peak and average angular velocities of the
ankle, knee, and hip joints were observed only during the push-off phase.
Initial foot contact type
Nett (1964) compared foot plant of elite 100 m sprinter to marathoners who were
competing at the highest level of track meets in Germany. Subjects were filmed with a
high speed camera at 64 frames per second that was placed at a height 20-30 cm above
the ground. Nett determined that the initial ground contact foot placement of all runners
at all distances was made on the outside edge of the plant foot. Ground contact of the
foot was dependent on the speed and distance of the run. Thus, initial foot contact in the
100 m and 200 m runs was made on the outside edge of the sole, high on the ball of the
foot and as run speed decreased, foot contact point shifted more posterior, toward the
heel. In the 400 m run, foot contact shifted back toward the heel and foot plant was
somewhat flatter. In running distances greater than 1500 m initial foot contact was made
on the "outside edge at the arch between the heel and the metatarsus". Nett further noted
that during the load-phase offoot contact, the heel contacted the ground, even in the case
of sprinters; especially when the sprinters were fatigued.

30
Mann and Hagy (1980) biomechanica11y and electromyographically investigated
walking, running, and sprinting. Subjects included: two male sprinters, five experienced
joggers (2 females and 3 males), and six elite long-distance runners (3 females and 3
males). Various components of the gait cycle in walking, running, and sprinting were
recorded in the sagittal plane via high-speed film data collection. Results indicated that
step length, step rate, and horizontal velocity increased as gait shifted from walking to
running, and from running to sprinting. Film analysis also revealed increases in hip and
knee flexion and ankle dorsiflexion range of motion as gait speed increased, thereby,
lowering the body's center of gravity. Ankle joint biomechanics were significantly
different in walking, running, and sprinting. Plantar flexion occurred at initial ground
contact followed by progressive dorsiflexion during walking gait. During running,
dorsiflexion took place at initial ground contact followed by progressive planter flexion.
During sprinting, the initial ground contact was made with the toes and continuous
dorsiflexion occurred during the stance phase followed by rapid planter flexion and no
heel contact.
Payne (1983) investigated ground contact forces of18 elite runners of various
distances. The double force platform system developed by the investigator was set into
the field at ground level and speed of running was measured with photoelectric beam
timers. The subjects were also filmed with a Hulcher 35 mm sequence camera at 45
frames per second with each exposure at 1/650 sec or less. A total of 90 other athletes
were filmed with the Hulcher sequence camera during international competitions.
Ground contact methods (type) utilized by the subjects were divided into four categories:
heel and ball-of-foot; flat; ball-of-footlflat; and ball-of-foot-only. Results indicated that

31
sprinters and middle distance runners frequently used the ball-of-footlflat method. While
400m and 800m specialists often used the ball-of-foot-only method. Smoother force-time
curve patterns were observed among the subjects who ran mainly on the ball of the foot.
Payne noted that the ball-of-foot method of initial contact was physiologically more
demanding especially for endurance runners and required a high skill level for sprinters.
In summary, Nett (1964) reported that the initial foot placement or ground contact
of the foot of all runners at all distances was made on the outside edge of the foot. He
noted that the point of foot contact (type/method) depended on the speed and distance of
the run. He further noted that during the load-phase of the ground contact of the foot, the
heel contacted the ground, even in the case of sprinters; especially when the sprinters
were fatigued. In contrast, Mann and Hagy (1980) reported that initial ground contact
during sprinting was made on the toes and continuous dorsiflexion occurred during the
stance phase followed by rapid planter flexion and no heel contact. Payne (1983) noted
that sprinters and middle distance runners frequently used the ball-of-footlflat method.
He also stated that running with the ball-of-foot method was physiologically more
demanding especially for endurance runners and required a high level of skill for
sprinters.
Influence of fatigue on sprinting performance
Chapman et al (1982) investigated kinematic and temporal changes induced by
fatigue in five female provincial caliber sprinters. Small circular adhesive markers were
placed on the greater trochanter, lateral epicondyle, head of fibula, lateral malleolus, head
of the fifth metatarsal, and heel of the sole of the track shoe of the subjects' left leg.

32
Subjects performed three maximal effort 400 m runs on three separated days. Kinematic
film data were collected at 100 m (initial) and 380 m (final) points in the run. Results
indicated significant decreases in mean velocity and mean stride length from the initial to
the final phase. Significant increases in mean contact time, mean time of stance (sum of
absorption and driving phase) and mean time of driving phase were also revealed. A
decrease in thigh and knee range motion was seen with fatigue that contributed to a
decrease in step length. The author noted that different hierarchical patterns in temporal
and kinematic variables were observed among subjects in response to fatigue.
Nummela et al (1994) investigated EMG activity and ground reaction forces
during fatigued and non-fatigued running. Subjects were ten male 400m runners and
hurdlers (age: 25 ± 3 yr, height: 1.83 ± 0.06 m, weight: 73 ± 6 kg) who performed 3-5
maximal 20 m speed trials with a flying start over 40 m and a maximal 400 m time trial
on the first day, and 3-5 submaximal20 m runs with a flying start at average speed of the
first 100 m during the 400 m run on the next day. Stride length was measured and stride
rate was calculated from average speed and stride length. Electronic photocell timers
were used to time 400 m and 20 m runs, additionally a video camera was used for interval
timing during 400 m run. In order to obtain EMG activity during each run, surface
electrodes were placed on the right: medial head of the gastrocnemius(GA), vastus
Iateralis (VL), biceps femoris (BF), and rectus femoris (RF) , and the EMG transmitter
was attached to the subject's waist. The 4 m long force plate was located on the last 6-10
m before the end of each distance and the force plate and EMG data were recorded
simultaneously. Horizontal and vertical force components were separated into braking

33
and propulsion phases by using the horizontal force-time record. Results indicated that
peak and resultant ground reaction forces decreased more at the end of the 400 m run
than during maximal and submaximal 20 m runs in the braking and propulsion phases.
Significant decreases in stride rate and stride length, and significant increases in contact
time, braking phase, and propulsion phase with the constant ratio of braking to propulsion
phase were also revealed. Decreased stride length was significantly related to decreased
ground reaction forces. Ground reaction forces decreased remarkably during the braking
phase, which indicated possible failure of eccentric muscle tension thus reducing the
ability to store elastic energy during the braking phase. Significant increases in RF
averaged EMG (AEMG) from the submaximal20 m to the end of the 400 m in the
braking phase, and significant increases in the GA and the BF AEMG from the maximal
20 m to the end of the 400 m run in the propulsion phase. These findings indicated that
the RF had an important role in tolerating impact loads in running while BF and GA
primarily functioned in the propulsion phase of sprint running. A significant positive
relationship between increases in preactivity (AEMG 50 ms prior to ground phase) and
decreases in resultant ground reaction forces in the braking phase during the 400 m run,
indicated that pre-activation had an important role in maintaining force production during
the 400 m run. The author concluded that the increased neural activation was used to
compensate for muscular fatigue.
Derrick et al (2002) investigated the kinematic adjustments that runners made
during an exhaustive run and their effects on shock and shock attenuation. Ten
recreational runners (age: 25.8 ± 7.0, mass: 70.8 ± 10.1 kg) performed an exhaustive run

34
on the treadmill. The subjects were fitted with two 1.8 g piezoelectric accelerometers on
the distal anteromedial aspect of right tibia and frontal bone of skull, a custom-built knee
electrogoniometer, and custom-built rearfoot electrogoniometer then subjects ran on the
treadmill until volitional exhaustion at a velocity equal to their average 3200 m run
velocity. Data were collected every 30 sec for an interval of 8 sec and divided into three
conditions: start (the frrst two intervals), middle (the middle two intervals), and end (the
last two intervals). Results indicated a significant increase in peak impact at the leg,
maximum knee flexion, knee flexion at heel contact, maximum knee flexion velocity,
inversion, maximum rearfoot angle. and maximum rearfoot velocity from the start to the
end. The increased shock attenuation was indicated by the increased impacts at the leg
and stable head accelerations. The altered kinematics may also have affected metabolic
costs during the latter stages of the exhaustive run. The author noted that it was unknown
whether these changes in kinematics were a shift to optimize criteria of the system for
injury prevention or a failure of the system to maintain optimal behavior.
Weist et al (2004) investigated the influence of fatigue on the muscle activity and
the plantar loading panems during fatiguing treadmill running. Subjects were 30
triathletes (22 male and 8 females) with mean age, body mass, and height of34.5 ± 8.7
years. 69.6 ± 8.9 kg, and 177.9 ± 8.2 cm, respectively. Individual anaerobic threshold
was predetermined with maximal running tests on a treadmill and individual base-level
lactate plus 2 mmoIIL was used to determine the level of effort and running speed during
the exhausting treadmill run. Self-adhesive electrodes were placed on tibialis anterior,
medial and lateral gastrocnemius, soleus, peroneus longus, biceps femoris,

35
semitendinosus, rectus femoris, vastus medialis, and latera1is, adductor, tensor fascia
lateae, gluteus maximus, and gluteus medius of subjects' left leg to record EMG muscle
activity. Plantar pressure measurements were assessed with a sensor insole that was
placed in the runners left shoe between foot/sock and sock liner. Muscular impulses were
synchronized with the EMG measurements, and used for the determination of step cycle
durations. The subjects performed an exhausting run on the treadmill at the
predetermined speed until they had to terminate the run because of fatigue. At least 20
steps of EMG and pressure distribution were recorded intermittently every 2 min during
the exhausting run. The first measurement after the initial 2 min of running and the last
measurement before the termination of the run were used as the non-fatigue and fatigue
phase, respectively. Results indicated significant increases in peak pressures, maximal
force and impulses under the second and third metatarsal head and under the medial
midfoot toward the end of exhausting run. The contact area became larger only under the
first metatarsal, and the contact time in the midfoot and forefoot did not change. The
author noted that the contact time and the impulse in the medial heel significantly
increased with fatigue. The EMG activity oflower leg and biceps femoris muscles
significantly decreased with fatigue. The step length and frequency remained constant
because of the constant treadmill speed. The author concluded that the runners changed
their landing technique as a compensatory strategy in the fatigue stage.
In summary, the stride length and stride rate decreased and contact time increased
with the development of fatigue during the 400m run trials (Chapman, 1982; Nummela,
1994). However, no changes in stride length and stride rate were detected when a
36
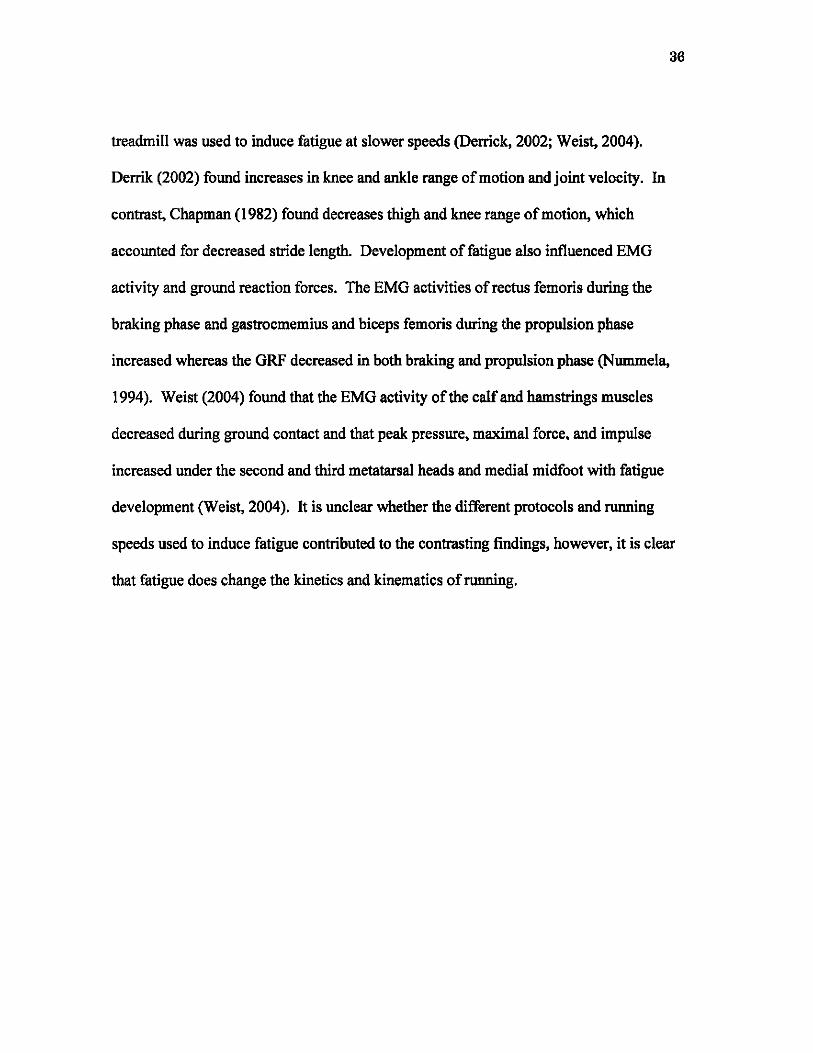
treadmill was used to induce fatigue at slower speeds (Derrick, 2002; Weist, 2004).
Derrik (2002) found increases in knee and ankle range of motion and joint velocity. In
contrast, Chapman (1982) found decreases thigh and knee range of motion, which
accounted for decreased stride length. Development of fatigue also influenced EMG
activity and ground reaction forces. The EMG activities of rectus femoris during the
braking phase and gastrocmemius and biceps femoris during the propulsion phase
increased whereas the GRF decreased in both braking and propulsion phase (Nummela,
1994). Weist (2004) found that the EMG activity of the calf and hamstrings muscles
decreased during ground contact and that peak pressure, maximal force. and impulse
increased under the second and third metatarsal heads and medial midfoot with fatigue
development (Weist, 2004). It is unclear whether the different protocols and running
speeds used to induce fatigue contributed to the contrasting findings, however, it is clear
that fatigue does change the kinetics and kinematics of running.

References
Alexander, M. J. L. (1989). The Relationship between muscle strength and sprint kinematics in elite sprinters. Canadian Journal of SPOrts Science, 14(3), 148-157.
37
Ballreich, R. (1976). Model for estimating the influence of stride length and stride frequency on the time in sprinting events. In: Komi, P. V. (ed.) Biomechanics V-B. 209-212.
Bates, B. T., Osternig, L. R., & Mason, B. (1978). Lower extremity function during the support phase of running. In: Asmussen, E. & Jorgensen, K. (eds.) Biomechanics VI-B. 30-39.
Berthoin, S., Dupont, G., Mary, P., & Gerbeaux, M. (2001). Predicting sprint kinematic parameters from anaerobic field tests in physical education students. Journal of Strength and Conditioning Research. .li(I), 75-80.
Cavanagh, P. R., & Lafortune, M. A. (1980). Ground reaction forces in distance running. Journal of Biomechanics, .u. 397-406.
Chapman, A. E. (1982). Hierarchy of changes induced by fatigue in sprinting. Canadian Journal of Applied SPOrts Science, 7(2), 116-122.
Cheetham, M. E., Boobis, L. H., Brooks, S., & Williams, C. (1986). Human muscle metabolism during sprint running. Journal of Applied Physiology, M. 54-60.
Coh, M., Milanovic, D., & Kampmiller, T. (2001). Morphologic and kinematic characteristics of elite sprinters. ColI. Antropol, 25(2), 605-610.
Derrick, T. R., Dereu, D., & Mclean, S. P. (2002). Impacts and kinematic adjustments during an exhaustive run. Medicine and Science in SPOrts and Exercise, 34(6),998-1002.
Deshon, D. E., & Nelson, R. C. (1964). A cinematographical analysis of sprint running. Research Ouarterly. 35(4), 451-455.
Dowson, M. N., Nevill, M. E., Lakomy, M. K. A., Nevill, A. M., & Hazeldine, R. J. (1998). Modeling the relationship between isokinetic muscle strength and sprint running performance. Journal of SPOrts Sciences, ~ 257-265.
Elliott, B. C., & Roberts, A. D. (1980). A biomechanical evaluation of the role offatigue in middle-distance running. Canadian Journal of Applied SPOrts Science, 2.(4), 203-207.
Fenn, W. O. (1930). Work against gravity and work due to velocity changes in running. American Journal of Physiology, 2J, 433-462.

Frishberg, B. A. (1983). An analysis of overground and treadmill sprinting. Medicine and Science in Sports and Exercise, 15(6),478-485.
38
Fujitsuka, N., Yamamoto, T., Ohkuwa, T., Saito M., & Miyamura, M. (1982). Peak blood lactate after short periods of maximal treadmill running. European Journal of Applied Physiology, !t 289-296.
Fukashiro, S., Abe, T., Shibayama, A., & Brechue, W. F. (2002). Comparison of viscoelastic characteristics in triceps surae between Black and White athletes. Acta Physiologica Scandinavic!!, 175, 183-187.
Gerlach, K. E., White, S. C., Burton, H. W., Dorn, J. M., Leddy, J. J., & Horvath, P. J. (2005). Kinetic changes with Fatigue and Relationship to Injury in Female runners. Medicine and Science in SPOrts and Exercise, 37(4), 657-663.
Green, S. (1995). Measurement of anaerobic work capacities in humans. Sports Medicine, 19( I), 32-42.
Green, S., & Dawson, B. (1993). Measurement of anaerobic capacities in humans. Sports Medicine, .li(3), 312-327.
Hamill, J., & Knutzen, K. M. (2003). Linear Kinematics: Linear Kinematics of Walking and Running. (Chapter 8). In: Biomechanical basis of human movement (2nd ed.). 289-293.
Hamill, J., & Knutzen, K. M. (2003). Linear Kinetics: Linear Kinetics oflocomotion. (Chapter 10). In: Biomechanical basis of human movement (2nd ed.). 365-368.
Hautier, C. A., Wouassi, D., Arsac, 1. M., Bitanga, E., Thiriet, P., & Lacour J. R. (1994). Relationships between postcompetition blood lactate concentration and average running velocity over 100-m and 200-m races. European Journal of Applied Physiology, ~ 508-513.
Hay, J. G. (1993). Track and field: Running (Chapter 15). In: The biomechanics of sports techniques (4th ed.). 396-423.
Hirvonen, J., Rehunen, S., Rusko, H., & HlirkOnen, M. (1987). Breakdown of highenergy phosphate compounds and lactate accumulation during short supramaximal exercise. European Journal of Applied Physiology, ~ 253-259.
Jabodys, R., Bobbert, M. F., and Ingen Schenau, G. J. van. (1996). Mechanical output from individual muscles during explosive leg extensions: The role of biarticular muscles. Journal of Biomechanics, 29(4),513-523.
Johnson, M. D., & Buckley, J. G. (2001). Muscle power patterns in the mid-acceleration phase of sprinting. Journal of SPOrts Sciences,.l2. 263-272.

39
Kivi, D. M. R., Maraj, B. K. V., & Gervais, P. (2002). A kinetic analysis of high-speed treadmill sprinting over a range of velocities. Medicine and Science in SPOrts and Exercise, 34(4), 662-666.
Komi, P. V., Rusko, H., Vos, J., & Vihko, V. (1977). Anaerobic performance capacity in athletes. Acta Physiologica Scandinavica, 100, 107-114.
Kovacs, I., Tihanyi, J., Devita, P., Racz, L., Barrier, J., & Hortobagyi, T. (1999). Foot placement modifies kinematics and kinetics during drop jumping. Medicine and Science in Sports and Exercise, TI(5), 708-716.
Kunz, H., & Kaufinann, D. A. (1981). Biomechanical analysis of sprinting: decathletes versus champions. British Journal of Sports Medicine, 15(3), 177-181.
Kyrolainen, H., Belli, A., & Komi, P. V. (2001). Biomechanica1 factors affecting running economy. Medicine and Science in Sports and Exercise. 33(8), 1330-1337.
Luhtanen, P., & Komi, P. V. (1978). Mechanical factors influencing running speed. In: Asmussen, E. & Jorgensen, K. (eds.) Biomechanics VI-B. 23-29.
Luhtanen, P., & Komi, P. V. (1980). Force- Power-, and Elasticity-Velocity Relationships in Walking, Running. and Jumping. European Journal of Applied Physiology, ~ 279-289.
Mann, R. A. & Hagy, J. (1980). Biomechanics ofwa1king, running, and sprinting. The American Journal of Sports Medicine, 8(5), 345-350.
Mann, R. V. (1981). A kinetic analysis of sprinting. Medicine and Science in SPOrts and Exercise, 11(5), 325-328.
Mann, R. V., & Sprague, P. (1983). Kinetics of Sprinting. Track & Field Quarterly Review, 83(2),4-9.
Mann, R. V., & Sprague, P. (1980). A kinetic analysis of the ground leg during sprint running. Research Quarterly For Exercise and Sport. 51 (2), 334-348.
Mann, R.V., & Herman, J. (1985). Kinematic analysis of Olympic sprint performance: men's 200 meters. International Journal of SPOrt Biomechanics,!. 151-162.
Mero, A., Komi, P. V., & Gregor, R. J. (1992). Biomechanics of sprint running. Sports Medicine, 11(6), 376-392.
Mero, A., & Komi, P. V. (1987). Electromyographic activity in sprinting at speeds ranging from sub-maximal to supra-maximal. Medicine and Science in SPOrts and Exercise, 1.2(3), 266-274.

40
Mero, A., & Komi, P. V. (1986). Force-, EMG-, and elasticity-velocity relationships at submaximal, maximal and supramaximal running speeds in sprinters. European Journal of Applied Physiology, ~ 553-561.
Mero, A., Luhtanen, P., & Komi, P. V. (1983). A biomechanical study of the sprint start. Scandinavian Journal of Sports Science, ~(1), 20-28
Mizrashi, J., Verbitsky, 0., & Isakov, E. (2001). Fatigue-induced changes in decline running. Clinical Biomechanics,!Q, 207-212.
Murase, Y., Hoshikawa, T., Yasuda, N., Ikegami, Y., & Matsui, H. (1976). Analysis of the changes in progressive speed during 100-meter dash. In: Komi, P. V. (ed.) Biomechanics V-B. 200-207.
Nett, T. (1964). Foot plant in running. In: Track Technique. 462-463.
Novacheck, T. F. (1998). The biomechanics of running. Gait and Posture, L 77-95.
Novacheck, T. F. (1995). Walking, running, and sprinting: A three-dimensional analysis of kinematics and kinetics. Instr Course Lec!, ~ 497-506.
Nummela, A. & Rusko, H. (1995). Time course of anaerobic and aerobic energy expenditure during short-term exhaustive running in athletes. International Journal of SPOrts Medicine, .!Q(8), 522-527.
Nummela, A., Rusko, H., & Mero, A. (1994). EMG activities and ground reaction forces during fatigued and nonfatigued sprinting. Medicine and Science in Sports and Exercise, 26(5),605-609.
Ohkuwa, T., Kato, Y., Katsumata, K., Nakao, T., & Miyamura, M. (1984). Blood lactate and glyceral after 400-m and 3,OOO-m runs in sprint and long distance runners. European Journal of Applied Physiology, 2J. 213-218.
Ounpuu, S. (1994).The biomechanics of walking and running. Clinics in Sports Medicine, U( 4), 843-863.
Payne, A. H. (1983). Foot to ground contact forces of elite runners. In: Matsui, H., & Kobayashi, K. (ed.) Biomechanics VII-B. 746-753.
Salo, A., Grimshaw, P. N., & Marar, L. (1997). 3-D biomechanical analysis of sprint hurdles at different competitive levels. Medicine and Science in SPOrts and Exercise, 29(2), 231-237.
Sinning, W. E., & Forsyth, H. L. (1970). Lower-limb actions while running at different velocities. Medicine and Science in SPOrts, ~(1), 28-34.

41
Slocum, D. B., & James, S. L. (1968). Biomechanics of Running. Journal of American Medical Association. 205(11), 721-728
Spriet, L. L. (1994). Anaerobic metabolism during high-intensity exercise (chapter 1). In: Hargreaves, M. (ed.) Exercise Metabolism. 1-39.
Swanson, S. C., & Caldwell, G. E. (2000). An integrated biomechanical analysis of high speed incline and level treadmill running. Medicine and Science in Sports and Exercise, 32(6),1146-1155.
Thomson, J. M. (1981). Prediction of anaerobic capacity: A performance test employing an optimal exercise stress. Canadian Journal of Applied SPOrts Science, ft(I): 16-20.
Thomson, J. M., & Garvie, K. J. (1981). A laboratory method for determination of anaerobic energy expenditure during sprinting. Canadian Journal of Applied SPOrts Science, ftC I), 21-26.
Volkov, N.l., & Lapin, V.l. (1979). Analysis of the velocity curve in sprint running. Medicine and Science in SPOrts and Exercise,li( 4),332-377.
Ward-Smith, A. J. (2001). Energy conversion strategies during 100 m sprinting. Journal of Sports Sciences, 19,701-710.
Weist, R., Eils, E., & Rosenbaum, D. (2004). The Influence of Muscle Fatigue on Electromyogram and Plantar Pressure Patterns as an Explanation for the incidence of Metatarsa Stress Fractures. The American Journal of sPOrts Medicine, 32(8),1893-1898
Weyand, P. G., Lee, C. S., Martinez-Ruiz, R., Bundle, M. W., Bellizzi, M. J., & Wright, S. (1999). High-speed running performance is largely unaffected by hypoxic reductions in aerobic power. Journal of Applied Physiology, 86(6), 2059-2064.
Weyand, P. G., Stemlight, D. B., Bellizzi, M. J., & Wright, S. (2000). Faster top running speeds are achieved with greater ground forces not more rapid leg movements. Journal of Applied Physiology, ~ 1991-1999.
Willson, J. D., & Kemozek, T. W. (1999). Plantar loading and cadence alterations with fatigue. Medicine and Science in SPOrts and Exercise, 31(12),1828-1833.
Wood, G. A. (1987). Biomechanicallimitations to sprint running. Medicine and Sports Science, ~ 58-71.
Appendix A Figures
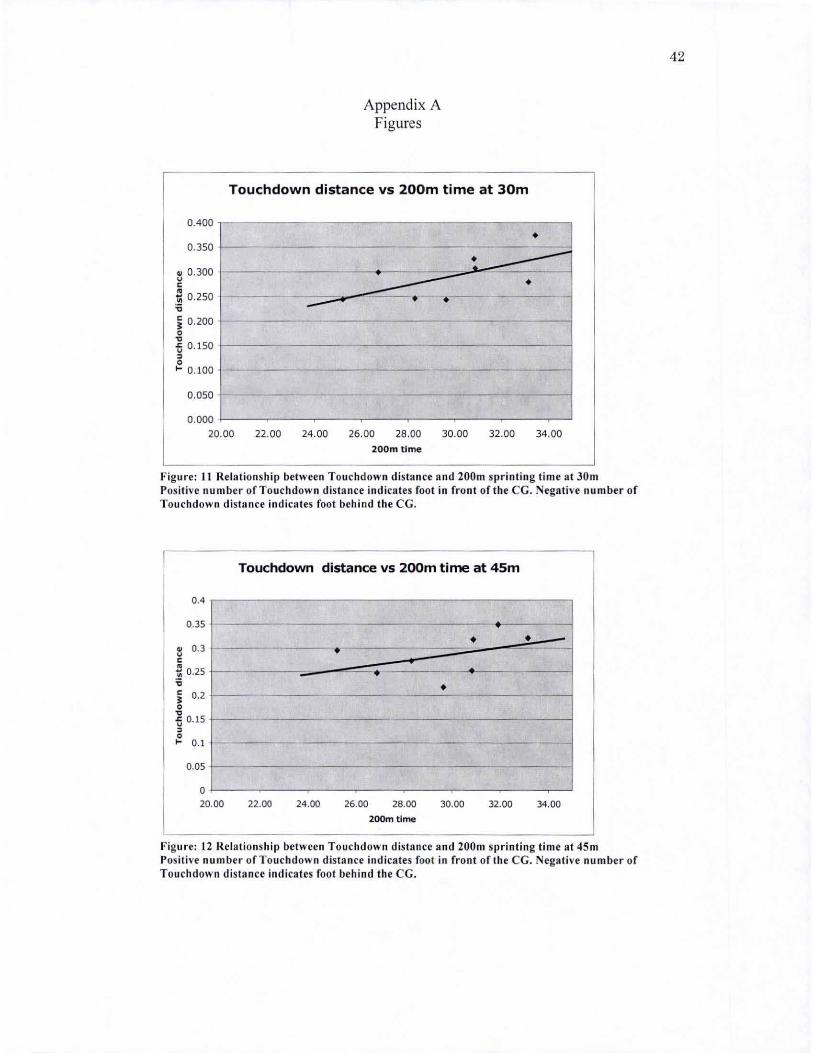
Touchdown distance vs 200 m time at 30m
0.400
0.350
• 0.300 u • ~ 0.250 '0 J 0.200 o " ti 0. 150 , o ... 0.100
0.050
f--
-
r
0.000
20.00 22.00
• ~ ~ -.
24.00 26.00 28.00 30.00 32.00 34.00
200m time
Figure: II Relationship between Touchdown distance and 200m sprinting time at 30m Positive number of Touchdown distance indicates foot in front of the CG. Negative number of Touchdown di stnnce indicates foot behind the CG.
0.4
0.35
el 0.3 • ; 0.25 ;; ; 0.2 o
" '5 0.15 , o I- 0 .1
0.05 r--o 20.00
Touchdown distance vs 200m t ime at 45m
.-
• • -• - • -...
•
.-
.-
22.00 24.00 26.00 28.00 30.00 32.00 34.00
200m time
Figure: 12 Relationship between Touchdown distance and 200m sprinting time at 45m Pos itive number of Touchdown distance indicates foot in front of the CG. Negative number of Tou chdown distance indicates foot behind the CG.
42
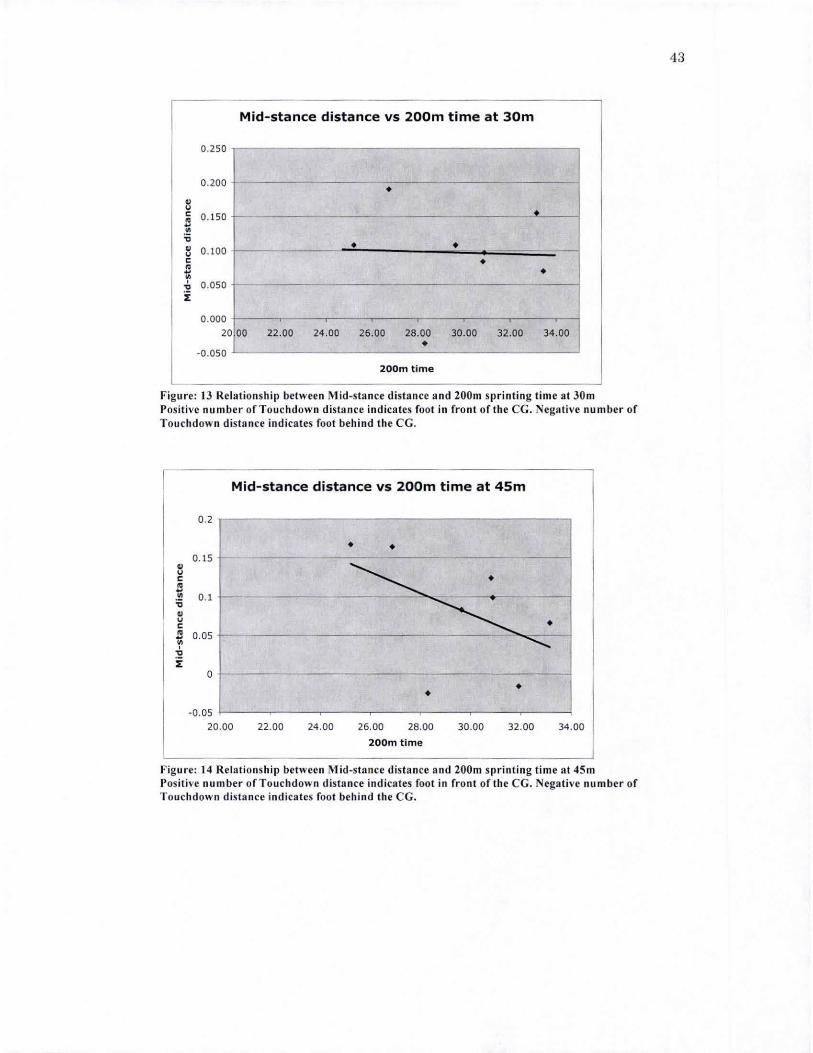
Mid-stance distance vs 200m time at 30m
0.250
0 .200 - • ~ v < 0. 150 • • ~ • :;; • 0.100 v • • -< • 1;;
• • " 0.050 -i
0.000
20 00 22.00 24.00 26.00 28.00 30.00 32.00 34.00
• -0.050
200m time
Figure: 13 Relationship between Mid-stance distance and 200m sprinting time at 30m Posi ti ve number of Touchdown distanc.e indicates foot in front of the ce. Neg:uive number of Touc.hdown distance indica tes foot behind the CG.
Mid-stance distance vs 200m time at 45m
0.2
• • 0.15 ---
~ v < • • ~ • 0.1 :;; ~ v < • 0.05 ~ • ~
-
~ • '"
:E 0
• • -0.05
20.00 22.00 24.00 26.00 28.00 30.00 32.00 34 .00
200m time
Figure: 14 Relationship between Mid-stance distance and 200m sprint ing time at 4Sm Positive number of Touchdown distance ind icates foot in front of the CG. Negative number of To uchdown distance indicates foot beh ind the CG.
43

Push-off d istance vs 200m t ime at 30m
2.500
2.000 t--- --- - .---- -
• 1.500 u c • ~
1.000 • 'ij .-
it: 0 0 .500 .i:. • ,
0.000 .. -0 .500 • I * • -1.000
20 .00 22 .00 24 .00 26.00 28.00 30.00 32.00 34.00
200m time
Figure: 15 Relationship between Push-ofT distance and 200m sprinting time at 30m Positive number of Touchdown distance indic:ttes fool in front oC the CG. Negative number of Touchdown distance indica tes foot beh ind the CG.
0.000 20
-0. 100
Q,I -0.200 u c !! \/I -0.300 'ij
it: ~ -0.400 J! • , a. -0.500
-0.600
Push- of f dista nce v s 200m time at 45m
00 22.00 24.00 26.00 28.00 30 .00 32.00
- -- ---
• •
• - • • --- . 20 0m t ime
34.00
--
-• • -
Figure: 16 Relationship between Push-off distance and 200m SI)r inling time at 45m Positive number of Touchdown di stance indicates foo t in front of the CG . Nega tive number of Touchdown distance indicates foot behind the CG.
44

3.2
.. 3.15 c E 3.1
~ 3.05
~ 3
~ 2.9 5 • ~ 2.9
~ 2.85
jj 2.8 o ~ 2.75
Total vertical displacement vs 200m time at 30m
.-• /
-./ ./ •
./ -- ~ --
--- ---- --- --- •
---;
2.7 20.00 22.00 24.00 26.00 28.00 30.00 32.00 34.00
200m t ime
Figure: 17 Relationship between Total vertica l displacement and 200m sprinting time at 30m
Total vertical displacement vs 200m time at 45m
3.35
oW 3 .3 c E 3.25
fl 3.2
.a 3. 15 • ~ 3.1
e 3.05
:e 3 • > 2.95 ;; o 2.9 ~ 2.85
-_ .
-~
2.8 20.00 22 .00 24.00
-- • •
•
--.~
-- --- - -0
26.00 28.00 30.00 32 .00
200m time
-i . -':
34 .00
Figure: 18 RelationshiJ) between Total vertica l displacement and 200m sprinting time at 4Sm
45

Push- off distance vs Contact time at 30m
0 .160
0.140 'I----- . -- -- ---0.120 •• .-
~ E 0.100 :;;
~ 0.080 ~
e 8 0.060
0 .040
r--
r--
• , •
--- --- -
0 .020 -- --- -
0 .000 -1.000 -0.500 0.000 0.500 1.000 1.500 2.000 2.500
Push-off distance
Figure: 19 Relationship between Push-off di stance Ilnd Contact time at 30m
Push-off distance vs Contact time at 4Sm
•
--0.100
' . BO
-----------------0, .060
------------------'0.04 ,
0.020
-O.BOO -0.700 -0.600 -0.500 -0.400 -0.300 -0.200 -0.100 0.000
Push-off distance
figure: 20 Relations hip between Push-off distance and Contact time at 45m
46

AppendixB INFORMED CONSENT
To Participate in a Research Study
I. INVESTIGATORS
Principal Investigators: Joseph H. Smith, A TC, CSCS
Tomoki Kanaoka, ATC
Supervising ProCessor: Iris F. Kimura, PhD, ATC, PT
Department oC Kinesiology and Leisure Science University of Hawai'i at Manoa
1337 Lower Campus Road, PE/A Complex RM231, Honolulu, m 96822 Phone: 1-808-956-7606
Fax: 1-808-956-7976
II. TITLE
Determination oC Anaerobic Performance Via a Maximal Sprint Field Test
III. INTRODUCTION
47
This study is part oC two master's degree theses by Universitv oC Hawai'i graduate students. Because you are in good physical condition and participate regularly in some fonn of physical activity, you are being asked to take part in this research study. The purpose of this study is to examine sprint field tests (SFT Max) of 200 and the Wingatge anaerobic test (WAnT) to assess your anaerobic perfonnance (a type of physical ability which enables one to perfonn high-intensity exercise in a relatively short period of time). During the SFT Max test you will be video-recorded with high speed cameras for biomechanical analyses.
The reason for giving you the following information is to help you decide if you would like to participate in this study. This consent form may contain words that are unfamiliar to you. Please discuss any questions you have about this study with the research staff members. Your participation in this research is voluntary, and you will not be paid. Be assured that all infonnation collected about you will be kept confidential. You and the researchers will be the only ones to know the individual results of your tests.
IV. DESCRIPTION OF PROCEDURES You will be asked to report to the University of Hawai'i at Manoa Human
Perfonnance Laboratory to engage in standard measurements of height, body mass and lower limb lengths (hip-knee length, lower leg length, and foot length). You will also be asked to refrain from exercising, eating or drinking ( except water) 4 hours prior to reporting to the laboratory so that you are well rested and well hydrated upon arrival.

48
Test Schedule You will be asked to perform two different tests, which will be spaced at least one
week apart for a total of 2-3 weeks. Your scheduled may appear like that depicted in the tables (Schedule A, B) below.
Schedule A Exercise Bicycle Test Sprint Field Tests (SFTMaJ WAnT 200 meter sorint
WeekI Itrial -Week 2 - I trial
Schedule B Exercise Bicycle Test Spriut Field Tests (SFT MaJ WAnT 200 meter sorint
WeekI - 1 trial Week 2 1 trial -
Wingate Anaerobic Test A maximum bicycle sprint will be performed using the cycle ergometer (exercise
bicycle). You will start with a 5-15 minute warm up on the cycle ergometer, a IS-second mock familiarization trial of the WAnT, followed by a 5-minute resting and stretching period. You will then participate in the 30-second WAnT protocol. Finger prick (#6)
(blood drawing) will then be performed during a passive recovery within 5 minutes of completion of the test. Finger prick will be taken from your fmgertip using a sterile lancet. Your blood sample will be used to measure blood lactate level in order to determine your anaerobic capacity. which is your ability to sustain high-intensity exercise in a relatively short period of time (#7). The blood sample will be labeled using your identification numbers in order to ensure confidentiality. The total time of the test will be approximately 15-25 minutes.
Maximal 200 meter Sprint Field Test The maximal 200 meter sprint test will be performed at the University of Hawai'i
Cooke Field track. You will be asked to wear proper running shoes for the test. Before the tests, you will participate in a 5-15 minute warm up period, followed by as-minute resting and stretching period. You will then participate in a 200 meter 8FT Max test. Sprint times will be recorded using photoelectric cells and will be used to measure velocity and acceleration. You will also be video-recorded with high speed cameras for biomechanical analyses. Finger prick (blood drawing) will then be performed during recovery within 5 minutes of completion of the test. The procedure and purpose of finger prick will be the same as previously described in the Wingate anaerobic test (#7). The total time of the test will be approximately 20 to 30 minutes.

49
V. RISKS Due to the high intensity of the activity involved (maximal anaerobic
performance), you may feel distress, nausea, fatigue, muscle pain, soreness, or discomfort. A very remote possibility of cardiac arrest exists. Temporary pain or discomfort may be felt during [roger prick (blood drawing). Excessive bleeding or infection may occur, and bruising at the site is a common side effect In the event of any physical injury from the research procedure, only immediate and essential medical treatment is available. First Aid/CPR and a referral to a medical emergency room will be provided. The principal investigators are nationally recognized health care providers: National Athletic Trainers Association. Board of Certification (NAT A/Bog certified athletic trainers: First Aid/CPR certified and trained to use the portable automated external defibrillator (AED) on site. You should understand that if you are injured in the course of this research procedure that you alone may be responsible for the costs of treating your injuries.
VI. BENEFITS You may not directly benefit from this study although you will gain the
experience of being part of a scientific experiment. You will obtain information concerning your anaerobic fitness levels and sprint running abilities. Knowledge gained from this experiment will help individuals and coaches to more specifically create training programs to enhance performance.
VII. CONFIDENTIALITY Your research records will be confidential to the extent permitted by law. You
will not be personally identified in any publication about this study. However. the University of Hawai'i at Manoa Committee on Human Studies may review your records (#8). A code, which will be known only to study personnel and you, will be used instead of your name on laboratory records of this study. Personal information about your test results will not be given to anyone without your written permission. In addition, all data (including video recordings) and subject (identity) information will be kept under lock and key in the Department of Kinesiology and Leisure Science Human Performance Laboratory. These materials and the video recordings will be permanently disposed of in a period not longer than 5 years.
VIII. CERTIFICATION I certify that I have read and that I understand the foregoing, that I have been
given satisfactory answers to my inquiries concerning the project procedures and other matters and that I have been advised that I am free to withdraw my consent and to discontinue participation in the project or activity at any time without prejudice.
I herewith give my consent to participate in this project with the understanding that such consent does not waive any of my legal rights, nor does it release the principal investigator or institution or any employee or agent thereof from liability for negligence.

50
If you have any questions related to this research study, please contact principal investigators, Joseph Smith and Tomoki Kanaoka at 956-3804 or you may also contact Iris F. Kimura at 956-3800 at any time.
Signature of individual participant Date
If you cannot obtain satisfactory answers to your questions, or have complaints about your treatment in this study, please contact: Committee on Human Subjects, University of Hawaii at Manoa, 2540 Maile Way, Honolulu, Hawaii 96822, Phone (808) 956-5007.

51
AppendixC 200 Meter Sprint Trial Kinematic Data
Triall <3Om Mark> Distance blw CG and Foot (meter) Contact Time Vertical
Subject Type of Foot 200M Time Initial Mid Push-off (sec) Displacement
Contact (sec) ofCG(m)
1 BFF 28.17 0.089
2 FLAT 31.92
3 FLAT 33.15 0.279 0.155 -0.452 0.111 0.015 4 FLAT 28.30 0.246 -0.036 -0.575 0.100 0.021
5 Bff 30.82 0.326 0.084 -0.543 0.106 0.017 6 27.28
7 Bff 28.15 0.111
8 26.57
9 BFF 33.44 0.374 0.070 -0.557 0.139 0.052 \0 FLAT 29.64 0.243 0.\08 0.111
11 BFF 30.88 0.307 0.097 -0.434 0.122 0.011
12 BFF 25.21 0.244 0.\08
\3 26.87
Trial 1 <45m Mark>
I BFF 28.17 -0.531 0.106
2 FLAT 31.92 0.349 -0.016 0.122
3 FLAT 33.15 0.321 0.066 -0.549 0.111 0.035 4 FLAT 28.30 0.273 ·0.025 -0.605 0.\00 0.019 5 BFF 30.82 0.252 0.124 -0.533 0.\00 0.021 6 27.28
7 28.15 8 26.57 9 BFf 33.44 -0.514 0.\33 10 FLAT 29.64 0.217 0.083 0.094 11 BFF 30.88 0.318 0.099 -0.351 0.100 0.019 12 BFF 25.21 0.295 0.167 -0.411 0.078 0.02 13 FLAT 26.87 0.247 0.164 -0.473 0.089 0.008

52
Trlal2 <JOm Mark> Distance bIw CG and Foot (meter) Contal:t Time Vertical
Subject ype of Foot 200M Time Initial Mid Push-off (sec) Displacement Contal:! (sec) ofCG (m)
I 28.77
2 32.38
3 34.00
4 FLAT 26.80 0.330 -0.051 -O.SS4 0.106 0.039 S BFF 28.76 0.350 0.123 -0.486 0.106 0.014 6 28.07
7 BFF 28.78 -0.534 0.122
8 27.22
9 BFF 33.22 0.327 0.117 -0.532 0.128 0.037 10 BFF 30.48 0.295 0.061 1.931 0.111
II BFF 30.79 0.223 0.111 -0.353 0.094 0.011 12 BFF 25.49 C).30? 0.188 0.094
\3 BFF 26.73 (1.299 0.190 0.089
irrlal 2 <45m Mark>
1 28.77
2 32.38
3 34.00 4 26.80
S 28.76
6 28.07
7 28.78 8 27.22 9 BFF 33.22 -O.S08 0.128 10 BFF 30.48 O.3C>6 0.135 0.106 II FLAT 30.79 0.294 0.052 0.106 12 BFF 25.49 0.234 0.188 -0.462 0.083 13 FLAT 26.73 0.115 -0.406 0.089