Embed Size (px)
Citation preview
3BerlinHeidelbergNew YorkHongkongLondonMilanParisTokyo
Springer Series in Statistics
Series Editors:P. BickelP. DiggleS. FienbergK. KrickebergI. OlkinN. WermuthS. Zeger
Springer Series in Statistics
Andersen/Borgan/Gill/Keiding: Statistical Models Based on Counting Processes.Atkinson/Riani: Robust Diagnostic Regression Analysis.Atkinson/Riani/Cerioli: Exploring Multivariate Data with the Forward Search.Berger: Statistical Decision Theory and Bayesian Analysis, 2nd edition.Borg/Groenen: Modern Multidimensional Scaling: Theory and Applications. Brockwell/Davis: Time Series: Theory and Methods, 2nd edition.Bucklew: Introduction to Rare Event Simulation. Chan/Tong: Chaos: A Statistical Perspective.Chen/Shao/Ibrahim: Monte Carlo Methods in Bayesian Computation.Coles: An Introduction to Statistical Modeling of Extreme Values. David/Edwards: Annotated Readings in the History of Statistics.Devroye/Lugosi: Combinatorial Methods in Density Estimation.Efromovich: Nonparametric Curve Estimation: Methods, Theory, and Applications.Eggermont/LaRiccia: Maximum Penalized Likelihood Estimation, Volume I:
Density Estimation.Fahrmeir/Tutz: Multivariate Statistical Modelling Based on Generalized Linear
Models, 2nd edition.Fan/Yao: Nonlinear Time Series: Nonparametric and Parametric Methods.Farebrother: Fitting Linear Relationships: A History of the Calculus of Observations
1750–1900.Federer: Statistical Design and Analysis for Intercropping Experiments, Volume I:
Two Crops.Federer: Statistical Design and Analysis for Intercropping Experiments, Volume II:
Three or More Crops.Ghosh/Ramamoorthi: Bayesian Nonparametrics.Glaz/Naus/Wallenstein: Scan Statistics.Good: Permutation Tests: A Practical Guide to Resampling Methods for Testing
Hypotheses, 2nd edition.Gouriéroux: ARCH Models and Financial Applications.Gu: Smoothing Spline ANOVA Models.Györfi/Kohler/Krzyzak/Walk: A Distribution-Free Theory of Nonparametric
Regression.Haberman: Advanced Statistics, Volume I: Description of Populations.Hall: The Bootstrap and Edgeworth Expansion.Härdle: Smoothing Techniques: With Implementation in S.Harrell: Regression Modeling Strategies: With Applications to Linear Models,
Logistic Regression, and Survival Analysis.Hart: Nonparametric Smoothing and Lack-of-Fit Tests.Hastie/Tibshirani/Friedman: The Elements of Statistical Learning: Data Mining, Inference,
and Prediction.Hedayat/Sloane/Stufken: Orthogonal Arrays: Theory and Applications.Heyde: Quasi-Likelihood and its Application: A General Approach to Optimal
Parameter Estimation.
(continued after index)
Wolfgang Härdle, Marlene Müller,Stefan Sperlich, Axel Werwatz
Nonparametric and SemiparametricModels
123

Cataloging-in-Publication Data applied for
A catalog record for this book is available from the Library of Congress.
Bibliographic information published by Die Deutsche BibliothekDie Deutsche Bibliothek lists this publication in the Deutsche Nationalbibliografie;detailed bibliographic data is available in the Internet at <http://dnb.ddb.de>.
Mathematics Subjects Classification (2000): 62G07, 62G08, 62G20, 62G09, 62G10
This work is subject to copyright. All rights are reserved, whether the whole or part of the material isconcerned, specifically the rights of translation, reprinting, reuse of illustrations, recitation, broadcas-ting, reproduction on microfilm or in any other way, and storage in data banks. Duplication of this pu-blication or parts thereof is permitted only under the provisions of the German Copyright Law ofSeptember 9, 1965, in its current version, and permission for use must always be obtained from Sprin-ger-Verlag. Violations are liable for prosecution under the German Copyright Law.
springeronline.com
© Springer-Verlag Berlin Heidelberg 2004
The use of general descriptive names, registered names, trademarks etc. in this publication does notimply, even in the absence of a specific statement, that such names are exempt from the relevant pro-tective laws and regulations and therefore free for general use.
Cover design: design & production, HeidelbergTypesetting by the authorsPrinted on acid-free paper 40/3142 – 543210
Wolfgang Härdle
CASE – Center for Applied Statisticsand EconomicsWirtschaftswissenschaftliche FakultätHumboldt-Universität zu Berlin10178 [email protected]
Axel Werwatz
DIW BerlinKönigin-Luise-Straße 514195 [email protected]
Marlene Müller
Fraunhofer ITWM Gottlieb-Daimler-Straße67663 Kaiserslautern [email protected]
Stefan Sperlich
Departamento de EconomíaUniversidad Carlos III de MadridC./Madrid, 126 28903 Getafe (Madrid) [email protected]
Originally published by Springer-Verlag Berlin Heidelberg New York in 2004Softcover reprint of the hardcover 1st edition 2004
ISBN 978-3-642-62076-8 ISBN 978-3-642-17146-8 (eBook)DOI 10.1007/978-3-642-17146-8
Preface
The concept of smoothing is a central idea in statistics. Its role is to extractstructural elements of variable complexity from patterns of random varia-tion. The nonparametric smoothing concept is designed to simultaneouslyestimate and model the underlying structure. This involves high dimen-sional objects, like density functions, regression surfaces or conditional quan-tiles. Such objects are difficult to estimate for data sets with mixed, high di-mensional and partially unobservable variables. The semiparametric model-ing technique compromises the two aims, flexibility and simplicity of statis-tical procedures, by introducing partial parametric components. These (lowdimensional) components allow one to match structural conditions like forexample linearity in some variables and may be used to model the influenceof discrete variables. The flexibility of semiparametric modeling has made ita widely accepted statistical technique.
The aim of this monograph is to present the statistical and mathematicalprinciples of smoothing with a focus on applicable techniques. The necessarymathematical treatment is easily understandable and a wide variety of inter-active smoothing examples are given. This text is an e-book; it is a download-able entity (http://www.i-xplore.de) which allows the reader to recalculateall arguments and applications without reference to a specific software plat-form. This new technique for proliferation of methods and ideas is specifi-cally designed for the beginner in nonparametric and semiparametric statis-tics. It is based on the XploRe quantlet technology, developed at Humboldt-Universitat zu Berlin.
The text has evolved out of the courses “Nonparametric Modeling” and“Semiparametric Modeling”, that the authors taught at Humboldt-Universi-tat zu Berlin, ENSAE Paris, Charles University Prague, and Universidad deCantabria, Santander. The book divides itself naturally into two parts:
VI Preface
• Part I: Nonparametric Models
histogram, kernel density estimation, nonparametric regression
• Part II: Semiparametric Models
generalized regression, single index models, generalized partial linearmodels, additive and generalized additive models.
The first part (Chapters 2–4) covers the methodological aspects of non-parametric function estimation for cross-sectional data, in particular kernelsmoothing methods. Although our primary focus will be on flexible regres-sion models, a closely related topic to consider is nonparametric density esti-mation. Sincemany techniques and concepts for the estimation of probabilitydensity functions are also relevant for regression function estimation, we firstconsider histograms (Chapter 2) and kernel density estimates (Chapter 3) inmore detail. Finally, in Chapter 4 we introduce several methods of nonpara-metrically estimating regression functions. The main part of this chapter isdevoted to kernel regression, but other approaches such as splines, orthogo-nal series and nearest neighbor methods are also covered.
The first part is intended for undergraduate students majoring in math-ematics, statistics, econometrics or biometrics. It is assumed that the audi-ence has a basic knowledge of mathematics (linear algebra and analysis) andstatistics (inference and regression analysis). The material is easy to utilizesince the e-book character of the text allows maximum flexibility in learning(and teaching) intensity.
The second part (Chapters 5–9) is devoted to semiparametric regressionmodels, in particular extensions of the parametric generalized linear model.In Chapter 5 we summarize the main ideas of the generalized linear model(GLM). Typical concepts are the logit and probit models. Nonparametric ex-tensions of the GLM consider either the link function (single index models,Chapter 6) or the index argument (generalized partial linear models, addi-tive and generalized additive models, Chapters 7–9). Single index modelsfocus on the nonparametric error distribution in an underlying latent vari-able model. Partial linear models take the pragmatic point of fixing the errordistribution but let the index be of non- or semiparametric structure. General-ized additivemodels concentrate on a (lower dimensional) additive structureof the index with fixed link function. This model class balances the difficultyof high-dimensional smoothing with the flexibility of nonparametrics.
In addition to the methodological aspects, the second part also coverscomputational algorithms for the considered models. As in the first part wefocus on cross-sectional data. It is intended to be used by Master and PhDstudents or researchers.
This book would not have been possible without substantial supportfrom many colleagues and students. It has benefited at several stages from
Preface VII
useful remarks and suggestions of our students at Humboldt-Universitatzu Berlin, ENSAE Paris and Charles University Prague. We are grateful toLorens Helmchen, Stephanie Freese, Danilo Mercurio, Thomas Kuhn, YingChen and Michal Benko for their support in text processing and program-ming, Caroline Condron for language checking and Pavel Cızek, ZdenekHlavka and Rainer Schulz for their assistance in teaching. We are indebted toJoel Horowitz (Northwestern University), Enno Mammen (Universitat Hei-delberg) and Helmut Rieder (Universitat Bayreuth) for their valuable com-ments on earlier versions of the manuscript. Thanks go also to ClemensHeine, Springer Verlag, for being a very supportive and helpful editor.
Berlin/Kaiserslautern/Madrid, February 2004
Wolfgang HardleMarlene MullerStefan SperlichAxel Werwatz
Contents
Preface . . . . . . . . . . . . . . . . . . . . . . . . . . . . . . . . . . . . . . . . . . . . . . . . . . . . . . . . . . . V
Notation . . . . . . . . . . . . . . . . . . . . . . . . . . . . . . . . . . . . . . . . . . . . . . . . . . . . . . . . . . XXI
1 Introduction . . . . . . . . . . . . . . . . . . . . . . . . . . . . . . . . . . . . . . . . . . . . . . . . . . 11.1 Density Estimation . . . . . . . . . . . . . . . . . . . . . . . . . . . . . . . . . . . . . . . . 11.2 Regression . . . . . . . . . . . . . . . . . . . . . . . . . . . . . . . . . . . . . . . . . . . . . . . 3
1.2.1 Parametric Regression . . . . . . . . . . . . . . . . . . . . . . . . . . . . . . 51.2.2 Nonparametric Regression . . . . . . . . . . . . . . . . . . . . . . . . . . 71.2.3 Semiparametric Regression . . . . . . . . . . . . . . . . . . . . . . . . . 9
Summary . . . . . . . . . . . . . . . . . . . . . . . . . . . . . . . . . . . . . . . . . . . . . . . . . . . . . 18
Part I Nonparametric Models
2 Histogram . . . . . . . . . . . . . . . . . . . . . . . . . . . . . . . . . . . . . . . . . . . . . . . . . . . . 212.1 Motivation and Derivation . . . . . . . . . . . . . . . . . . . . . . . . . . . . . . . . 21
2.1.1 Construction . . . . . . . . . . . . . . . . . . . . . . . . . . . . . . . . . . . . . . . 212.1.2 Derivation . . . . . . . . . . . . . . . . . . . . . . . . . . . . . . . . . . . . . . . . . 232.1.3 Varying the Binwidth . . . . . . . . . . . . . . . . . . . . . . . . . . . . . . . 23
2.2 Statistical Properties . . . . . . . . . . . . . . . . . . . . . . . . . . . . . . . . . . . . . . 242.2.1 Bias . . . . . . . . . . . . . . . . . . . . . . . . . . . . . . . . . . . . . . . . . . . . . . . 252.2.2 Variance . . . . . . . . . . . . . . . . . . . . . . . . . . . . . . . . . . . . . . . . . . . 262.2.3 Mean Squared Error . . . . . . . . . . . . . . . . . . . . . . . . . . . . . . . . 272.2.4 Mean Integrated Squared Error . . . . . . . . . . . . . . . . . . . . . . 29
X Contents
2.2.5 Optimal Binwidth . . . . . . . . . . . . . . . . . . . . . . . . . . . . . . . . . . 292.3 Dependence of the Histogram on the Origin . . . . . . . . . . . . . . . . 302.4 Averaged Shifted Histogram . . . . . . . . . . . . . . . . . . . . . . . . . . . . . . . 32Bibliographic Notes . . . . . . . . . . . . . . . . . . . . . . . . . . . . . . . . . . . . . . . . . . . . 35Exercises . . . . . . . . . . . . . . . . . . . . . . . . . . . . . . . . . . . . . . . . . . . . . . . . . . . . . . 36Summary . . . . . . . . . . . . . . . . . . . . . . . . . . . . . . . . . . . . . . . . . . . . . . . . . . . . . 38
3 Nonparametric Density Estimation . . . . . . . . . . . . . . . . . . . . . . . . . . . . . 393.1 Motivation and Derivation . . . . . . . . . . . . . . . . . . . . . . . . . . . . . . . . 39
3.1.1 Introduction . . . . . . . . . . . . . . . . . . . . . . . . . . . . . . . . . . . . . . . 393.1.2 Derivation . . . . . . . . . . . . . . . . . . . . . . . . . . . . . . . . . . . . . . . . . 403.1.3 Varying the Bandwidth . . . . . . . . . . . . . . . . . . . . . . . . . . . . . 433.1.4 Varying the Kernel Function . . . . . . . . . . . . . . . . . . . . . . . . 433.1.5 Kernel Density Estimation as a Sum of Bumps . . . . . . . . 45
3.2 Statistical Properties . . . . . . . . . . . . . . . . . . . . . . . . . . . . . . . . . . . . . . 463.2.1 Bias . . . . . . . . . . . . . . . . . . . . . . . . . . . . . . . . . . . . . . . . . . . . . . . 463.2.2 Variance . . . . . . . . . . . . . . . . . . . . . . . . . . . . . . . . . . . . . . . . . . . 483.2.3 Mean Squared Error . . . . . . . . . . . . . . . . . . . . . . . . . . . . . . . . 493.2.4 Mean Integrated Squared Error . . . . . . . . . . . . . . . . . . . . . . 50
3.3 Smoothing Parameter Selection . . . . . . . . . . . . . . . . . . . . . . . . . . . . 513.3.1 Silverman’s Rule of Thumb . . . . . . . . . . . . . . . . . . . . . . . . . 513.3.2 Cross-Validation . . . . . . . . . . . . . . . . . . . . . . . . . . . . . . . . . . . 533.3.3 Refined Plug-in Methods . . . . . . . . . . . . . . . . . . . . . . . . . . . . 553.3.4 An Optimal Bandwidth Selector?! . . . . . . . . . . . . . . . . . . . 56
3.4 Choosing the Kernel . . . . . . . . . . . . . . . . . . . . . . . . . . . . . . . . . . . . . . 573.4.1 Canonical Kernels and Bandwidths . . . . . . . . . . . . . . . . . . 573.4.2 Adjusting Bandwidths across Kernels . . . . . . . . . . . . . . . . 593.4.3 Optimizing the Kernel . . . . . . . . . . . . . . . . . . . . . . . . . . . . . . 60
3.5 Confidence Intervals and Confidence Bands . . . . . . . . . . . . . . . . 613.6 Multivariate Kernel Density Estimation . . . . . . . . . . . . . . . . . . . . . 66
3.6.1 Bias, Variance and Asymptotics . . . . . . . . . . . . . . . . . . . . . . 703.6.2 Bandwidth Selection . . . . . . . . . . . . . . . . . . . . . . . . . . . . . . . . 723.6.3 Computation and Graphical Representation . . . . . . . . . . 75
Bibliographic Notes . . . . . . . . . . . . . . . . . . . . . . . . . . . . . . . . . . . . . . . . . . . . 79Exercises . . . . . . . . . . . . . . . . . . . . . . . . . . . . . . . . . . . . . . . . . . . . . . . . . . . . . . 80Summary . . . . . . . . . . . . . . . . . . . . . . . . . . . . . . . . . . . . . . . . . . . . . . . . . . . . . 82
Contents XI
4 Nonparametric Regression . . . . . . . . . . . . . . . . . . . . . . . . . . . . . . . . . . . . 854.1 Univariate Kernel Regression . . . . . . . . . . . . . . . . . . . . . . . . . . . . . . 85
4.1.1 Introduction . . . . . . . . . . . . . . . . . . . . . . . . . . . . . . . . . . . . . . . 854.1.2 Kernel Regression . . . . . . . . . . . . . . . . . . . . . . . . . . . . . . . . . . 884.1.3 Local Polynomial Regression and Derivative
Estimation . . . . . . . . . . . . . . . . . . . . . . . . . . . . . . . . . . . . . . . 944.2 Other Smoothers . . . . . . . . . . . . . . . . . . . . . . . . . . . . . . . . . . . . . . . . . . 98
4.2.1 Nearest-Neighbor Estimator . . . . . . . . . . . . . . . . . . . . . . . . 984.2.2 Median Smoothing . . . . . . . . . . . . . . . . . . . . . . . . . . . . . . . . . 1014.2.3 Spline Smoothing . . . . . . . . . . . . . . . . . . . . . . . . . . . . . . . . . . 1014.2.4 Orthogonal Series . . . . . . . . . . . . . . . . . . . . . . . . . . . . . . . . . . 104
4.3 Smoothing Parameter Selection . . . . . . . . . . . . . . . . . . . . . . . . . . . . 1074.3.1 A Closer Look at the Averaged Squared Error . . . . . . . . 1104.3.2 Cross-Validation . . . . . . . . . . . . . . . . . . . . . . . . . . . . . . . . . . . 1134.3.3 Penalizing Functions . . . . . . . . . . . . . . . . . . . . . . . . . . . . . . . 114
4.4 Confidence Regions and Tests . . . . . . . . . . . . . . . . . . . . . . . . . . . . . . 1184.4.1 Pointwise Confidence Intervals . . . . . . . . . . . . . . . . . . . . . . 1194.4.2 Confidence Bands . . . . . . . . . . . . . . . . . . . . . . . . . . . . . . . . . . 1204.4.3 Hypothesis Testing . . . . . . . . . . . . . . . . . . . . . . . . . . . . . . . . . 124
4.5 Multivariate Kernel Regression . . . . . . . . . . . . . . . . . . . . . . . . . . . . 1284.5.1 Statistical Properties . . . . . . . . . . . . . . . . . . . . . . . . . . . . . . . . 1304.5.2 Practical Aspects . . . . . . . . . . . . . . . . . . . . . . . . . . . . . . . . . . . 132
Bibliographic Notes . . . . . . . . . . . . . . . . . . . . . . . . . . . . . . . . . . . . . . . . . . . . 135Exercises . . . . . . . . . . . . . . . . . . . . . . . . . . . . . . . . . . . . . . . . . . . . . . . . . . . . . . 137Summary . . . . . . . . . . . . . . . . . . . . . . . . . . . . . . . . . . . . . . . . . . . . . . . . . . . . . 139
Part II Semiparametric Models
5 Semiparametric and Generalized Regression Models . . . . . . . . . . . 1455.1 Dimension Reduction . . . . . . . . . . . . . . . . . . . . . . . . . . . . . . . . . . . . . 145
5.1.1 Variable Selection in Nonparametric Regression . . . . . . 1485.1.2 Nonparametric Link Function . . . . . . . . . . . . . . . . . . . . . . . 1485.1.3 Semi- or Nonparametric Index . . . . . . . . . . . . . . . . . . . . . . 149
5.2 Generalized Linear Models . . . . . . . . . . . . . . . . . . . . . . . . . . . . . . . . 1515.2.1 Exponential Families . . . . . . . . . . . . . . . . . . . . . . . . . . . . . . . 1515.2.2 Link Functions . . . . . . . . . . . . . . . . . . . . . . . . . . . . . . . . . . . . . 153
XII Contents
5.2.3 Iteratively Reweighted Least Squares Algorithm . . . . . . 154Bibliographic Notes . . . . . . . . . . . . . . . . . . . . . . . . . . . . . . . . . . . . . . . . . . . . 162Exercises . . . . . . . . . . . . . . . . . . . . . . . . . . . . . . . . . . . . . . . . . . . . . . . . . . . . . . 164Summary . . . . . . . . . . . . . . . . . . . . . . . . . . . . . . . . . . . . . . . . . . . . . . . . . . . . . 165
6 Single Index Models . . . . . . . . . . . . . . . . . . . . . . . . . . . . . . . . . . . . . . . . . . 1676.1 Identification . . . . . . . . . . . . . . . . . . . . . . . . . . . . . . . . . . . . . . . . . . . . . 1686.2 Estimation . . . . . . . . . . . . . . . . . . . . . . . . . . . . . . . . . . . . . . . . . . . . . . . 170
6.2.1 Semiparametric Least Squares . . . . . . . . . . . . . . . . . . . . . . . 1726.2.2 Pseudo Likelihood Estimation . . . . . . . . . . . . . . . . . . . . . . . 1746.2.3 Weighted Average Derivative Estimation . . . . . . . . . . . . . 178
6.3 Testing the SIM . . . . . . . . . . . . . . . . . . . . . . . . . . . . . . . . . . . . . . . . . . . 183Bibliographic Notes . . . . . . . . . . . . . . . . . . . . . . . . . . . . . . . . . . . . . . . . . . . . 185Exercises . . . . . . . . . . . . . . . . . . . . . . . . . . . . . . . . . . . . . . . . . . . . . . . . . . . . . . 186Summary . . . . . . . . . . . . . . . . . . . . . . . . . . . . . . . . . . . . . . . . . . . . . . . . . . . . . 187
7 Generalized Partial Linear Models . . . . . . . . . . . . . . . . . . . . . . . . . . . . . 1897.1 Partial Linear Models . . . . . . . . . . . . . . . . . . . . . . . . . . . . . . . . . . . . . 1897.2 Estimation Algorithms for PLM and GPLM . . . . . . . . . . . . . . . . . 191
7.2.1 Profile Likelihood . . . . . . . . . . . . . . . . . . . . . . . . . . . . . . . . . . 1917.2.2 Generalized Speckman Estimator . . . . . . . . . . . . . . . . . . . . 1957.2.3 Backfitting . . . . . . . . . . . . . . . . . . . . . . . . . . . . . . . . . . . . . . . . . 1977.2.4 Computational Issues . . . . . . . . . . . . . . . . . . . . . . . . . . . . . . . 199
7.3 Testing the GPLM. . . . . . . . . . . . . . . . . . . . . . . . . . . . . . . . . . . . . . . . . 2027.3.1 Likelihood Ratio Test with Approximate Degrees of
Freedom . . . . . . . . . . . . . . . . . . . . . . . . . . . . . . . . . . . . . . . . . . . 2027.3.2 Modified Likelihood Ratio Test . . . . . . . . . . . . . . . . . . . . . . 203
Bibliographic Notes . . . . . . . . . . . . . . . . . . . . . . . . . . . . . . . . . . . . . . . . . . . . 206Exercises . . . . . . . . . . . . . . . . . . . . . . . . . . . . . . . . . . . . . . . . . . . . . . . . . . . . . . 207Summary . . . . . . . . . . . . . . . . . . . . . . . . . . . . . . . . . . . . . . . . . . . . . . . . . . . . . 208
8 Additive Models and Marginal Effects . . . . . . . . . . . . . . . . . . . . . . . . . 2118.1 Backfitting . . . . . . . . . . . . . . . . . . . . . . . . . . . . . . . . . . . . . . . . . . . . . . . 212
8.1.1 Classical Backfitting . . . . . . . . . . . . . . . . . . . . . . . . . . . . . . . . 2128.1.2 Modified Backfitting . . . . . . . . . . . . . . . . . . . . . . . . . . . . . . . . 2198.1.3 Smoothed Backfitting . . . . . . . . . . . . . . . . . . . . . . . . . . . . . . . 221
8.2 Marginal Integration Estimator . . . . . . . . . . . . . . . . . . . . . . . . . . . . 222
Contents XIII
8.2.1 Estimation of Marginal Effects . . . . . . . . . . . . . . . . . . . . . . . 2248.2.2 Derivative Estimation for the Marginal Effects . . . . . . . . 2258.2.3 Interaction Terms . . . . . . . . . . . . . . . . . . . . . . . . . . . . . . . . . . . 227
8.3 Finite Sample Behavior . . . . . . . . . . . . . . . . . . . . . . . . . . . . . . . . . . . . 2348.3.1 Bandwidth Choice . . . . . . . . . . . . . . . . . . . . . . . . . . . . . . . . . . 2368.3.2 MASE in Finite Samples . . . . . . . . . . . . . . . . . . . . . . . . . . . . 2398.3.3 Equivalent Kernel Weights . . . . . . . . . . . . . . . . . . . . . . . . . . 240
Bibliographic Notes . . . . . . . . . . . . . . . . . . . . . . . . . . . . . . . . . . . . . . . . . . . . 247Exercises . . . . . . . . . . . . . . . . . . . . . . . . . . . . . . . . . . . . . . . . . . . . . . . . . . . . . . 248Summary . . . . . . . . . . . . . . . . . . . . . . . . . . . . . . . . . . . . . . . . . . . . . . . . . . . . . 250
9 Generalized Additive Models . . . . . . . . . . . . . . . . . . . . . . . . . . . . . . . . . 2539.1 Additive Partial Linear Models . . . . . . . . . . . . . . . . . . . . . . . . . . . . 2549.2 Additive Models with Known Link . . . . . . . . . . . . . . . . . . . . . . . . 259
9.2.1 GAM using Backfitting . . . . . . . . . . . . . . . . . . . . . . . . . . . . . 2609.2.2 GAM using Marginal Integration . . . . . . . . . . . . . . . . . . . . 262
9.3 Generalized Additive Partial Linear Models . . . . . . . . . . . . . . . . 2649.3.1 GAPLM using Backfitting . . . . . . . . . . . . . . . . . . . . . . . . . . . 2649.3.2 GAPLM using Marginal Integration . . . . . . . . . . . . . . . . . 264
9.4 Testing in Additive Models, GAM, and GAPLM . . . . . . . . . . . . . 268Bibliographic Notes . . . . . . . . . . . . . . . . . . . . . . . . . . . . . . . . . . . . . . . . . . . . 274Exercises . . . . . . . . . . . . . . . . . . . . . . . . . . . . . . . . . . . . . . . . . . . . . . . . . . . . . . 275Summary . . . . . . . . . . . . . . . . . . . . . . . . . . . . . . . . . . . . . . . . . . . . . . . . . . . . . 276
References . . . . . . . . . . . . . . . . . . . . . . . . . . . . . . . . . . . . . . . . . . . . . . . . . . . . . . . . 279
Author Index . . . . . . . . . . . . . . . . . . . . . . . . . . . . . . . . . . . . . . . . . . . . . . . . . . . . . 291
Subject Index . . . . . . . . . . . . . . . . . . . . . . . . . . . . . . . . . . . . . . . . . . . . . . . . . . . . . 295
List of Figures
1.1 Log-normal versus kernel density estimatesSPMfesdensities . . . . . . . . . . . . . . . . . . . . . . . . . . . . . . . . . . . . . . . . 2
1.2 Wage-schooling and wage-experience profile SPMcps85lin 6
1.3 Parametrically estimated regression function SPMcps85lin 6
1.4 Nonparametrically estimated regression functionSPMcps85reg . . . . . . . . . . . . . . . . . . . . . . . . . . . . . . . . . . . . . . . . . . . . 8
1.5 Engel curve SPMengelcurve2 . . . . . . . . . . . . . . . . . . . . . . . . . . . . 9
1.6 Additive model fit versus parametric fit SPMcps85add . . . . . 10
1.7 Surface plot for the additive model SPMcps85add . . . . . . . . . 11
1.8 Logit fit SPMlogit . . . . . . . . . . . . . . . . . . . . . . . . . . . . . . . . . . . . . . 13
1.9 Link function of the homoscedastic versus the heteroscedasticmodel SPMtruelogit . . . . . . . . . . . . . . . . . . . . . . . . . . . . . . . . . . . 14
1.10 Sampling distribution of the ratio of the estimated coefficientsand the ratio’s true value SPMsimulogit . . . . . . . . . . . . . . . . . . 16
1.11 Single index versus logit model SPMsim . . . . . . . . . . . . . . . . . . . 17
2.1 Histogram for stock returns data SPMhistogram . . . . . . . . . . . 22
2.2 Approximation of the area under the pdf . . . . . . . . . . . . . . . . . . . . 242.3 Histograms for stock returns, different binwidths
SPMhisdiffbin . . . . . . . . . . . . . . . . . . . . . . . . . . . . . . . . . . . . . . . . . 25
2.4 Squared bias, variance and MSE for the histogramSPMhistmse . . . . . . . . . . . . . . . . . . . . . . . . . . . . . . . . . . . . . . . . . . . . . 28
2.5 Histograms for stock returns, different originsSPMhisdiffori . . . . . . . . . . . . . . . . . . . . . . . . . . . . . . . . . . . . . . . . . . 31
XVI List of Figures
2.6 Averaged shifted histogram for stock returns SPMashstock 32
2.7 Ordinary histogram for stock returns SPMhiststock . . . . . . . 33
3.1 Some Kernel functions SPMkernel . . . . . . . . . . . . . . . . . . . . . . . 42
3.2 Density estimates for the stock returns SPMdensity . . . . . . . . 43
3.3 Different kernels for estimation SPMdenquauni . . . . . . . . . . . . 44
3.4 Different continuous kernels for estimation SPMdenepatri . 45
3.5 Kernel density estimate as sum of bumps SPMkdeconstruct 46
3.6 Bias effects SPMkdebias . . . . . . . . . . . . . . . . . . . . . . . . . . . . . . . . . 47
3.7 Squared bias, variance and MSE SPMkdemse . . . . . . . . . . . . . . . 49
3.8 Parametric versus nonparametric density estimate foraverage hourly earnings SPMcps85dist . . . . . . . . . . . . . . . . . . . 63
3.9 Confidence intervals versus density estimates for averagehourly earnings SPMcps85dist . . . . . . . . . . . . . . . . . . . . . . . . . . 64
3.10 Confidence bands versus intervals for average hourlyearnings SPMcps85dist . . . . . . . . . . . . . . . . . . . . . . . . . . . . . . . . . 65
3.11 Bivariate kernel contours for equal bandwidthsSPMkernelcontours . . . . . . . . . . . . . . . . . . . . . . . . . . . . . . . . . . . . . 68
3.12 Bivariate kernel contours for different bandwidthsSPMkernelcontours . . . . . . . . . . . . . . . . . . . . . . . . . . . . . . . . . . . . . 69
3.13 Bivariate kernel contours for bandwidth matrixSPMkernelcontours . . . . . . . . . . . . . . . . . . . . . . . . . . . . . . . . . . . . . 70
3.14 Two-dimensional density estimate SPMdensity2D . . . . . . . . . 75
3.15 Two-dimensional contour plot of a density estimateSPMcontour2D . . . . . . . . . . . . . . . . . . . . . . . . . . . . . . . . . . . . . . . . . . . 76
3.16 Two-dimensional intersections for three-dimensional densityestimate SPMslices3D . . . . . . . . . . . . . . . . . . . . . . . . . . . . . . . . . . . 77
3.17 Three-dimensional contour plots of a density estimateSPMcontour3D . . . . . . . . . . . . . . . . . . . . . . . . . . . . . . . . . . . . . . . . . . 78
4.1 Nadaraya-Watson kernel regression SPMengelcurve1 . . . . . . 87
4.2 Kernel regression estimates using different bandwidthsSPMregress . . . . . . . . . . . . . . . . . . . . . . . . . . . . . . . . . . . . . . . . . . . . . 91
4.3 Local polynomial regression SPMlocpolyreg . . . . . . . . . . . . . . 97
4.4 Local linear regression and derivative estimationSPMderivest . . . . . . . . . . . . . . . . . . . . . . . . . . . . . . . . . . . . . . . . . . . . 99
List of Figures XVII
4.5 Nearest-neighbor regression SPMknnreg . . . . . . . . . . . . . . . . . . 100
4.6 Median smoothing regression SPMmesmooreg . . . . . . . . . . . . . 102
4.7 Spline regression SPMspline . . . . . . . . . . . . . . . . . . . . . . . . . . . . . 105
4.8 Orthogonal series regression using Legendre polynomialsSPMorthogon . . . . . . . . . . . . . . . . . . . . . . . . . . . . . . . . . . . . . . . . . . . . 106
4.9 Wavelet regression SPMwavereg . . . . . . . . . . . . . . . . . . . . . . . . . . 108
4.10 Squared bias, variance and MASE SPMsimulmase . . . . . . . . . . 111
4.11 Simulated data for MASE SPMsimulmase . . . . . . . . . . . . . . . . . 112
4.12 Nadaraya-Watson kernel regression with cross-validatedbandwidth SPMnadwaest . . . . . . . . . . . . . . . . . . . . . . . . . . . . . . . . 115
4.13 Local linear regression with cross-validated bandwidthSPMlocpolyest . . . . . . . . . . . . . . . . . . . . . . . . . . . . . . . . . . . . . . . . . . 116
4.14 Penalizing functions SPMpenalize . . . . . . . . . . . . . . . . . . . . . . . 117
4.15 Confidence intervals and Nadaraya-Watson kernel regressionSPMengelconf . . . . . . . . . . . . . . . . . . . . . . . . . . . . . . . . . . . . . . . . . . 120
4.16 Estimated mean function for DM/USD exchange ratesSPMfxmean . . . . . . . . . . . . . . . . . . . . . . . . . . . . . . . . . . . . . . . . . . . . . . 122
4.17 Estimated variance function for DM/USD exchange ratesSPMfxvolatility . . . . . . . . . . . . . . . . . . . . . . . . . . . . . . . . . . . . . . . . 123
4.18 Two-dimensional local linear estimate SPMtruenadloc . . . . 133
6.1 Two link functions . . . . . . . . . . . . . . . . . . . . . . . . . . . . . . . . . . . . . . . . . 1706.2 The horizontal and the integral approach . . . . . . . . . . . . . . . . . . . . 182
7.1 GPLM logit fit for migration data SPMmigmv . . . . . . . . . . . . . . . 201
8.1 Estimated versus true additive functions . . . . . . . . . . . . . . . . . . . . 2178.2 Additive component estimates and partial residuals for
Boston housing data . . . . . . . . . . . . . . . . . . . . . . . . . . . . . . . . . . . . . . . 2188.3 Additive component estimates and partial residuals for
Boston housing data . . . . . . . . . . . . . . . . . . . . . . . . . . . . . . . . . . . . . . . 2198.4 Estimated local linear versus true additive functions . . . . . . . . . . 2278.5 Additive component and derivative estimates for Wisconsin
farm data . . . . . . . . . . . . . . . . . . . . . . . . . . . . . . . . . . . . . . . . . . . . . . . . . 2318.6 Additive component and derivative estimates for Wisconsin
farm data . . . . . . . . . . . . . . . . . . . . . . . . . . . . . . . . . . . . . . . . . . . . . . . . . 2328.7 Estimates for interaction terms for Wisconsin farm data . . . . . . . 233
XVIII List of Figures
8.8 Estimates for interaction terms for Wisconsin farm data . . . . . . . 2348.9 Performance of MASE. . . . . . . . . . . . . . . . . . . . . . . . . . . . . . . . . . . . . . 2378.10 Performance of MASE. . . . . . . . . . . . . . . . . . . . . . . . . . . . . . . . . . . . . . 2388.11 Equivalent kernels for the bivariate Nadaraya-Watson
estimator . . . . . . . . . . . . . . . . . . . . . . . . . . . . . . . . . . . . . . . . . . . . . . . . . . 2408.12 Equivalent kernels for backfitting using univariate
Nadaraya-Watson estimators . . . . . . . . . . . . . . . . . . . . . . . . . . . . . . . 2418.13 Equivalent kernels for marginal integration based on bivariate
Nadaraya-Watson smoothers . . . . . . . . . . . . . . . . . . . . . . . . . . . . . . . 2418.14 3D surface estimates for manager data . . . . . . . . . . . . . . . . . . . . . . . 2438.15 Backfitting additive and linear function estimates for manager
data . . . . . . . . . . . . . . . . . . . . . . . . . . . . . . . . . . . . . . . . . . . . . . . . . . . . . . 2448.16 Marginal integration estimates and 2σ bands for manager data 245
9.1 Estimates of additive components for female labor supply data 2589.2 Estimates of additive components for female labor supply data 2599.3 Density plots for migration data (Sachsen) . . . . . . . . . . . . . . . . . . . 2669.4 Additive curve estimates for age and income. . . . . . . . . . . . . . . . . 2689.5 Density plots for unemployment data . . . . . . . . . . . . . . . . . . . . . . . 2729.6 Estimates of additive components for unemployment data . . . . 273
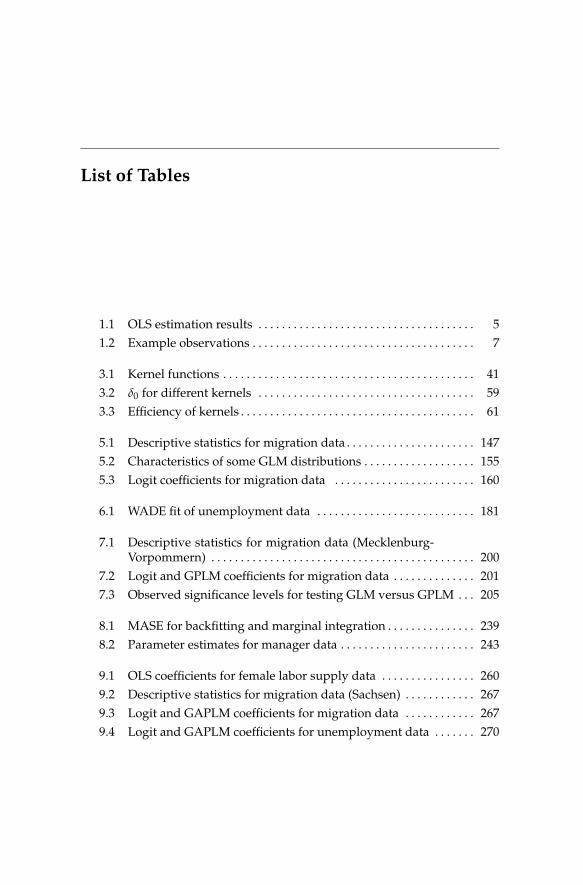
List of Tables
1.1 OLS estimation results . . . . . . . . . . . . . . . . . . . . . . . . . . . . . . . . . . . . . 51.2 Example observations . . . . . . . . . . . . . . . . . . . . . . . . . . . . . . . . . . . . . . 7
3.1 Kernel functions . . . . . . . . . . . . . . . . . . . . . . . . . . . . . . . . . . . . . . . . . . . 413.2 δ0 for different kernels . . . . . . . . . . . . . . . . . . . . . . . . . . . . . . . . . . . . . 593.3 Efficiency of kernels . . . . . . . . . . . . . . . . . . . . . . . . . . . . . . . . . . . . . . . . 61
5.1 Descriptive statistics for migration data . . . . . . . . . . . . . . . . . . . . . . 1475.2 Characteristics of some GLM distributions . . . . . . . . . . . . . . . . . . . 1555.3 Logit coefficients for migration data . . . . . . . . . . . . . . . . . . . . . . . . 160
6.1 WADE fit of unemployment data . . . . . . . . . . . . . . . . . . . . . . . . . . . 181
7.1 Descriptive statistics for migration data (Mecklenburg-Vorpommern) . . . . . . . . . . . . . . . . . . . . . . . . . . . . . . . . . . . . . . . . . . . . . 200
7.2 Logit and GPLM coefficients for migration data . . . . . . . . . . . . . . 2017.3 Observed significance levels for testing GLM versus GPLM . . . 205
8.1 MASE for backfitting and marginal integration . . . . . . . . . . . . . . . 2398.2 Parameter estimates for manager data . . . . . . . . . . . . . . . . . . . . . . . 243
9.1 OLS coefficients for female labor supply data . . . . . . . . . . . . . . . . 2609.2 Descriptive statistics for migration data (Sachsen) . . . . . . . . . . . . 2679.3 Logit and GAPLM coefficients for migration data . . . . . . . . . . . . 2679.4 Logit and GAPLM coefficients for unemployment data . . . . . . . 270
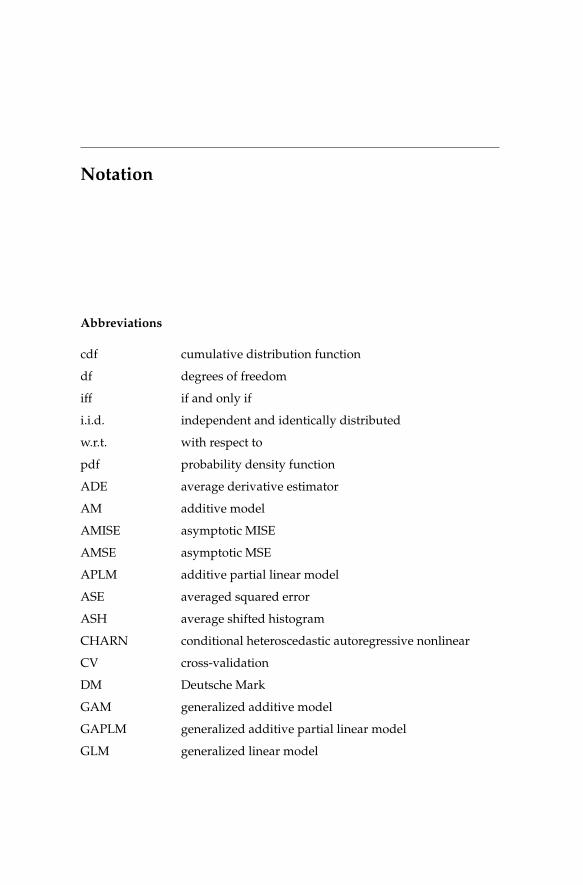
Notation
Abbreviations
cdf cumulative distribution function
df degrees of freedom
iff if and only if
i.i.d. independent and identically distributed
w.r.t. with respect to
pdf probability density function
ADE average derivative estimator
AM additive model
AMISE asymptotic MISE
AMSE asymptotic MSE
APLM additive partial linear model
ASE averaged squared error
ASH average shifted histogram
CHARN conditional heteroscedastic autoregressive nonlinear
CV cross-validation
DM Deutsche Mark
GAM generalized additive model
GAPLM generalized additive partial linear model
GLM generalized linear model
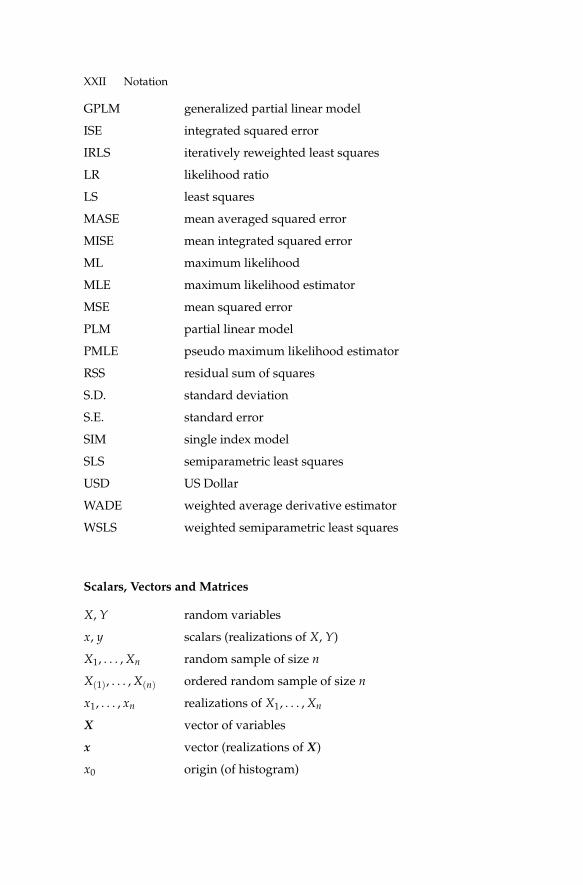
XXII Notation
GPLM generalized partial linear model
ISE integrated squared error
IRLS iteratively reweighted least squares
LR likelihood ratio
LS least squares
MASE mean averaged squared error
MISE mean integrated squared error
ML maximum likelihood
MLE maximum likelihood estimator
MSE mean squared error
PLM partial linear model
PMLE pseudo maximum likelihood estimator
RSS residual sum of squares
S.D. standard deviation
S.E. standard error
SIM single index model
SLS semiparametric least squares
USD US Dollar
WADE weighted average derivative estimator
WSLS weighted semiparametric least squares
Scalars, Vectors and Matrices
X, Y random variables
x, y scalars (realizations of X, Y)
X1, . . . ,Xn random sample of size n
X(1), . . . ,X(n) ordered random sample of size n
x1, . . . , xn realizations of X1, . . . ,Xn
X vector of variables
x vector (realizations of X)
x0 origin (of histogram)

Notation XXIII
h binwidth or bandwidth
h auxiliary bandwidth in marginal integration
H bandwidth matrix
I identity matrix
X data or design matrix
Y vector of observations Y1, . . . ,Yn
β parameter
β parameter vector
e0 first unit vector, i.e. e0 = (1, 0, . . . , 0)�
ej (j+ 1)th unit vector, i.e. ej = (0, . . . , 0, 1j, 0, . . . , 0)�
11n vector of ones of length n
μ vector of expectations of Y1, . . . ,Yn in generalizedmodels
η vector of index values X�1 β, . . . ,X�
n β in generalizedmodels
LR likelihood ratio test statistic
U vector of variables (linear part of the model)
T vector of continuous variables (nonparametric part of themodel)
Xα random vector of all but αth component
Xαj random vector of all but αth and jth component
S, SP, Sα smoother matrices
m vector of regression values m(X1), . . . ,m(Xn)
gα vector of additive component function valuesgα(X1),. . . ,gα(Xn)
Matrix algebra
tr(A) trace of matrix A
diag(A) diagonal of matrix A
det(A) determinant matrix A
rank(A) rank of matrix A
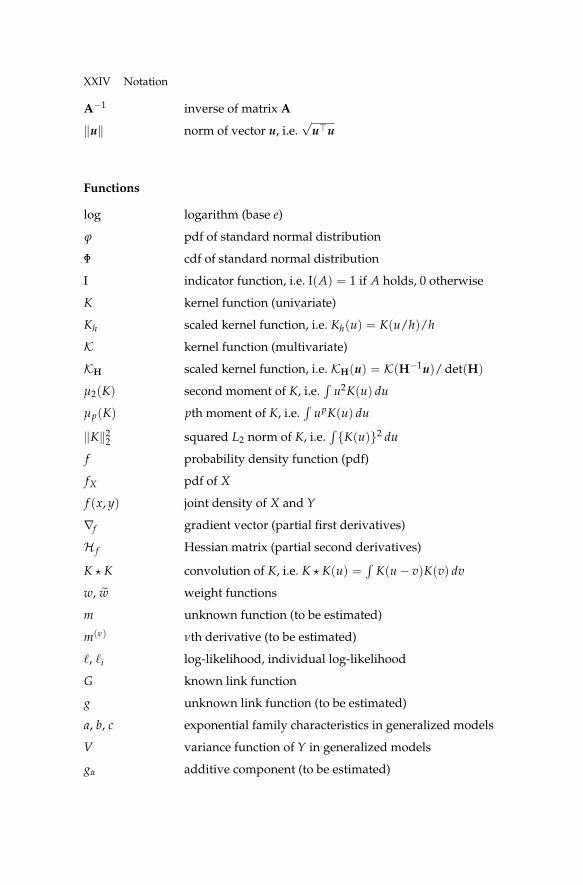
XXIV Notation
A−1 inverse of matrix A
‖u‖ norm of vector u, i.e.√u�u
Functions
log logarithm (base e)
ϕ pdf of standard normal distribution
Φ cdf of standard normal distribution
I indicator function, i.e. I(A) = 1 if A holds, 0 otherwise
K kernel function (univariate)
Kh scaled kernel function, i.e. Kh(u) = K(u/h)/h
K kernel function (multivariate)
KH scaled kernel function, i.e. KH(u) = K(H−1u)/det(H)
μ2(K) second moment of K, i.e.∫u2K(u) du
μp(K) pth moment of K, i.e.∫upK(u) du
‖K‖22 squared L2 norm of K, i.e.∫ {K(u)}2 du
f probability density function (pdf)
fX pdf of X
f (x, y) joint density of X and Y
∇f gradient vector (partial first derivatives)
H f Hessian matrix (partial second derivatives)
K � K convolution of K, i.e. K � K(u) =∫K(u− v)K(v) dv
w, w weight functions
m unknown function (to be estimated)
m(ν) νth derivative (to be estimated)
�, �i log-likelihood, individual log-likelihood
G known link function
g unknown link function (to be estimated)
a, b, c exponential family characteristics in generalized models
V variance function of Y in generalized models
gα additive component (to be estimated)
Notation XXV
g(ν)α νth derivative (to be estimated)
fα pdf of Xα
Moments
EX mean value of X
σ2 = Var(X) variance of X, i.e. Var(X) = E(X − EX)2
E(Y|X) conditional mean Y given X (random variable)
E(Y|X = x) conditional mean Y given X = x (realization of E(Y|X))
E(Y|x) same as E(Y|X = x)
σ2(x) conditional variance of Y given X = x (realization ofVar(Y|X))
EX1g(X1,X2) mean of g(X1,X2) w.r.t. X1 only
med(Y|X) conditional median Y given X (random variable)
μ same as E(Y|X) in generalized models
V(μ) variance function of Y in generalized models
ψ nuisance (dispersion) parameter in generalized models
MSEx MSE at the point x
Pα conditional expectation function E(•|Xα)
Distributions
U[0, 1] uniform distribution on [0, 1]
U[a, b] uniform distribution on [a, b]
N(0, 1) standard normal or Gaussian distribution
N(μ, σ2) normal distribution with mean μ and variance σ2
N(μ,Σ) multi-dimensional normal distribution with mean μ andcovariance matrix Σ
χ2m χ2 distribution with m degrees of freedom
tm t-distribution with m degrees of freedom
XXVI Notation
Estimates
β estimated coefficient
β estimated coefficient vector
fh estimated density function
fh,−i estimated density function when leaving out observa-tion i
mh estimated regression function
mp,h estimated regression function using local polynomials ofdegree p and bandwidth h
mp,H estimated multivariate regression function using localpolynomials of degree p and bandwidth matrix H
Convergence
o(•) a = o(b) iff a/b → 0 as n → ∞ or h → 0
O(•) a = O(b) iff a/b → constant as n → ∞ or h → 0
op(•) U = op(V) iff for all ε > 0 holds P(|U/V| > ε) → 0
Op(•) U = Op(V) iff for all ε > 0 exists c > 0 such thatP(|U/V| > c) < ε as n is sufficiently large or h is suf-ficiently small
a.s.−→ almost sure convergence
P−→ convergence in probability
L−→ convergence in distribution
≈ asymptotically equal
∼ asymptotically proportional
Other
N natural numbers
Z integers
R real numbers
Notation XXVII
Rd d-dimensional real space
∝ proportional
≡ constantly equal
# number of elements of a set
Bj jth bin, i.e. [x0 + (j− 1)h, x0 + jh)
mj bin center of Bj, i.e. mj = x0 + (j− 12 )h


![Bibliography - download.xuebalib.comdownload.xuebalib.com/xuebalib.com.53526.pdf · Applications of the Monte Carlo Method in Statistical Physics. Springer, Berlin, 1984. [37] K](https://img.pdfslide.us/doc/110x75/5b8140337f8b9a466b8bf34e/bibliography-applications-of-the-monte-carlo-method-in-statistical-physics.jpg)

![ÝPOČTOVÉ MODELOVÁNÍ VYSOKOFREKVENČNÍHO ...Audio Frequencies, Springer-Verlag Berlin, Heidelberg, Germany, 1988 [3] Langley, R. S.: General derivation of the statistical energy](https://img.pdfslide.us/doc/110x75/5f32b33966bd014f8d3d8473/pooetov-modelovn-vysokofrekvenoenho-audio-frequencies-springer-verlag.jpg)