Embed Size (px)
Citation preview

ISM® MANUFACTURING & NON-MANUFACTURING
SEMIANNUAL ECONOMIC FORECAST
• Spring Update of December 2013 Forecast for 2014• Manufacturing and Non-Manufacturing Sectors• Compare 2014 Forecasts with 2013 Reported Results• Broad Sector Overviews with Industry-Specific Insights• Revenue, CapEx, Commodity Prices, Employment• Special Question Related to Harsh Weather Impact
ISM Semiannual Economic Forecast, Spring 2014
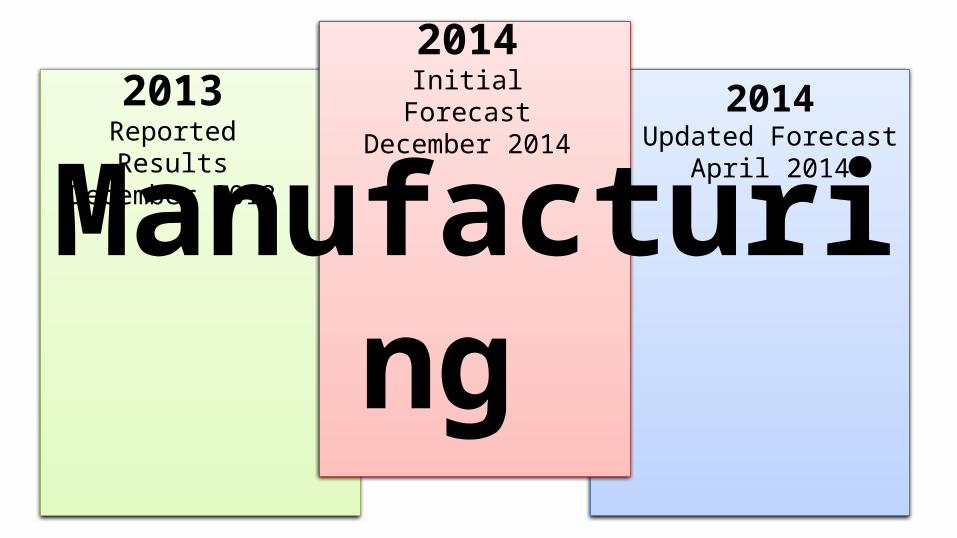
2014Initial Forecast
December 20142014
Updated Forecast April 2014
Manufacturing
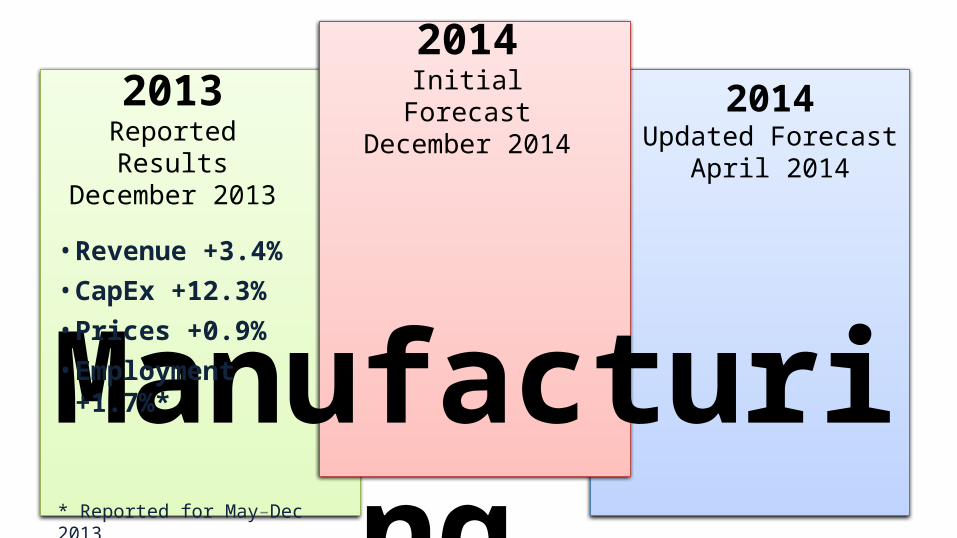
2013Reported Results December 2013
Manufacturing
2013Reported Results December 2013
2014Initial Forecast
December 20142014
Updated Forecast April 2014
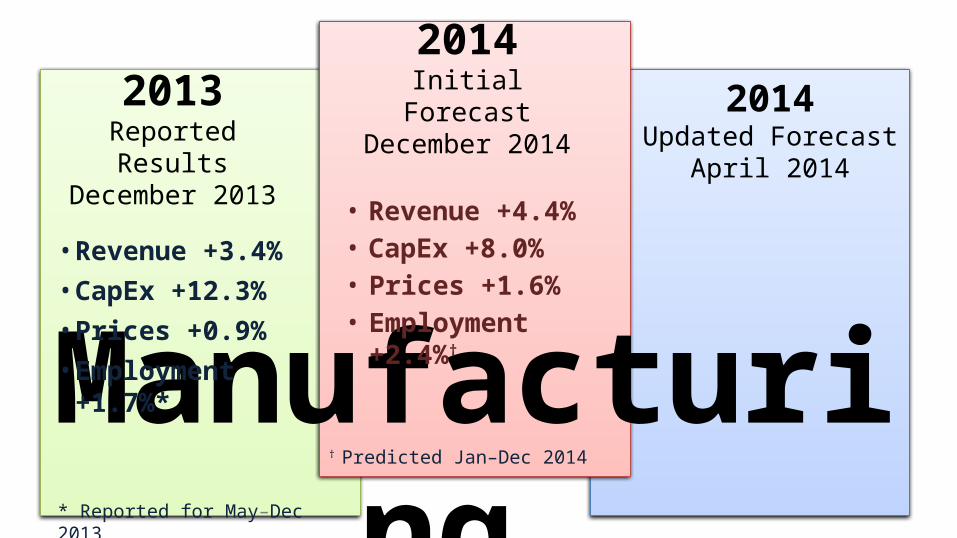
• Revenue +3.4%• CapEx +12.3% • Prices +0.9%• Employment +1.7%*
* Reported for May–Dec 2013
† Predicted Jan–Dec 2014Manufacturing
2013Reported Results December 2013
2014Initial Forecast
December 20142014
Updated Forecast April 2014
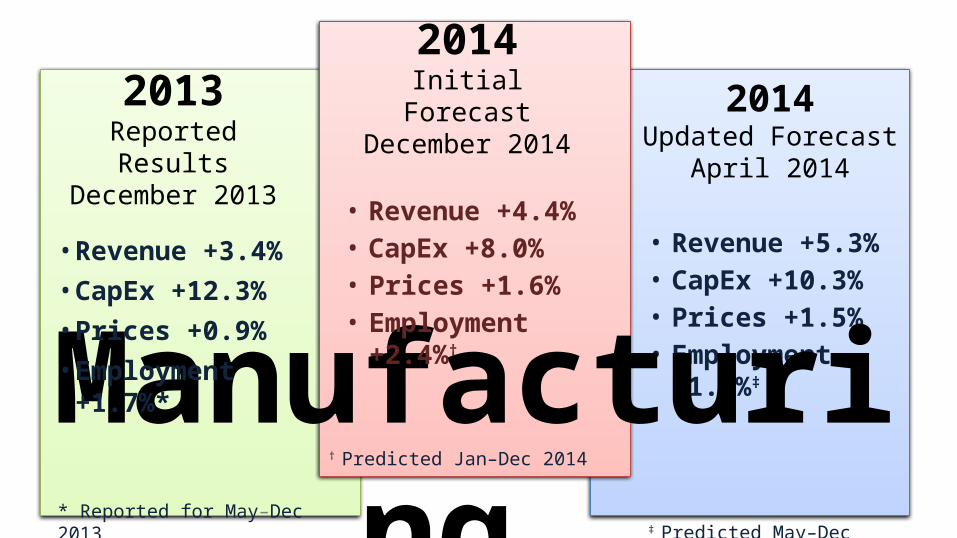
• Revenue +3.4%• CapEx +12.3% • Prices +0.9%• Employment +1.7%*
* Reported for May–Dec 2013
• Revenue +4.4%• CapEx +8.0%• Prices +1.6%• Employment +2.4%†
2013Reported Results December 2013
April–December
2014APRIL–DECEMBER
2013
† Predicted Jan–Dec 2014
• Revenue +5.3%• CapEx +10.3%• Prices +1.5%• Employment +1.5%‡
‡ Predicted May–Dec 2014Manufacturing
2013Reported Results December 2013
2014Initial Forecast
December 20142014
Updated Forecast April 2014
• Revenue +4.4%• CapEx +8.0%• Prices +1.6%• Employment +2.4%†
• Revenue +3.4%• CapEx +12.3% • Prices +0.9%• Employment +1.7%*
* Reported for May–Dec 2013
2013Reported Results December 2013
April–December
2014APRIL–DECEMBER
2013
‡ diffusion index for April 2014
Reported for 2014:• Revenue +5.3%• Prices +1.3%• Employment 54.7%‡
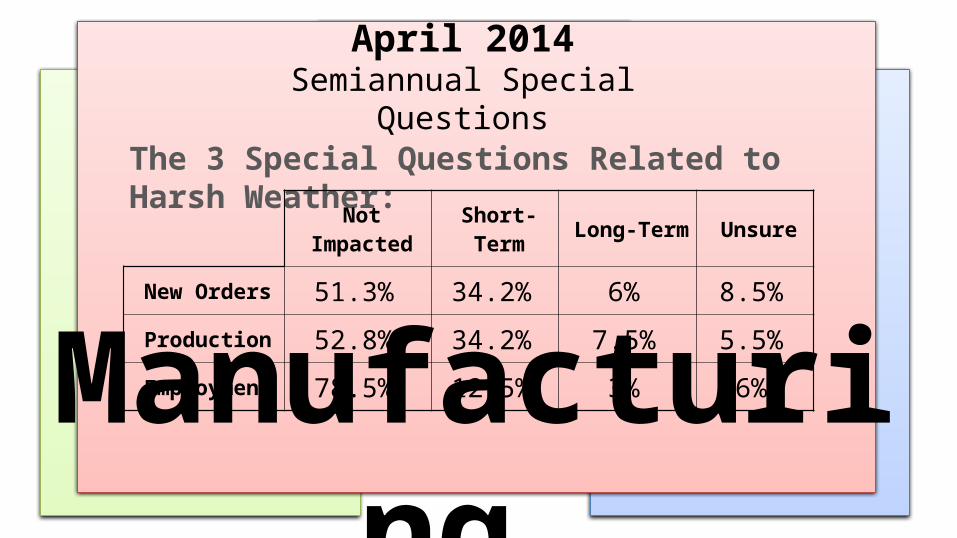
The 3 Special Questions Related to Harsh Weather:
April 2014Semiannual Special Questions
Manufacturing
Not Impacted Short-Term Long-Term Unsure
New Orders 51.3% 34.2% 6% 8.5%
Production 52.8% 34.2% 7.5% 5.5%
Employment 78.5% 12.5% 3% 6%
APRIL–DECEMBER
2013
‡ diffusion index for April 2014
Reported for 2014:• Revenue +5.3%• Prices +1.3%• Employment 54.7%‡
PresentHere’s where we
are now
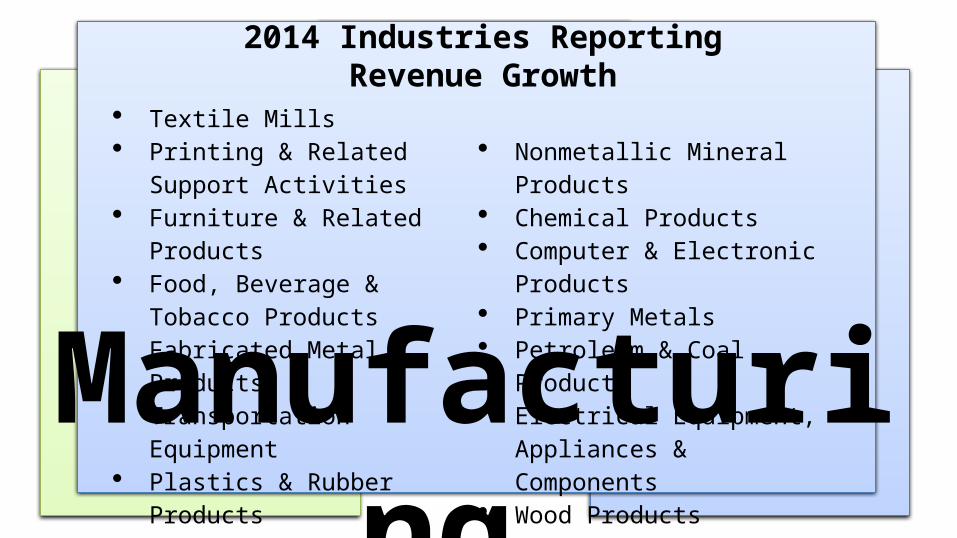
2014 Industries Reporting Revenue Growth
Manufacturing
Textile Mills Printing & Related Support
Activities Furniture & Related Products Food, Beverage & Tobacco
Products Fabricated Metal Products Transportation Equipment Plastics & Rubber Products Paper Products Miscellaneous Manufacturing
Nonmetallic Mineral Products Chemical Products Computer & Electronic Products Primary Metals Petroleum & Coal Products Electrical Equipment, Appliances
& Components Wood Products Machinery Apparel, Leather & Allied
Products
2014Initial Forecast
December 20142014
Updated Forecast April 2014
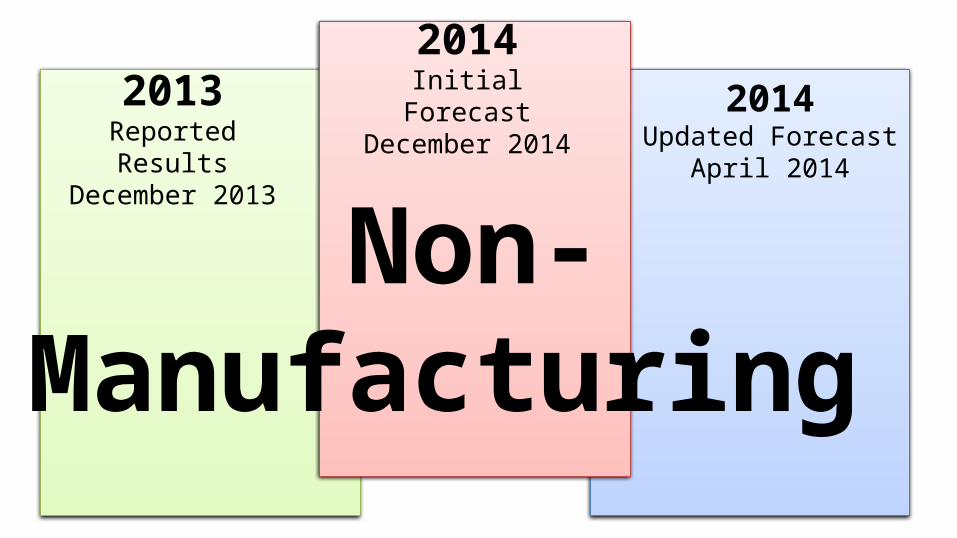
Non-Manufacturing
2013Reported Results December 2013
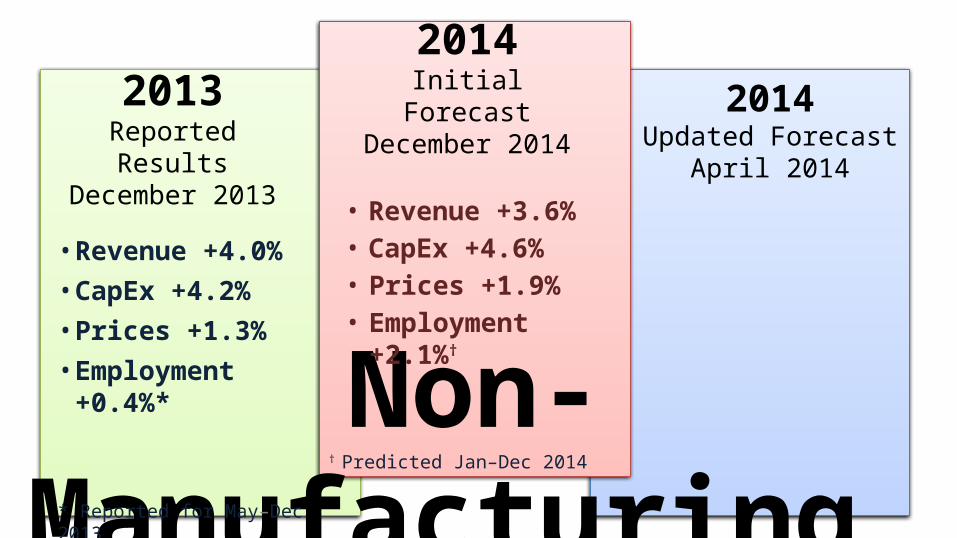
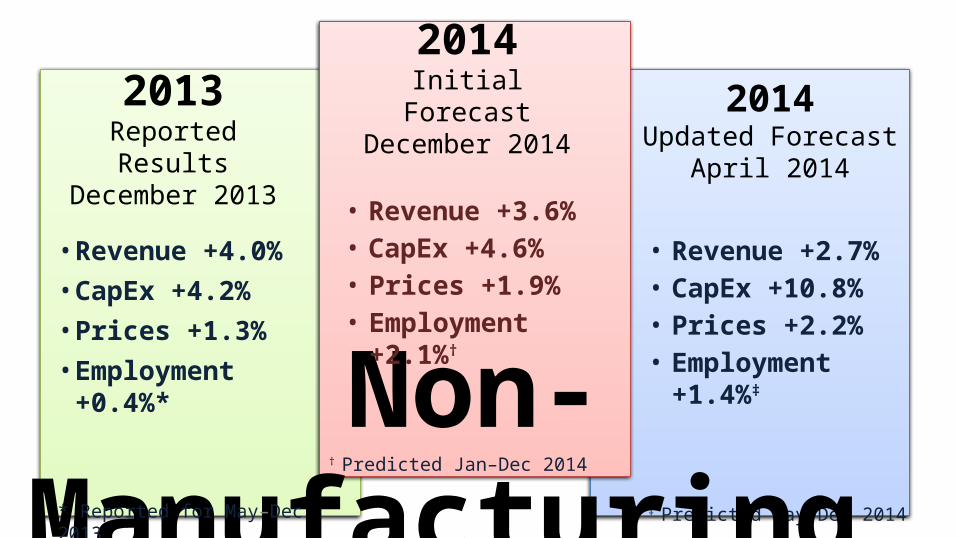
Non-Manufacturing
2013Reported Results December 2013
2014Initial Forecast
December 20142014
Updated Forecast April 2014
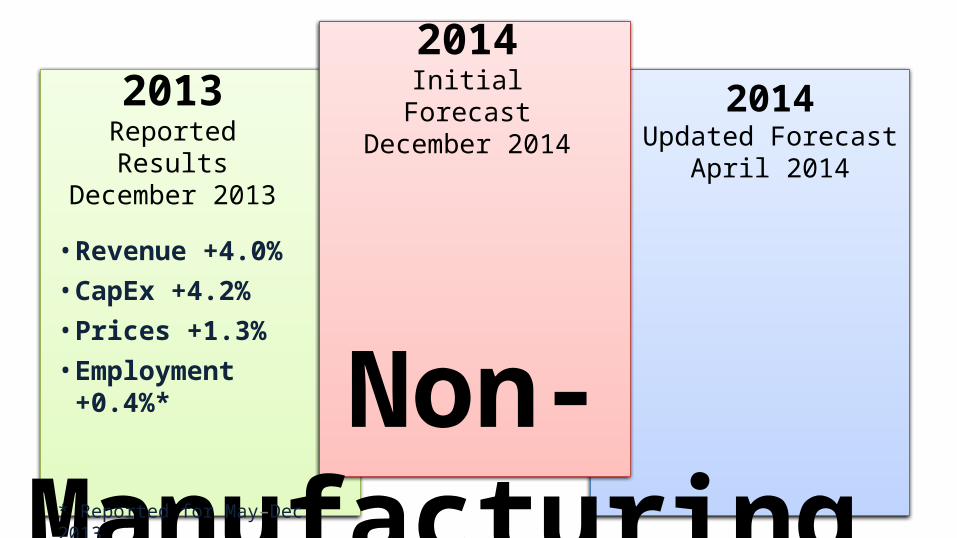
• Revenue +4.0%• CapEx +4.2% • Prices +1.3%• Employment +0.4%*
* Reported for May–Dec 2013
† Predicted Jan–Dec 2014Non-Manufacturing
2013Reported Results December 2013
2014Initial Forecast
December 20142014
Updated Forecast April 2014
• Revenue +4.0%• CapEx +4.2% • Prices +1.3%• Employment +0.4%*
* Reported for May–Dec 2013
• Revenue +3.6%• CapEx +4.6%• Prices +1.9%• Employment +2.1%†
2013Reported Results December 2013
April–December
2014APRIL–DECEMBER
2013
† Predicted Jan–Dec 2014
• Revenue +2.7%• CapEx +10.8%• Prices +2.2%• Employment +1.4%‡
‡ Predicted May–Dec 2014Non-Manufacturing
2013Reported Results December 2013
2014Initial Forecast
December 20142014
Updated Forecast April 2014
• Revenue +3.6%• CapEx +4.6%• Prices +1.9%• Employment +2.1%†
• Revenue +4.0%• CapEx +4.2% • Prices +1.3%• Employment +0.4%*
* Reported for May–Dec 2013
2013Reported Results December 2013
April–December
2014APRIL–DECEMBER
2013
‡ diffusion index for April 2014
Reported for 2014:• Revenue +5.3%• Prices +1.3%• Employment 54.7%‡
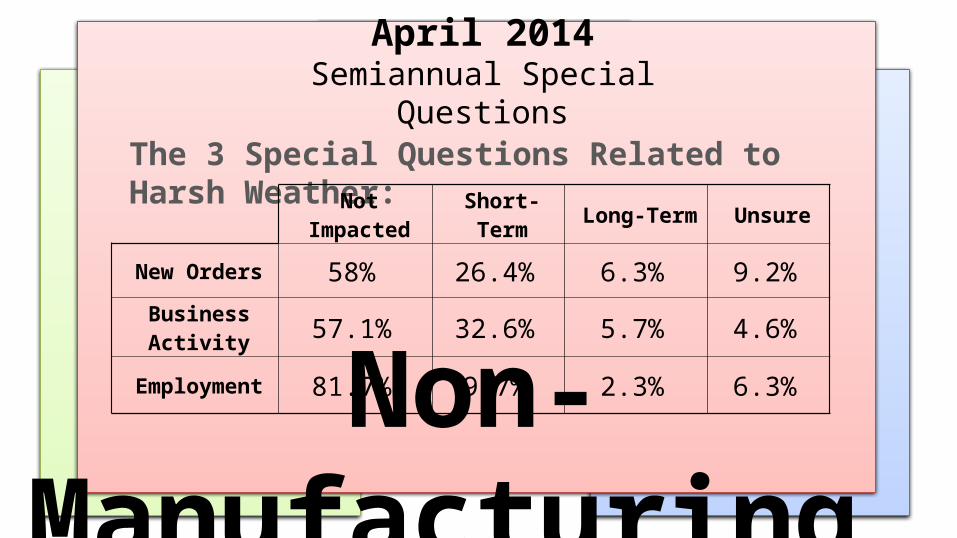
The 3 Special Questions Related to Harsh Weather:
April 2014Semiannual Special Questions
Non-Manufacturing
Not Impacted Short-Term Long-Term Unsure
New Orders 58% 26.4% 6.3% 9.2%
Business Activity 57.1% 32.6% 5.7% 4.6%
Employment 81.7% 9.7% 2.3% 6.3%
APRIL–DECEMBER
2013
‡ diffusion index for April 2014
Reported for 2014:• Revenue +5.3%• Prices +1.3%• Employment 54.7%‡
PresentHere’s where we
are now
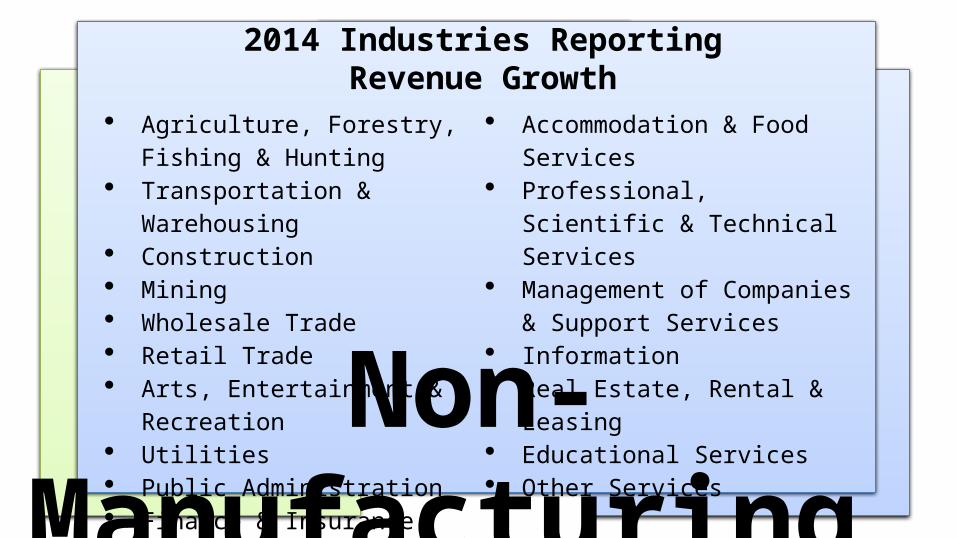
2014 Industries Reporting Revenue Growth
Non-Manufacturing
Agriculture, Forestry, Fishing & Hunting
Transportation & Warehousing Construction Mining Wholesale Trade Retail Trade Arts, Entertainment & Recreation Utilities Public Administration
Finance & Insurance Accommodation & Food Services Professional, Scientific & Technical
Services Management of Companies &
Support Services Information Real Estate, Rental & Leasing Educational Services Other Services
See Report for Additional Forecast Details…• Operating Rates as Percent of Normal Capacity• Expected Production Capacity Increases• Industries Listed in Order of Growth, Increases, etc.
16
Thanks!
The Focus is YOU!