Embed Size (px)
Citation preview
Spring Forward or Fall Back? The Post-Crisis Recovery of Firms
Leandro Medina
WP/12/292
© 2012 International Monetary Fund WP/12/292
IMF Working Paper
Middle East and Central Asia Department
Spring Forward or Fall Back? The Post-Crisis Recovery of Firms
Prepared by Leandro Medina1
Authorized for distribution by Paul Cashin
December 2012
Abstract
This paper studies corporate performance in the aftermath of the global crisis by examining 6,581 manufacturing firms in 48 developed and developing countries in 2010, identifying factors of resilience as well as vulnerability. Based on a cross-sectional analysis, the results show that pre-crisis leverage and short-term debt have had negative effects on the speed of the recovery, while asset tangibility has had positive effects. The negative effect of leverage is non-linear, being particularly strong in firms with high pre-crisis leverage. Furthermore, the effects are different for advanced and emerging market economies. The paper also shows that the macroeconomic framework critically matters for firm growth. In particular, in countries that have allowed the exchange rate to depreciate, firms have had a faster recovery in sectors highly dependent on trade.
JEL Classification Numbers: D22, G01, G30, G32, F30.
Keywords: Financial crisis, firm resilience, recovery, international finance, leverage, corporate performance, trade.
Author’s E-Mail Address: [email protected]
1 An earlier version of this paper appears as Chapter 3 of the author’s Ph.D. dissertation completed at George Washington University. The author wishes to thank Paul Cashin, Bruce Hansen, Herman Kamil, Graciela Kaminsky, Tara Sinclair, Roberto Samaniego, Hui Tong, Carlos Vegh, Chao Wei, and Harold Zavarce for helpful comments, and Sanaa Farid and Deven Thead for editorial assistance. Special thanks are due to Ben Sutton for his help with the Worldscope database.
This Working Paper should not be reported as representing the views of the IMF. The views expressed in this Working Paper are those of the author(s) and do not necessarily represent those of the IMF or IMF policy. Working Papers describe research in progress by the author(s) and are published to elicit comments and to further debate.
2
Contents Page
I. Introduction ............................................................................................................................3
II. Empirical Strategy .................................................................................................................4 A. Explanatory Variables ...............................................................................................5
III. Data Description ..................................................................................................................7
IV. Descriptive Statistics ...........................................................................................................7
V. Empirical Findings ................................................................................................................8 A. Nonlinear Effects of Leverage ................................................................................10 B. Robustness Tests: Trade Sensitivity and Real Depreciation Effects .......................12
VI. Conclusion .........................................................................................................................14 Tables 1. Country and Region Coverage .............................................................................................19 2. Sample Coverage .................................................................................................................20 3. Summary Statistics...............................................................................................................21 4. Baseline Regression: All Countries .....................................................................................22 5. Baseline Regression: Emerging Economies ........................................................................23 6. Baseline Regression: Advanced Economies ........................................................................24 7. Nonlinear Effects of Leverage .............................................................................................25 8. Depreciation and Trade Effects ...........................................................................................26 Figures 1. Density Distribution of Corporate Performance: 2007, 2009, and 2010…………………27 2. Density Distribution of Corporate Performance by Levels of Leverage: 2010…………..28 3. Corporate Performance: 2007–2010……………………………………………………...29 Appendix Data Sources and Definitions of Variables ..............................................................................30 References ................................................................................................................................15
3
I. INTRODUCTION
The 2007–09 crisis that originated in developed economies quickly turned into a global recession with exceptional declines in output, employment, and trade for most countries.2 However, the impact on economic activity has varied widely across countries.3 This may reflect differences in exposure and vulnerability to the real and financial shocks emanating from financial centers, and may reflect heterogeneity in macroeconomic and institutional frameworks, as well as in policy responses. At the firm level one would expect heterogeneity between and within countries. Within each country one would expect a large variation in corporate sector responses to the global financial crisis. These differences would possibly depend on firms’ economic sector, international exposure to trade and finance, debt ratios, cash holdings, and/or geographical location, and also on each country’s policies and institutional frameworks. Even though most of the existing literature focuses on studying the causes and transmission mechanisms of the crisis,4 a small literature is emerging that studies the recovery after the 2007–09 crisis emphasizing some salient features.5 For example, the International Monetary Fund’s (IMF’s) World Economic Outlook (April 2010) studies the multispeed recovery that is taking place across the globe, with Asian emerging economies leading the recovery and European economies lagging behind. Overall, only empirical studies at the macro level assess the beginning of the recovery phase. However, there are no substantial micro-level studies on factors affecting the recovery after the crisis. The main goal of this study is to characterize firm performance after the crisis (the recovery period), searching for factors affecting vulnerability, as well as factors of resilience. To do this, the paper assesses the impact of pre-crisis firm-level variables such as size, leverage, tangibility, and short-term debt, as well as sector and country characteristics such as trade sensitivity and devaluation during the crisis, on corporate performance in 2010. The results suggest that higher levels of pre-crisis leverage and short-term debt have negative effects on firms’ real sales growth in the recovery, whereas tangibility (defined as the ratio of
2 The world’s output in 2009 (year over year) decreased by 0.5 percent (in advanced economies, the collapse was around 3.5 percent), and the world trade volume declined by almost 12 percent. See International Monetary Fund (2011).
3 See International Monetary Fund (2011), and Lane and Milesi-Ferretti (2010).
4 At the macro level, Blanchard et al. (2010), and Cetorelli and Goldberg (2009) document evidence that countries more integrated with global financial markets suffered more during the crisis. At the micro level, Chor and Manova (2011) study the collapse of international trade flows during the crisis; they show that credit conditions were an important channel through which the crisis affected trade volumes, particularly for those sectors requiring external financing and with few collateralized assets. 5 This paper refers to the recovery as the state of the economy at the end of 2010 versus the global crisis episode (2008–09); the sample period exploited in this study. Note that the recovery appears to be weak, with additional global problems and more sluggish growth than initially expected.
4
fixed assets to total assets) has positive effects. The negative effect of leverage is non-linear, being particularly strong in firms with high pre-crisis leverage. The results also show that the macroeconomic framework critically matters for firm growth. In particular, firms in countries that allowed the exchange rate to depreciate during the crisis have had a faster recovery in sectors highly dependent on trade. These results are consistent with the theoretical literature on corporate behavior that studies how certain firm characteristics and financing decisions affect performance. One focus of this literature is firms’ use of leverage and collateral, and the effects of leverage and collateral on firm performance;6 and another is the dynamic relationship between firms’ growth, their size, and their financial decisions.7 The rest of the paper is organized as follows. Section 2 briefly summarizes the empirical approach as well as the main variables of interest. Section 3 presents the data and section 4 the descriptive statistics. Section 5 discusses the main results, a number of alternative specifications, and the robustness tests. Finally, section 6 concludes.
II. EMPIRICAL STRATEGY
The goal of this paper is to characterize corporate performance after the global crisis, searching for factors affecting resilience as well as vulnerability. In an environment of stressed credit conditions, firms may be affected by the higher cost of credit, particularly those that have high levels of leverage and short-term debt.8 On the other hand, firms that rely more on tangible assets may fare better as a result of their ability to pledge collateral in securing external financing (Braun, 2003; Claessens and Leaven, 2003). Therefore, to characterize corporate performance after the global crisis, the following ordinary least-squares (OLS) cross-sectional regression model is estimated:
mkjimkjimkjimkjmkji TangLevSizeGrowth ,,,3,,,2,,,1,,, (1)
mkjimkjimkji GrowthStdebt ,,,,,,5,,,4 09
The dependent variable mkjiGrowth ,,, represents the percentage change of real sales in 2010
with respect to 2009; subindices mkji ,,, stand for firm, sector, country and region,
respectively. Firm-level independent variables include mkjiSize ,,, (the natural log of total
6 For example, Kiyotaki and Moore (1997) and Bernanke et al. (1999) show how shocks can be amplified by credit restrictions. 7 For example, Cooley and Quadrini (1999) model heterogeneous and long-lived firms that solve a dynamic intertemporal optimization problem in which financial factors are crucial for growth.
8 See Chang and Velasco (1999), Furman and Stiglitz (1998), Radelet and Sachs (1998), and Sachs et al. (1996).
5
assets in millions of U.S. dollars), mkjiLev ,,, (leverage, the ratio of total liabilities to total
assets), mkjiTang ,,, (tangibility, the ratio of fixed assets, defined as gross property, plant, and
equipment less accumulated reserves for depreciation, depletion, and amortization, to total assets), and mkjiStdebt ,,, (the ratio of short-term debt and the portion of long-term debt
payable within one year to total debt). To minimize the problem of endogeneity, all the explanatory variables are measured as of 2007 (unless otherwise indicated), so their values are determined prior to both the crisis and the recovery. To account for the depth of the fall,
mkjiGrowth ,,,09 represents the percentage change in real sales in 2009 with respect to 2008.
To alleviate the problem of spurious results based on outliers, values above the 97.5th percentile and below the 2.5th percentile for each variable by country at the firm level are discarded. The next subsection describes the variables of interest in more detail.
A. Explanatory Variables
Consistent with the existing literature in the field, a set of firm-level variables that affect corporate performance are included: firm size, leverage, tangibility, and short-term debt.
Size The literature that assesses the impact of size in firm performance finds ambiguous effects. For example, Cooley and Quadrini (1999) develop a model in which smaller firms experience faster growth, higher rates of job creation and destruction, and lower survival rates. In this model heterogeneous and long-lived firms solve a dynamic intertemporal optimization problem in which financial factors are crucial for growth, job reallocation, and exit. The study links the patterns of firm growth with financial decisions (the optimal amount of debt). Still, larger firms tend to be older, more reputable, and have more collateral, all of which amounts to diminishing the risk of default and the corresponding costs. In addition, larger firms typically have better and more transparent accounting systems, an asset in the face of informational frictions vis-à-vis creditors.9
Leverage This variable may affect firms’ growth prospects in many ways.10 One would be that high leverage may reduce a firm’s ability to finance growth; for example, Bernanke, Gertler, and
9 See Gertler and Gilchrist (1994), Oliner and Rudebusch (1995), Kannan (2010), and Bebzuk and Galindo (2011).
10 As a variable of corporate financial choice, leverage could be potentially correlated with other firm characteristics.
6
Gilchrist (1994) develop a model in which an adverse shock may worsen financial conditions significantly, impairing firms’ access to credit. The resulting declines in spending or production exacerbate the economic downturn. Kiyotaki and Moore (1997) and Bernanke et al. (1994) demonstrate that leverage plays a crucial role in ability of the financial accelerator to magnify these negative shocks. Other studies focus on how the departure from optimal leverage affects productivity and growth. Coricelli, Driffield, Pal, and Roland (2009), based on a sample of emerging economies, find that leverage positively affect TFP growth but only below a certain level. Leverage beyond that level adversely affects growth.11 Tangibility On the importance of tangible collateral, Kiyotaki and Moore’s (1997) seminal paper develops a model on how credit constraints interact with aggregate economic activity in which durable assets play a dual role: as factors of production and as collateral for loans. The model assumes that borrowers cannot be forced to repay their debts and therefore, in equilibrium, lending occurs only if it is collateralized. This collateral requirement amplifies business cycle fluctuations. Borrowers’ credit limits are affected by the prices of their collateralized assets, and at the same time, these prices are affected by the size of their credit limits.12 This captures, among other things, firms’ ability to pledge collateral in securing external finance.13 In the particular context of a crisis, high levels of tangibility variable seem to be important for post-crisis performance, because in the presence of adverse selection, the posting of collateral reduces the cost of debt. For example, Braun and Larrain (2005) find that during crises, the impact of recessions is significantly larger among firms in those industries that rely less on hard assets. Short-Term Debt Ratio The “maturity mismatch” hypothesis states that capital market frictions and distortions may induce firms to take on debt with relatively short maturity. When these conditions change, these firms (unable to renew their debt) find it difficult to access the credit market again, generating adverse effects on investment and production.14 Consequently, it is expected that the short-term debt ratio has a negative impact on firm’s performance.
11 See also McConnell and Servaes (1995), Berger and di Patti (2003), and Driffield, Mahambare, and Pal (2007).
12 For a more extensive review of the literature on collateral and asset prices, see Kiyotaki and Moore (1995) and Gertler (1988).
13 See Braun (2003), and Claessens and Laeven (2003)
14 Empirical literature shows that excessive reliance on short-term debt may render an emerging market economy vulnerable to a financial panic. For example, see Chang and Velasco (1999), Furman and Stiglitz (1998), Radelet and Sachs (1998), and Sachs et al. (1996).
7
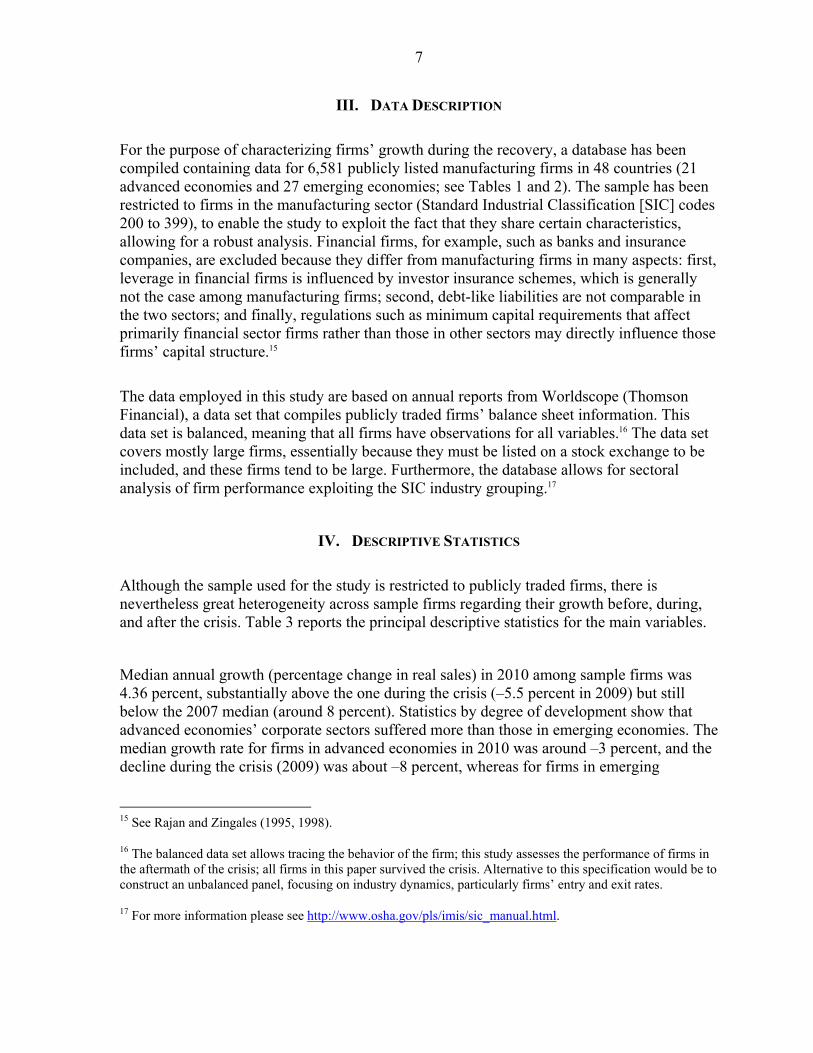
III. DATA DESCRIPTION
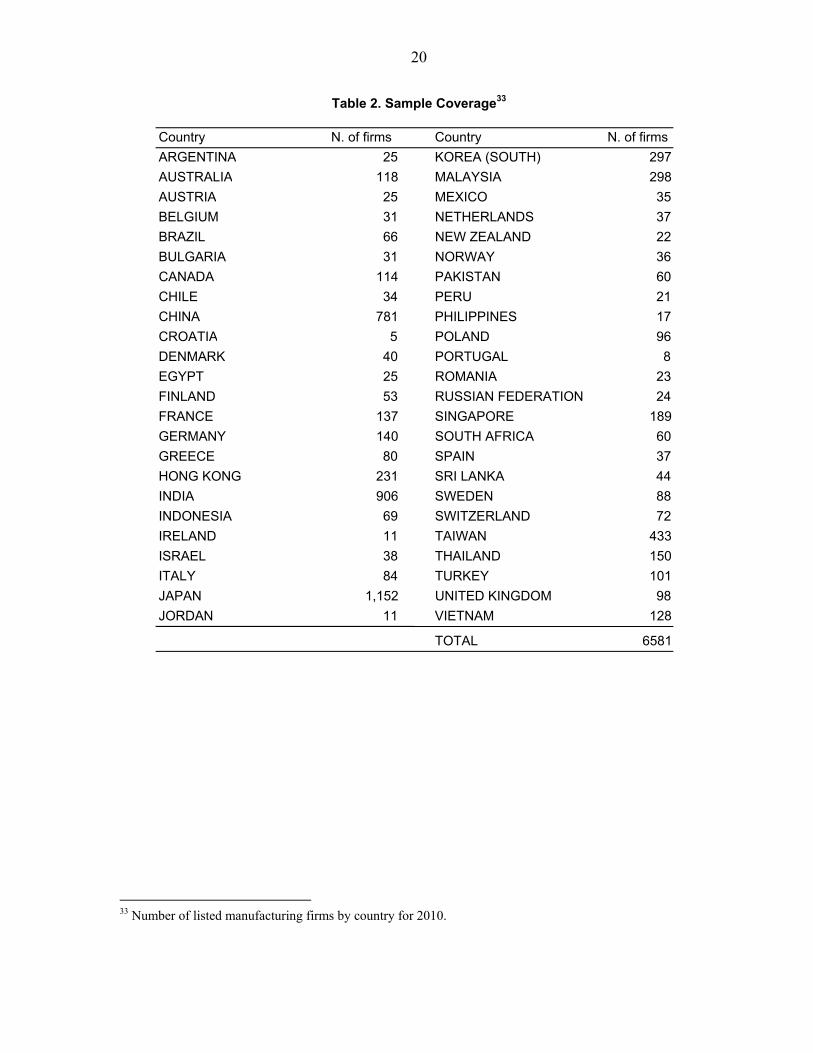
For the purpose of characterizing firms’ growth during the recovery, a database has been compiled containing data for 6,581 publicly listed manufacturing firms in 48 countries (21 advanced economies and 27 emerging economies; see Tables 1 and 2). The sample has been restricted to firms in the manufacturing sector (Standard Industrial Classification [SIC] codes 200 to 399), to enable the study to exploit the fact that they share certain characteristics, allowing for a robust analysis. Financial firms, for example, such as banks and insurance companies, are excluded because they differ from manufacturing firms in many aspects: first, leverage in financial firms is influenced by investor insurance schemes, which is generally not the case among manufacturing firms; second, debt-like liabilities are not comparable in the two sectors; and finally, regulations such as minimum capital requirements that affect primarily financial sector firms rather than those in other sectors may directly influence those firms’ capital structure.15
The data employed in this study are based on annual reports from Worldscope (Thomson Financial), a data set that compiles publicly traded firms’ balance sheet information. This data set is balanced, meaning that all firms have observations for all variables.16 The data set covers mostly large firms, essentially because they must be listed on a stock exchange to be included, and these firms tend to be large. Furthermore, the database allows for sectoral analysis of firm performance exploiting the SIC industry grouping.17
IV. DESCRIPTIVE STATISTICS
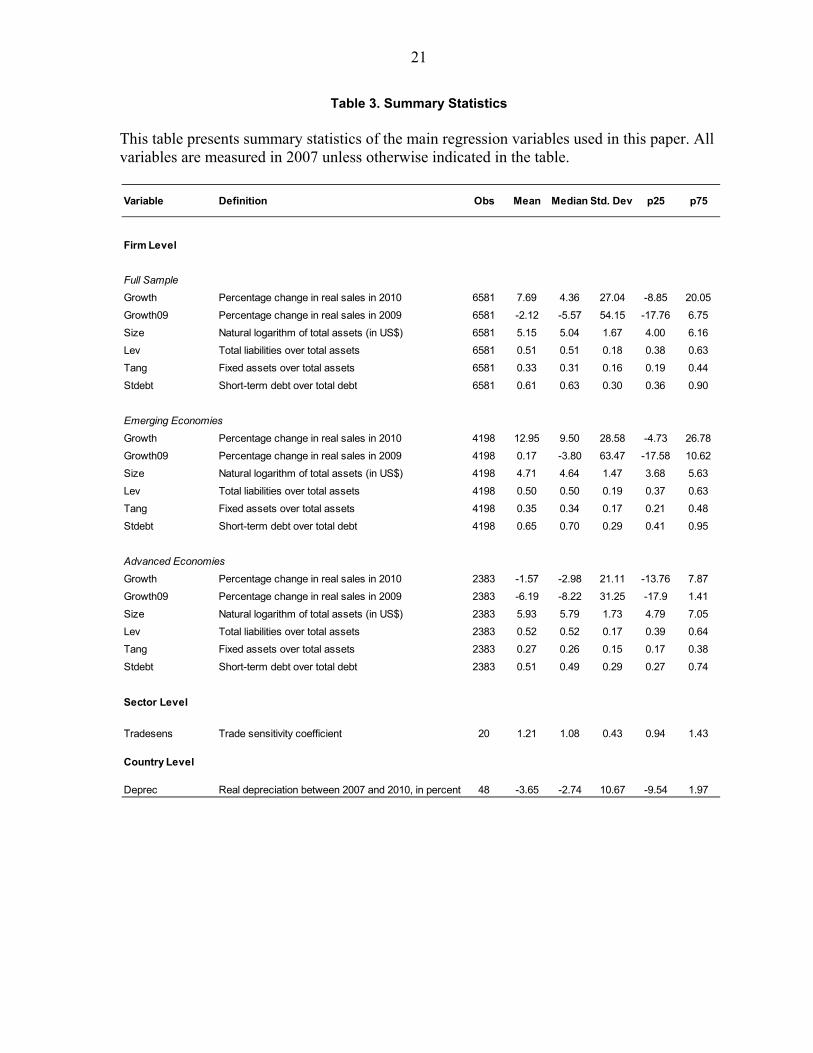
Although the sample used for the study is restricted to publicly traded firms, there is nevertheless great heterogeneity across sample firms regarding their growth before, during, and after the crisis. Table 3 reports the principal descriptive statistics for the main variables.
Median annual growth (percentage change in real sales) in 2010 among sample firms was 4.36 percent, substantially above the one during the crisis (–5.5 percent in 2009) but still below the 2007 median (around 8 percent). Statistics by degree of development show that advanced economies’ corporate sectors suffered more than those in emerging economies. The median growth rate for firms in advanced economies in 2010 was around –3 percent, and the decline during the crisis (2009) was about –8 percent, whereas for firms in emerging
15 See Rajan and Zingales (1995, 1998).
16 The balanced data set allows tracing the behavior of the firm; this study assesses the performance of firms in the aftermath of the crisis; all firms in this paper survived the crisis. Alternative to this specification would be to construct an unbalanced panel, focusing on industry dynamics, particularly firms’ entry and exit rates.
17 For more information please see http://www.osha.gov/pls/imis/sic_manual.html.
8
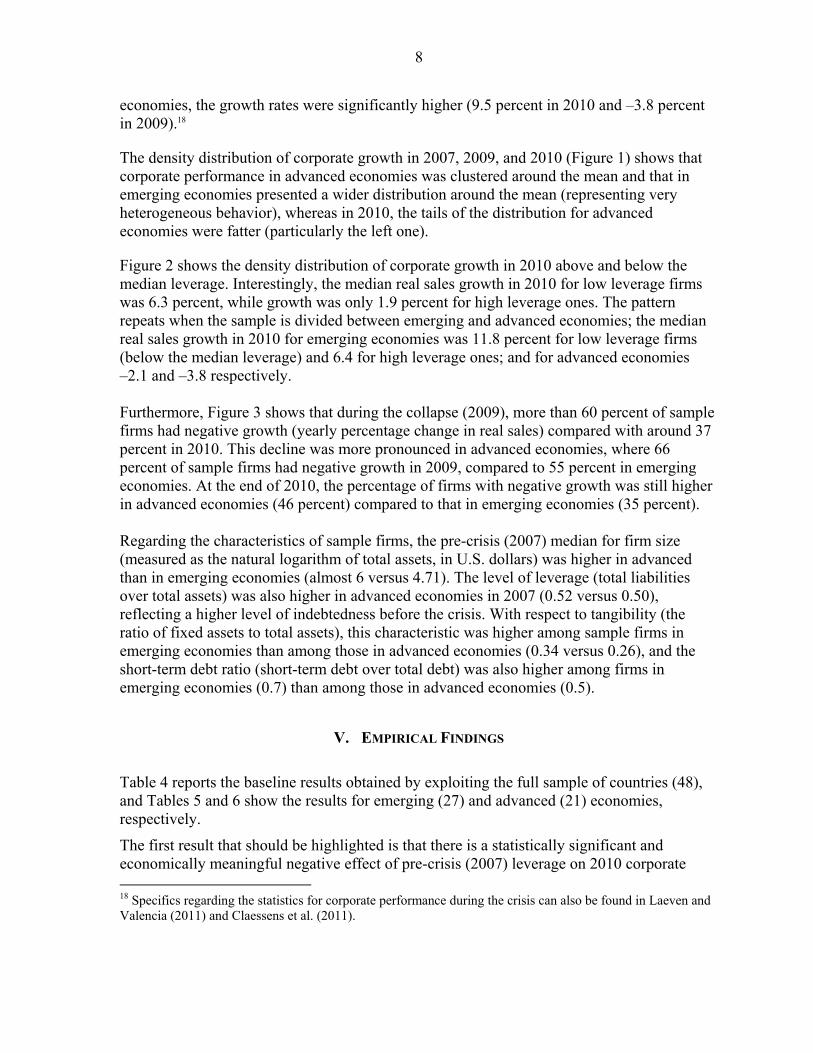
economies, the growth rates were significantly higher (9.5 percent in 2010 and –3.8 percent in 2009).18
The density distribution of corporate growth in 2007, 2009, and 2010 (Figure 1) shows that corporate performance in advanced economies was clustered around the mean and that in emerging economies presented a wider distribution around the mean (representing very heterogeneous behavior), whereas in 2010, the tails of the distribution for advanced economies were fatter (particularly the left one).
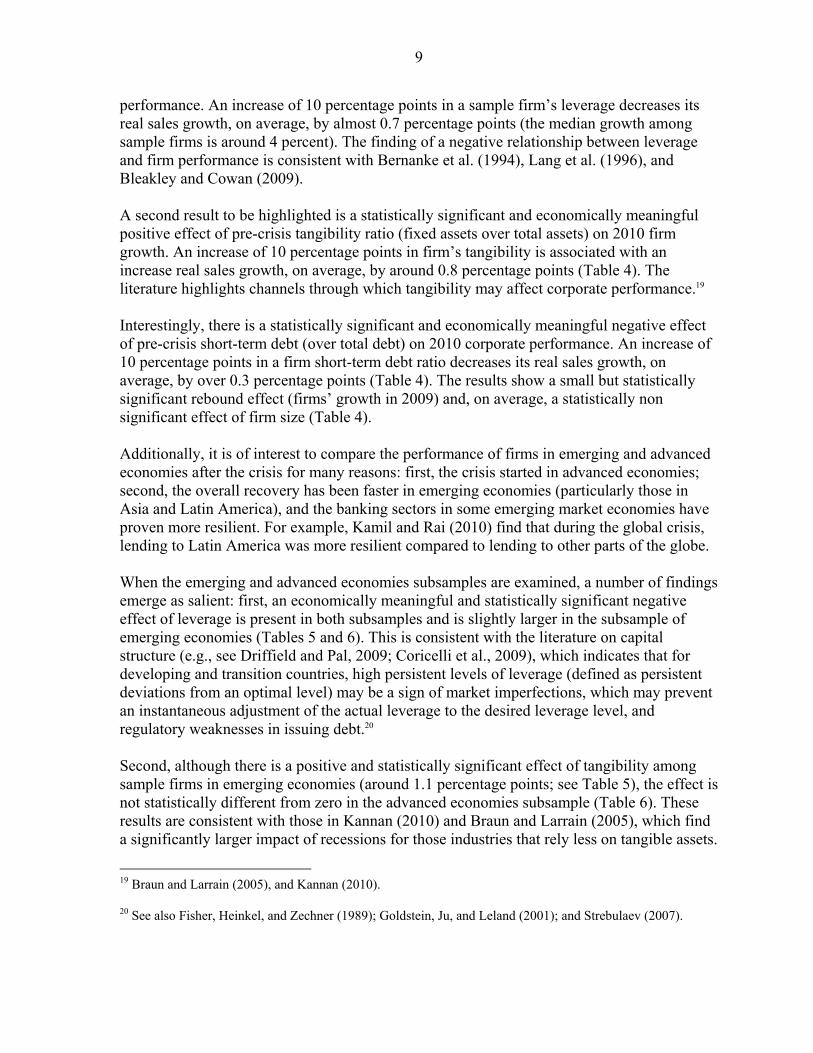
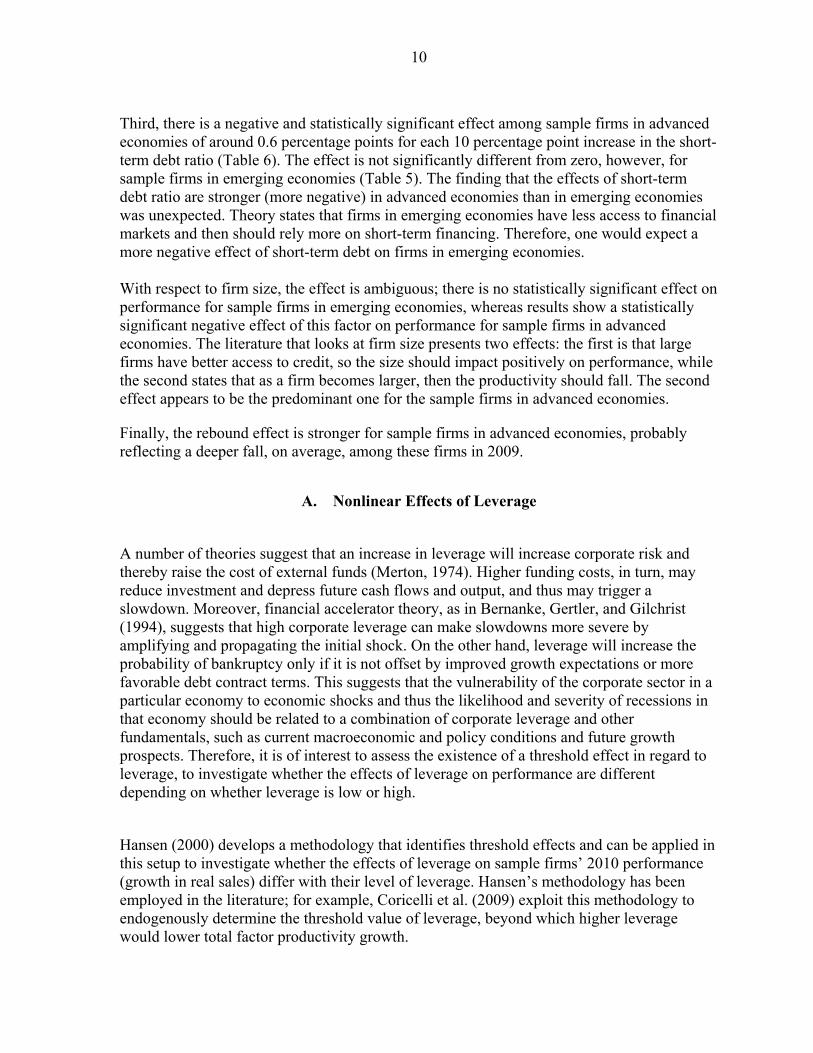
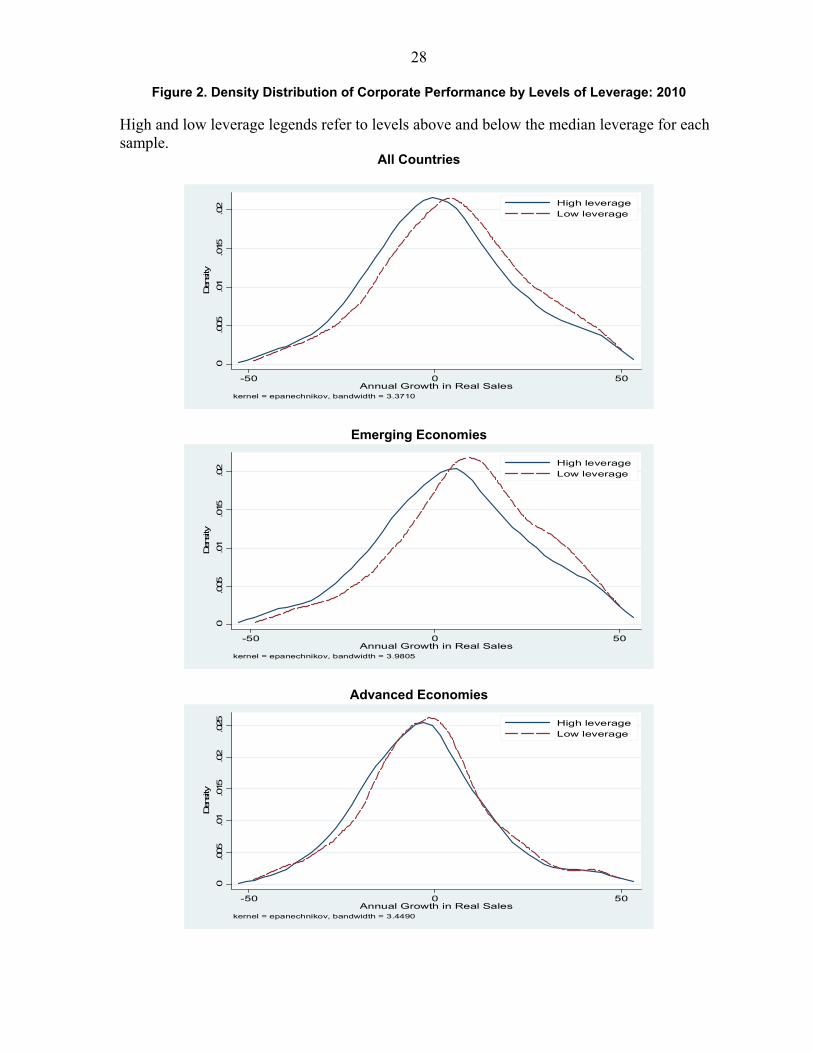
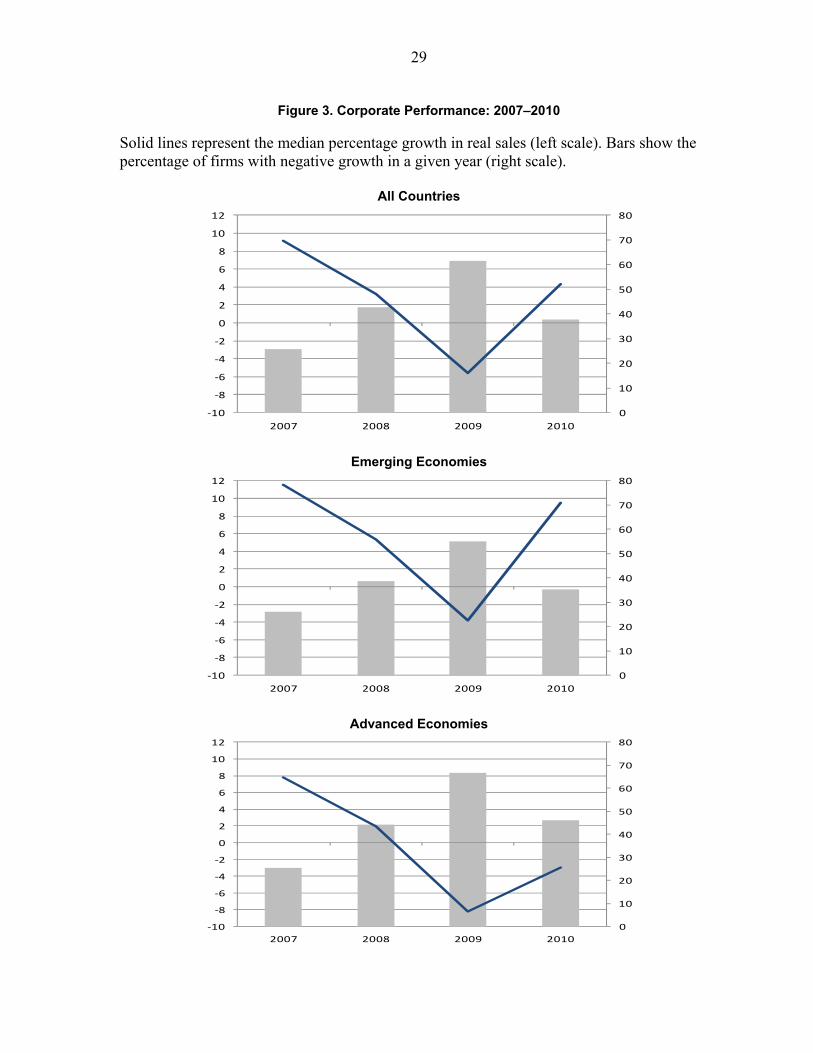
Figure 2 shows the density distribution of corporate growth in 2010 above and below the median leverage. Interestingly, the median real sales growth in 2010 for low leverage firms was 6.3 percent, while growth was only 1.9 percent for high leverage ones. The pattern repeats when the sample is divided between emerging and advanced economies; the median real sales growth in 2010 for emerging economies was 11.8 percent for low leverage firms (below the median leverage) and 6.4 for high leverage ones; and for advanced economies –2.1 and –3.8 respectively. Furthermore, Figure 3 shows that during the collapse (2009), more than 60 percent of sample firms had negative growth (yearly percentage change in real sales) compared with around 37 percent in 2010. This decline was more pronounced in advanced economies, where 66 percent of sample firms had negative growth in 2009, compared to 55 percent in emerging economies. At the end of 2010, the percentage of firms with negative growth was still higher in advanced economies (46 percent) compared to that in emerging economies (35 percent). Regarding the characteristics of sample firms, the pre-crisis (2007) median for firm size (measured as the natural logarithm of total assets, in U.S. dollars) was higher in advanced than in emerging economies (almost 6 versus 4.71). The level of leverage (total liabilities over total assets) was also higher in advanced economies in 2007 (0.52 versus 0.50), reflecting a higher level of indebtedness before the crisis. With respect to tangibility (the ratio of fixed assets to total assets), this characteristic was higher among sample firms in emerging economies than among those in advanced economies (0.34 versus 0.26), and the short-term debt ratio (short-term debt over total debt) was also higher among firms in emerging economies (0.7) than among those in advanced economies (0.5).
V. EMPIRICAL FINDINGS
Table 4 reports the baseline results obtained by exploiting the full sample of countries (48), and Tables 5 and 6 show the results for emerging (27) and advanced (21) economies, respectively.
The first result that should be highlighted is that there is a statistically significant and economically meaningful negative effect of pre-crisis (2007) leverage on 2010 corporate 18 Specifics regarding the statistics for corporate performance during the crisis can also be found in Laeven and Valencia (2011) and Claessens et al. (2011).
9
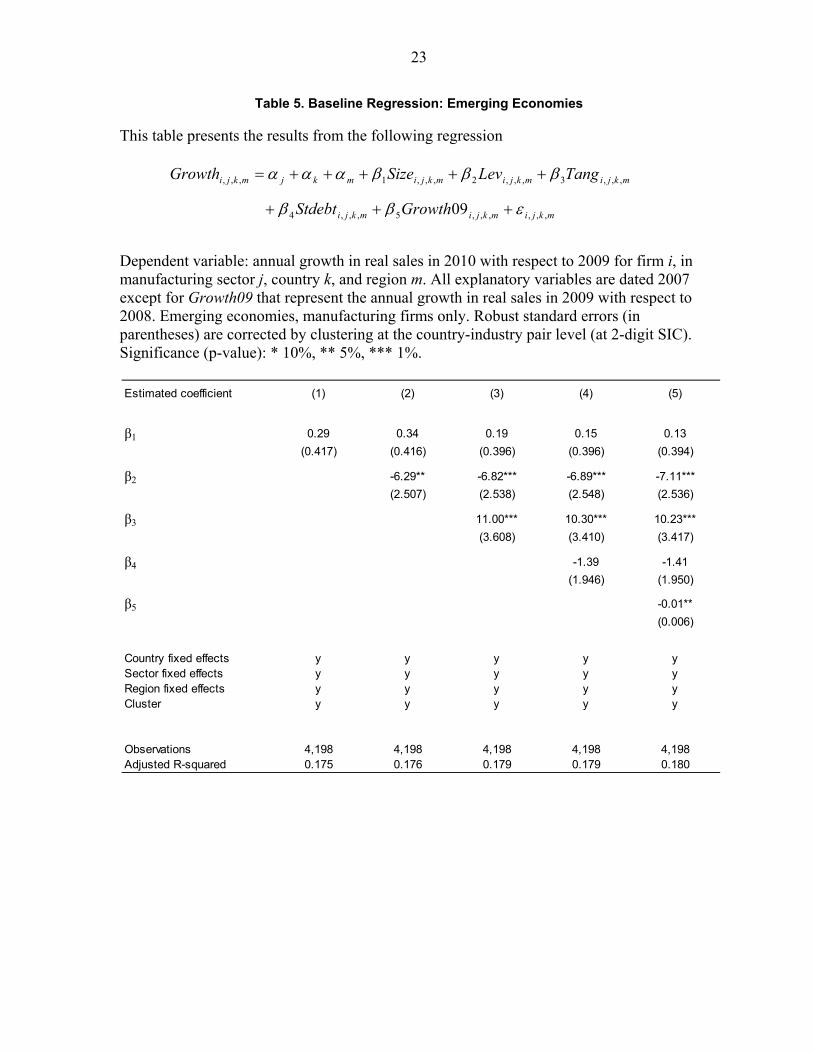
performance. An increase of 10 percentage points in a sample firm’s leverage decreases its real sales growth, on average, by almost 0.7 percentage points (the median growth among sample firms is around 4 percent). The finding of a negative relationship between leverage and firm performance is consistent with Bernanke et al. (1994), Lang et al. (1996), and Bleakley and Cowan (2009). A second result to be highlighted is a statistically significant and economically meaningful positive effect of pre-crisis tangibility ratio (fixed assets over total assets) on 2010 firm growth. An increase of 10 percentage points in firm’s tangibility is associated with an increase real sales growth, on average, by around 0.8 percentage points (Table 4). The literature highlights channels through which tangibility may affect corporate performance.19 Interestingly, there is a statistically significant and economically meaningful negative effect of pre-crisis short-term debt (over total debt) on 2010 corporate performance. An increase of 10 percentage points in a firm short-term debt ratio decreases its real sales growth, on average, by over 0.3 percentage points (Table 4). The results show a small but statistically significant rebound effect (firms’ growth in 2009) and, on average, a statistically non significant effect of firm size (Table 4). Additionally, it is of interest to compare the performance of firms in emerging and advanced economies after the crisis for many reasons: first, the crisis started in advanced economies; second, the overall recovery has been faster in emerging economies (particularly those in Asia and Latin America), and the banking sectors in some emerging market economies have proven more resilient. For example, Kamil and Rai (2010) find that during the global crisis, lending to Latin America was more resilient compared to lending to other parts of the globe. When the emerging and advanced economies subsamples are examined, a number of findings emerge as salient: first, an economically meaningful and statistically significant negative effect of leverage is present in both subsamples and is slightly larger in the subsample of emerging economies (Tables 5 and 6). This is consistent with the literature on capital structure (e.g., see Driffield and Pal, 2009; Coricelli et al., 2009), which indicates that for developing and transition countries, high persistent levels of leverage (defined as persistent deviations from an optimal level) may be a sign of market imperfections, which may prevent an instantaneous adjustment of the actual leverage to the desired leverage level, and regulatory weaknesses in issuing debt.20 Second, although there is a positive and statistically significant effect of tangibility among sample firms in emerging economies (around 1.1 percentage points; see Table 5), the effect is not statistically different from zero in the advanced economies subsample (Table 6). These results are consistent with those in Kannan (2010) and Braun and Larrain (2005), which find a significantly larger impact of recessions for those industries that rely less on tangible assets.
19 Braun and Larrain (2005), and Kannan (2010).
20 See also Fisher, Heinkel, and Zechner (1989); Goldstein, Ju, and Leland (2001); and Strebulaev (2007).
10
Third, there is a negative and statistically significant effect among sample firms in advanced economies of around 0.6 percentage points for each 10 percentage point increase in the short-term debt ratio (Table 6). The effect is not significantly different from zero, however, for sample firms in emerging economies (Table 5). The finding that the effects of short-term debt ratio are stronger (more negative) in advanced economies than in emerging economies was unexpected. Theory states that firms in emerging economies have less access to financial markets and then should rely more on short-term financing. Therefore, one would expect a more negative effect of short-term debt on firms in emerging economies. With respect to firm size, the effect is ambiguous; there is no statistically significant effect on performance for sample firms in emerging economies, whereas results show a statistically significant negative effect of this factor on performance for sample firms in advanced economies. The literature that looks at firm size presents two effects: the first is that large firms have better access to credit, so the size should impact positively on performance, while the second states that as a firm becomes larger, then the productivity should fall. The second effect appears to be the predominant one for the sample firms in advanced economies.
Finally, the rebound effect is stronger for sample firms in advanced economies, probably reflecting a deeper fall, on average, among these firms in 2009.
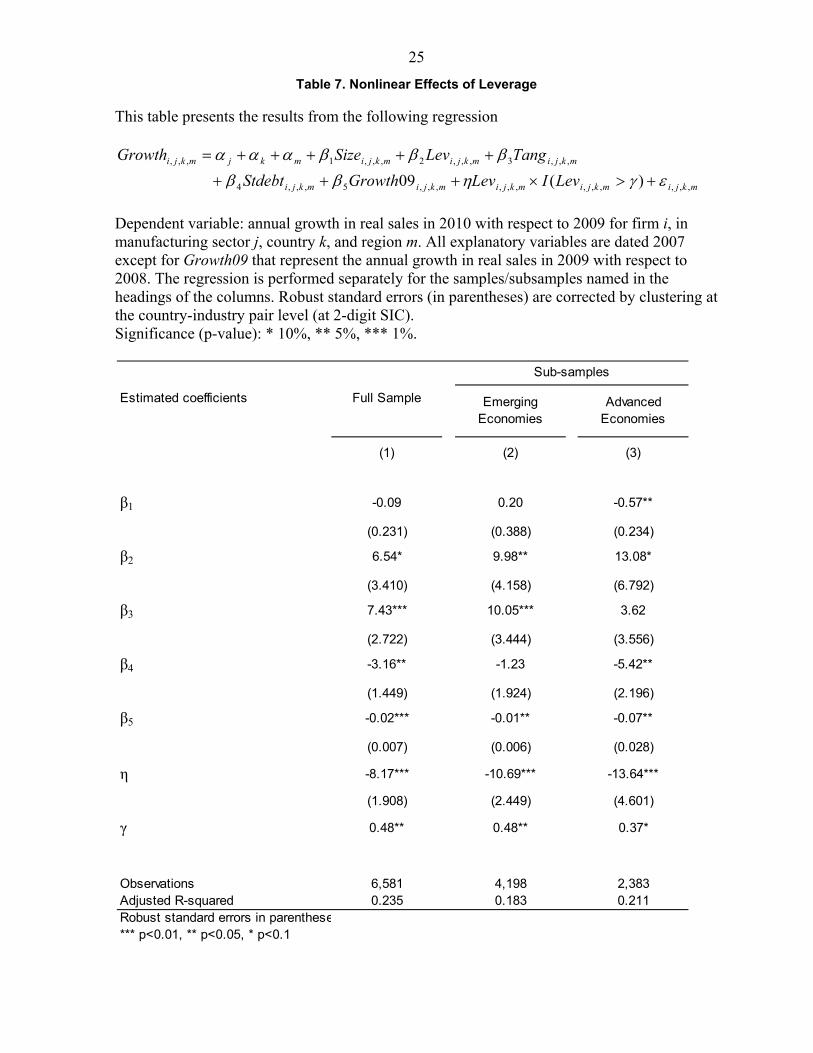
A. Nonlinear Effects of Leverage
A number of theories suggest that an increase in leverage will increase corporate risk and thereby raise the cost of external funds (Merton, 1974). Higher funding costs, in turn, may reduce investment and depress future cash flows and output, and thus may trigger a slowdown. Moreover, financial accelerator theory, as in Bernanke, Gertler, and Gilchrist (1994), suggests that high corporate leverage can make slowdowns more severe by amplifying and propagating the initial shock. On the other hand, leverage will increase the probability of bankruptcy only if it is not offset by improved growth expectations or more favorable debt contract terms. This suggests that the vulnerability of the corporate sector in a particular economy to economic shocks and thus the likelihood and severity of recessions in that economy should be related to a combination of corporate leverage and other fundamentals, such as current macroeconomic and policy conditions and future growth prospects. Therefore, it is of interest to assess the existence of a threshold effect in regard to leverage, to investigate whether the effects of leverage on performance are different depending on whether leverage is low or high.
Hansen (2000) develops a methodology that identifies threshold effects and can be applied in this setup to investigate whether the effects of leverage on sample firms’ 2010 performance (growth in real sales) differ with their level of leverage. Hansen’s methodology has been employed in the literature; for example, Coricelli et al. (2009) exploit this methodology to endogenously determine the threshold value of leverage, beyond which higher leverage would lower total factor productivity growth.
11
The general threshold regression model, following Hansen (2000), takes the subsequent form:
titititititittiti eqIXqIXZY ,,,2,,1,,, )()(
)2(
where tiY , is the dependent variable,
tiZ , a vector of control variables, tiX , a vector of
regressors, and tiq , a threshold variable. The observations are divided into two regimes by the
indicator function (.)I . These regimes are distinguished by differing regression slopes 1 and
2 depending on whether the threshold variable is smaller or larger than the threshold ; this is the value that needs to be estimated. For the purposes of this study, the threshold regression model takes the following form:
mkjimkjimkjimkjimkjmkji StdebtTangLevSizeGrowth ,,,4,,,3,,,2,,,1,,, (3)
mkjimkjimkjimkji LevILevGrowth ,,,,,,,,,,,,5 )(09
This is a special case of the threshold regression in which the variable in question (leverage) serves as it own threshold variable.21 The rest of the variables employed are the same as in equation (1). In an OLS model with fixed effects, can be estimated through a grid search procedure, picking the value that maximizes the log-likelihood function. With threshold value thus
determined, one can test 0:0 H , using the likelihood-ratio test. The p-values have to be
constructed using the bootstrap method, since the likelihood ratio test statistic has a nonstandard distribution.22 In this particular case the grid search is conducted over the 0.30–0.95 leverage interval (median leverage is 0.51), and the threshold value identified is 0.483 for the full sample. Then, using the bootstrap sample, the model under the null and alternate is estimated, as well as the likelihood ratio statistic F. This procedure is repeated many times, and the percentage of draws for which the simulated statistic exceeds the actual is calculated.23 The null of no threshold is rejected at the standard critical values.
21 Alternative specifications can be explored to assess for threshold effects. For example, adding to the baseline equation the squared values of leverage.
22 Since, under the null hypothesis, the threshold is not identified, the classical test statistic has nonstandard distribution and requires bootstrap estimation (Hansen, 2000).
23 For robustness 100, 300, 500, and 1,000 bootstrap replications have been used.
12
Table 7 reports the results of this specification—column (1) for the full sample of countries, column (2) for emerging market economies, and column (3) for the advanced economies. The results show that for leverage beyond 0.48 (full sample), an increase of leverage of ten percent is associated with a statistically significant decrease in real sales of 0.1 percentage points.24 These results are consistent with the literature.25
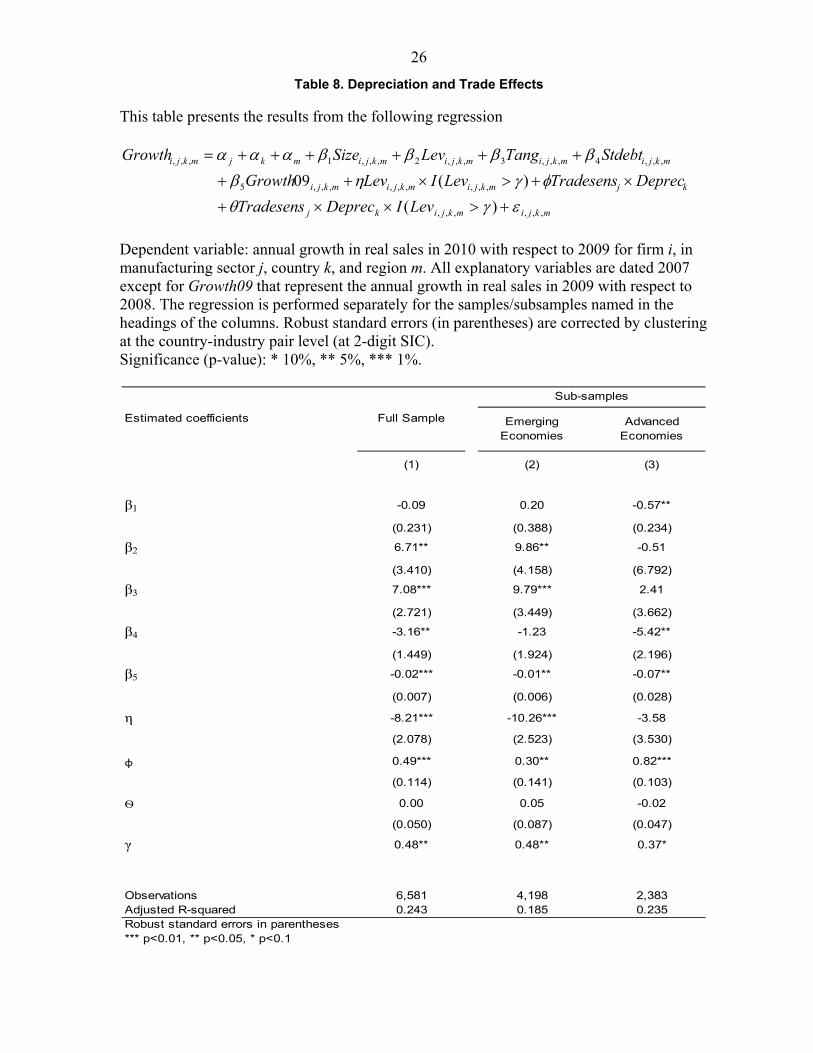
B. Robustness Tests: Trade Sensitivity and Real Depreciation Effects
This subsection focuses on the effects of the depreciations that occurred during the global crisis on the 2010 performance of sample firms. Theories of exchange rate regimes describe the channels through which the exchange rate may affect a firm’s performance, through both a liability effect and a competitiveness effect. On the liability side, exchange rate movements in an economy may have large valuation effects (e.g., see Agénor and Montiel, 2008), depending on the currency structure of indebtedness of the firms in the economy. In a scenario in which domestic firms are highly indebted in foreign currency whereas their assets are denominated in local currency, an exchange rate depreciation would increase the domestic-currency value of firms’ foreign liabilities and reduce their own net worth, thereby raising borrowing costs and triggering a contraction in investment and output.26 On the other hand, exchange rate movements (particularly depreciation) can affect (improve) the competitiveness of firms that produce goods domestically but sell them abroad, especially those firms in which factors of production such as wages are denominated in local currency. Countries subject to fixed exchange rate arrangements have had greater difficulties during the recovery phase from the 2007–09 crisis; 27 for the sample of 48 countries in this study, countries with fixed exchange rate regimes grew in real terms on average –3.5 percent in 2009 and around 2 percent in 2010, whereas countries with flexible exchange rate regimes
24 The credit crunch that occurred during the crisis generated many types of problems; one was the inability of firms to roll over debt, especially those firms that were highly leveraged. Therefore, it is of interest to assess the effects of short-term debt on highly leveraged firms (those with leverage above the threshold). The results show that there is no statistically significant effect of short-term debt once controlling for the nonlinearity in leverage. 25 For example, Coricelli et al. (2009), based primarily on firm-level data from a group of central and eastern European transition countries, endogenously determine the threshold value of leverage, beyond which an increase in leverage would lower total factor productivity of firms’ growth, even after controlling for different firm-level and institutional characteristics. 26 Similar results are derived by Cook (2004) in a setup in which firms finance capital accumulation by issuing foreign-currency debt.
27 Berkmen et al. (2009) and Blanchard, Faruqee, and Das (2010) both report that countries with pegged exchange rates suffered deeper output collapses even after a range of other economic and financial variables are controlled for.
13
grew in real terms on average –0.6 percent and 5.4 percent, respectively, in those same two years.28 Therefore, one would expect, depending on the liability and competitiveness effects, that those firms in sectors sensitive to trade would indeed perform better (if the competitiveness effect dominates the liability one) after a real depreciation than other firms.29 To assess this effect, this subsection exploits regression (1) and adds a term interacting a sector-level measure of trade dependence (trade sensitivity) with a measure of real depreciation during the crisis, using the percentage change in the real effective exchange rate (REER) during 2007 and 2010:
mkjimkjimkjimkjimkjmkji StdebtTangLevSizeGrowth ,,,4,,,3,,,2,,,1,,, (4)
kjmkjimkjimkji DeprecTradesensLevILevGrowth )(09 ,,,,,,,,,5 mkjimkjikj LevIDeprecTradesens ,,,,,, )(
Real depreciation is accounted for by exploiting the change in the REER,30 an average of the bilateral real exchange rates between the country and each of its trading partners, weighted by the respective trade shares of each partner. Following the methodology used in Claessens et al. (2011), the trade sensitivity measure at sector level is constructed, by regressing (OLS) the change in global exports (in U.S. dollars) at the 2-digit SIC level (20 manufacturing sectors) over the period 2000-06 on the change in global GDP (in U.S. dollars)
tjjtj GlobalGDPrtsGlobalExpo , (5)
The coefficients )( sj obtained are then used as the sector-level degree of trade sensitivity.
The data on global GDP (in U.S. dollars) was obtained from the IMF, World Economic Outlook database, and the data on global exports (in U.S. dollars) at a 2-digit SIC level was obtained from the United Nations Commodity Trade Statistics Database (UN COMTRADE) found in the World Integrated Trade Solution (WITS). Table 8 reports the result of this specification—column (1) for the full sample of countries, column (2) for emerging market economies, and column (3) for advanced economies. Results
28 Author’s calculations based on International Monetary Fund, International Financial Statistics.
29 For example, Baggs et al. (2008), in a study for Canada, find that real appreciations reduce the probability of firm survival, firm sales, and firm profitability, whereas depreciations have the opposite effect.
30 In this case, an increase means depreciation.
14
show a consistent positive and statistically significant effect of the interaction between real depreciation and the trade sensitivity coefficient for the whole sample and both subsamples; a 1 percent depreciation in the real effective exchange rate generates an increase of 0.5 percent in the real sales growth (recall that the median growth is 4.36 percent) for the full sample for the firms in sectors more opened to trade; this effect is even stronger in advanced economies (around 0.8) and it does not differ for highly leveraged firms. These results highlights that, in this particular exercise, the competitiveness effect overpowers the liability effect. Other robustness tests were also performed in this paper. This study establishes comparisons to the pre-crisis period by using the year 2007. One might argue that, for some countries—for example, the United States—2007 was already a year of financial distress. Even though this study does not include the United States, it is nevertheless interesting, for robustness purposes, to assess whether the results of the study hold if 2006, rather than 2007, is used as the pre-crisis year. As it turns out, the results when 2006 is used as the pre-crisis year (not shown) are consistent with those obtained when 2007 is used. Furthermore, the results are consistent with the use of alternative measures of leverage (total debt over total assets) and performance (EBITDA).31 Additionally, other specifications were tested allowing for non-linearity of the other explanatory variables, finding non statically significant results.
VI. CONCLUSION
Although the 2007 crisis started in just a few developed countries, the ensuing global recession spread rapidly to developing countries through financial and trade channels. The original shock in the U.S. financial system led to the disruption of the financial systems of several advanced European economies and others around the world. Gradually, this shock was transmitted to the real economy, with the financial crisis inducing an exceptionalcontraction in economic activity, trade, and international capital flows. In turn, the corporate sector responded to these shocks.
This paper is one of the first to examine firms’ recovery after the crisis using micro-level data for a broad sample of emerging and advanced economies. Applying a well-established methodological framework, this study finds evidence that firm-specific characteristics such as size, leverage, tangibility, and short-term debt ratio have indeed had an impact on post-crisis firm performance. Furthermore, the study finds evidence that leverage has a strong nonlinear negative effect on firm performance. Additionally, the results show that macroeconomic policy matters for firm growth. In particular, in countries that have allowed their exchange rate to depreciate, firms have had a faster recovery in sectors highly dependent on trade.
31 EBITDA is a standard measure of performance; the name stands for “earnings before interest, taxes, depreciation, and amortization.”
15
References
Agénor, P., and P. Montiel, 2008, Development Macroeconomics, Third Edition, Princeton University Press.
Baggs, J., Beaulieu, E. and Fung, L.,2010, “Are Service Firms Affected By Exchange Rate Movements?” Review of Income and Wealth, 56: S156–S176.
Berger, A and E. B. di Patti, 2003,“Capital Structure and Firm Performance: A New Approach to Testing Agency Theory and an Application to the Banking Industry,” FEDS Working Paper No. 2002–54.
Berkmen, P., G. Gelos, R. Rennhack, and J. Walsh, 2009, “The Global Financial Crisis: Explaining Cross-country Differences in the Output Impact.” IMF Working Paper WP/09/280, International Monetary Fund, Washington, DC.
Bernanke B., M. Gertler and S. G. Gilchrist, 1994, "The Financial Accelerator and the Flight to Quality," Finance and Economics Discussion Series 94–18, Board of Governors of the Federal Reserve System (U.S.).
Bernanke, B. S. & Gertler, M. & Gilchrist, S., 1999. "The Financial Accelerator in a Quantitative Business Cycle Framework," in: J. B. Taylor & M. Woodford (eds.), Handbook of Macroeconomics, edition 1, volume 1, chapter 21, pages 1341–1393 Elsevier.
Blanchard, O., H. Faruqee, and M. Das. 2010. “The Initial Impact of the Crisis on Emerging Market Countries.” Brookings Papers on Economic Activity. Brookings Institution, Washington, DC.
Bleakley H., and K. Cowan, 2009, “Maturity Mismatch and Financial Crises: Evidence from Emerging Market Corporations,” Journal of Development Economics.
Braun, M., 2003,“Financial Contractibility and Asset Hardness,” University of California-Los Angeles, mimeo.
Braun, M., and B. Larrain, 2005, “Finance and the Business Cycle: International, Inter-Industry Evidence,” Journal of Finance, 60(3), pp. 1097–1128.
Chang, R. and A. Velasco, 1999, “Illiquidity and Crises in Emerging Markets: Theory and Policy,” NBER Macroeconomics Annual, 1999.
Chor, Davin and Kalina Manova, 2011, “Off the Cliff and Back: Credit Conditions and International Trade During the Global Financial Crisis,” Journal of International
16
Economics (forthcoming). NBER Working Paper 16174. Featured in The NBER Digest, December 2010.
Claessens, S., and Laeven, L., 2003, “Financial Development, Property Rights, and Growth,” Journal of Finance 58, pp. 2401–2436.
Claessens, S., H. Tong, and S.-J. Wei, 2012, “From the Financial Crisis to the Real Economy: Using Firm-level Data to Identify Transmission Channels,” Journal of International Economics, Available online 8 March 2012.
Cook, D., 2004, “Monetary Policy in Emerging Markets: Can Liability Dollarization Explain Contractionary Devaluation?” Journal of Monetary Economics 51 (September) pp.1155–81.
Cooley, T. F. and V. Quadrini, 1999, “Financial Markets and Firm Dynamics,” NYU Working Paper No. S-MF-99–09.
Cetorelli, N., and L. S. Goldberg, 2009, “Global Banks and International Shock Transmission: Evidence from the Crisis,” Federal Reserve Bank of New York Working Paper.
Coricelli, F., Driffield, N. L., Pal, S., and Roland, I., 2009, “Excess Leverage and Productivity Growth in Emerging Economies: Is There a Threshold Effect?” IZA Discussion Paper No. 4834.
Driffield, N.L., V. Mahambare and S. Pal, 2007, “How Does Ownership Structure Affects Capital Structure and Firm Value? Recent Evidence from East Asia,” Economics of Transition 15(3).
Fischer, E. O., Heinkel, R., Zechner, J., 1989, “Dynamic Capital Structure Choice: Theory and Tests,” Journal of Finance, 44, pp. 19–40.
Furman, J. and J.E. Stiglitz, 1998, “Economic Crises: Evidence and Insights from East Asia," Brookings Papers on Economic Activity 1998:2, Washington D.C.
Gertler, M., 1988, ‘‘Financial Structure and Aggregate Economic Activity: An Overview.’’ J. Money, Credit and Banking 20, pp.559–88.
Gertler, M., and S. Gilchrist, 1994, “Monetary Policy, Business Cycles, and the Behavior of Small Manufacturing Firms,” The Quarterly Journal of Economics, 109(2), pp. 309-340.
17
Goldstein, R., N. Ju and H. Leland, 2001, “An EBIT based Model of Dynamic Capital Structure”, Journal of Business, 74(4).
Hansen, B. E., 2000, “Sample Splitting and Threshold Estimation,” Econometrica, Vol. 68, pp. 575–603.
Huynh K., and R. Petrunia, 2010, “Age Effects, Leverage and Firm Growth,” Journal of Economic Dynamics & Control, 34, pp. 1003–1013.
International Monetary Fund, World Economic Outlook (WEO), Rebalancing Growth, April 2010.
International Monetary Fund, World Economic Outlook (WEO), Tensions from the Two-Speed Recovery: Unemployment, Commodities, and Capital Flows, April 2011.
Kannan P., 2010, “Credit Conditions and Recoveries from Recessions Associated with Financial Crises,” IMF Working Paper 10/83. Washington: International Monetary Fund.
Kamil H., and K. Rai, 2010, “The Global Credit Crunch and Foreign Banks Lending to Emerging Markets: Why Did Latin America Fare Better?” IMF Working Paper 10/102. Washington: International Monetary Fund.
Kiyotaki, N., and Moore, J., 1995, ‘Credit Cycles, Discussion Paper No. TE/95/285. London: London School Econ., Suntory-Toyota Internat. Centre Econ. and Related Disciplines, 1995; Working Paper no. 5083. Cambridge, Mass.: NBER, April 1995.
Kiyotaki, N. and Moore, J., 1997, "Credit Cycles,” Journal of Political Economy 105 (2): pp. 211–248.
Laeven L., and F. Valencia, 2011, “The Real Effects of Financial Sector Interventions During Crises,” IMF Working Paper 11/45. Washington: International Monetary Fund.
Lane, P. R., and G. M. Milesi-Ferreti, 2007, “The External Wealth of Nations Mark II,” Journal of International Economics 73 No. 2 (November), pp. 223–250.
Lang, L.E., Ofek, E., Stulz, R., 1996, “Leverage, Investment and Firm Growth,” Journal of Financial Economics, No. 40, pp. 3–29.
McConnell, J. J., and H. Servaes, 1995, “Equity Ownership and the Two Faces of Debt,” Journal of Financial Economics 39, pp. 131–157.
18
Merton, R. C., 1974, "On the Pricing of Corporate Debt: The Risk Structure of Interest Rates", Journal of Finance, Vol. 29, No. 2, (May 1974), pp. 449–470.
Oliner, S. D., and G. D. Rudebusch, 1995, “Is There a Bank Lending Channel for Monetary Policy?,” Economic Review, pp. 1–20.
Radelet, S. and J. D. Sachs, 1998, “The East Asian Financial Crisis: Diagnosis, Remedies, Prospects," Brookings Papers on Economic Activity (1): pp. 1–74.
Rajan, R., and L. Zingales, 1995, “What Do We Know About Capital Structure: Some Evidence From International Data,” Journal of Finance, December 1995, 50 (5), pp. 1421–60.
Rajan, R., and L. Zingales, 1998, “Financial Dependence and Growth,” American Economic Review, Vol. 88(3), pp. 559–86.
Sachs, J., A. Tornell, and A. Velasco, 1996, “The Collapse of the Mexican Peso: What Have We Learned?" Economic Policy, 46:13–63, April.
Strebulaev, I., 2007, “Do Tests of Capital Structure Theory Mean What They Say?” Journal of Finance 62, pp. 1747–1788.

19
Table 1. Country and Region Coverage32
32 To split the sample of countries between developed and developing, this paper follows Milesi-Ferretti and Tille (2010), Appendix A.
Americas (5) Asia (13) Europe (7) Middle East and Africa (3)
Argentina China Bulgaria Egypt
Brazil Hong Kong Croatia Jordan
Chile India Israel South Africa
Mexico Indonesia Poland
Peru Malaysia Romania
Pakistan Russian Federation
Philippines Turkey
Singapore
South Korea
Sri Lanka
Taiwan
Thailand
Vietnam
Americas (1) Asia (3) Europe (16) Middle East and Africa
Canada Australia Austria
Japan Belgium
New Zealand Denmark
Finland
France
Germany
Greece
Ireland
Italy
Netherlands
Norway
Portugal
Spain
Sweden
Switzerland
United Kingdom
Emerging (28)
Developed (20)
20
Table 2. Sample Coverage33
33 Number of listed manufacturing firms by country for 2010.
Country N. of firms Country N. of firms
ARGENTINA 25 KOREA (SOUTH) 297
AUSTRALIA 118 MALAYSIA 298
AUSTRIA 25 MEXICO 35
BELGIUM 31 NETHERLANDS 37
BRAZIL 66 NEW ZEALAND 22
BULGARIA 31 NORWAY 36
CANADA 114 PAKISTAN 60
CHILE 34 PERU 21
CHINA 781 PHILIPPINES 17
CROATIA 5 POLAND 96
DENMARK 40 PORTUGAL 8
EGYPT 25 ROMANIA 23
FINLAND 53 RUSSIAN FEDERATION 24
FRANCE 137 SINGAPORE 189
GERMANY 140 SOUTH AFRICA 60
GREECE 80 SPAIN 37
HONG KONG 231 SRI LANKA 44
INDIA 906 SWEDEN 88
INDONESIA 69 SWITZERLAND 72
IRELAND 11 TAIWAN 433
ISRAEL 38 THAILAND 150
ITALY 84 TURKEY 101
JAPAN 1,152 UNITED KINGDOM 98
JORDAN 11 VIETNAM 128
TOTAL 6581
21
Table 3. Summary Statistics
This table presents summary statistics of the main regression variables used in this paper. All variables are measured in 2007 unless otherwise indicated in the table.
Variable Definition Obs Mean Median Std. Dev p25 p75
Firm Level
Full Sample
Growth Percentage change in real sales in 2010 6581 7.69 4.36 27.04 -8.85 20.05
Growth09 Percentage change in real sales in 2009 6581 -2.12 -5.57 54.15 -17.76 6.75
Size Natural logarithm of total assets (in US$) 6581 5.15 5.04 1.67 4.00 6.16
Lev Total liabilities over total assets 6581 0.51 0.51 0.18 0.38 0.63
Tang Fixed assets over total assets 6581 0.33 0.31 0.16 0.19 0.44
Stdebt Short-term debt over total debt 6581 0.61 0.63 0.30 0.36 0.90
Emerging Economies
Growth Percentage change in real sales in 2010 4198 12.95 9.50 28.58 -4.73 26.78
Growth09 Percentage change in real sales in 2009 4198 0.17 -3.80 63.47 -17.58 10.62
Size Natural logarithm of total assets (in US$) 4198 4.71 4.64 1.47 3.68 5.63
Lev Total liabilities over total assets 4198 0.50 0.50 0.19 0.37 0.63
Tang Fixed assets over total assets 4198 0.35 0.34 0.17 0.21 0.48
Stdebt Short-term debt over total debt 4198 0.65 0.70 0.29 0.41 0.95
Advanced Economies
Growth Percentage change in real sales in 2010 2383 -1.57 -2.98 21.11 -13.76 7.87
Growth09 Percentage change in real sales in 2009 2383 -6.19 -8.22 31.25 -17.9 1.41
Size Natural logarithm of total assets (in US$) 2383 5.93 5.79 1.73 4.79 7.05
Lev Total liabilities over total assets 2383 0.52 0.52 0.17 0.39 0.64
Tang Fixed assets over total assets 2383 0.27 0.26 0.15 0.17 0.38
Stdebt Short-term debt over total debt 2383 0.51 0.49 0.29 0.27 0.74
Sector Level
Tradesens Trade sensitivity coefficient 20 1.21 1.08 0.43 0.94 1.43
Country Level
Deprec Real depreciation between 2007 and 2010, in percent 48 -3.65 -2.74 10.67 -9.54 1.97
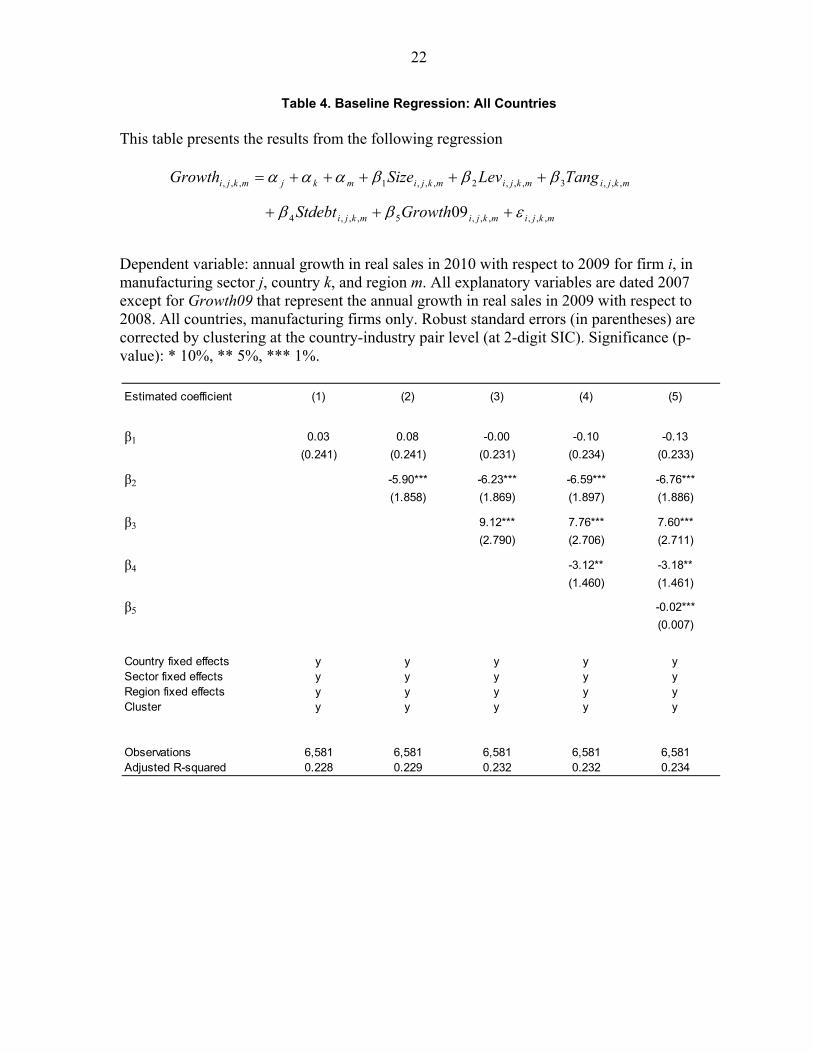
22
Table 4. Baseline Regression: All Countries
This table presents the results from the following regression
mkjimkjimkjimkjmkji TangLevSizeGrowth ,,,3,,,2,,,1,,,
mkjimkjimkji GrowthStdebt ,,,,,,5,,,4 09
Dependent variable: annual growth in real sales in 2010 with respect to 2009 for firm i, in manufacturing sector j, country k, and region m. All explanatory variables are dated 2007 except for Growth09 that represent the annual growth in real sales in 2009 with respect to 2008. All countries, manufacturing firms only. Robust standard errors (in parentheses) are corrected by clustering at the country-industry pair level (at 2-digit SIC). Significance (p-value): * 10%, ** 5%, *** 1%.
Estimated coefficient (1) (2) (3) (4) (5)
β1 0.03 0.08 -0.00 -0.10 -0.13
(0.241) (0.241) (0.231) (0.234) (0.233)
β2 -5.90*** -6.23*** -6.59*** -6.76***
(1.858) (1.869) (1.897) (1.886)
β3 9.12*** 7.76*** 7.60***
(2.790) (2.706) (2.711)
β4 -3.12** -3.18**
(1.460) (1.461)
β5 -0.02***
(0.007)
Country fixed effects y y y y ySector fixed effects y y y y yRegion fixed effects y y y y yCluster y y y y y
Observations 6,581 6,581 6,581 6,581 6,581Adjusted R-squared 0.228 0.229 0.232 0.232 0.234
23
Table 5. Baseline Regression: Emerging Economies
This table presents the results from the following regression
mkjimkjimkjimkjmkji TangLevSizeGrowth ,,,3,,,2,,,1,,,
mkjimkjimkji GrowthStdebt ,,,,,,5,,,4 09
Dependent variable: annual growth in real sales in 2010 with respect to 2009 for firm i, in manufacturing sector j, country k, and region m. All explanatory variables are dated 2007 except for Growth09 that represent the annual growth in real sales in 2009 with respect to 2008. Emerging economies, manufacturing firms only. Robust standard errors (in parentheses) are corrected by clustering at the country-industry pair level (at 2-digit SIC). Significance (p-value): * 10%, ** 5%, *** 1%.
Estimated coefficient (1) (2) (3) (4) (5)
β1 0.29 0.34 0.19 0.15 0.13
(0.417) (0.416) (0.396) (0.396) (0.394)
β2 -6.29** -6.82*** -6.89*** -7.11***
(2.507) (2.538) (2.548) (2.536)
β3 11.00*** 10.30*** 10.23***
(3.608) (3.410) (3.417)
β4 -1.39 -1.41
(1.946) (1.950)
β5 -0.01**
(0.006)
Country fixed effects y y y y ySector fixed effects y y y y yRegion fixed effects y y y y yCluster y y y y y
Observations 4,198 4,198 4,198 4,198 4,198Adjusted R-squared 0.175 0.176 0.179 0.179 0.180
24
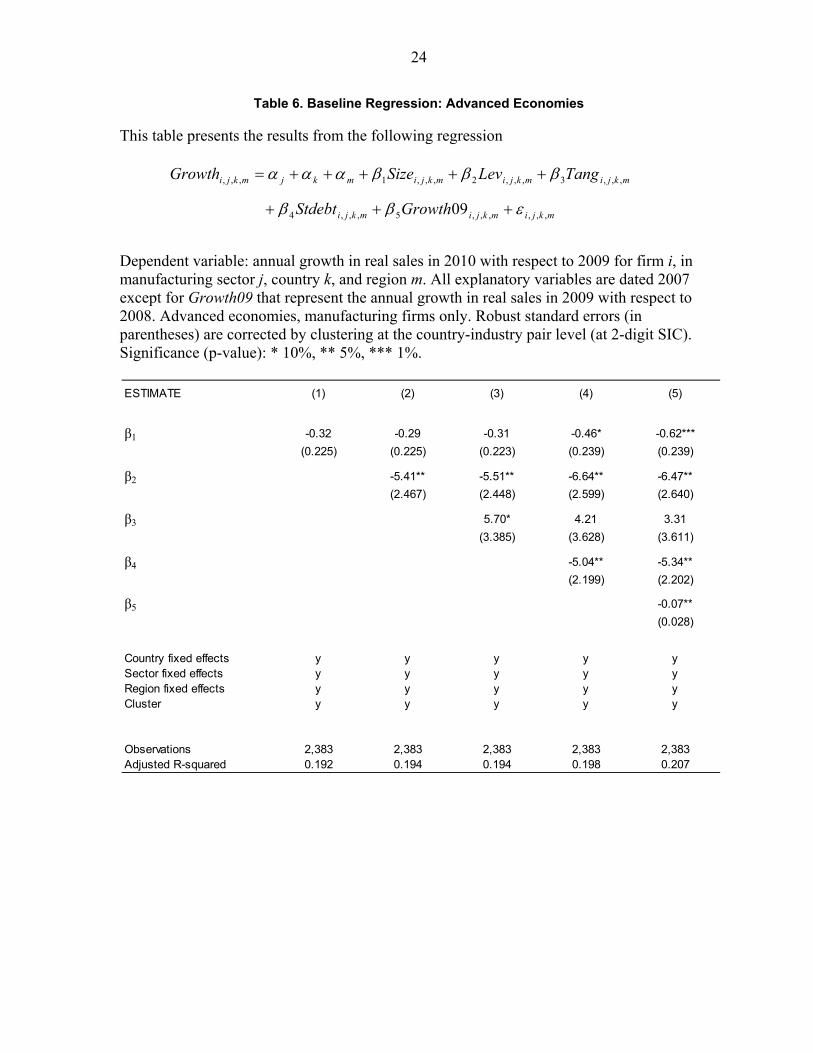
Table 6. Baseline Regression: Advanced Economies
This table presents the results from the following regression
mkjimkjimkjimkjmkji TangLevSizeGrowth ,,,3,,,2,,,1,,,
mkjimkjimkji GrowthStdebt ,,,,,,5,,,4 09
Dependent variable: annual growth in real sales in 2010 with respect to 2009 for firm i, in manufacturing sector j, country k, and region m. All explanatory variables are dated 2007 except for Growth09 that represent the annual growth in real sales in 2009 with respect to 2008. Advanced economies, manufacturing firms only. Robust standard errors (in parentheses) are corrected by clustering at the country-industry pair level (at 2-digit SIC). Significance (p-value): * 10%, ** 5%, *** 1%.
ESTIMATE (1) (2) (3) (4) (5)
β1 -0.32 -0.29 -0.31 -0.46* -0.62***
(0.225) (0.225) (0.223) (0.239) (0.239)
β2 -5.41** -5.51** -6.64** -6.47**
(2.467) (2.448) (2.599) (2.640)
β3 5.70* 4.21 3.31
(3.385) (3.628) (3.611)
β4 -5.04** -5.34**
(2.199) (2.202)
β5 -0.07**
(0.028)
Country fixed effects y y y y ySector fixed effects y y y y yRegion fixed effects y y y y yCluster y y y y y
Observations 2,383 2,383 2,383 2,383 2,383Adjusted R-squared 0.192 0.194 0.194 0.198 0.207
25
Table 7. Nonlinear Effects of Leverage
This table presents the results from the following regression
mkjimkjimkjimkjmkji TangLevSizeGrowth ,,,3,,,2,,,1,,,
mkjimkjimkjimkjimkji LevILevGrowthStdebt ,,,,,,,,,,,,5,,,4 )(09
Dependent variable: annual growth in real sales in 2010 with respect to 2009 for firm i, in manufacturing sector j, country k, and region m. All explanatory variables are dated 2007 except for Growth09 that represent the annual growth in real sales in 2009 with respect to 2008. The regression is performed separately for the samples/subsamples named in the headings of the columns. Robust standard errors (in parentheses) are corrected by clustering at the country-industry pair level (at 2-digit SIC). Significance (p-value): * 10%, ** 5%, *** 1%.
Emerging Economies
Advanced Economies
β1 -0.09 0.20 -0.57**
(0.231) (0.388) (0.234)
β2 6.54* 9.98** 13.08*
(3.410) (4.158) (6.792)
β3 7.43*** 10.05*** 3.62
(2.722) (3.444) (3.556)
β4 -3.16** -1.23 -5.42**
(1.449) (1.924) (2.196)
β5 -0.02*** -0.01** -0.07**
(0.007) (0.006) (0.028)
η -8.17*** -10.69*** -13.64***
(1.908) (2.449) (4.601)
γ 0.48** 0.48** 0.37*
Observations 6,581 4,198 2,383Adjusted R-squared 0.235 0.183 0.211Robust standard errors in parenthese*** p<0.01, ** p<0.05, * p<0.1
Estimated coefficients
(3)
Sub-samples
(1) (2)
Full Sample
26
Table 8. Depreciation and Trade Effects
This table presents the results from the following regression
mkjimkjimkjimkjimkjmkji StdebtTangLevSizeGrowth ,,,4,,,3,,,2,,,1,,,
kjmkjimkjimkji DeprecTradesensLevILevGrowth )(09 ,,,,,,,,,5
mkjimkjikj LevIDeprecTradesens ,,,,,, )(
Dependent variable: annual growth in real sales in 2010 with respect to 2009 for firm i, in manufacturing sector j, country k, and region m. All explanatory variables are dated 2007 except for Growth09 that represent the annual growth in real sales in 2009 with respect to 2008. The regression is performed separately for the samples/subsamples named in the headings of the columns. Robust standard errors (in parentheses) are corrected by clustering at the country-industry pair level (at 2-digit SIC). Significance (p-value): * 10%, ** 5%, *** 1%.
Emerging Economies
Advanced Economies
β1 -0.09 0.20 -0.57**
(0.231) (0.388) (0.234)
β2 6.71** 9.86** -0.51
(3.410) (4.158) (6.792)
β3 7.08*** 9.79*** 2.41
(2.721) (3.449) (3.662)
β4 -3.16** -1.23 -5.42**
(1.449) (1.924) (2.196)
β5 -0.02*** -0.01** -0.07**
(0.007) (0.006) (0.028)
η -8.21*** -10.26*** -3.58
(2.078) (2.523) (3.530)
φ 0.49*** 0.30** 0.82***
(0.114) (0.141) (0.103)
Ѳ 0.00 0.05 -0.02
(0.050) (0.087) (0.047)
γ 0.48** 0.48** 0.37*
Observations 6,581 4,198 2,383Adjusted R-squared 0.243 0.185 0.235Robust standard errors in parentheses*** p<0.01, ** p<0.05, * p<0.1
Estimated coefficients Full Sample
Sub-samples
(1) (2) (3)
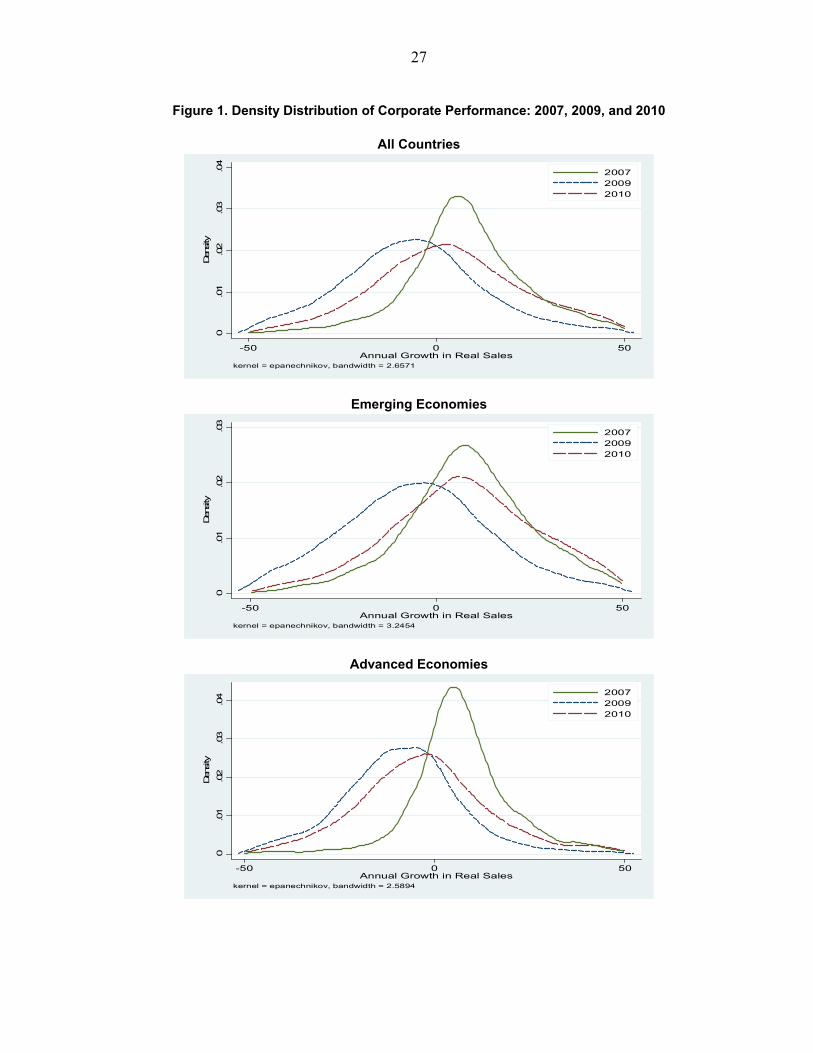
27
Figure 1. Density Distribution of Corporate Performance: 2007, 2009, and 2010
All Countries
Emerging Economies
Advanced Economies
0.01
.02
.03
.04
Dens
ity
-50 0 50Annual Growth in Real Sales
200720092010
kernel = epanechnikov, bandwidth = 2.6571
0.01
.02
.03
Dens
ity
-50 0 50Annual Growth in Real Sales
200720092010
kernel = epanechnikov, bandwidth = 3.2454
0.01
.02
.03
.04
Dens
ity
-50 0 50Annual Growth in Real Sales
200720092010
kernel = epanechnikov, bandwidth = 2.5894
28
Figure 2. Density Distribution of Corporate Performance by Levels of Leverage: 2010
High and low leverage legends refer to levels above and below the median leverage for each sample.
All Countries
Emerging Economies
Advanced Economies
0.005
.01
.015
.02
Dens
ity
-50 0 50Annual Growth in Real Sales
High leverageLow leverage
kernel = epanechnikov, bandwidth = 3.3710
0.005
.01
.015
.02
Dens
ity
-50 0 50Annual Growth in Real Sales
High leverageLow leverage
kernel = epanechnikov, bandwidth = 3.9805
0.005
.01
.015
.02
.025
Dens
ity
-50 0 50Annual Growth in Real Sales
High leverageLow leverage
kernel = epanechnikov, bandwidth = 3.4490
29
Figure 3. Corporate Performance: 2007–2010
Solid lines represent the median percentage growth in real sales (left scale). Bars show the percentage of firms with negative growth in a given year (right scale).
All Countries
Emerging Economies
Advanced Economies
0
10
20
30
40
50
60
70
80
-10
-8
-6
-4
-2
0
2
4
6
8
10
12
2007 2008 2009 2010
0
10
20
30
40
50
60
70
80
-10
-8
-6
-4
-2
0
2
4
6
8
10
12
2007 2008 2009 2010
0
10
20
30
40
50
60
70
80
-10
-8
-6
-4
-2
0
2
4
6
8
10
12
2007 2008 2009 2010

30
Appendix. Data Sources and Definitions of Variables
The principal source for compiling the database employed in this study is Worldscope (Thomson Financial), a data set that compiles publicly traded firms’ balance sheet information. Inflation and REER data have been gathered from the IMF’s International Financial Statistics. Variables that are expressed in real terms are deflated by using the CPI of the country where the firm is located.
Sales: gross sales and other operating revenue less discounts, returns, and allowances (net
sales or revenues, WS 01001).
Leverage: ratio of all short- and long-term obligations (total liabilities, WS 03351) to total
assets (WS 02999).
Tangibility: ratio of fixed assets to total assets, with fixed assets defined as gross property,
plant, and equipment less accumulated reserves for depreciation, depletion, and amortization
(WS 02501).
Short-term debt: ratio of short-term debt and the portion of long-term debt payable within
one year (WS 03051) to total debt (WS 03255).