Embed Size (px)
Citation preview

8/6/2019 Spring Branch ISD - Westchester Academy - 2004 Texas School Survey of Drug and Alcohol Use
http://slidepdf.com/reader/full/spring-branch-isd-westchester-academy-2004-texas-school-survey-of-drug 1/83
8/6/2019 Spring Branch ISD - Westchester Academy - 2004 Texas School Survey of Drug and Alcohol Use
http://slidepdf.com/reader/full/spring-branch-isd-westchester-academy-2004-texas-school-survey-of-drug 2/83
Spring Branch ISD - Westchester AcademySpring 2004
________________________________________________________________________________
Table T-1: How recently, if ever, have you used ..
Past School Ever NeverMonth Year Used Used
________________________________________________________________________________Any tobacco product All 21.0% 26.1% 40.8% 59.2%________________________________________________________________________________Cigarettes All 21.2% 26.3% 41.2% 58.8%________________________________________________________________________________Smokeless tobacco All 3.1% 5.5% 8.2% 91.8%
________________________________________________________________________________
Table T-2: How often do you normally use ..
Any tobacco product?
Several Several About About Less Than
Never Every Times Times Once a Once a Once aUsed Day a Week a Month Month Year Year
All 60.4% 8.8% 4.6% 5.1% 5.7% 6.3% 9.0%
Cigarettes?
Several Several About About Less ThanNever Every Times Times Once a Once a Once aUsed Day a Week a Month Month Year Year
All 60.7% 8.9% 4.6% 5.1% 5.8% 5.9% 9.1%
Smokeless tobacco?
Several Several About About Less ThanNever Every Times Times Once a Once a Once a
Used Day a Week a Month Month Year Year
All 90.6% 0.4% 0.5% 0.5% 2.5% 2.4% 3.2%
________________________________________________________________________________
Table T-3: In the past 30 days, how many cigarettes have you smoked?
>1 But >10 But >1 Pack<1 Per <10 Per <1 Pack But <2 >2 Packs
None Day Day Per Day Packs/Day Per Day
All 76.3% 10.6% 9.1% 2.3% 1.7% * %

8/6/2019 Spring Branch ISD - Westchester Academy - 2004 Texas School Survey of Drug and Alcohol Use
http://slidepdf.com/reader/full/spring-branch-isd-westchester-academy-2004-texas-school-survey-of-drug 3/83
Spring Branch ISD - Westchester AcademySpring 2004
________________________________________________________________________________
Table T-4: Average age of first use of:
All
Tobacco 12.2
________________________________________________________________________________
Table T-5: If you wanted some, how difficult would it be to get ..
Cigarettes?
Never Very Somewhat Somewhat VeryHeard Of Impossible Difficult Difficult Easy Easy
All 10.6% 19.8% 3.9% 8.1% 18.9% 38.8%
Smokeless Tobacco?
Never Very Somewhat Somewhat VeryHeard Of Impossible Difficult Difficult Easy Easy
All 26.1% 27.3% 5.8% 10.5% 10.5% 19.9%
________________________________________________________________________________
Table T-6: About how many of your close friends ..
Use any tobacco product?
Never heardNone A Few Some Most All
All 38.0% 29.5 % 18.2% 11.6% 2.6%
Smoke cigarettes?
Never heardNone A Few Some Most All
All 37.9% 29.3 % 18.4% 12.2% 2.2%
Use a smokeless tobacco product?
Never heardNone A Few Some Most All
All 82.1% 10.6 % 6.4% 0.5% 0.4%

8/6/2019 Spring Branch ISD - Westchester Academy - 2004 Texas School Survey of Drug and Alcohol Use
http://slidepdf.com/reader/full/spring-branch-isd-westchester-academy-2004-texas-school-survey-of-drug 4/83
Spring Branch ISD - Westchester AcademySpring 2004
________________________________________________________________________________
Table T-7: How do your parents feel about kids your age smoking cigarettes?
Strongly Mildly Mildly Strongly Don'tDisapprove Disapprove Neither Approve Approve Know
All 70.0% 10.6% 6.4% 1.0% 2.1% 9.9%
________________________________________________________________________________
Table T-8: How dangerous do you think it is for kids your age to use tobacco?
Very Somewhat Not Very Not at All Do NotDangerous Dangerous Dangerous Dangerous Know
All 53.8% 24.8% 12.7% 5.3% 3.4%

8/6/2019 Spring Branch ISD - Westchester Academy - 2004 Texas School Survey of Drug and Alcohol Use
http://slidepdf.com/reader/full/spring-branch-isd-westchester-academy-2004-texas-school-survey-of-drug 5/83

8/6/2019 Spring Branch ISD - Westchester Academy - 2004 Texas School Survey of Drug and Alcohol Use
http://slidepdf.com/reader/full/spring-branch-isd-westchester-academy-2004-texas-school-survey-of-drug 6/83
Spring Branch ISD - Westchester AcademySpring 2004
________________________________________________________________________________
Table A-1: How recently, if ever, have you used ..
Past School Ever NeverMonth Year Used Used
________________________________________________________________________________Any alcohol product All 32.7% 43.0% 64.4% 35.6%________________________________________________________________________________Beer All 22.4% 33.6% 51.8% 48.2%________________________________________________________________________________Wine coolers All 14.2% 21.4% 40.8% 59.2%________________________________________________________________________________Wine All 17.5% 28.2% 53.2% 46.8%________________________________________________________________________________Liquor All 22.1% 30.6% 46.0% 54.0%
________________________________________________________________________________
Table A-2: How often do you normally use ..
Any alcohol product?
Several Several About About Less ThanNever Every Times Times Once a Once a Once aUsed Day a Week a Month Month Year Year
All 39.7% 0.9% 8.9% 10.6% 17.3% 13.4% 9.1%
Beer?
Several Several About About Less ThanNever Every Times Times Once a Once a Once aUsed Day a Week a Month Month Year Year
All 50.5% 0.5% 6.7% 7.5% 12.1% 14.2% 8.3%
Wine coolers?
Several Several About About Less ThanNever Every Times Times Once a Once a Once aUsed Day a Week a Month Month Year Year
All 62.0% * % 1.5% 5.0% 11.4% 10.2% 9.8%
Wine?
Several Several About About Less ThanNever Every Times Times Once a Once a Once aUsed Day a Week a Month Month Year Year
All 52.9% * % 1.4% 5.8% 12.3% 17.0% 10.7%
Liquor?
Several Several About About Less ThanNever Every Times Times Once a Once a Once aUsed Day a Week a Month Month Year Year
All 54.0% 0.4% 5.5% 11.8% 11.1% 10.5% 6.7%

8/6/2019 Spring Branch ISD - Westchester Academy - 2004 Texas School Survey of Drug and Alcohol Use
http://slidepdf.com/reader/full/spring-branch-isd-westchester-academy-2004-texas-school-survey-of-drug 7/83
Spring Branch ISD - Westchester AcademySpring 2004
________________________________________________________________________________
Table A-3: When you drink the following alcoholic beverages, how many drinks do
you usually have at one time, on average?
Beer
Never Ever 5 or More 1 to 4 Less Than 1
All 48.1% 51.9% 14.2% 26.4% 11.2%
Wine Coolers
Never Ever 5 or More 1 to 4 Less Than 1
All 58.1% 41.9% 7.8% 26.3% 7.8%
Wine
Never Ever 5 or More 1 to 4 Less Than 1
All 47.1% 52.9% 5.8% 32.2% 15.0%
Liquor
Never Ever 5 or More 1 to 4 Less Than 1
All 51.0% 49.0% 16.2% 22.6% 10.1%
________________________________________________________________________________
Table A-4: During the past twelve months, how often have you had five or moredrinks at one time?
BeerSeveral Several Less Than
Never Ever Times/Week Times/Month Once/Month
All 67.4% 32.6% 3.7% 12.2% 16.7%
Wine CoolersSeveral Several Less Than
Never Ever Times/Week Times/Month Once/Month
All 72.6% 27.4% 0.5% 9.6% 17.3%
WineSeveral Several Less Than
Never Ever Times/Week Times/Month Once/Month
All 69.5% 30.5% 0.5% 7.9% 22.1%
LiquorSeveral Several Less Than
Never Ever Times/Week Times/Month Once/Month
All 65.3% 34.7% 3.6% 13.7% 17.4%

8/6/2019 Spring Branch ISD - Westchester Academy - 2004 Texas School Survey of Drug and Alcohol Use
http://slidepdf.com/reader/full/spring-branch-isd-westchester-academy-2004-texas-school-survey-of-drug 8/83
Spring Branch ISD - Westchester AcademySpring 2004
________________________________________________________________________________
Table A-5: Average age of first use of:
All
Alcohol 11.4Beer 11.7Wine Coolers 12.1Wine 12.0Liquor 12.6
________________________________________________________________________________
Table A-6: If you wanted some, how difficult would it be to get ..
Beer?
Never Very Somewhat Somewhat VeryHeard Of Impossible Difficult Difficult Easy Easy
All 9.1% 17.0% 8.8% 13.7% 17.9% 33.5%
Wine coolers?
Never Very Somewhat Somewhat VeryHeard Of Impossible Difficult Difficult Easy Easy
All 16.5% 19.3% 5.4% 16.2% 15.0% 27.5%
Wine?
Never Very Somewhat Somewhat VeryHeard Of Impossible Difficult Difficult Easy Easy
All 11.9% 18.1% 4.7% 14.7% 17.0% 33.6%
Liquor?
Never Very Somewhat Somewhat VeryHeard Of Impossible Difficult Difficult Easy Easy
All 10.3% 21.5% 6.0% 12.5% 17.1% 32.6%
________________________________________________________________________________
Table A-7: Since school began in the fall, on how many days (if any) have you .
Attended class while drunk on alcohol?
None 1-3 Days 4-9 Days 10+ Days
All 89% 6.7% 1.8% 2.7%

8/6/2019 Spring Branch ISD - Westchester Academy - 2004 Texas School Survey of Drug and Alcohol Use
http://slidepdf.com/reader/full/spring-branch-isd-westchester-academy-2004-texas-school-survey-of-drug 9/83
Spring Branch ISD - Westchester AcademySpring 2004
________________________________________________________________________________
Gotten into trouble with teachers because of your drinking?
None 1-3 Days 4-9 Days 10+ Days
All 98% 0.9% 0.6% * %
________________________________________________________________________________
Table A-8: School year use of alcohol by absences and conduct problems:
Average days absent due to illness or other reasons:
Alcohol Users: 4.4 days per studentAlcohol Non-users: 4.0 days per student
Average days conduct problems reported:
Alcohol Users: 4.5 days per student
Alcohol Non-users: 1.1 days per student
________________________________________________________________________________
Table A-9: During the past twelve months, how many times have you ..
Driven a car when you've had a good bit to drink?
None 1-3 Times 4-9 Times 10+ Times
All 82.6% 6.1% 8.4% 2.8%
Gotten into trouble with the police because of drinking?
None 1-3 Times 4-9 Times 10+ Times
All 94.2% 5.4% * % 0.4%
________________________________________________________________________________
Table A-10: About how many of your close friends use...
Any alcohol product?
Never heardNone A Few Some Most All
All 30.9% 25.6 % 12.3% 19.3% 12.0%
Beer?
Never heardNone A Few Some Most All
All 38.0% 22.3 % 16.4% 17.2% 6.1%

8/6/2019 Spring Branch ISD - Westchester Academy - 2004 Texas School Survey of Drug and Alcohol Use
http://slidepdf.com/reader/full/spring-branch-isd-westchester-academy-2004-texas-school-survey-of-drug 10/83
Spring Branch ISD - Westchester AcademySpring 2004
________________________________________________________________________________
Wine coolers?
Never heardNone A Few Some Most All
All 56.0% 21.6 % 12.2% 7.1% 3.1%
Wine?
Never heardNone A Few Some Most All
All 53.4% 24.0 % 13.0% 6.7% 2.8%
Liquor?
Never heard
None A Few Some Most All
All 44.3% 19.3 % 10.3% 17.7% 8.5%
________________________________________________________________________________
Table A-11: During the past twelve months, how many times have you...
Had difficulties of any kind with your friends because of your drinking?
None 1-3 Times 4-9 Times 10+ Times
All 92.9% 6.2% 0.9% * %
Been criticized by someone you were dating because of drinking?
None 1-3 Times 4-9 Times 10+ Times
All 94.8% 4.2% 0.5% 0.5%
________________________________________________________________________________
Table A-12: Thinking of parties you attended this school year, how often was alcoholused?
Half Most Of Don't Didn'tNever Seldom the Time the Time Always Know Attend
All 42% 9.0% 8.3% 13.4% 15.9% 1.2% 10.0%

8/6/2019 Spring Branch ISD - Westchester Academy - 2004 Texas School Survey of Drug and Alcohol Use
http://slidepdf.com/reader/full/spring-branch-isd-westchester-academy-2004-texas-school-survey-of-drug 11/83
Spring Branch ISD - Westchester AcademySpring 2004
________________________________________________________________________________
Table A-13: How often, if ever, do you get alcoholic beverages from ..
At home
Do Not Most ofDrink Never Seldom the time Always
All 42.0% 19.0% 30.6% 5.7% 2.7%
From friends
Do Not Most ofDrink Never Seldom the time Always
All 42.3% 15.5% 15.3% 18.8% 8.0%
From a store
Do Not Most ofDrink Never Seldom the time Always
All 42.8% 37.5% 6.6% 10.2% 2.9%
At parties
Do Not Most ofDrink Never Seldom the time Always
All 40.5% 13.9% 13.0% 23.4% 9.2%
Other source
Do Not Most ofDrink Never Seldom the time Always
All 42.9% 22.3% 17.2% 8.8% 8.8%
________________________________________________________________________________
Table A-14: How do your parents feel about kids your age drinking beer?
Strongly Mildly Mildly Strongly Don'tDisapprove Disapprove Neither Approve Approve Know
All 59.5% 18.6% 7.9% 2.3% 2.1% 9.6%
________________________________________________________________________________
Table A-15: How dangerous do you think it is for kids your age to use alcohol?
Very Somewhat Not Very Not at All Do NotDangerous Dangerous Dangerous Dangerous Know
All 42.4% 30.2% 19.1% 4.9% 3.5%

8/6/2019 Spring Branch ISD - Westchester Academy - 2004 Texas School Survey of Drug and Alcohol Use
http://slidepdf.com/reader/full/spring-branch-isd-westchester-academy-2004-texas-school-survey-of-drug 12/83
Spring Branch ISD - Westchester AcademySpring 2004
________________________________________________________________________________
Table D-1: How recently, if ever, have you used ..
Past School Ever NeverMonth Year Used Used
________________________________________________________________________________Marijuana? All 20.0% 25.2% 34.5% 65.5%________________________________________________________________________________Cocaine? All 4.0% 5.4% 11.6% 88.4%________________________________________________________________________________Crack? All 1.0% 1.3% 5.2% 94.8%________________________________________________________________________________Hallucinogens? All 3.0% 6.1% 14.0% 86.0%________________________________________________________________________________Uppers? All 5.8% 7.8% 13.1% 86.9%________________________________________________________________________________Downers? All 5.8% 7.5% 12.8% 87.2%________________________________________________________________________________Rohypnol? All 2.1% 2.6% 3.0% 97.0%
________________________________________________________________________________Steroids? All * % 0.5% 0.9% 99.1%________________________________________________________________________________Ecstasy? All 4.1% 5.0% 12.9% 87.1%________________________________________________________________________________Heroin? All 0.8% 0.8% 1.7% 98.3%
________________________________________________________________________________
Table D-2: How often do you normally use ..
Marijuana?
Several Several About About Less ThanNever Every Times Times Once a Once a Once aUsed Day a Week a Month Month Year Year
All 69.1% 5.1% 7.4% 5.4% 4.1% 4.3% 4.6%
Cocaine?
Several Several About About Less ThanNever Every Times Times Once a Once a Once aUsed Day a Week a Month Month Year Year
All 89.3% 0.4% 0.5% 1.5% 2.0% 3.0% 3.3%
Crack?
Several Several About About Less ThanNever Every Times Times Once a Once a Once aUsed Day a Week a Month Month Year Year
All 97.2% * % * % 1.0% * % 0.4% 1.5%

8/6/2019 Spring Branch ISD - Westchester Academy - 2004 Texas School Survey of Drug and Alcohol Use
http://slidepdf.com/reader/full/spring-branch-isd-westchester-academy-2004-texas-school-survey-of-drug 13/83
Spring Branch ISD - Westchester AcademySpring 2004
________________________________________________________________________________
Hallucinogens?
Several Several About About Less ThanNever Every Times Times Once a Once a Once aUsed Day a Week a Month Month Year Year
All 87.9% * % * % 0.5% 0.9% 5.9% 4.9%
Uppers?
Several Several About About Less ThanNever Every Times Times Once a Once a Once aUsed Day a Week a Month Month Year Year
All 85.5% 0.4% 0.4% 3.0% 3.0% 4.8% 2.9%
Downers?
Several Several About About Less ThanNever Every Times Times Once a Once a Once aUsed Day a Week a Month Month Year Year
All 85.5% 1.3% 2.2% 2.5% 3.2% 1.9% 3.4%
Rohypnol?
Several Several About About Less ThanNever Every Times Times Once a Once a Once aUsed Day a Week a Month Month Year Year
All 96.8% * % 0.5% 1.3% * % 0.9% 0.5%
Steroids?
Several Several About About Less Than
Never Every Times Times Once a Once a Once aUsed Day a Week a Month Month Year Year
All 98.6% * % 0.5% * % * % * % 0.9%
Ecstasy?
Several Several About About Less ThanNever Every Times Times Once a Once a Once aUsed Day a Week a Month Month Year Year
All 87.7% 0.4% * % 0.5% 2.3% 3.1% 6.0%
Heroin?
Several Several About About Less ThanNever Every Times Times Once a Once a Once a
Used Day a Week a Month Month Year Year
All 98.7% * % * % 0.5% * % 0.4% 0.4%

8/6/2019 Spring Branch ISD - Westchester Academy - 2004 Texas School Survey of Drug and Alcohol Use
http://slidepdf.com/reader/full/spring-branch-isd-westchester-academy-2004-texas-school-survey-of-drug 14/83
Spring Branch ISD - Westchester AcademySpring 2004
________________________________________________________________________________
Table D-3: Average age of first use of:
All
Marijuana 13.1Cocaine 14.5Crack *Hallucinogens 14.9Uppers 13.7Downers 14.0Rohypnol *Steroids *Ecstasy 14.6Heroin *
________________________________________________________________________________
Table D-4: Age of first use of marijuana by family situation:
Two parent family
Never 9/Under 10-11 12-13 14-15 16-17 18/Over
All 66.9% 0.6% 1.4% 13.9% 14.8% 2.3% * %
Other family situation
Never 9/Under 10-11 12-13 14-15 16-17 18/Over
All 67.4% 3.3% 5.8% 13.7% 9.8% * % * %
________________________________________________________________________________
Table D-5: If you wanted some, how difficult would it be to get ..
Marijuana?
Never Very Somewhat Somewhat VeryHeard Of Impossible Difficult Difficult Easy Easy
All 10.3% 27.5% 6.0% 10.3% 12.6% 33.3%
Cocaine?
Never Very Somewhat Somewhat VeryHeard Of Impossible Difficult Difficult Easy Easy
All 16.4% 31.8% 18.4% 11.2% 9.2% 13.0%
Crack?
Never Very Somewhat Somewhat VeryHeard Of Impossible Difficult Difficult Easy Easy
All 16.8% 33.4% 20.2% 14.3% 7.4% 7.8%

8/6/2019 Spring Branch ISD - Westchester Academy - 2004 Texas School Survey of Drug and Alcohol Use
http://slidepdf.com/reader/full/spring-branch-isd-westchester-academy-2004-texas-school-survey-of-drug 15/83
Spring Branch ISD - Westchester AcademySpring 2004
________________________________________________________________________________
Hallucinogens?
Never Very Somewhat Somewhat VeryHeard Of Impossible Difficult Difficult Easy Easy
All 28.3% 25.7% 14.0% 15.1% 6.6% 10.4%
Uppers?
Never Very Somewhat Somewhat VeryHeard Of Impossible Difficult Difficult Easy Easy
All 38.3% 21.5% 6.4% 14.0% 6.9% 12.9%
Downers?
Never Very Somewhat Somewhat VeryHeard Of Impossible Difficult Difficult Easy Easy
All 38.8% 21.4% 6.9% 13.2% 7.2% 12.5%
Rohypnol?
Never Very Somewhat Somewhat VeryHeard Of Impossible Difficult Difficult Easy Easy
All 51.2% 20.1% 8.8% 7.5% 5.3% 7.2%
Steroids?
Never Very Somewhat Somewhat VeryHeard Of Impossible Difficult Difficult Easy Easy
All 24.4% 33.5% 18.4% 13.1% 3.7% 6.8%
Ecstasy?
Never Very Somewhat Somewhat VeryHeard Of Impossible Difficult Difficult Easy Easy
All 22.7% 29.5% 11.4% 15.3% 11.4% 9.7%
Heroin?
Never Very Somewhat Somewhat VeryHeard Of Impossible Difficult Difficult Easy Easy
All 26.8% 38.1% 15.2% 11.6% 4.3% 4.0%

8/6/2019 Spring Branch ISD - Westchester Academy - 2004 Texas School Survey of Drug and Alcohol Use
http://slidepdf.com/reader/full/spring-branch-isd-westchester-academy-2004-texas-school-survey-of-drug 16/83
Spring Branch ISD - Westchester AcademySpring 2004
________________________________________________________________________________
Table D-6: Since school began in the fall, on how many days (if any) have you .
Attended class while high from marijuana use?
None 1-3 Days 4-9 Days 10+ Days
All 81% 8.9% 4.0% 5.9%
Attended class while high from use of some other drug?
None 1-3 Days 4-9 Days 10+ Days
All 86% 8.0% 3.1% 2.6%
Gotten into trouble with teachers because of your drug use?
None 1-3 Days 4-9 Days 10+ Days
All 96% 2.7% 1.2% * %
________________________________________________________________________________
Table D-7: School year use of marijuana by absences and conduct problems:
Average days absent due to illness or other reasons:
Marijuana Users: 4.9 days per studentMarijuana Non-users: 3.9 days per student
Average days conduct problems reported:
Marijuana Users: 5.3 days per studentMarijuana Non-users: 1.6 days per student
________________________________________________________________________________
Table D-8: During the past twelve months, how many times have you ..
Driven a car when you've felt high from drugs?
None 1-3 Times 4-9 Times 10+ Times
All 79.7% 11.0% 2.0% 7.3%
Gotten into trouble with the police because of drug use?
None 1-3 Times 4-9 Times 10+ Times
All 98.1% 1.5% 0.4% * %

8/6/2019 Spring Branch ISD - Westchester Academy - 2004 Texas School Survey of Drug and Alcohol Use
http://slidepdf.com/reader/full/spring-branch-isd-westchester-academy-2004-texas-school-survey-of-drug 17/83
Spring Branch ISD - Westchester AcademySpring 2004
________________________________________________________________________________
Table D-9: About how many of your close friends use marijuana?
Never heardNone A Few Some Most All
All 46.2% 15.5 % 12.7% 13.6% 12.1%
________________________________________________________________________________
Table D-10: During the past twelve months, how many times have you ..
Had difficulties of any kind with your friends because of your drug use?
None 1-3 Times 4-9 Times 10+ Times
All 91.1% 8.0% 0.5% 0.4%
Been criticized by someone you were dating because of drug use?
None 1-3 Times 4-9 Times 10+ Times
All 94.2% 4.5% 0.9% 0.4%
________________________________________________________________________________
Table D-11: Thinking of parties you attended this school year, how often was marijuanaused?
Half Most Of Don't Didn'tNever Seldom the Time the Time Always Know Attend
All 49% 10.1% 6.3% 9.9% 11.4% 2.7% 10.5%
________________________________________________________________________________
Table D-12: How often, if ever, do you smoke marijuana in ..
Joints?
Half the Most of Don'tNever Seldom Time the Time Always Know
All 70.9% 11.5% 8.0% 5.7% 3.5% 0.4%
Blunts?
Half the Most of Don'tNever Seldom Time the Time Always Know
All 75.1% 7.8% 5.5% 6.2% 5.0% 0.5%

8/6/2019 Spring Branch ISD - Westchester Academy - 2004 Texas School Survey of Drug and Alcohol Use
http://slidepdf.com/reader/full/spring-branch-isd-westchester-academy-2004-texas-school-survey-of-drug 18/83
Spring Branch ISD - Westchester AcademySpring 2004
________________________________________________________________________________
Bongs or water pipes?
Half the Most of Don'tNever Seldom Time the Time Always Know
All 77.7% 6.5% 6.0% 6.1% 3.1% 0.5%
Pipes?
Half the Most of Don'tNever Seldom Time the Time Always Know
All 73.0% 6.7% 5.2% 7.2% 7.4% 0.5%
Some other way?
Half the Most of Don'tNever Seldom Time the Time Always Know
All 80.5% 10.0% 1.6% 1.4% 4.1% 2.5%
________________________________________________________________________________
Table D-13: How do your parents feel about kids your age using marijuana?
Strongly Mildly Mildly Strongly Don'tDisapprove Disapprove Neither Approve Approve Know
All 76.7% 10.1% 1.3% 0.8% 2.2% 8.9%
________________________________________________________________________________
Table D-14: How dangerous do you think it is for kids your age to use ..
Marijuana?
Very Somewhat Not Very Not at All Do NotDangerous Dangerous Dangerous Dangerous Know
All 52.1% 16.9% 16.1% 11.0% 3.9%
Cocaine?
Very Somewhat Not Very Not at All Do NotDangerous Dangerous Dangerous Dangerous Know
All 76.9% 15.3% 2.5% 0.6% 4.8%
Crack?
Very Somewhat Not Very Not at All Do Not
Dangerous Dangerous Dangerous Dangerous Know
All 81.1% 10.1% 2.0% 1.3% 5.5%

8/6/2019 Spring Branch ISD - Westchester Academy - 2004 Texas School Survey of Drug and Alcohol Use
http://slidepdf.com/reader/full/spring-branch-isd-westchester-academy-2004-texas-school-survey-of-drug 19/83
Spring Branch ISD - Westchester AcademySpring 2004
________________________________________________________________________________
Ecstasy?
Very Somewhat Not Very Not at All Do NotDangerous Dangerous Dangerous Dangerous Know
All 75.1% 17.0% 1.7% 1.3% 4.9%
Steroids?
Very Somewhat Not Very Not at All Do NotDangerous Dangerous Dangerous Dangerous Know
All 72.3% 17.5% 2.9% 1.3% 6.0%
Heroin?
Very Somewhat Not Very Not at All Do NotDangerous Dangerous Dangerous Dangerous Know
All 82.3% 8.7% 1.2% 1.3% 6.5%

8/6/2019 Spring Branch ISD - Westchester Academy - 2004 Texas School Survey of Drug and Alcohol Use
http://slidepdf.com/reader/full/spring-branch-isd-westchester-academy-2004-texas-school-survey-of-drug 20/83
Spring Branch ISD - Westchester AcademySpring 2004
________________________________________________________________________________
Table I-1: How recently, if ever, have you used ..
Past School Ever NeverMonth Year Used Used
________________________________________________________________________________Any inhalant? All 12.1% 18.5% 31.5% 68.5%________________________________________________________________________________Liquid or spray paint? All 3.7% 5.0% 15.1% 84.9%________________________________________________________________________________Whiteout, correction fld?All 2.6% 7.8% 15.4% 84.6%________________________________________________________________________________Gasoline? All 1.3% 2.6% 9.1% 90.9%________________________________________________________________________________Freon? All 1.1% 2.3% 5.4% 94.6%________________________________________________________________________________Poppers, Locker Room, etcAll 0.9% 1.8% 3.7% 96.3%________________________________________________________________________________Glue? All 1.3% 3.8% 11.2% 88.8%
________________________________________________________________________________Paint, lacquer thinner? All 0.9% 3.3% 8.6% 91.4%________________________________________________________________________________Nitrous oxide, laughing gAll 2.1% 3.9% 9.9% 90.1%________________________________________________________________________________Octane booster? All 0.9% 1.7% 3.6% 96.4%________________________________________________________________________________Other sprays? All 2.1% 3.4% 7.5% 92.5%________________________________________________________________________________Other inhalants? All 4.0% 6.0% 16.9% 83.1%
________________________________________________________________________________
Table I-2: How often do you normally use inhalants?
Several Several About About Less ThanNever Every Times Times Once a Once a Once a
Used Day a Week a Month Month Year Year
All 85.8% 0.5% 1.8% 2.7% 1.8% 2.0% 5.5%
________________________________________________________________________________
Table I-3: Number of different kinds of inhalants used:
0 1 2-3 4+
All 71.3% 9.1% 11.4% 8.3%

8/6/2019 Spring Branch ISD - Westchester Academy - 2004 Texas School Survey of Drug and Alcohol Use
http://slidepdf.com/reader/full/spring-branch-isd-westchester-academy-2004-texas-school-survey-of-drug 21/83
Spring Branch ISD - Westchester AcademySpring 2004
________________________________________________________________________________
Table I-4: Average age of first use of:
All
Inhalants 11.5
________________________________________________________________________________
Table I-5: Since school began in the fall, on how many days (if any) have youattended class while high from inhalant use?
None 1-3 Days 4-9 Days 10+ Days
All 97% 1.7% 0.5% 0.8%
________________________________________________________________________________
Table I-6: School year use of inhalants by absences and conduct problems:
Average days absent due to illness or other reasons:
Inhalants Users: 4.3 days per studentInhalants Non-users: 4.1 days per student
Average days conduct problems reported:
Inhalants Users: 3.5 days per studentInhalants Non-users: 2.3 days per student
________________________________________________________________________________
Table I-7: About how many of your close friends use inhalants?
Never heardNone A Few Some Most All
All 79.1% 11.9 % 6.8% 1.8% 0.4%
________________________________________________________________________________
Table I-8: How dangerous do you think it is for kids your age to use inhalants?
Very Somewhat Not Very Not at All Do NotDangerous Dangerous Dangerous Dangerous Know
All 68.8% 20.6% 4.3% 2.9% 3.5%

8/6/2019 Spring Branch ISD - Westchester Academy - 2004 Texas School Survey of Drug and Alcohol Use
http://slidepdf.com/reader/full/spring-branch-isd-westchester-academy-2004-texas-school-survey-of-drug 22/83
Spring Branch ISD - Westchester AcademySpring 2004
________________________________________________________________________________
Table X-1: Since school began in the fall, have you gotten any information
on drugs or alcohol from the following sources?
Health class
No Yes
All 37.9% 62.1%
An assembly program
No Yes
All 22.8% 77.2%
Guidance counselor
No Yes
All 72.7% 27.3%
Science class
No Yes
All 52.1% 47.9%
Social studies class
No Yes
All 81.4% 18.6%
Student group session
No Yes
All 71.9% 28.1%
An invited school guest
No Yes
All 41.6% 58.4%
Some other school source
No Yes
All 60.3% 39.7%
Any school source
No Yes
All 32.2% 67.8%

8/6/2019 Spring Branch ISD - Westchester Academy - 2004 Texas School Survey of Drug and Alcohol Use
http://slidepdf.com/reader/full/spring-branch-isd-westchester-academy-2004-texas-school-survey-of-drug 23/83
Spring Branch ISD - Westchester AcademySpring 2004
________________________________________________________________________________
Table X-2: If you had a drug or alcohol problem and needed help, who would you
go to?
A counselor or program in school
No Yes
All 68.0% 32.0%
Another adult in school (such as a nurse or teacher)
No Yes
All 68.9% 31.1%
A counselor or program outside of school
No Yes
All 59.8% 40.2%
Your parents
No Yes
All 43.2% 56.8%
A medical doctor
No Yes
All 59.3% 40.7%
Your friends
No Yes
All 20.6% 79.4%
Another adult (a relative, clergyman, or other family friend)
No Yes
All 45.6% 54.4%
________________________________________________________________________________
Table X-3: Since school began in the fall, have you sought help, other thanfrom family or friends, for problems in any way connected withyour use of alcohol, marijuana, or other drugs?
No Yes
All 89.3% 10.7%
8/6/2019 Spring Branch ISD - Westchester Academy - 2004 Texas School Survey of Drug and Alcohol Use
http://slidepdf.com/reader/full/spring-branch-isd-westchester-academy-2004-texas-school-survey-of-drug 24/83
Spring Branch ISD - Westchester AcademySpring 2004
________________________________________________________________________________
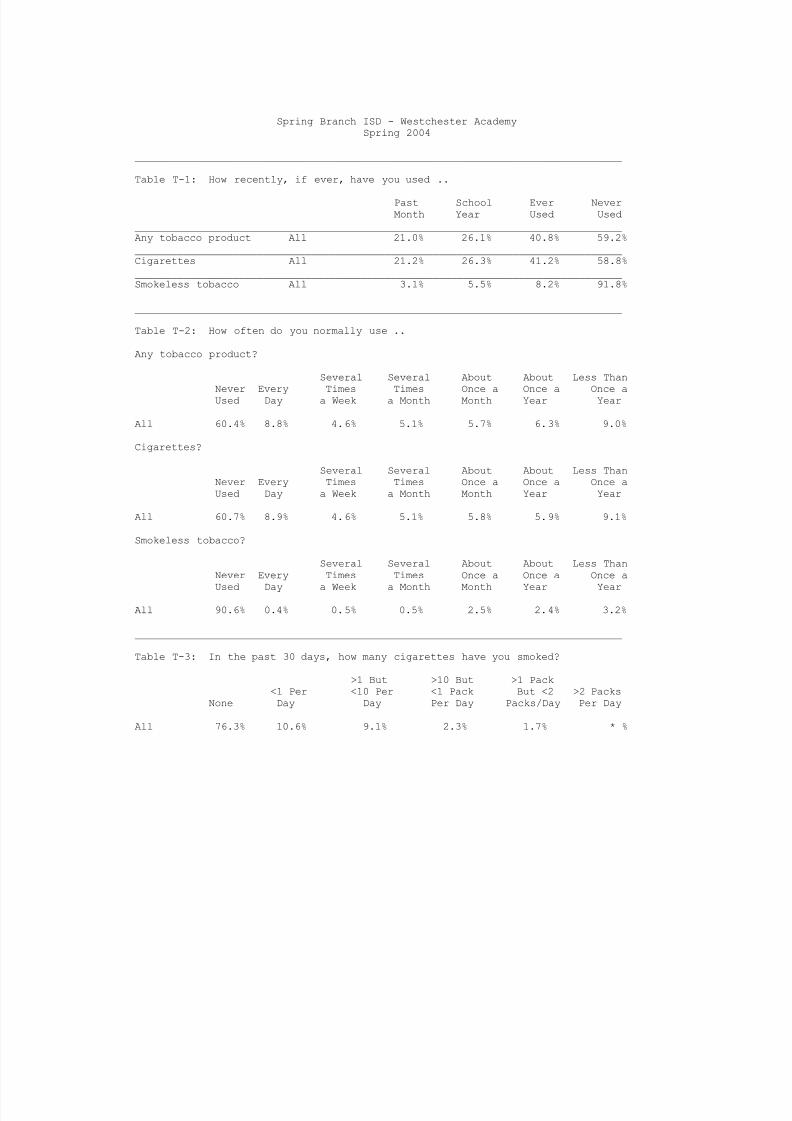
Table X-4: About how many of your friends:
Feel close to their parents?
None A Few Some Most All
All 3.1% 27.6% 29.7% 31.5% 8.1%
Sometimes carry weapons?
None A Few Some Most All
All 64.7% 19.6% 10.0% 2.7% 3.0%
Care about making good grades?
None A Few Some Most All
All 6.0% 10.7% 25.5% 43.2% 14.6%
Belong/want to belong to a gang?
None A Few Some Most All
All 70.0% 19.5% 5.9% 2.8% 1.8%
Wish they could drop out of school?
None A Few Some Most All
All 55.9% 27.5% 9.4% 4.2% 3.0%

8/6/2019 Spring Branch ISD - Westchester Academy - 2004 Texas School Survey of Drug and Alcohol Use
http://slidepdf.com/reader/full/spring-branch-isd-westchester-academy-2004-texas-school-survey-of-drug 25/83

8/6/2019 Spring Branch ISD - Westchester Academy - 2004 Texas School Survey of Drug and Alcohol Use
http://slidepdf.com/reader/full/spring-branch-isd-westchester-academy-2004-texas-school-survey-of-drug 26/83
Spring Branch ISD - Westchester AcademySpring 2004
Table B1: Prevalence and recency of use of selected substances by grade--> All students
Past School Ever NeverMonth Year Used Used
________________________________________________________________________________Tobacco All 21.0% 26.1% 40.8% 59.2%________________________________________________________________________________Alcohol All 32.7% 43.0% 64.4% 35.6%________________________________________________________________________________Inhalants All 12.1% 18.5% 31.5% 68.5%________________________________________________________________________________Any Illicit Drug All 21.9% 27.8% 37.2% 62.8%________________________________________________________________________________Marijuana All 20.0% 25.2% 34.5% 65.5%________________________________________________________________________________Marijuana Only All 4.5% 7.0% 10.9% 89.1%________________________________________________________________________________Cocaine or Crack All 4.4% 6.2% 13.2% 86.8%________________________________________________________________________________Cocaine All 4.0% 5.4% 11.6% 88.4%________________________________________________________________________________
Crack All 1.0% 1.3% 5.2% 94.8%________________________________________________________________________________Hallucinogens All 3.0% 6.1% 14.0% 86.0%________________________________________________________________________________Uppers All 5.8% 7.8% 13.1% 86.9%________________________________________________________________________________Downers All 5.8% 7.5% 12.8% 87.2%________________________________________________________________________________Rohypnol All 2.1% 2.6% 3.0% 97.0%________________________________________________________________________________Steroids All * % 0.5% 0.9% 99.1%________________________________________________________________________________Ecstasy All 4.1% 5.0% 12.9% 87.1%________________________________________________________________________________Heroin All 0.8% 0.8% 1.7% 98.3%

8/6/2019 Spring Branch ISD - Westchester Academy - 2004 Texas School Survey of Drug and Alcohol Use
http://slidepdf.com/reader/full/spring-branch-isd-westchester-academy-2004-texas-school-survey-of-drug 27/83
Spring Branch ISD - Westchester AcademySpring 2004
Table B2: Prevalence and recency of use of selected substances by grade--> Male students
Past School Ever NeverMonth Year Used Used
________________________________________________________________________________Tobacco All 16.3% 20.8% 33.2% 66.8%________________________________________________________________________________Alcohol All 30.9% 40.1% 60.2% 39.8%________________________________________________________________________________Inhalants All 11.9% 19.4% 28.2% 71.8%________________________________________________________________________________Any Illicit Drug All 17.1% 22.3% 31.4% 68.6%________________________________________________________________________________Marijuana All 14.3% 19.6% 30.4% 69.6%________________________________________________________________________________Marijuana Only All 3.9% 6.4% 10.2% 89.8%________________________________________________________________________________Cocaine or Crack All 4.3% 5.1% 11.7% 88.3%________________________________________________________________________________Cocaine All 4.3% 5.2% 11.0% 89.0%________________________________________________________________________________
Crack All * % * % 4.9% 95.1%________________________________________________________________________________Hallucinogens All 4.3% 5.8% 11.8% 88.2%________________________________________________________________________________Uppers All 5.1% 6.7% 9.5% 90.5%________________________________________________________________________________Downers All 5.2% 6.7% 9.7% 90.3%________________________________________________________________________________Rohypnol All 2.4% 3.3% 3.3% 96.7%________________________________________________________________________________Steroids All * % 0.9% 0.9% 99.1%________________________________________________________________________________Ecstasy All 5.4% 6.3% 10.9% 89.1%________________________________________________________________________________Heroin All 0.8% 0.8% 0.8% 99.2%
8/6/2019 Spring Branch ISD - Westchester Academy - 2004 Texas School Survey of Drug and Alcohol Use
http://slidepdf.com/reader/full/spring-branch-isd-westchester-academy-2004-texas-school-survey-of-drug 28/83
Spring Branch ISD - Westchester AcademySpring 2004
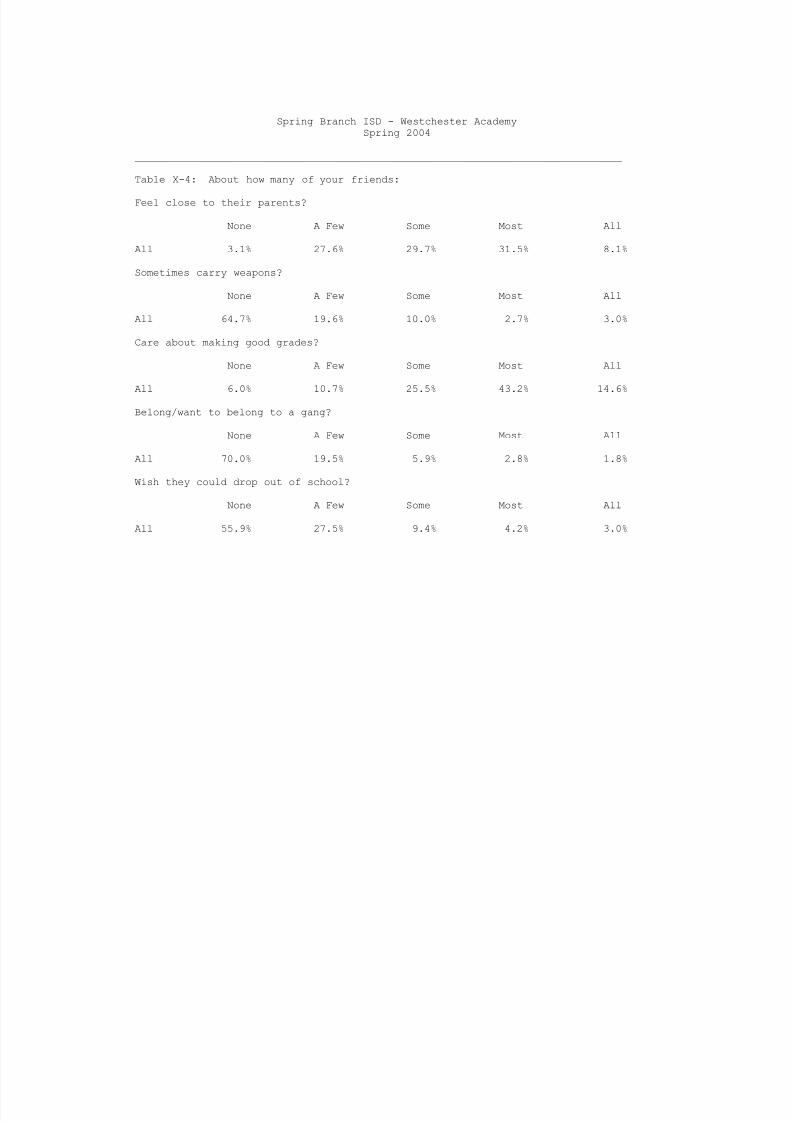
Table B3: Prevalence and recency of use of selected substances by grade--> Female students
Past School Ever NeverMonth Year Used Used
________________________________________________________________________________Tobacco All 25.9% 31.5% 49.1% 50.9%________________________________________________________________________________Alcohol All 34.1% 45.9% 68.8% 31.2%________________________________________________________________________________Inhalants All 12.5% 17.6% 34.8% 65.2%________________________________________________________________________________Any Illicit Drug All 26.8% 33.5% 43.3% 56.7%________________________________________________________________________________Marijuana All 25.9% 31.0% 38.7% 61.3%________________________________________________________________________________Marijuana Only All 5.3% 7.8% 11.9% 88.1%________________________________________________________________________________Cocaine or Crack All 4.6% 7.4% 14.9% 85.1%________________________________________________________________________________Cocaine All 3.7% 5.7% 12.4% 87.6%________________________________________________________________________________
Crack All 2.1% 2.9% 5.5% 94.5%________________________________________________________________________________Hallucinogens All 0.8% 5.8% 15.8% 84.2%________________________________________________________________________________Uppers All 6.6% 9.2% 17.2% 82.8%________________________________________________________________________________Downers All 6.6% 8.4% 16.4% 83.6%________________________________________________________________________________Rohypnol All 1.0% 1.0% 1.9% 98.1%________________________________________________________________________________Steroids All * % * % 0.9% 99.1%________________________________________________________________________________Ecstasy All 1.8% 2.8% 14.6% 85.4%________________________________________________________________________________Heroin All 0.9% 0.9% 2.7% 97.3%

8/6/2019 Spring Branch ISD - Westchester Academy - 2004 Texas School Survey of Drug and Alcohol Use
http://slidepdf.com/reader/full/spring-branch-isd-westchester-academy-2004-texas-school-survey-of-drug 29/83
Spring Branch ISD - Westchester AcademySpring 2004
Table B4: Prevalence and recency of use of selected substances by grade--> White students
Past School Ever NeverMonth Year Used Used
________________________________________________________________________________Tobacco All 29.1% 35.1% 50.3% 49.7%________________________________________________________________________________Alcohol All 41.5% 52.4% 73.1% 26.9%________________________________________________________________________________Inhalants All 11.1% 17.8% 28.2% 71.8%________________________________________________________________________________Any Illicit Drug All 27.1% 35.7% 43.6% 56.4%________________________________________________________________________________Marijuana All 25.5% 34.4% 42.0% 58.0%________________________________________________________________________________Marijuana Only All 7.0% 11.5% 13.1% 86.9%________________________________________________________________________________Cocaine or Crack All 4.9% 7.8% 12.9% 87.1%________________________________________________________________________________Cocaine All 4.9% 7.0% 12.1% 87.9%________________________________________________________________________________
Crack All * % 0.8% 4.6% 95.4%________________________________________________________________________________Hallucinogens All 4.8% 10.3% 21.9% 78.1%________________________________________________________________________________Uppers All 7.7% 11.3% 19.2% 80.8%________________________________________________________________________________Downers All 8.7% 11.4% 20.3% 79.7%________________________________________________________________________________Rohypnol All 3.5% 4.5% 5.4% 94.6%________________________________________________________________________________Steroids All * % * % * % 100.0%________________________________________________________________________________Ecstasy All 3.7% 5.6% 16.7% 83.3%________________________________________________________________________________Heroin All 1.0% 1.0% 2.0% 98.0%

8/6/2019 Spring Branch ISD - Westchester Academy - 2004 Texas School Survey of Drug and Alcohol Use
http://slidepdf.com/reader/full/spring-branch-isd-westchester-academy-2004-texas-school-survey-of-drug 30/83
Spring Branch ISD - Westchester AcademySpring 2004
Table B5: Prevalence and recency of use of selected substances by grade--> Black students
Past School Ever NeverMonth Year Used Used
________________________________________________________________________________Tobacco All * % * % * % 100.0%________________________________________________________________________________Alcohol All 8.6% 17.1% 54.8% 45.2%________________________________________________________________________________Inhalants All * % * % * % 100.0%________________________________________________________________________________Any Illicit Drug All * % * % * % 100.0%________________________________________________________________________________Marijuana All * % * % * % 100.0%________________________________________________________________________________Marijuana Only All * % * % * % 100.0%________________________________________________________________________________Cocaine or Crack All * % * % * % 100.0%________________________________________________________________________________Cocaine All * % * % * % 100.0%________________________________________________________________________________
Crack All * % * % * % 100.0%________________________________________________________________________________Hallucinogens All * % * % * % 100.0%________________________________________________________________________________Uppers All * % * % * % 100.0%________________________________________________________________________________Downers All * % * % * % 100.0%________________________________________________________________________________Rohypnol All * % * % * % 100.0%________________________________________________________________________________Steroids All * % * % * % 100.0%________________________________________________________________________________Ecstasy All * % * % * % 100.0%________________________________________________________________________________Heroin All * % * % * % 100.0%

8/6/2019 Spring Branch ISD - Westchester Academy - 2004 Texas School Survey of Drug and Alcohol Use
http://slidepdf.com/reader/full/spring-branch-isd-westchester-academy-2004-texas-school-survey-of-drug 31/83
Spring Branch ISD - Westchester AcademySpring 2004
Table B6: Prevalence and recency of use of selected substances by grade--> Mexican/American students
Past School Ever NeverMonth Year Used Used
________________________________________________________________________________Tobacco All 15.8% 18.2% 38.1% 61.9%________________________________________________________________________________Alcohol All 32.4% 41.9% 60.3% 39.7%________________________________________________________________________________Inhalants All 19.4% 27.2% 41.4% 58.6%________________________________________________________________________________Any Illicit Drug All 18.8% 22.6% 37.8% 62.2%________________________________________________________________________________Marijuana All 16.5% 17.9% 33.1% 66.9%________________________________________________________________________________Marijuana Only All 2.7% 4.1% 12.7% 87.3%________________________________________________________________________________Cocaine or Crack All 5.2% 5.2% 13.8% 86.2%________________________________________________________________________________Cocaine All 3.9% 3.9% 10.0% 90.0%________________________________________________________________________________
Crack All 3.1% 3.1% 6.9% 93.1%________________________________________________________________________________Hallucinogens All * % 1.6% 6.8% 93.2%________________________________________________________________________________Uppers All 5.4% 6.6% 9.9% 90.1%________________________________________________________________________________Downers All 4.1% 5.3% 7.4% 92.6%________________________________________________________________________________Rohypnol All * % * % * % 100.0%________________________________________________________________________________Steroids All * % 1.4% 1.4% 98.6%________________________________________________________________________________Ecstasy All 4.9% 4.9% 9.5% 90.5%________________________________________________________________________________Heroin All * % * % * % 100.0%

8/6/2019 Spring Branch ISD - Westchester Academy - 2004 Texas School Survey of Drug and Alcohol Use
http://slidepdf.com/reader/full/spring-branch-isd-westchester-academy-2004-texas-school-survey-of-drug 32/83
Spring Branch ISD - Westchester AcademySpring 2004
Table B7: Prevalence and recency of use of selected substances by grade--> Students reporting A and B grades
Past School Ever NeverMonth Year Used Used
________________________________________________________________________________Tobacco All 17.9% 21.5% 37.7% 62.3%________________________________________________________________________________Alcohol All 28.7% 37.7% 61.7% 38.3%________________________________________________________________________________Inhalants All 9.8% 15.5% 27.2% 72.8%________________________________________________________________________________Any Illicit Drug All 18.6% 25.2% 33.7% 66.3%________________________________________________________________________________Marijuana All 16.5% 22.6% 30.4% 69.6%________________________________________________________________________________Marijuana Only All 4.9% 8.3% 11.9% 88.1%________________________________________________________________________________Cocaine or Crack All 2.4% 3.6% 9.1% 90.9%________________________________________________________________________________Cocaine All 1.8% 3.1% 8.1% 91.9%________________________________________________________________________________
Crack All 0.6% 0.6% 3.4% 96.6%________________________________________________________________________________Hallucinogens All 1.1% 5.3% 12.8% 87.2%________________________________________________________________________________Uppers All 3.7% 6.0% 11.7% 88.3%________________________________________________________________________________Downers All 3.7% 5.9% 12.3% 87.7%________________________________________________________________________________Rohypnol All 1.2% 1.2% 1.8% 98.2%________________________________________________________________________________Steroids All * % * % 0.6% 99.4%________________________________________________________________________________Ecstasy All 2.3% 2.9% 11.0% 89.0%________________________________________________________________________________Heroin All 0.5% 0.5% 1.1% 98.9%
8/6/2019 Spring Branch ISD - Westchester Academy - 2004 Texas School Survey of Drug and Alcohol Use
http://slidepdf.com/reader/full/spring-branch-isd-westchester-academy-2004-texas-school-survey-of-drug 33/83
Spring Branch ISD - Westchester AcademySpring 2004
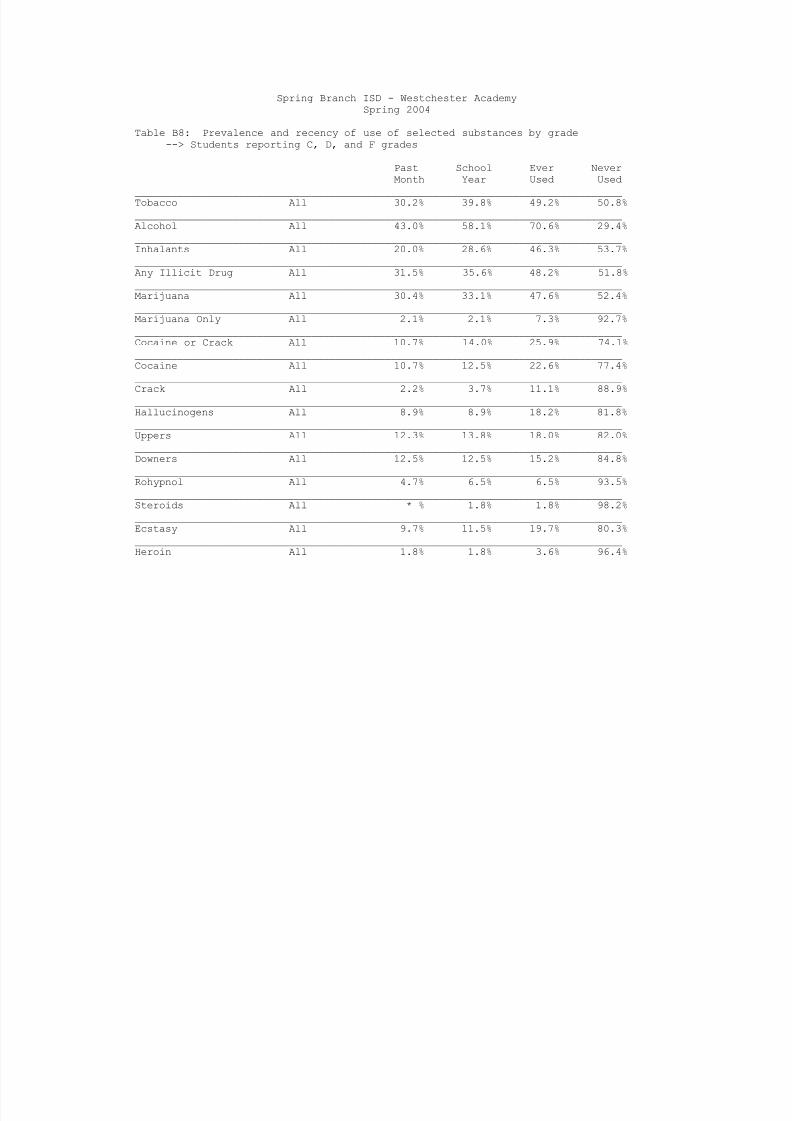
Table B8: Prevalence and recency of use of selected substances by grade--> Students reporting C, D, and F grades
Past School Ever NeverMonth Year Used Used
________________________________________________________________________________Tobacco All 30.2% 39.8% 49.2% 50.8%________________________________________________________________________________Alcohol All 43.0% 58.1% 70.6% 29.4%________________________________________________________________________________Inhalants All 20.0% 28.6% 46.3% 53.7%________________________________________________________________________________Any Illicit Drug All 31.5% 35.6% 48.2% 51.8%________________________________________________________________________________Marijuana All 30.4% 33.1% 47.6% 52.4%________________________________________________________________________________Marijuana Only All 2.1% 2.1% 7.3% 92.7%________________________________________________________________________________Cocaine or Crack All 10.7% 14.0% 25.9% 74.1%________________________________________________________________________________Cocaine All 10.7% 12.5% 22.6% 77.4%________________________________________________________________________________
Crack All 2.2% 3.7% 11.1% 88.9%________________________________________________________________________________Hallucinogens All 8.9% 8.9% 18.2% 81.8%________________________________________________________________________________Uppers All 12.3% 13.8% 18.0% 82.0%________________________________________________________________________________Downers All 12.5% 12.5% 15.2% 84.8%________________________________________________________________________________Rohypnol All 4.7% 6.5% 6.5% 93.5%________________________________________________________________________________Steroids All * % 1.8% 1.8% 98.2%________________________________________________________________________________Ecstasy All 9.7% 11.5% 19.7% 80.3%________________________________________________________________________________Heroin All 1.8% 1.8% 3.6% 96.4%

8/6/2019 Spring Branch ISD - Westchester Academy - 2004 Texas School Survey of Drug and Alcohol Use
http://slidepdf.com/reader/full/spring-branch-isd-westchester-academy-2004-texas-school-survey-of-drug 34/83
Spring Branch ISD - Westchester AcademySpring 2004
Table B9: Prevalence and recency of use of selected substances by grade--> Students living with two parents
Past School Ever NeverMonth Year Used Used
________________________________________________________________________________Tobacco All 19.6% 23.9% 40.3% 59.7%________________________________________________________________________________Alcohol All 34.4% 44.5% 62.1% 37.9%________________________________________________________________________________Inhalants All 10.9% 17.1% 28.8% 71.2%________________________________________________________________________________Any Illicit Drug All 21.2% 26.2% 35.3% 64.7%________________________________________________________________________________Marijuana All 18.7% 23.9% 33.7% 66.3%________________________________________________________________________________Marijuana Only All 3.4% 6.0% 10.5% 89.5%________________________________________________________________________________Cocaine or Crack All 5.8% 6.5% 13.4% 86.6%________________________________________________________________________________Cocaine All 5.1% 5.8% 12.1% 87.9%________________________________________________________________________________
Crack All 1.6% 1.6% 7.3% 92.7%________________________________________________________________________________Hallucinogens All 4.3% 7.9% 14.9% 85.1%________________________________________________________________________________Uppers All 7.2% 8.6% 13.2% 86.8%________________________________________________________________________________Downers All 5.9% 8.0% 12.0% 88.0%________________________________________________________________________________Rohypnol All 1.4% 2.1% 2.1% 97.9%________________________________________________________________________________Steroids All * % 0.7% 0.7% 99.3%________________________________________________________________________________Ecstasy All 5.3% 6.0% 13.1% 86.9%________________________________________________________________________________Heroin All 0.7% 0.7% 2.1% 97.9%

8/6/2019 Spring Branch ISD - Westchester Academy - 2004 Texas School Survey of Drug and Alcohol Use
http://slidepdf.com/reader/full/spring-branch-isd-westchester-academy-2004-texas-school-survey-of-drug 35/83
Spring Branch ISD - Westchester AcademySpring 2004
Table B10: Prevalence and recency of use of selected substances by grade--> Students not living with two parents
Past School Ever NeverMonth Year Used Used
________________________________________________________________________________Tobacco All 24.1% 30.5% 42.9% 57.1%________________________________________________________________________________Alcohol All 29.9% 41.0% 69.3% 30.7%________________________________________________________________________________Inhalants All 14.5% 21.4% 37.0% 63.0%________________________________________________________________________________Any Illicit Drug All 22.8% 30.3% 40.5% 59.5%________________________________________________________________________________Marijuana All 21.9% 27.3% 36.1% 63.9%________________________________________________________________________________Marijuana Only All 5.4% 7.9% 11.0% 89.0%________________________________________________________________________________Cocaine or Crack All 2.4% 5.8% 13.1% 86.9%________________________________________________________________________________Cocaine All 2.4% 4.8% 11.2% 88.8%
________________________________________________________________________________Crack All * % 1.0% 2.0% 98.0%________________________________________________________________________________Hallucinogens All 1.0% 3.4% 12.9% 87.1%________________________________________________________________________________Uppers All 3.6% 6.8% 13.3% 86.7%________________________________________________________________________________Downers All 5.9% 6.9% 14.5% 85.5%________________________________________________________________________________Rohypnol All 3.4% 3.4% 4.6% 95.4%________________________________________________________________________________Steroids All * % * % 1.1% 98.9%________________________________________________________________________________Ecstasy All 2.2% 3.4% 13.1% 86.9%________________________________________________________________________________Heroin All 1.1% 1.1% 1.1% 98.9%

8/6/2019 Spring Branch ISD - Westchester Academy - 2004 Texas School Survey of Drug and Alcohol Use
http://slidepdf.com/reader/full/spring-branch-isd-westchester-academy-2004-texas-school-survey-of-drug 36/83
Spring Branch ISD - Westchester AcademySpring 2004
Table B11: Prevalence and recency of use of selected substances by grade
--> Students would seek help from adults for substance abuse problems
Past School Ever Never
Month Year Used Used________________________________________________________________________________Tobacco All 17.6% 20.9% 32.9% 67.1%________________________________________________________________________________Alcohol All 31.1% 38.4% 58.3% 41.7%________________________________________________________________________________Inhalants All 9.8% 15.2% 24.7% 75.3%________________________________________________________________________________Any Illicit Drug All 19.9% 25.2% 30.7% 69.3%________________________________________________________________________________Marijuana All 18.3% 23.3% 28.2% 71.8%________________________________________________________________________________Marijuana Only All 3.7% 5.9% 8.5% 91.5%________________________________________________________________________________Cocaine or Crack All 4.4% 6.2% 10.6% 89.4%________________________________________________________________________________Cocaine All 3.8% 5.1% 8.9% 91.1%
________________________________________________________________________________Crack All 0.6% 1.1% 4.8% 95.2%________________________________________________________________________________Hallucinogens All 2.5% 6.8% 13.8% 86.2%________________________________________________________________________________Uppers All 6.4% 8.7% 13.1% 86.9%________________________________________________________________________________Downers All 5.7% 8.0% 11.9% 88.1%________________________________________________________________________________Rohypnol All 1.9% 2.5% 3.1% 96.9%________________________________________________________________________________Steroids All * % 0.6% 1.2% 98.8%________________________________________________________________________________Ecstasy All 4.5% 5.1% 12.4% 87.6%________________________________________________________________________________Heroin All 1.2% 1.2% 1.2% 98.8%

8/6/2019 Spring Branch ISD - Westchester Academy - 2004 Texas School Survey of Drug and Alcohol Use
http://slidepdf.com/reader/full/spring-branch-isd-westchester-academy-2004-texas-school-survey-of-drug 37/83
Spring Branch ISD - Westchester AcademySpring 2004
Table B12: Prevalence and recency of use of selected substances by grade--> Students wouldn't seek help from adults for substance abuse problems
Past School Ever NeverMonth Year Used Used
________________________________________________________________________________Tobacco All 35.7% 43.7% 63.6% 36.4%________________________________________________________________________________Alcohol All 38.4% 56.0% 79.0% 21.0%________________________________________________________________________________Inhalants All 16.7% 25.2% 47.6% 52.4%________________________________________________________________________________Any Illicit Drug All 28.6% 37.3% 53.3% 46.7%________________________________________________________________________________Marijuana All 25.4% 32.5% 49.9% 50.1%________________________________________________________________________________Marijuana Only All 5.8% 9.9% 11.6% 88.4%________________________________________________________________________________Cocaine or Crack All 5.4% 7.3% 23.5% 76.5%________________________________________________________________________________Cocaine All 5.5% 7.4% 22.2% 77.8%________________________________________________________________________________
Crack All 2.3% 2.3% 7.5% 92.5%________________________________________________________________________________Hallucinogens All 3.5% 3.5% 15.2% 84.8%________________________________________________________________________________Uppers All 5.1% 6.8% 15.6% 84.4%________________________________________________________________________________Downers All 7.2% 7.2% 18.1% 81.9%________________________________________________________________________________Rohypnol All 3.2% 3.2% 3.2% 96.8%________________________________________________________________________________Steroids All * % * % * % 100.0%________________________________________________________________________________Ecstasy All 3.5% 5.5% 17.3% 82.7%________________________________________________________________________________Heroin All * % * % 3.5% 96.5%

8/6/2019 Spring Branch ISD - Westchester Academy - 2004 Texas School Survey of Drug and Alcohol Use
http://slidepdf.com/reader/full/spring-branch-isd-westchester-academy-2004-texas-school-survey-of-drug 38/83
Spring Branch ISD - Westchester AcademySpring 2004
Table B13: Prevalence and recency of use of selected substances by grade--> Students living in town three years or less
Past School Ever NeverMonth Year Used Used
________________________________________________________________________________Tobacco All 13.3% 21.5% 31.5% 68.5%________________________________________________________________________________Alcohol All 16.4% 26.5% 51.4% 48.6%________________________________________________________________________________Inhalants All 11.8% 17.7% 37.2% 62.8%________________________________________________________________________________Any Illicit Drug All 18.9% 24.8% 28.8% 71.2%________________________________________________________________________________Marijuana All 17.2% 23.1% 25.1% 74.9%________________________________________________________________________________Marijuana Only All 7.5% 10.4% 10.4% 89.6%________________________________________________________________________________Cocaine or Crack All 3.7% 3.7% 8.7% 91.3%________________________________________________________________________________Cocaine All 3.8% 3.8% 6.8% 93.2%________________________________________________________________________________
Crack All * % * % 2.0% 98.0%________________________________________________________________________________Hallucinogens All 1.6% 4.0% 11.9% 88.1%________________________________________________________________________________Uppers All 4.4% 4.4% 4.4% 95.6%________________________________________________________________________________Downers All 6.3% 6.3% 6.3% 93.7%________________________________________________________________________________Rohypnol All 3.8% 3.8% 3.8% 96.2%________________________________________________________________________________Steroids All * % 2.1% 2.1% 97.9%________________________________________________________________________________Ecstasy All 1.7% 1.7% 3.7% 96.3%________________________________________________________________________________Heroin All * % * % * % 100.0%

8/6/2019 Spring Branch ISD - Westchester Academy - 2004 Texas School Survey of Drug and Alcohol Use
http://slidepdf.com/reader/full/spring-branch-isd-westchester-academy-2004-texas-school-survey-of-drug 39/83
Spring Branch ISD - Westchester AcademySpring 2004
Table B14: Prevalence and recency of use of selected substances by grade--> Students living in town more than three years
Past School Ever NeverMonth Year Used Used
________________________________________________________________________________Tobacco All 22.6% 26.8% 43.3% 56.7%________________________________________________________________________________Alcohol All 37.3% 47.9% 68.6% 31.4%________________________________________________________________________________Inhalants All 12.5% 19.2% 29.3% 70.7%________________________________________________________________________________Any Illicit Drug All 22.1% 28.1% 39.3% 60.7%________________________________________________________________________________Marijuana All 20.1% 25.3% 36.9% 63.1%________________________________________________________________________________Marijuana Only All 3.7% 6.1% 11.3% 88.7%________________________________________________________________________________Cocaine or Crack All 4.7% 6.4% 14.1% 85.9%________________________________________________________________________________Cocaine All 4.2% 5.4% 12.6% 87.4%________________________________________________________________________________
Crack All 1.3% 1.8% 6.2% 93.8%________________________________________________________________________________Hallucinogens All 2.9% 6.3% 14.3% 85.7%________________________________________________________________________________Uppers All 5.7% 8.4% 15.2% 84.8%________________________________________________________________________________Downers All 5.2% 7.4% 13.8% 86.2%________________________________________________________________________________Rohypnol All 1.7% 2.3% 2.8% 97.2%________________________________________________________________________________Steroids All * % * % 0.5% 99.5%________________________________________________________________________________Ecstasy All 4.8% 6.0% 15.3% 84.7%________________________________________________________________________________Heroin All 1.1% 1.1% 2.2% 97.8%

8/6/2019 Spring Branch ISD - Westchester Academy - 2004 Texas School Survey of Drug and Alcohol Use
http://slidepdf.com/reader/full/spring-branch-isd-westchester-academy-2004-texas-school-survey-of-drug 40/83
Spring Branch ISD - Westchester AcademySpring 2004
The FREQ Procedure
GENDER
q1 Frequency Percent
_______________________________Female 107.9432 46.70Male 123.2073 53.30
Frequency Missing = 0.8494949495
GRADE
q2 Frequency Percent____________________________________Grade 7 57.51667 24.79Grade 8 56.06667 24.17Grade 9 42.53333 18.33Grade 10 37.21667 16.04Grade 11 18.36667 7.92Grade 12 20.3 8.75
LIVE WITH BOTH PARENTS
q3 Frequency Percent___________________________________No 87.24772 38.06Yes 141.9707 61.94
Frequency Missing = 2.7815428218
AGE
q4 Frequency Percent______________________________________
12 20.36408 8.7813 53.92645 23.2414 49.30288 21.2515 44.21481 19.0616 28.04572 12.0917 17.3605 7.4818 17.77056 7.6619 or older 1.015 0.44
ETHNICITY
q5 Frequency Percent_________________________________________African/American 10.57225 4.61Asian/American 12.62138 5.50Mexican/American 74.86166 32.63
Native/American 0.904965 0.39Other 23.68885 10.32White 106.8053 46.55
Frequency Missing = 2.5455555556
The frequencies have been weighted so that theanalysis reflects the distribution of students by grade
level in the campus

8/6/2019 Spring Branch ISD - Westchester Academy - 2004 Texas School Survey of Drug and Alcohol Use
http://slidepdf.com/reader/full/spring-branch-isd-westchester-academy-2004-texas-school-survey-of-drug 41/83
Spring Branch ISD - Westchester AcademySpring 2004
The FREQ Procedure
ON AVERAGE WHAT GRADES DO YOU GET
q6 Frequency Percent___________________________________Mostly A's 72.22114 31.59Mostly B's 99.19315 43.39Mostly C's 48.09538 21.04Mostly D's 6.534699 2.86Mostly F's 2.548485 1.11
Frequency Missing = 3.4071338384
LENGTH OF TIME IN THIS DISTRICT
q7 Frequency Percent__________________________________<1 year 16.25128 7.122-3 years 36.30852 15.91
>4 years 175.7112 76.97
Frequency Missing = 3.728989899
DO YOU HAVE A JOB
q8 Frequency Percent___________________________________No 194.4555 85.19Yes 33.81554 14.81
Frequency Missing = 3.728989899
DO YOU GET AN ALLOWANCE
q9 Frequency Percent___________________________________No 111.6224 49.23Yes 115.0971 50.77
Frequency Missing = 5.2805702183
EITHER PARENT COLLEGE GRADUATE
q10 Frequency Percent___________________________________Don't Know 50.39289 22.08No 65.20023 28.56Yes 112.6779 49.36
Frequency Missing = 3.728989899
The frequencies have been weighted so that theanalysis reflects the distribution of students by grade
level in the campus

8/6/2019 Spring Branch ISD - Westchester Academy - 2004 Texas School Survey of Drug and Alcohol Use
http://slidepdf.com/reader/full/spring-branch-isd-westchester-academy-2004-texas-school-survey-of-drug 42/83
Spring Branch ISD - Westchester AcademySpring 2004
The FREQ Procedure
QUALIFY FOR FREE/REDUCED PRICE LUNCH
q11 Frequency Percent
___________________________________Don't Know 28.20389 12.41No 117.8368 51.85Yes 81.20326 35.73
Frequency Missing = 4.7560732323
PARTICIPATE IN ATHLETICS
q12a Frequency Percent___________________________________No 104.3124 46.72Yes 118.9406 53.28
Frequency Missing = 8.7470066572
PARTICIPATE IN BAND/ORCHESTRA
q12b Frequency Percent___________________________________No 188.3215 94.10Yes 11.80723 5.90
Frequency Missing = 31.871276292
PARTICIPATE IN CHOIR
q12c Frequency Percent___________________________________No 174.1779 90.34
Yes 18.63324 9.66
Frequency Missing = 39.188821425
PARTICIPATE IN DRAMA/SPEECH
q12d Frequency Percent___________________________________No 141.0487 72.91Yes 52.41319 27.09
Frequency Missing = 38.53813439
PARTICIPATE IN DRILL TEAM/CHEERLEADING
q12e Frequency Percent___________________________________No 161.7906 83.84Yes 31.19516 16.16
Frequency Missing = 39.014225162
The frequencies have been weighted so that theanalysis reflects the distribution of students by grade
level in the campus

8/6/2019 Spring Branch ISD - Westchester Academy - 2004 Texas School Survey of Drug and Alcohol Use
http://slidepdf.com/reader/full/spring-branch-isd-westchester-academy-2004-texas-school-survey-of-drug 43/83
Spring Branch ISD - Westchester AcademySpring 2004
The FREQ Procedure
PARTICIPATE IN STUDENT GOVERNMENT
q12f Frequency Percent
___________________________________No 182.3147 97.08Yes 5.483449 2.92
Frequency Missing = 44.201881053
PARTICIPATE IN SCHOOL NEWSPAPER/YEARBOOK
q12g Frequency Percent___________________________________No 175.7726 88.65Yes 22.49784 11.35
Frequency Missing = 33.729520861
PARTICIPATE IN ACADEMIC CLUBS/SOCIETIES q12h Frequency Percent___________________________________No 170.1966 83.24Yes 34.27034 16.76
Frequency Missing = 27.53310756
PARTICIPATE IN SERVICE CLUBS
q12i Frequency Percent___________________________________No 184.2244 89.18Yes 22.34323 10.82
Frequency Missing = 25.432412734
PARTICIPATE IN VOE/DE/WORK-STUDY
q12j Frequency Percent___________________________________No 199.2258 96.78Yes 6.632652 3.22
Frequency Missing = 26.14156148
PARTICIPATE IN OTHER CLUBS
q12k Frequency Percent___________________________________
No 141.6224 66.50Yes 71.35866 33.50
Frequency Missing = 19.018946266
The frequencies have been weighted so that theanalysis reflects the distribution of students by grade
level in the campus

8/6/2019 Spring Branch ISD - Westchester Academy - 2004 Texas School Survey of Drug and Alcohol Use
http://slidepdf.com/reader/full/spring-branch-isd-westchester-academy-2004-texas-school-survey-of-drug 44/83
Spring Branch ISD - Westchester AcademySpring 2004
The FREQ Procedure
DO YOU FEEL SAFE IN YOUR HOME
q13a Frequency Percent
________________________________________Very Safe 168.2739 73.34Somewhat Safe 56.16725 24.48Not Very Safe 1.015 0.44Not Safe At All 1.027083 0.45Don't Know 2.959131 1.29
Frequency Missing = 2.5576388889
DO YOU FEEL SAFE IN YOUR NEIGHBORHOOD
q13b Frequency Percent________________________________________Very Safe 92.05159 40.49Somewhat Safe 100.4024 44.16Not Very Safe 25.51116 11.22
Not Safe At All 6.534699 2.87Don't Know 2.837012 1.25
Frequency Missing = 4.6631410623
DO YOU FEEL SAFE AT SCHOOL
q13c Frequency Percent________________________________________Very Safe 113.1735 49.19Somewhat Safe 82.95771 36.06Not Very Safe 14.88444 6.47Not Safe At All 10.23448 4.45Don't Know 8.81779 3.83
Frequency Missing = 1.9320478723
FRIENDS FEELING CLOSE TO THEIR PARENTS
q14a Frequency Percent______________________________None 7.051247 3.05A Few 63.83216 27.62Some 68.7292 29.74Most 72.85822 31.53All 18.62422 8.06
Frequency Missing = 0.904964539
The frequencies have been weighted so that theanalysis reflects the distribution of students by grade
level in the campus
8/6/2019 Spring Branch ISD - Westchester Academy - 2004 Texas School Survey of Drug and Alcohol Use
http://slidepdf.com/reader/full/spring-branch-isd-westchester-academy-2004-texas-school-survey-of-drug 45/83
Spring Branch ISD - Westchester AcademySpring 2004
The FREQ Procedure
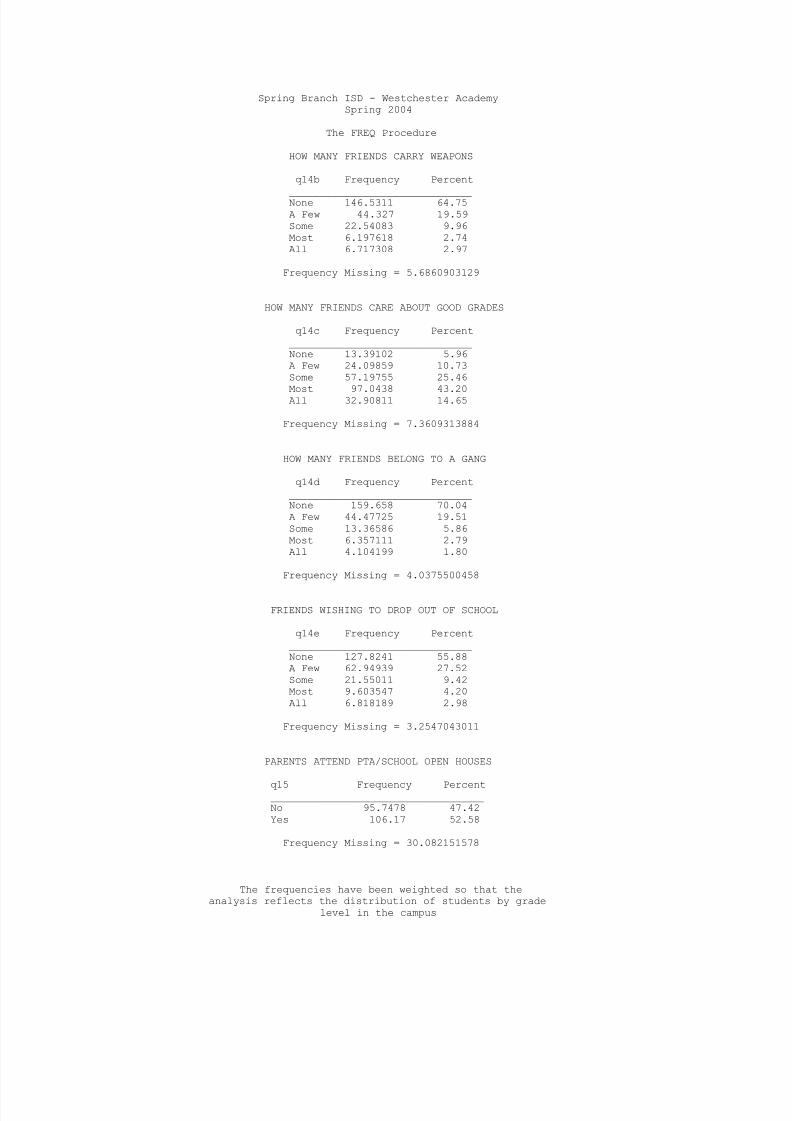
HOW MANY FRIENDS CARRY WEAPONS
q14b Frequency Percent
______________________________None 146.5311 64.75A Few 44.327 19.59Some 22.54083 9.96Most 6.197618 2.74All 6.717308 2.97
Frequency Missing = 5.6860903129
HOW MANY FRIENDS CARE ABOUT GOOD GRADES
q14c Frequency Percent______________________________None 13.39102 5.96A Few 24.09859 10.73Some 57.19755 25.46
Most 97.0438 43.20All 32.90811 14.65
Frequency Missing = 7.3609313884
HOW MANY FRIENDS BELONG TO A GANG
q14d Frequency Percent______________________________None 159.658 70.04A Few 44.47725 19.51Some 13.36586 5.86Most 6.357111 2.79All 4.104199 1.80
Frequency Missing = 4.0375500458
FRIENDS WISHING TO DROP OUT OF SCHOOL
q14e Frequency Percent______________________________None 127.8241 55.88A Few 62.94939 27.52Some 21.55011 9.42Most 9.603547 4.20All 6.818189 2.98
Frequency Missing = 3.2547043011
PARENTS ATTEND PTA/SCHOOL OPEN HOUSES
q15 Frequency Percent___________________________________No 95.7478 47.42Yes 106.17 52.58
Frequency Missing = 30.082151578
The frequencies have been weighted so that theanalysis reflects the distribution of students by grade
level in the campus

8/6/2019 Spring Branch ISD - Westchester Academy - 2004 Texas School Survey of Drug and Alcohol Use
http://slidepdf.com/reader/full/spring-branch-isd-westchester-academy-2004-texas-school-survey-of-drug 46/83
Spring Branch ISD - Westchester AcademySpring 2004
The FREQ Procedure
EVER INHALED SPRAY PAINT FOR KICKS
q16a Frequency Percent
___________________________________________Never Heard/Used 194.5024 84.90In Your Lifetime 23.25089 10.15Since School Began 2.891578 1.26In the Past Month 8.451434 3.69
Frequency Missing = 2.9036616162
EVER INHALED WHITEOUT FOR KICKS
q16b Frequency Percent___________________________________________Never Heard/Used 194.0965 84.63In Your Lifetime 17.40853 7.59Since School Began 11.97274 5.22In the Past Month 5.862793 2.56
Frequency Missing = 2.6594240275
EVER INHALED GASOLINE FOR KICKS
q16c Frequency Percent___________________________________________Never Heard/Used 207.4212 90.92In Your Lifetime 14.69468 6.44Since School Began 3.065033 1.34In the Past Month 2.959131 1.30
Frequency Missing = 3.8599616619
EVER INHALED FREON FOR KICKS
q16d Frequency Percent___________________________________________Never Heard/Used 209.9847 94.56In Your Lifetime 6.878679 3.10Since School Began 2.769459 1.25In the Past Month 2.43552 1.10
Frequency Missing = 9.9316457904
EVER INHALED POPPERS, ETC. FOR KICKS
q16e Frequency Percent___________________________________________Never Heard/Used 214.8526 96.26
In Your Lifetime 4.367568 1.96Since School Began 1.919965 0.86In the Past Month 2.054167 0.92
Frequency Missing = 8.8057066114
The frequencies have been weighted so that theanalysis reflects the distribution of students by grade
level in the campus

8/6/2019 Spring Branch ISD - Westchester Academy - 2004 Texas School Survey of Drug and Alcohol Use
http://slidepdf.com/reader/full/spring-branch-isd-westchester-academy-2004-texas-school-survey-of-drug 47/83
Spring Branch ISD - Westchester AcademySpring 2004
The FREQ Procedure
EVER INHALED GLUE FOR KICKS
q16f Frequency Percent
___________________________________________Never Heard/Used 199.828 88.79In Your Lifetime 16.79522 7.46Since School Began 5.606472 2.49In the Past Month 2.837012 1.26
Frequency Missing = 6.9332624113
EVER INHALED PAINT THINNERS FOR KICKS
q16g Frequency Percent___________________________________________Never Heard/Used 204.0597 91.38In Your Lifetime 11.89579 5.33Since School Began 5.428884 2.43In the Past Month 1.932048 0.87
Frequency Missing = 8.6835878171
EVER INHALED NITROUS OXIDE FOR KICKS
q16h Frequency Percent___________________________________________Never Heard/Used 200.8498 90.09In Your Lifetime 13.49543 6.05Since School Began 3.906578 1.75In the Past Month 4.701507 2.11
Frequency Missing = 9.0467138353
EVER INHALED OCTANE BOOSTER FOR KICKS
q16i Frequency Percent
___________________________________________Never Heard/Used 218.1073 96.39In Your Lifetime 4.367568 1.93Since School Began 1.864495 0.82In the Past Month 1.932048 0.85
Frequency Missing = 5.7285906942
EVER INHALED OTHER SPRAYS FOR KICKS
q16j Frequency Percent___________________________________________Never Heard/Used 209.234 92.52In Your Lifetime 9.199143 4.07
Since School Began 2.947048 1.30In the Past Month 4.76906 2.11
Frequency Missing = 5.8507094885
The frequencies have been weighted so that theanalysis reflects the distribution of students by grade
level in the campus

8/6/2019 Spring Branch ISD - Westchester Academy - 2004 Texas School Survey of Drug and Alcohol Use
http://slidepdf.com/reader/full/spring-branch-isd-westchester-academy-2004-texas-school-survey-of-drug 48/83
Spring Branch ISD - Westchester AcademySpring 2004
The FREQ Procedure
EVER INHALED OTHER INHALANTS FOR KICKS
q16k Frequency Percent
___________________________________________Never Heard/Used 187.3763 83.10In Your Lifetime 24.52634 10.88Since School Began 4.646038 2.06In the Past Month 8.939909 3.96
Frequency Missing = 6.5114364389
RECENT CIGARETTE USE
q17a Frequency Percent___________________________________________Never Heard/Used 134.7427 58.83In Your Lifetime 34.03013 14.86
Since School Began 11.62258 5.07
In the Past Month 48.64542 21.24
Frequency Missing = 2.9591312057
RECENT SMOKELESS TOBACCO USE
q17b Frequency Percent___________________________________________Never Heard/Used 209.4003 91.76In Your Lifetime 6.177586 2.71Since School Began 5.500553 2.41In the Past Month 7.125033 3.12
Frequency Missing = 3.7965428218
RECENT BEER USE
q17c Frequency Percent___________________________________________Never Heard/Used 108.123 48.20In Your Lifetime 40.86745 18.22Since School Began 25.08327 11.18In the Past Month 50.26979 22.41
Frequency Missing = 7.6565044838
RECENT WINE COOLER USE
q17d Frequency Percent___________________________________________Never Heard/Used 129.0557 59.23
In Your Lifetime 42.12364 19.33Since School Began 15.81767 7.26In the Past Month 30.87939 14.17
Frequency Missing = 14.123650948
The frequencies have been weighted so that theanalysis reflects the distribution of students by grade
level in the campus

8/6/2019 Spring Branch ISD - Westchester Academy - 2004 Texas School Survey of Drug and Alcohol Use
http://slidepdf.com/reader/full/spring-branch-isd-westchester-academy-2004-texas-school-survey-of-drug 49/83
Spring Branch ISD - Westchester AcademySpring 2004
The FREQ Procedure
RECENT WINE USE
q17e Frequency Percent
___________________________________________Never Heard/Used 105.4231 46.76In Your Lifetime 56.51358 25.07Since School Began 24.15827 10.72In the Past Month 39.33906 17.45
Frequency Missing = 6.5660023103
RECENT LIQUOR USE
q17f Frequency Percent___________________________________________Never Heard/Used 121.3848 54.05In Your Lifetime 34.56079 15.39Since School Began 18.89771 8.41In the Past Month 49.74116 22.15
Frequency Missing = 7.4154972598
RECENT MARIJUANA USE
q18a Frequency Percent___________________________________________Never Heard/Used 150.0737 65.47In Your Lifetime 21.26953 9.28Since School Began 11.96064 5.22In the Past Month 45.91454 20.03
Frequency Missing = 2.7815428218
RECENT COCAINE USE
q18b Frequency Percent
___________________________________________Never Heard/Used 201.5551 88.39In Your Lifetime 14.17932 6.22Since School Began 3.120502 1.37In the Past Month 9.175065 4.02
Frequency Missing = 3.9699971229
RECENT CRACK USE
q18c Frequency Percent___________________________________________Never Heard/Used 216.5062 94.81In Your Lifetime 8.785674 3.85
Since School Began 0.849495 0.37In the Past Month 2.227621 0.98
Frequency Missing = 3.6310377713
The frequencies have been weighted so that theanalysis reflects the distribution of students by grade
level in the campus
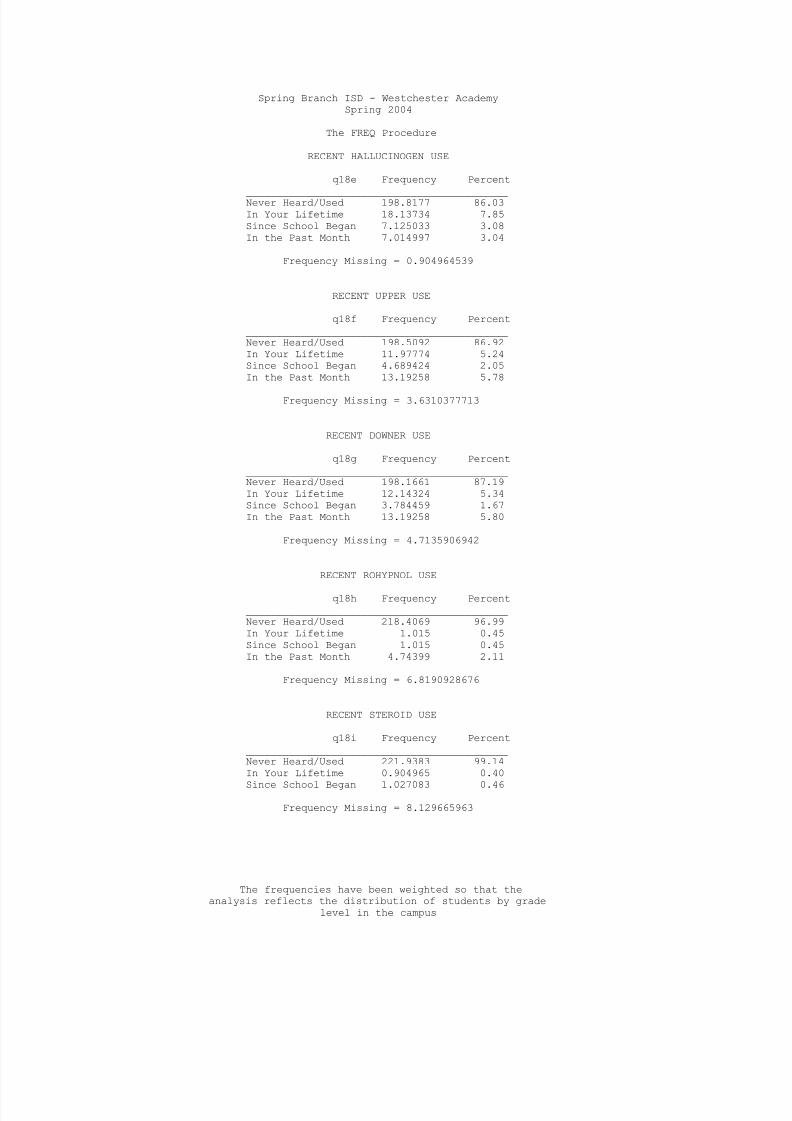
8/6/2019 Spring Branch ISD - Westchester Academy - 2004 Texas School Survey of Drug and Alcohol Use
http://slidepdf.com/reader/full/spring-branch-isd-westchester-academy-2004-texas-school-survey-of-drug 50/83
Spring Branch ISD - Westchester AcademySpring 2004
The FREQ Procedure
RECENT HALLUCINOGEN USE
q18e Frequency Percent
___________________________________________Never Heard/Used 198.8177 86.03In Your Lifetime 18.13734 7.85Since School Began 7.125033 3.08In the Past Month 7.014997 3.04
Frequency Missing = 0.904964539
RECENT UPPER USE
q18f Frequency Percent___________________________________________Never Heard/Used 198.5092 86.92In Your Lifetime 11.97774 5.24Since School Began 4.689424 2.05In the Past Month 13.19258 5.78
Frequency Missing = 3.6310377713
RECENT DOWNER USE
q18g Frequency Percent___________________________________________Never Heard/Used 198.1661 87.19In Your Lifetime 12.14324 5.34Since School Began 3.784459 1.67In the Past Month 13.19258 5.80
Frequency Missing = 4.7135906942
RECENT ROHYPNOL USE
q18h Frequency Percent
___________________________________________Never Heard/Used 218.4069 96.99In Your Lifetime 1.015 0.45Since School Began 1.015 0.45In the Past Month 4.74399 2.11
Frequency Missing = 6.8190928676
RECENT STEROID USE
q18i Frequency Percent___________________________________________Never Heard/Used 221.9383 99.14In Your Lifetime 0.904965 0.40
Since School Began 1.027083 0.46
Frequency Missing = 8.129665963
The frequencies have been weighted so that theanalysis reflects the distribution of students by grade
level in the campus

8/6/2019 Spring Branch ISD - Westchester Academy - 2004 Texas School Survey of Drug and Alcohol Use
http://slidepdf.com/reader/full/spring-branch-isd-westchester-academy-2004-texas-school-survey-of-drug 51/83
Spring Branch ISD - Westchester AcademySpring 2004
The FREQ Procedure
RECENT ECSTASY USE
q18j Frequency Percent
___________________________________________Never Heard/Used 197.7503 87.05In Your Lifetime 18.11819 7.98Since School Began 2.042083 0.90In the Past Month 9.253709 4.07
Frequency Missing = 4.8357094885
RECENT HEROIN USE
q18k Frequency Percent___________________________________________Never Heard/Used 223.1943 98.33In Your Lifetime 1.876578 0.83In the Past Month 1.919965 0.85
Frequency Missing = 5.0091637896
TOBACCO USE IN PAST MONTH
q19a Frequency Percent_________________________________________Never Heard/Used 175.4831 78.501-2 times 15.6985 7.023-10 times 6.02003 2.6911+ times 26.33575 11.78
Frequency Missing = 8.4626131771
ALCOHOL USE IN PAST MONTH
q19b Frequency Percent_________________________________________Never Heard/Used 136.6577 61.421-2 times 45.33063 20.373-10 times 29.39153 13.2111+ times 11.13047 5.00
Frequency Missing = 9.4896965104
INHALANT USE IN PAST MONTH
q19c Frequency Percent_________________________________________Never Heard/Used 204.3954 91.061-2 times 13.48093 6.013-10 times 4.536002 2.02
11+ times 2.042083 0.91
Frequency Missing = 7.5455653047
The frequencies have been weighted so that theanalysis reflects the distribution of students by grade
level in the campus

8/6/2019 Spring Branch ISD - Westchester Academy - 2004 Texas School Survey of Drug and Alcohol Use
http://slidepdf.com/reader/full/spring-branch-isd-westchester-academy-2004-texas-school-survey-of-drug 52/83
Spring Branch ISD - Westchester AcademySpring 2004
The FREQ Procedure
MARIJUANA USE IN PAST MONTH
q19d Frequency Percent
_________________________________________Never Heard/Used 174.8613 78.261-2 times 18.17417 8.133-10 times 12.24414 5.4811+ times 18.14357 8.12
Frequency Missing = 8.5767827208
COCAINE USE IN PAST MONTH
q19e Frequency Percent_________________________________________Never Heard/Used 210.4466 94.791-2 times 8.688696 3.913-10 times 1.015 0.4611+ times 1.864495 0.84
Frequency Missing = 9.9852194821
CRACK USE IN PAST MONTH
q19f Frequency Percent_________________________________________Never Heard/Used 220.4682 98.551-2 times 3.254704 1.45
Frequency Missing = 8.2770755427
CLOSE FRIENDS USE CIGARETTES
q20a Frequency Percent
_________________________________________Never heard/None 83.55134 37.90A few 64.67659 29.34Some 40.5081 18.37Most 26.80176 12.16All 4.929528 2.24
Frequency Missing = 11.532683562
CLOSE FRIENDS USE SMOKELESS TOBACCO
q20b Frequency Percent_________________________________________Never heard/None 176.8398 82.10A few 22.81355 10.59Some 13.81817 6.42
Most 1.015 0.47All 0.904965 0.42
Frequency Missing = 16.608496556
The frequencies have been weighted so that theanalysis reflects the distribution of students by grade
level in the campus

8/6/2019 Spring Branch ISD - Westchester Academy - 2004 Texas School Survey of Drug and Alcohol Use
http://slidepdf.com/reader/full/spring-branch-isd-westchester-academy-2004-texas-school-survey-of-drug 53/83
Spring Branch ISD - Westchester AcademySpring 2004
The FREQ Procedure
CLOSE FRIENDS USE BEER
q20c Frequency Percent
_________________________________________Never heard/None 81.07033 38.01A few 47.5021 22.27Some 35.02366 16.42Most 36.7029 17.21All 13.00704 6.10
Frequency Missing = 18.693966146
CLOSE FRIENDS USE WINE COOLERS
q20d Frequency Percent_________________________________________Never heard/None 122.2083 56.01A few 47.10372 21.59Some 26.65115 12.21
Most 15.54919 7.13All 6.684891 3.06
Frequency Missing = 13.802787068
CLOSE FRIENDS USE WINE
q20e Frequency Percent_________________________________________Never heard/None 116.1602 53.43A few 52.25482 24.04Some 28.25549 13.00Most 14.65218 6.74All 6.075499 2.79
Frequency Missing = 14.601850228
CLOSE FRIENDS USE LIQUOR
q20f Frequency Percent_________________________________________Never heard/None 97.1089 44.31A few 42.18821 19.25Some 22.61733 10.32Most 38.70168 17.66All 18.52853 8.45
Frequency Missing = 12.855339991
The frequencies have been weighted so that theanalysis reflects the distribution of students by grade
level in the campus

8/6/2019 Spring Branch ISD - Westchester Academy - 2004 Texas School Survey of Drug and Alcohol Use
http://slidepdf.com/reader/full/spring-branch-isd-westchester-academy-2004-texas-school-survey-of-drug 54/83
Spring Branch ISD - Westchester AcademySpring 2004
The FREQ Procedure
CLOSE FRIENDS USE INHALANTS
q20g Frequency Percent
_________________________________________Never heard/None 173.4756 79.07A few 26.11761 11.90Some 15.01541 6.84Most 3.930745 1.79All 0.849495 0.39
Frequency Missing = 12.611102402
CLOSE FRIENDS USE MARIJUANA
q20h Frequency Percent_________________________________________Never heard/None 102.8313 46.18A few 34.46816 15.48Some 28.30665 12.71
Most 30.23247 13.58All 26.86046 12.06
Frequency Missing = 9.3009285113
DIFFICULT TO GET CIGARETTES
q21a Frequency Percent_______________________________________Never heard of 23.90006 10.59Impossible 44.71536 19.82Very difficult 8.702717 3.86Somewhat diff 18.2367 8.08Somewhat easy 42.56855 18.86Very easy 87.53068 38.79
Frequency Missing = 6.3459313884
DIFFICULT TO GET SMOKELESS TOBACCO
q21b Frequency Percent_______________________________________Never heard of 58.11394 26.10Impossible 60.75754 27.28Very difficult 13.01895 5.85Somewhat diff 23.29149 10.46Somewhat easy 23.30858 10.47Very easy 44.20858 19.85
Frequency Missing = 9.3009285113
The frequencies have been weighted so that theanalysis reflects the distribution of students by grade
level in the campus

8/6/2019 Spring Branch ISD - Westchester Academy - 2004 Texas School Survey of Drug and Alcohol Use
http://slidepdf.com/reader/full/spring-branch-isd-westchester-academy-2004-texas-school-survey-of-drug 55/83
Spring Branch ISD - Westchester AcademySpring 2004
The FREQ Procedure
DIFFICULT TO GET BEER
q21c Frequency Percent
_______________________________________Never heard of 20.49293 9.09Impossible 38.32101 17.00Very difficult 19.89554 8.82Somewhat diff 30.93388 13.72Somewhat easy 40.26843 17.86Very easy 75.56883 33.51
Frequency Missing = 6.5193856894
DIFFICULT TO GET WINE COOLERS
q21d Frequency Percent_______________________________________Never heard of 36.95414 16.53Impossible 43.06769 19.26
Very difficult 12.03818 5.38Somewhat diff 36.32059 16.24Somewhat easy 33.6397 15.04Very easy 61.5796 27.54
Frequency Missing = 8.400098055
DIFFICULT TO GET WINE
q21e Frequency Percent_______________________________________Never heard of 26.80372 11.93Impossible 40.54863 18.05Very difficult 10.63476 4.73Somewhat diff 33.00628 14.69Somewhat easy 38.23733 17.02
Very easy 75.39626 33.57
Frequency Missing = 7.3730147217
DIFFICULT TO GET LIQUOR
q21f Frequency Percent_______________________________________Never heard of 22.19192 10.26Impossible 46.58074 21.54Very difficult 12.91404 5.97Somewhat diff 27.12024 12.54Somewhat easy 37.03699 17.12Very easy 70.45052 32.57
Frequency Missing = 15.705559854
The frequencies have been weighted so that theanalysis reflects the distribution of students by grade
level in the campus

8/6/2019 Spring Branch ISD - Westchester Academy - 2004 Texas School Survey of Drug and Alcohol Use
http://slidepdf.com/reader/full/spring-branch-isd-westchester-academy-2004-texas-school-survey-of-drug 56/83
Spring Branch ISD - Westchester AcademySpring 2004
The FREQ Procedure
DIFFICULT TO GET INHALANTS
q21g Frequency Percent
_______________________________________Never heard of 36.15629 16.41Impossible 36.05705 16.37Very difficult 8.911608 4.05Somewhat diff 14.09444 6.40Somewhat easy 24.43432 11.09Very easy 100.6522 45.69
Frequency Missing = 11.69405453
DIFFICULT TO GET MARIJUANA
q21h Frequency Percent_______________________________________Never heard of 22.42497 10.28Impossible 60.05868 27.53
Very difficult 13.04824 5.98Somewhat diff 22.39243 10.27Somewhat easy 27.52574 12.62Very easy 72.67164 33.32
Frequency Missing = 13.878289241
DIFFICULT TO GET COCAINE
q21i Frequency Percent_______________________________________Never heard of 36.18939 16.44Impossible 69.95209 31.77Very difficult 40.51447 18.40Somewhat diff 24.64341 11.19Somewhat easy 20.33941 9.24
Very easy 28.53297 12.96
Frequency Missing = 11.828256657
DIFFICULT TO GET CRACK
q21j Frequency Percent_______________________________________Never heard of 37.03889 16.80Impossible 73.70525 33.42Very difficult 44.53287 20.19Somewhat diff 31.5949 14.33Somewhat easy 16.40261 7.44Very easy 17.26035 7.83
Frequency Missing = 11.465130639
The frequencies have been weighted so that theanalysis reflects the distribution of students by grade
level in the campus

8/6/2019 Spring Branch ISD - Westchester Academy - 2004 Texas School Survey of Drug and Alcohol Use
http://slidepdf.com/reader/full/spring-branch-isd-westchester-academy-2004-texas-school-survey-of-drug 57/83
Spring Branch ISD - Westchester AcademySpring 2004
The FREQ Procedure
DIFFICULT TO GET HALLUCINOGENS
q21l Frequency Percent
_______________________________________Never heard of 61.51696 28.29Impossible 55.79107 25.66Very difficult 30.34362 13.95Somewhat diff 32.80661 15.09Somewhat easy 14.30838 6.58Very easy 22.69434 10.44
Frequency Missing = 14.539016191
DIFFICULT TO GET UPPERS
q21m Frequency Percent_______________________________________Never heard of 84.50874 38.30Impossible 47.42934 21.50
Very difficult 14.05497 6.37Somewhat diff 30.92209 14.01Somewhat easy 15.30595 6.94Very easy 28.42382 12.88
Frequency Missing = 11.355095178
DIFFICULT TO GET DOWNERS
q21n Frequency Percent_______________________________________Never heard of 85.41371 38.77Impossible 47.25175 21.45Very difficult 15.25551 6.93Somewhat diff 29.00212 13.17Somewhat easy 15.93154 7.23
Very easy 27.43924 12.46
Frequency Missing = 11.706137863
DIFFICULT TO GET ROHYPNOL
q21o Frequency Percent_______________________________________Never heard of 112.6612 51.17Impossible 44.18671 20.07Very difficult 19.37884 8.80Somewhat diff 16.47156 7.48Somewhat easy 11.61442 5.28Very easy 15.86319 7.20
Frequency Missing = 11.824122574
The frequencies have been weighted so that theanalysis reflects the distribution of students by grade
level in the campus

8/6/2019 Spring Branch ISD - Westchester Academy - 2004 Texas School Survey of Drug and Alcohol Use
http://slidepdf.com/reader/full/spring-branch-isd-westchester-academy-2004-texas-school-survey-of-drug 58/83
Spring Branch ISD - Westchester AcademySpring 2004
The FREQ Procedure
DIFFICULT TO GET STEROIDS
q21p Frequency Percent
_______________________________________Never heard of 52.89395 24.44Impossible 72.57001 33.53Very difficult 39.76665 18.37Somewhat diff 28.39889 13.12Somewhat easy 7.995464 3.69Very easy 14.80893 6.84
Frequency Missing = 15.566099525
DIFFICULT TO GET ECSTASY
q21q Frequency Percent_______________________________________Never heard of 49.43449 22.74Impossible 64.22628 29.54
Very difficult 24.72697 11.37Somewhat diff 33.20209 15.27Somewhat easy 24.80478 11.41Very easy 20.99973 9.66
Frequency Missing = 14.605665396
DIFFICULT TO GET HEROIN
q21r Frequency Percent_______________________________________Never heard of 58.23606 26.80Impossible 82.90214 38.14Very difficult 33.03061 15.20Somewhat diff 25.14599 11.57Somewhat easy 9.415984 4.33
Very easy 8.608086 3.96
Frequency Missing = 14.661134986
AGE WHEN FIRST USED CIGARETTES
q22a Frequency Percent______________________________________9 or younger 13.52253 13.9310 years old 5.445083 5.6111 years old 15.51384 15.9812 years old 21.11551 21.7513 years old 13.29238 13.6914 years old 16.26638 16.7615 years old 6.241004 6.4316 years old 5.666058 5.84
Frequency Missing = 134.93721457
The frequencies have been weighted so that theanalysis reflects the distribution of students by grade
level in the campus
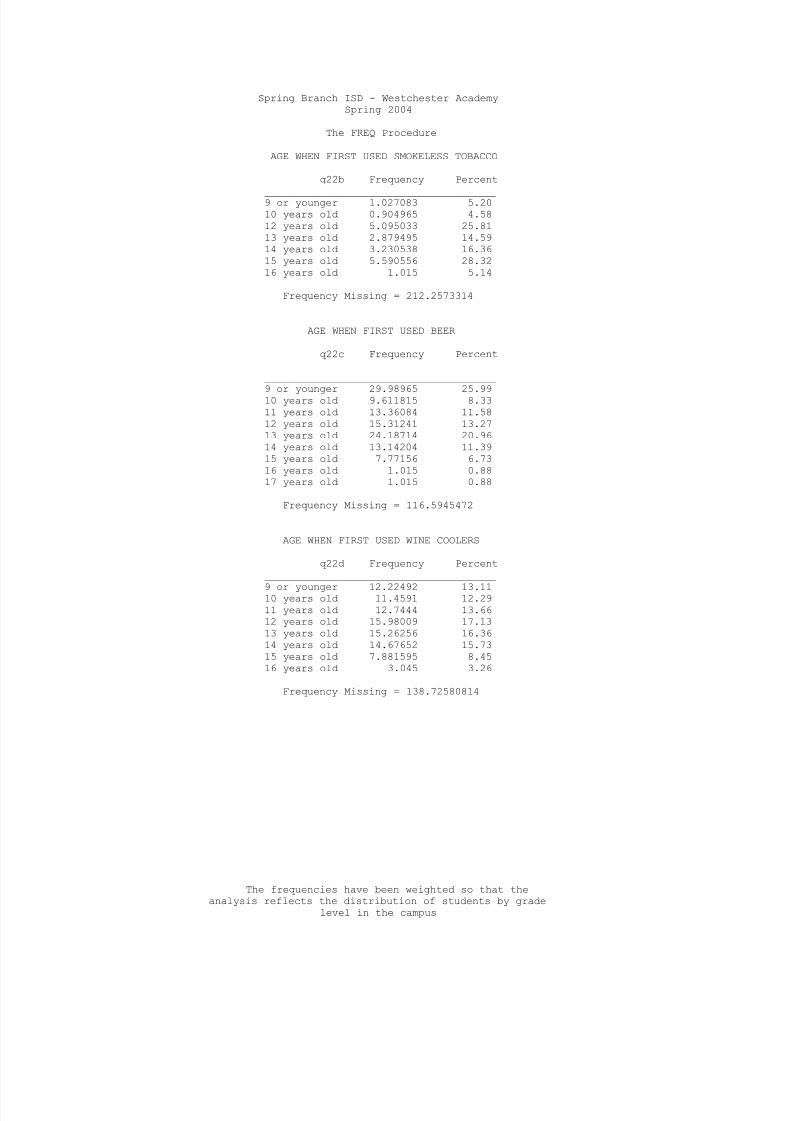
8/6/2019 Spring Branch ISD - Westchester Academy - 2004 Texas School Survey of Drug and Alcohol Use
http://slidepdf.com/reader/full/spring-branch-isd-westchester-academy-2004-texas-school-survey-of-drug 59/83
Spring Branch ISD - Westchester AcademySpring 2004
The FREQ Procedure
AGE WHEN FIRST USED SMOKELESS TOBACCO
q22b Frequency Percent
______________________________________9 or younger 1.027083 5.2010 years old 0.904965 4.5812 years old 5.095033 25.8113 years old 2.879495 14.5914 years old 3.230538 16.3615 years old 5.590556 28.3216 years old 1.015 5.14
Frequency Missing = 212.2573314
AGE WHEN FIRST USED BEER
q22c Frequency Percent
______________________________________
9 or younger 29.98965 25.9910 years old 9.611815 8.3311 years old 13.36084 11.5812 years old 15.31241 13.2713 years old 24.18714 20.9614 years old 13.14204 11.3915 years old 7.77156 6.7316 years old 1.015 0.8817 years old 1.015 0.88
Frequency Missing = 116.5945472
AGE WHEN FIRST USED WINE COOLERS
q22d Frequency Percent______________________________________
9 or younger 12.22492 13.1110 years old 11.4591 12.2911 years old 12.7444 13.6612 years old 15.98009 17.1313 years old 15.26256 16.3614 years old 14.67652 15.7315 years old 7.881595 8.4516 years old 3.045 3.26
Frequency Missing = 138.72580814
The frequencies have been weighted so that theanalysis reflects the distribution of students by grade
level in the campus

8/6/2019 Spring Branch ISD - Westchester Academy - 2004 Texas School Survey of Drug and Alcohol Use
http://slidepdf.com/reader/full/spring-branch-isd-westchester-academy-2004-texas-school-survey-of-drug 60/83
Spring Branch ISD - Westchester AcademySpring 2004
The FREQ Procedure
AGE WHEN FIRST USED WINE
q22e Frequency Percent
______________________________________9 or younger 20.5342 17.7610 years old 11.66598 10.0911 years old 14.24958 12.3212 years old 21.42517 18.5313 years old 19.23256 16.6314 years old 14.82369 12.8215 years old 9.116578 7.8816 years old 4.575556 3.96
Frequency Missing = 116.37667324
AGE WHEN FIRST USED LIQUOR
q22f Frequency Percent______________________________________
9 or younger 7.367977 6.9310 years old 12.49032 11.7511 years old 10.2543 9.6512 years old 17.04765 16.0413 years old 22.96951 21.6214 years old 17.68307 16.6415 years old 10.81656 10.1816 years old 7.636667 7.19
Frequency Missing = 125.73395496
AGE WHEN FIRST USED INHALANTS
q22g Frequency Percent______________________________________9 or younger 4.945745 13.20
10 years old 6.534699 17.4411 years old 8.399194 22.4112 years old 8.349648 22.2813 years old 4.277654 11.4214 years old 1.919965 5.1215 years old 1.015 2.7116 years old 2.03 5.42
Frequency Missing = 194.52809481
The frequencies have been weighted so that theanalysis reflects the distribution of students by grade
level in the campus

8/6/2019 Spring Branch ISD - Westchester Academy - 2004 Texas School Survey of Drug and Alcohol Use
http://slidepdf.com/reader/full/spring-branch-isd-westchester-academy-2004-texas-school-survey-of-drug 61/83
Spring Branch ISD - Westchester AcademySpring 2004
The FREQ Procedure
AGE WHEN FIRST USED MARIJUANA
q22h Frequency Percent
______________________________________9 or younger 3.575568 5.0110 years old 3.069167 4.3011 years old 3.575568 5.0112 years old 10.58957 14.8413 years old 19.85625 27.8214 years old 19.08748 26.7515 years old 8.566577 12.0016 years old 3.045 4.27
Frequency Missing = 160.63481904
AGE WHEN FIRST USED COCAINE
q22i Frequency Percent______________________________________
10 years old 1.027083 3.7811 years old 1.876578 6.9112 years old 3.575568 13.1713 years old 2.603954 9.5914 years old 1.754459 6.4615 years old 6.147168 22.6416 years old 3.560556 13.1117 years old 6.605556 24.33
Frequency Missing = 204.84907671
AGE WHEN FIRST USED CRACK
q22j Frequency Percent______________________________________11 years old 2.054167 22.62
12 years old 1.932048 21.2814 years old 2.050033 22.5716 years old 1.015 11.1817 years old 2.03 22.35
Frequency Missing = 222.91875288
AGE WHEN FIRST USED HALLUCINOGENS
q22l Frequency Percent______________________________________10 years old 0.849495 3.3211 years old 1.027083 4.0112 years old 1.027083 4.0113 years old 1.754459 6.8614 years old 5.335048 20.85
15 years old 5.446075 21.2816 years old 4.06 15.8717 years old 5.075 19.8318 or older 1.015 3.97
Frequency Missing = 206.410756
The frequencies have been weighted so that theanalysis reflects the distribution of students by grade
level in the campus

8/6/2019 Spring Branch ISD - Westchester Academy - 2004 Texas School Survey of Drug and Alcohol Use
http://slidepdf.com/reader/full/spring-branch-isd-westchester-academy-2004-texas-school-survey-of-drug 62/83
Spring Branch ISD - Westchester AcademySpring 2004
The FREQ Procedure
AGE WHEN FIRST USED UPPERS
q22m Frequency Percent
______________________________________9 or younger 3.416075 10.2710 years old 1.027083 3.0911 years old 0.849495 2.5512 years old 3.065033 9.2113 years old 2.954997 8.8814 years old 6.942098 20.8615 years old 9.430485 28.3416 years old 3.560556 10.7017 years old 1.015 3.0518 or older 1.015 3.05
Frequency Missing = 198.72417902
AGE WHEN FIRST USED DOWNERS
q22n Frequency Percent______________________________________9 or younger 3.416075 11.1811 years old 0.849495 2.7812 years old 2.050033 6.7113 years old 2.050033 6.7114 years old 6.159252 20.1515 years old 9.430485 30.86
16 years old 2.545556 8.3317 years old 4.06 13.28
Frequency Missing = 201.43907263
AGE WHEN FIRST USED ROHYPNOL
q22o Frequency Percent______________________________________12 years old 0.849495 12.2414 years old 1.015 14.6315 years old 1.015 14.6316 years old 2.03 29.2517 years old 1.015 14.6318 or older 1.015 14.63
Frequency Missing = 225.06050505
AGE WHEN FIRST USED STEROIDS
q22p Frequency Percent______________________________________11 years old 0.849495 22.30
13 years old 1.932048 50.7314 years old 1.027083 26.97
Frequency Missing = 228.19137384
The frequencies have been weighted so that theanalysis reflects the distribution of students by grade
level in the campus

8/6/2019 Spring Branch ISD - Westchester Academy - 2004 Texas School Survey of Drug and Alcohol Use
http://slidepdf.com/reader/full/spring-branch-isd-westchester-academy-2004-texas-school-survey-of-drug 63/83
Spring Branch ISD - Westchester AcademySpring 2004
The FREQ Procedure
AGE WHEN FIRST USED ECSTASY
q22q Frequency Percent
______________________________________10 years old 0.849495 3.1511 years old 0.849495 3.1512 years old 2.903662 10.7613 years old 2.050033 7.6014 years old 5.914128 21.9215 years old 3.746093 13.8916 years old 6.605556 24.4817 years old 3.045 11.2918 or older 1.015 3.76
Frequency Missing = 205.02153883
AGE WHEN FIRST USED HEROIN
q22r Frequency Percent
______________________________________12 years old 1.027083 36.9214 years old 1.754459 63.08
Frequency Missing = 229.21845718
HOW OFTEN NORMALLY USE CIGARETTES
q23a Frequency Percent_________________________________________Every day 19.71016 8.88Several times/wk 10.28973 4.64Several times/mo 11.35126 5.12About once/month 12.79001 5.76About once/year 12.99155 5.86< once/year 20.11035 9.06
Never used 134.6318 60.68
Frequency Missing = 10.125132675
HOW OFTEN NORMALLY USE SMOKELESS TOBACCO
q23b Frequency Percent_________________________________________Every day 0.849495 0.39Several times/wk 1.015 0.46Several times/mo 1.015 0.46About once/month 5.425051 2.46About once/year 5.292654 2.40< once/year 7.007048 3.18Never used 199.5716 90.64
Frequency Missing = 11.824122574
The frequencies have been weighted so that theanalysis reflects the distribution of students by grade
level in the campus

8/6/2019 Spring Branch ISD - Westchester Academy - 2004 Texas School Survey of Drug and Alcohol Use
http://slidepdf.com/reader/full/spring-branch-isd-westchester-academy-2004-texas-school-survey-of-drug 64/83
Spring Branch ISD - Westchester AcademySpring 2004
The FREQ Procedure
HOW OFTEN NORMALLY USE BEER
q23c Frequency Percent
_________________________________________Every day 1.200538 0.55Several times/wk 14.75767 6.75Several times/mo 16.51788 7.55About once/month 26.52871 12.12About once/year 31.16505 14.24< once/year 18.1187 8.28Never used 110.5051 50.51
Frequency Missing = 13.206382675
HOW OFTEN NORMALLY USE WINE COOLERS
q23d Frequency Percent_________________________________________Several times/wk 3.25057 1.53
Several times/mo 10.65519 5.03About once/month 24.20861 11.42About once/year 21.58553 10.18< once/year 20.76132 9.79Never used 131.5427 62.05
Frequency Missing = 19.996050675
HOW OFTEN NORMALLY USE WINE
q23e Frequency Percent_________________________________________Several times/wk 2.954997 1.36Several times/mo 12.58633 5.78About once/month 26.73592 12.27About once/year 36.94888 16.96
< once/year 23.34794 10.72Never used 115.3146 52.92
Frequency Missing = 14.111347214
HOW OFTEN NORMALLY USE LIQUOR
q23f Frequency Percent_________________________________________Every day 0.849495 0.39Several times/wk 11.98579 5.48Several times/mo 25.8799 11.84About once/month 24.34058 11.13About once/year 22.87378 10.46< once/year 14.66437 6.71Never used 118.0262 53.99
Frequency Missing = 13.379836976
The frequencies have been weighted so that theanalysis reflects the distribution of students by grade
level in the campus

8/6/2019 Spring Branch ISD - Westchester Academy - 2004 Texas School Survey of Drug and Alcohol Use
http://slidepdf.com/reader/full/spring-branch-isd-westchester-academy-2004-texas-school-survey-of-drug 65/83
Spring Branch ISD - Westchester AcademySpring 2004
The FREQ Procedure
HOW OFTEN NORMALLY USE INHALANTS
q23g Frequency Percent
_________________________________________Every day 1.015 0.47Several times/wk 3.930745 1.82Several times/mo 5.858659 2.72About once/month 3.808626 1.77About once/year 4.244545 1.97< once/year 11.80409 5.47Never used 185.0073 85.78
Frequency Missing = 16.331018932
HOW OFTEN NORMALLY USE MARIJUANA
q23h Frequency Percent_________________________________________Every day 11.075 5.09
Several times/wk 16.18988 7.43Several times/mo 11.83853 5.44About once/month 8.951073 4.11About once/year 9.262651 4.25< once/year 9.914436 4.55Never used 150.547 69.13
Frequency Missing = 14.221382675
HOW OFTEN NORMALLY USE COCAINE
q23i Frequency Percent_________________________________________Every day 0.849495 0.40Several times/wk 1.015 0.48Several times/mo 3.242621 1.53
About once/month 4.245538 2.00About once/year 6.350048 2.99< once/year 7.014005 3.30Never used 189.6896 89.31
Frequency Missing = 19.593672483
HOW OFTEN NORMALLY USE CRACK
q23j Frequency Percent_________________________________________Several times/mo 2.054167 0.96About once/year 0.849495 0.40< once/year 3.120502 1.47Never used 206.9774 97.17
Frequency Missing = 18.99839221
The frequencies have been weighted so that theanalysis reflects the distribution of students by grade
level in the campus
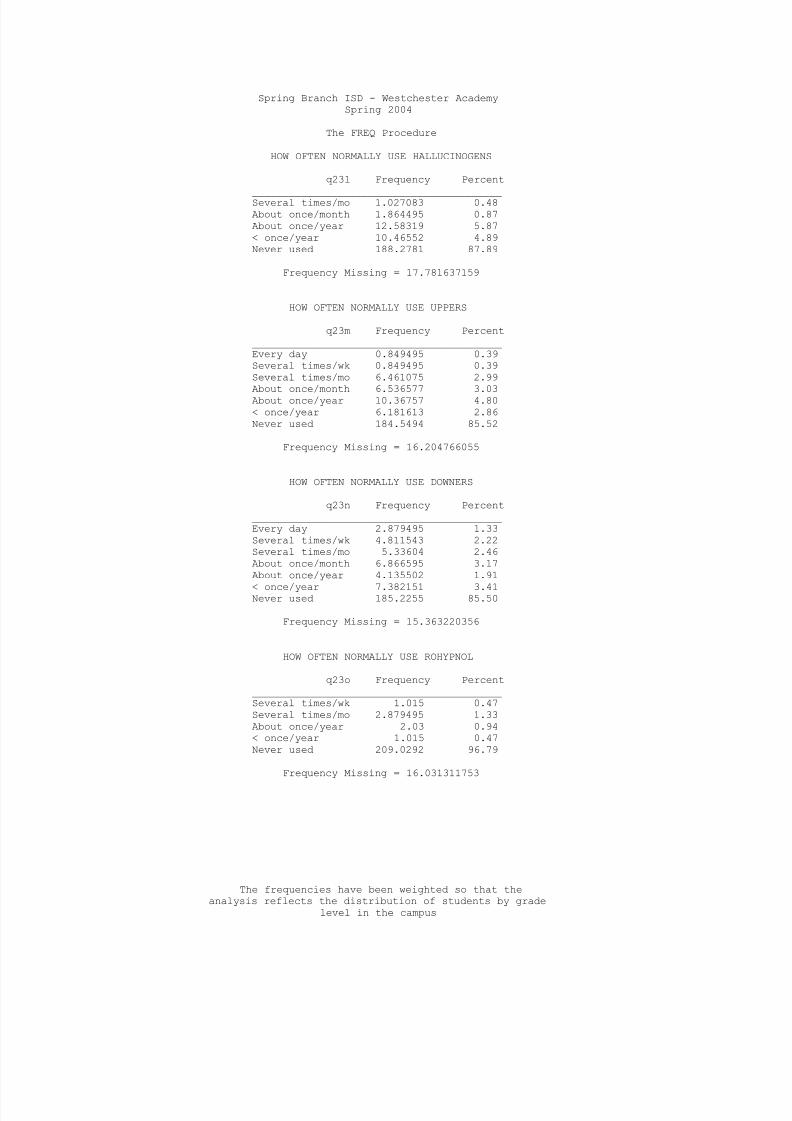
8/6/2019 Spring Branch ISD - Westchester Academy - 2004 Texas School Survey of Drug and Alcohol Use
http://slidepdf.com/reader/full/spring-branch-isd-westchester-academy-2004-texas-school-survey-of-drug 66/83
Spring Branch ISD - Westchester AcademySpring 2004
The FREQ Procedure
HOW OFTEN NORMALLY USE HALLUCINOGENS
q23l Frequency Percent
_________________________________________Several times/mo 1.027083 0.48About once/month 1.864495 0.87About once/year 12.58319 5.87< once/year 10.46552 4.89Never used 188.2781 87.89
Frequency Missing = 17.781637159
HOW OFTEN NORMALLY USE UPPERS
q23m Frequency Percent_________________________________________Every day 0.849495 0.39Several times/wk 0.849495 0.39Several times/mo 6.461075 2.99
About once/month 6.536577 3.03About once/year 10.36757 4.80< once/year 6.181613 2.86Never used 184.5494 85.52
Frequency Missing = 16.204766055
HOW OFTEN NORMALLY USE DOWNERS
q23n Frequency Percent_________________________________________Every day 2.879495 1.33Several times/wk 4.811543 2.22Several times/mo 5.33604 2.46About once/month 6.866595 3.17About once/year 4.135502 1.91
< once/year 7.382151 3.41Never used 185.2255 85.50
Frequency Missing = 15.363220356
HOW OFTEN NORMALLY USE ROHYPNOL
q23o Frequency Percent_________________________________________Several times/wk 1.015 0.47Several times/mo 2.879495 1.33About once/year 2.03 0.94< once/year 1.015 0.47Never used 209.0292 96.79
Frequency Missing = 16.031311753
The frequencies have been weighted so that theanalysis reflects the distribution of students by grade
level in the campus

8/6/2019 Spring Branch ISD - Westchester Academy - 2004 Texas School Survey of Drug and Alcohol Use
http://slidepdf.com/reader/full/spring-branch-isd-westchester-academy-2004-texas-school-survey-of-drug 67/83
Spring Branch ISD - Westchester AcademySpring 2004
The FREQ Procedure
HOW OFTEN NORMALLY USE STEROIDS
q23p Frequency Percent
_________________________________________Several times/wk 1.027083 0.49< once/year 1.932048 0.91Never used 208.296 98.60
Frequency Missing = 20.744902448
HOW OFTEN NORMALLY USE ECSTASY
q23q Frequency Percent_________________________________________Every day 0.849495 0.40Several times/mo 1.027083 0.49About once/month 4.941611 2.34About once/year 6.507603 3.08< once/year 12.69314 6.01
Never used 185.3503 87.69
Frequency Missing = 20.630732904
HOW OFTEN NORMALLY USE HEROIN
q23r Frequency Percent_________________________________________Several times/mo 1.027083 0.48About once/year 0.904965 0.42< once/year 0.849495 0.39Never used 212.5143 98.71
Frequency Missing = 16.704122037
HOW MANY CIGARETTES IN PAST 30 DAYS
q24 Frequency Percent_________________________________________None 171.6695 76.31Less than 1 23.8021 10.58> 1 and < 10 20.49089 9.11> 10 and < 1pk 5.075 2.26> 1pk and < 2pks 3.914528 1.74
Frequency Missing = 7.0480167582
The frequencies have been weighted so that theanalysis reflects the distribution of students by grade
level in the campus

8/6/2019 Spring Branch ISD - Westchester Academy - 2004 Texas School Survey of Drug and Alcohol Use
http://slidepdf.com/reader/full/spring-branch-isd-westchester-academy-2004-texas-school-survey-of-drug 68/83
Spring Branch ISD - Westchester AcademySpring 2004
The FREQ Procedure
AMOUNT OF BEER AT ONE TIME
q25a Frequency Percent
_________________________________________Never drink this 107.8 48.1312+ drinks 7.821106 3.499-11 drinks 9.836093 4.395-8 drinks 14.17617 6.333-4 drinks 15.67613 7.002 drinks 17.81951 7.961 drink 25.70375 11.48< 1 drink 25.14759 11.23
Frequency Missing = 8.019630502
AMOUNT OF WINE COOLERS AT ONE TIME
q25b Frequency Percent_________________________________________
Never drink this 130.0918 58.0512+ drinks 7.542636 3.375-8 drinks 10.01945 4.473-4 drinks 18.8668 8.422 drinks 18.52431 8.271 drink 21.46745 9.58< 1 drink 17.59007 7.85
Frequency Missing = 7.8975117077
AMOUNT OF WINE AT ONE TIME
q25c Frequency Percent_________________________________________Never drink this 104.264 47.0712+ drinks 2.545556 1.15
9-11 drinks 3.749022 1.695-8 drinks 6.510533 2.943-4 drinks 12.89871 5.822 drinks 23.96558 10.821 drink 34.41793 15.54< 1 drink 33.17247 14.97
Frequency Missing = 10.47617536
The frequencies have been weighted so that theanalysis reflects the distribution of students by grade
level in the campus

8/6/2019 Spring Branch ISD - Westchester Academy - 2004 Texas School Survey of Drug and Alcohol Use
http://slidepdf.com/reader/full/spring-branch-isd-westchester-academy-2004-texas-school-survey-of-drug 69/83
Spring Branch ISD - Westchester AcademySpring 2004
The FREQ Procedure
AMOUNT OF LIQUOR AT ONE TIME
q25d Frequency Percent
_________________________________________Never drink this 114.162 50.9712+ drinks 4.74399 2.129-11 drinks 6.904962 3.085-8 drinks 24.74179 11.053-4 drinks 21.21917 9.472 drinks 18.64027 8.321 drink 10.8468 4.84< 1 drink 22.72137 10.14
Frequency Missing = 8.019630502
BEERS, FIVE OR MORE AT ONE TIME
q26a Frequency Percent_________________________________________
Never drink this 113.2997 51.15Never 5+ at time 36.04413 16.27Several times/wk 8.140033 3.67Several times/mo 11.28078 5.09About once/month 15.68025 7.08< once/month 19.52813 8.82< once/year 17.55082 7.92
Frequency Missing = 10.47617536
WINE COOLERS, FIVE OR MORE AT ONE TIME
q26b Frequency Percent_________________________________________Never drink this 129.7035 59.26Never 5+ at time 29.27826 13.38
Several times/wk 1.015 0.46Several times/mo 9.580603 4.38About once/month 11.3261 5.18< once/month 18.81004 8.59< once/year 19.14678 8.75
Frequency Missing = 13.139733471
WINE, FIVE OR MORE AT ONE TIME
q26c Frequency Percent_________________________________________Never drink this 114.7062 51.87Never 5+ at time 38.95057 17.61Several times/wk 1.015 0.46Several times/mo 5.771977 2.61
About once/month 11.73171 5.30< once/month 17.20592 7.78< once/year 31.77408 14.37
Frequency Missing = 10.84455958
The frequencies have been weighted so that theanalysis reflects the distribution of students by grade
level in the campus

8/6/2019 Spring Branch ISD - Westchester Academy - 2004 Texas School Survey of Drug and Alcohol Use
http://slidepdf.com/reader/full/spring-branch-isd-westchester-academy-2004-texas-school-survey-of-drug 70/83
Spring Branch ISD - Westchester AcademySpring 2004
The FREQ Procedure
LIQUOR, FIVE OR MORE AT ONE TIME
q26d Frequency Percent
_________________________________________Never drink this 115.2023 52.95Never 5+ at time 26.88132 12.36Several times/wk 7.881595 3.62Several times/mo 19.1322 8.79About once/month 10.58664 4.87< once/month 17.2945 7.95< once/year 20.57113 9.46
Frequency Missing = 14.450306566
GET ALCOHOLIC BEVERAGES FROM HOME
q27a Frequency Percent_________________________________________Do not Drink 91.73859 41.95
Never 41.61122 19.03Seldom 66.80946 30.55Most of the Time 12.54265 5.74Always 5.973714 2.73
Frequency Missing = 13.324367387
GET ALCOHOLIC BEVERAGES FROM FRIENDS
q27b Frequency Percent_________________________________________Do not Drink 92.3549 42.34Never 33.88063 15.53Seldom 33.4573 15.34Most of the Time 41.0455 18.82Always 17.39546 7.97
Frequency Missing = 13.866205908
GET ALCOHOLIC BEVERAGES FROM A STORE
q27c Frequency Percent_________________________________________Do not Drink 92.131 42.82Never 80.59345 37.46Seldom 14.29831 6.65Most of the Time 21.86428 10.16Always 6.275538 2.92
Frequency Missing = 16.837420447
The frequencies have been weighted so that theanalysis reflects the distribution of students by grade
level in the campus

8/6/2019 Spring Branch ISD - Westchester Academy - 2004 Texas School Survey of Drug and Alcohol Use
http://slidepdf.com/reader/full/spring-branch-isd-westchester-academy-2004-texas-school-survey-of-drug 71/83
Spring Branch ISD - Westchester AcademySpring 2004
The FREQ Procedure
GET ALCOHOLIC BEVERAGES AT PARTIES
q27d Frequency Percent
_________________________________________Do not Drink 89.06988 40.50Never 30.57046 13.90Seldom 28.65804 13.03Most of the Time 51.36949 23.36Always 20.27495 9.22
Frequency Missing = 12.057180548
GET ALCOHOLIC BEVERAGES FROM OTHER
q27e Frequency Percent_________________________________________Do not Drink 92.72126 42.88Never 48.24348 22.31Seldom 37.24947 17.23
Most of the Time 19.07442 8.82Always 18.92813 8.75
Frequency Missing = 15.783241154
USE MARIJUANA AS JOINTS
q28a Frequency Percent_________________________________________Never 157.9178 70.88Seldom 25.66375 11.52Half the time 17.92933 8.05Most of the time 12.66879 5.69Always 7.703121 3.46Don't know 0.904965 0.41
Frequency Missing = 9.2122188858
USE MARIJUANA AS BLUNTS
q28b Frequency Percent_________________________________________Never 163.5789 75.05Seldom 16.99608 7.80Half the time 11.88513 5.45Most of the time 13.51536 6.20Always 10.95369 5.03Don't know 1.027083 0.47
Frequency Missing = 14.043794292
The frequencies have been weighted so that theanalysis reflects the distribution of students by grade
level in the campus

8/6/2019 Spring Branch ISD - Westchester Academy - 2004 Texas School Survey of Drug and Alcohol Use
http://slidepdf.com/reader/full/spring-branch-isd-westchester-academy-2004-texas-school-survey-of-drug 72/83
Spring Branch ISD - Westchester AcademySpring 2004
The FREQ Procedure
USE MARIJUANA IN BONGS OR WATER PIPES
q28c Frequency Percent
_________________________________________Never 167.8304 77.71Seldom 14.07419 6.52Half the time 12.98871 6.01Most of the time 13.25018 6.14Always 6.786977 3.14Don't know 1.027083 0.48
Frequency Missing = 16.042491369
USE MARIJUANA IN PIPES
q28d Frequency Percent_________________________________________Never 160.1315 73.01Seldom 14.71982 6.71
Half the time 11.4188 5.21Most of the time 15.7622 7.19Always 16.27496 7.42Don't know 1.027083 0.47
Frequency Missing = 12.665668273
USE MARIJUANA OTHER WAYS
q28e Frequency Percent_________________________________________Never 174.9846 80.51Seldom 21.62598 9.95Half the time 3.39798 1.56Most of the time 3.132586 1.44Always 8.871543 4.08
Don't know 5.327098 2.45
Frequency Missing = 14.660231268
TAKE DXM, TRIPLE C'S, ETC. TO GET HIGH
q29a Frequency Percent____________________________________________Never heard/used 197.9736 89.86At least once/month 9.715691 4.41At least once/year 7.014005 3.18At least once/life 5.602639 2.54
Frequency Missing = 11.69405453
The frequencies have been weighted so that theanalysis reflects the distribution of students by grade
level in the campus

8/6/2019 Spring Branch ISD - Westchester Academy - 2004 Texas School Survey of Drug and Alcohol Use
http://slidepdf.com/reader/full/spring-branch-isd-westchester-academy-2004-texas-school-survey-of-drug 73/83
Spring Branch ISD - Westchester AcademySpring 2004
The FREQ Procedure
TAKE CODEINE COUGH SYRUP TO GET HIGH
q29b Frequency Percent
____________________________________________Never heard/used 186.2824 84.99At least once/month 13.53055 6.17At least once/year 10.09713 4.61At least once/life 9.258729 4.22
Frequency Missing = 12.831173324
DANGEROUS FOR KIDS TO USE TOBACCO
q30a Frequency Percent___________________________________Very 118.0646 53.80Somewhat 54.35774 24.77Not very 27.77802 12.66Not at all 11.69022 5.33
Don't know 7.561783 3.45
Frequency Missing = 12.547683562
DANGEROUS FOR KIDS TO USE ALCOHOL
q30b Frequency Percent___________________________________Very 92.60013 42.41Somewhat 65.84478 30.15Not very 41.74332 19.12Not at all 10.61975 4.86Don't know 7.561783 3.46
Frequency Missing = 13.630236485
DANGEROUS FOR KIDS TO USE INHALANTS
q30c Frequency Percent___________________________________Very 149.457 68.78Somewhat 44.66587 20.56Not very 9.244555 4.25Not at all 6.362131 2.93Don't know 7.561783 3.48
Frequency Missing = 14.708655325
The frequencies have been weighted so that theanalysis reflects the distribution of students by grade
level in the campus

8/6/2019 Spring Branch ISD - Westchester Academy - 2004 Texas School Survey of Drug and Alcohol Use
http://slidepdf.com/reader/full/spring-branch-isd-westchester-academy-2004-texas-school-survey-of-drug 74/83
Spring Branch ISD - Westchester AcademySpring 2004
The FREQ Procedure
DANGEROUS FOR KIDS TO USE MARIJUANA
q30d Frequency Percent
___________________________________Very 112.1807 52.05Somewhat 36.36072 16.87Not very 34.72537 16.11Not at all 23.78718 11.04Don't know 8.466747 3.93
Frequency Missing = 16.479314386
DANGEROUS FOR KIDS TO USE COCAINE
q30e Frequency Percent___________________________________Very 165.4023 76.91Somewhat 32.83972 15.27Not very 5.274558 2.45
Not at all 1.200538 0.56Don't know 10.34333 4.81
Frequency Missing = 16.939506657
DANGEROUS FOR KIDS TO USE CRACK
q30f Frequency Percent___________________________________Very 173.2061 81.11Somewhat 21.64 10.13Not very 4.247475 1.99Not at all 2.731093 1.28Don't know 11.72145 5.49
Frequency Missing = 18.45386264
DANGEROUS FOR KIDS TO USE ECSTASY
q30g Frequency Percent___________________________________Very 162.6055 75.13Somewhat 36.88665 17.04Not very 3.575568 1.65Not at all 2.731093 1.26Don't know 10.64303 4.92
Frequency Missing = 15.558150274
The frequencies have been weighted so that theanalysis reflects the distribution of students by grade
level in the campus

8/6/2019 Spring Branch ISD - Westchester Academy - 2004 Texas School Survey of Drug and Alcohol Use
http://slidepdf.com/reader/full/spring-branch-isd-westchester-academy-2004-texas-school-survey-of-drug 75/83
Spring Branch ISD - Westchester AcademySpring 2004
The FREQ Procedure
DANGEROUS FOR KIDS TO USE STEROIDS
q30h Frequency Percent
___________________________________Very 155.3275 72.33Somewhat 37.65027 17.53Not very 6.179523 2.88Not at all 2.731093 1.27Don't know 12.86652 5.99
Frequency Missing = 17.24505684
DANGEROUS FOR KIDS TO USE HEROIN
q30i Frequency Percent___________________________________Very 179.4877 82.26Somewhat 18.98148 8.70Not very 2.726073 1.25
Not at all 2.731093 1.25Don't know 14.26994 6.54
Frequency Missing = 13.803690786
DAYS SKIPPED SINCE SEPTEMBER
q31a Frequency Percent_________________________________None 169.2985 77.251-3 days 33.57647 15.324-9 days 9.09333 4.1510+ days 7.200535 3.29
Frequency Missing = 12.831173324
DAYS ILL SINCE SEPTEMBER
q31b Frequency Percent_________________________________None 48.32021 21.671-3 days 116.0239 52.024-9 days 48.46758 21.7310+ days 10.20911 4.58
Frequency Missing = 8.9791609125
OTHER DAYS MISSED SINCE SEPTEMBER
q31c Frequency Percent_________________________________
None 99.85762 45.861-3 days 100.4941 46.154-9 days 16.3704 7.5210+ days 1.027083 0.47
Frequency Missing = 14.2507897
The frequencies have been weighted so that theanalysis reflects the distribution of students by grade
level in the campus
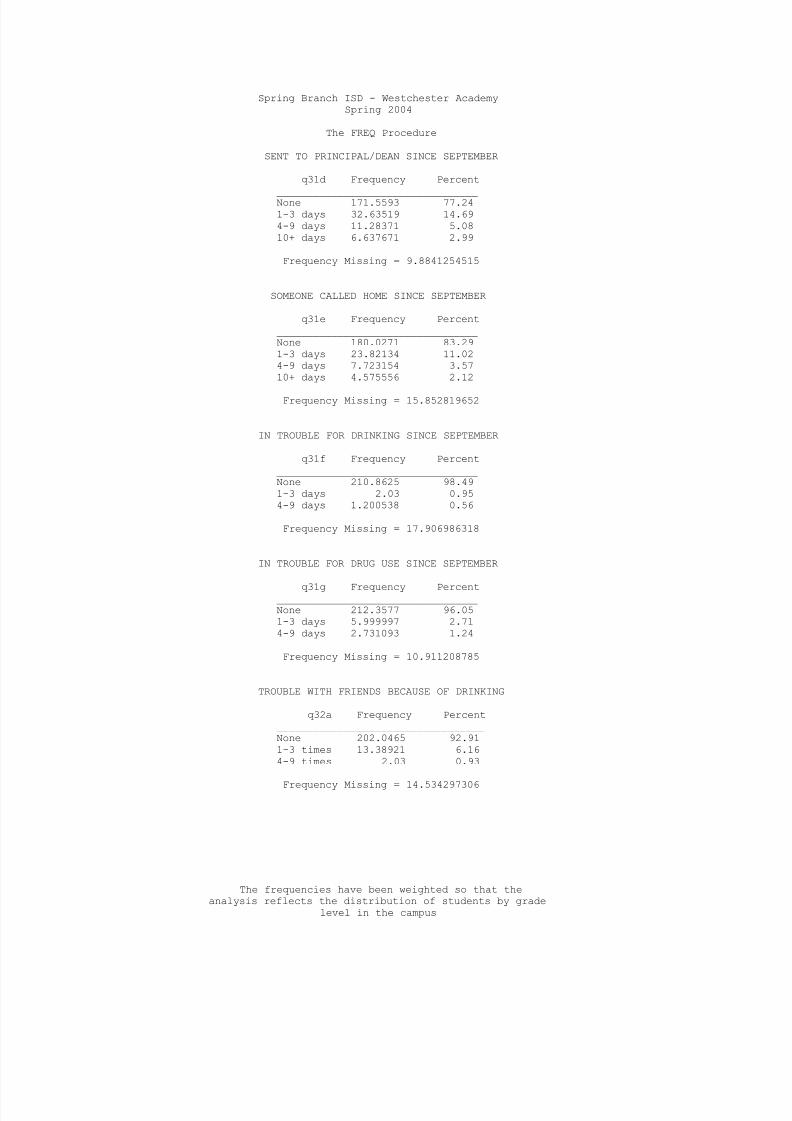
8/6/2019 Spring Branch ISD - Westchester Academy - 2004 Texas School Survey of Drug and Alcohol Use
http://slidepdf.com/reader/full/spring-branch-isd-westchester-academy-2004-texas-school-survey-of-drug 76/83
Spring Branch ISD - Westchester AcademySpring 2004
The FREQ Procedure
SENT TO PRINCIPAL/DEAN SINCE SEPTEMBER
q31d Frequency Percent
_________________________________None 171.5593 77.241-3 days 32.63519 14.694-9 days 11.28371 5.0810+ days 6.637671 2.99
Frequency Missing = 9.8841254515
SOMEONE CALLED HOME SINCE SEPTEMBER
q31e Frequency Percent_________________________________None 180.0271 83.291-3 days 23.82134 11.024-9 days 7.723154 3.5710+ days 4.575556 2.12
Frequency Missing = 15.852819652
IN TROUBLE FOR DRINKING SINCE SEPTEMBER
q31f Frequency Percent_________________________________None 210.8625 98.491-3 days 2.03 0.954-9 days 1.200538 0.56
Frequency Missing = 17.906986318
IN TROUBLE FOR DRUG USE SINCE SEPTEMBER
q31g Frequency Percent_________________________________None 212.3577 96.051-3 days 5.999997 2.714-9 days 2.731093 1.24
Frequency Missing = 10.911208785
TROUBLE WITH FRIENDS BECAUSE OF DRINKING
q32a Frequency Percent__________________________________None 202.0465 92.911-3 times 13.38921 6.164-9 times 2.03 0.93
Frequency Missing = 14.534297306
The frequencies have been weighted so that theanalysis reflects the distribution of students by grade
level in the campus

8/6/2019 Spring Branch ISD - Westchester Academy - 2004 Texas School Survey of Drug and Alcohol Use
http://slidepdf.com/reader/full/spring-branch-isd-westchester-academy-2004-texas-school-survey-of-drug 77/83
Spring Branch ISD - Westchester AcademySpring 2004
The FREQ Procedure
DRIVEN A CAR AFTER A GOOD BIT TO DRINK
q32b Frequency Percent
__________________________________None 186.9691 89.661-3 times 9.372686 4.494-9 times 9.151111 4.3910+ times 3.045 1.46
Frequency Missing = 23.462122711
CRITICIZED BY DATE BECAUSE OF DRINKING
q32c Frequency Percent__________________________________None 202.4503 94.811-3 times 9.058779 4.244-9 times 1.015 0.4810+ times 1.015 0.48
Frequency Missing = 18.460908172
TROUBLE WITH POLICE BECAUSE OF DRINKING
q32d Frequency Percent__________________________________None 203.8051 94.221-3 times 11.60264 5.3610+ times 0.904965 0.42
Frequency Missing = 15.687314601
TROUBLE WITH FRIENDS BECAUSE OF DRUG USE
q32e Frequency Percent__________________________________None 193.2249 91.061-3 times 17.0595 8.044-9 times 1.015 0.4810+ times 0.904965 0.43
Frequency Missing = 19.795647934
DRIVEN A CAR WHILE HIGH FROM DRUGS
q32f Frequency Percent__________________________________None 187.1284 87.931-3 times 14.61623 6.874-9 times 3.065033 1.44
10+ times 8.009965 3.76
Frequency Missing = 19.180335077
The frequencies have been weighted so that theanalysis reflects the distribution of students by grade
level in the campus

8/6/2019 Spring Branch ISD - Westchester Academy - 2004 Texas School Survey of Drug and Alcohol Use
http://slidepdf.com/reader/full/spring-branch-isd-westchester-academy-2004-texas-school-survey-of-drug 78/83
Spring Branch ISD - Westchester AcademySpring 2004
The FREQ Procedure
CRITICIZED BY DATE BECAUSE OF DRUG USE
q32g Frequency Percent
__________________________________None 198.2229 94.181-3 times 9.525116 4.534-9 times 1.864495 0.8910+ times 0.849495 0.40
Frequency Missing = 21.53802409
TROUBLE WITH POLICE BECAUSE OF DRUG USE
q32h Frequency Percent__________________________________None 209.206 98.081-3 times 3.242621 1.524-9 times 0.849495 0.40
Frequency Missing = 18.701915396
CLASS DAYS DRUNK ON ALCOHOL SINCE SEPT
q33a Frequency Percent_________________________________None 197.7222 88.761-3 days 14.85312 6.674-9 days 4.06 1.8210+ days 6.122116 2.75
Frequency Missing = 9.2425296288
CLASS DAYS HIGH ON MARIJUANA SINCE SEPT
q33b Frequency Percent_________________________________None 179.3327 81.191-3 days 19.70796 8.924-9 days 8.896595 4.0310+ days 12.93949 5.86
Frequency Missing = 11.123241994
CLASS DAYS HIGH ON INHALANTS SINCE SEPT
q33c Frequency Percent_________________________________None 212.9126 96.921-3 days 3.808626 1.734-9 days 1.200538 0.55
10+ days 1.754459 0.80
Frequency Missing = 12.323779629
The frequencies have been weighted so that theanalysis reflects the distribution of students by grade
level in the campus

8/6/2019 Spring Branch ISD - Westchester Academy - 2004 Texas School Survey of Drug and Alcohol Use
http://slidepdf.com/reader/full/spring-branch-isd-westchester-academy-2004-texas-school-survey-of-drug 79/83
Spring Branch ISD - Westchester AcademySpring 2004
The FREQ Procedure
CLASS DAYS HIGH ON OTHER DRUG(S)
q33d Frequency Percent
_________________________________None 190.1315 86.241-3 days 17.65067 8.014-9 days 6.866595 3.1110+ days 5.814459 2.64
Frequency Missing = 11.536799801
ALCOHOL USE AT PARTIES THIS SCHOOL YEAR
q34a Frequency Percent_________________________________________Never 94.27346 42.30Seldom 19.96923 8.96Half the time 18.41843 8.26Most of the time 29.77056 13.36
Always 35.47447 15.92Don't know 2.781543 1.25Didn't attend 22.18072 9.95
Frequency Missing = 9.1315904498
DRUG USE AT PARTIES THIS SCHOOL YEAR
q34b Frequency Percent_________________________________________Never 109.416 49.09Seldom 22.47231 10.08Half the time 14.00655 6.28Most of the time 22.07681 9.91Always 25.47921 11.43Don't know 6.036247 2.71
Didn't attend 23.38126 10.49
Frequency Missing = 9.1315904498
SOUGHT HELP FOR DRUG/ALCOHOL PROBLEM
q35 Frequency Percent___________________________________No 175.648 89.30Yes 21.05691 10.70
Frequency Missing = 35.295080411
WOULD SEEK HELP FROM SCHOOL COUNSELOR
q36a Frequency Percent___________________________________No 145.2799 68.00Yes 68.36835 32.00
Frequency Missing = 18.351758586
The frequencies have been weighted so that theanalysis reflects the distribution of students by grade
level in the campus
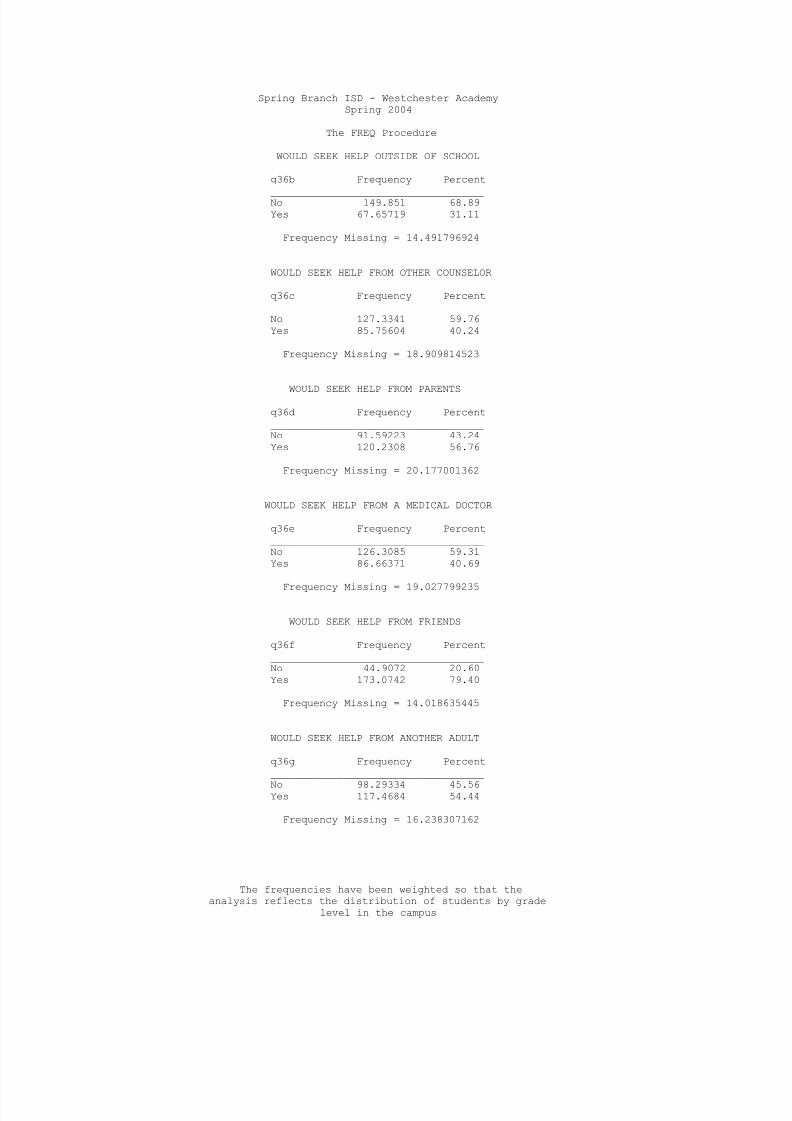
8/6/2019 Spring Branch ISD - Westchester Academy - 2004 Texas School Survey of Drug and Alcohol Use
http://slidepdf.com/reader/full/spring-branch-isd-westchester-academy-2004-texas-school-survey-of-drug 80/83
Spring Branch ISD - Westchester AcademySpring 2004
The FREQ Procedure
WOULD SEEK HELP OUTSIDE OF SCHOOL
q36b Frequency Percent
___________________________________No 149.851 68.89Yes 67.65719 31.11
Frequency Missing = 14.491796924
WOULD SEEK HELP FROM OTHER COUNSELOR
q36c Frequency Percent___________________________________No 127.3341 59.76Yes 85.75604 40.24
Frequency Missing = 18.909814523
WOULD SEEK HELP FROM PARENTS q36d Frequency Percent___________________________________No 91.59223 43.24Yes 120.2308 56.76
Frequency Missing = 20.177001362
WOULD SEEK HELP FROM A MEDICAL DOCTOR
q36e Frequency Percent___________________________________No 126.3085 59.31Yes 86.66371 40.69
Frequency Missing = 19.027799235
WOULD SEEK HELP FROM FRIENDS
q36f Frequency Percent___________________________________No 44.9072 20.60Yes 173.0742 79.40
Frequency Missing = 14.018635445
WOULD SEEK HELP FROM ANOTHER ADULT
q36g Frequency Percent___________________________________
No 98.29334 45.56Yes 117.4684 54.44
Frequency Missing = 16.238307162
The frequencies have been weighted so that theanalysis reflects the distribution of students by grade
level in the campus

8/6/2019 Spring Branch ISD - Westchester Academy - 2004 Texas School Survey of Drug and Alcohol Use
http://slidepdf.com/reader/full/spring-branch-isd-westchester-academy-2004-texas-school-survey-of-drug 81/83
Spring Branch ISD - Westchester AcademySpring 2004
The FREQ Procedure
WOULD NOT SEEK HELP
q36h Frequency Percent
___________________________________No 175.5088 80.07Yes 43.67312 19.93
Frequency Missing = 12.818097811
DRUG/ALCOHOL INFO--HEALTH CLASS
q37a Frequency Percent___________________________________No 67.69016 37.87Yes 111.0674 62.13
Frequency Missing = 53.242432969
DRUG/ALCOHOL INFO--ASSEMBLY PROGRAM q37b Frequency Percent___________________________________No 40.84628 22.81Yes 138.2069 77.19
Frequency Missing = 52.946859874
DRUG/ALCOHOL INFO--GUIDANCE COUNSELOR
q37c Frequency Percent___________________________________No 128.5485 72.67Yes 48.34459 27.33
Frequency Missing = 55.106927919
DRUG/ALCOHOL INFO--SCIENCE CLASS
q37d Frequency Percent___________________________________No 92.15017 52.11Yes 84.69951 47.89
Frequency Missing = 55.150314175
DRUG/ALCOHOL INFO--SOCIAL STUDIES CLASS
q37e Frequency Percent___________________________________
No 140.2469 81.38Yes 32.09395 18.62
Frequency Missing = 59.659147645
The frequencies have been weighted so that theanalysis reflects the distribution of students by grade
level in the campus

8/6/2019 Spring Branch ISD - Westchester Academy - 2004 Texas School Survey of Drug and Alcohol Use
http://slidepdf.com/reader/full/spring-branch-isd-westchester-academy-2004-texas-school-survey-of-drug 82/83
Spring Branch ISD - Westchester AcademySpring 2004
The FREQ Procedure
DRUG/ALCOHOL INFO--DRUG RAP SESSION
q37f Frequency Percent
___________________________________No 124.4017 71.94Yes 48.52137 28.06
Frequency Missing = 59.076925041
DRUG/ALCOHOL INFO--INVITED SCHOOL GUEST
q37g Frequency Percent___________________________________No 73.69644 41.63Yes 103.3187 58.37
Frequency Missing = 54.984809124
DRUG/ALCOHOL INFO--OTHER SCHOOL SOURCE q37h Frequency Percent___________________________________No 108.4944 60.29Yes 71.4637 39.71
Frequency Missing = 52.041895335
PARENTS FEEL ABOUT KIDS SMOKING CIGARET
q38a Frequency Percent__________________________________________Strong disapprove 154.0426 70.01Mild disapprove 23.35419 10.61Neither 14.11176 6.41
Mildly approve 2.215538 1.01Strongly approve 4.579389 2.08Don't know 21.72791 9.87
Frequency Missing = 11.968602861
PARENTS FEEL ABOUT KIDS DRINKING BEER
q38b Frequency Percent__________________________________________Strong disapprove 130.2277 59.54Mild disapprove 40.60859 18.57Neither 17.28754 7.90Mildly approve 4.958714 2.27Strongly approve 4.579389 2.09Don't know 21.04685 9.62
Frequency Missing = 13.29125929
The frequencies have been weighted so that theanalysis reflects the distribution of students by grade
level in the campus

8/6/2019 Spring Branch ISD - Westchester Academy - 2004 Texas School Survey of Drug and Alcohol Use
http://slidepdf.com/reader/full/spring-branch-isd-westchester-academy-2004-texas-school-survey-of-drug 83/83
Spring Branch ISD - Westchester AcademySpring 2004
The FREQ Procedure
PARENTS FEEL ABOUT KIDS USING MARIJUANA
q38c Frequency Percent
__________________________________________Strong disapprove 166.9105 76.67Mild disapprove 22.07994 10.14Neither 2.899528 1.33Mildly approve 1.809929 0.83Strongly approve 4.701507 2.16Don't know 19.29239 8.86
Frequency Missing = 14.30625929
PURCHASED LOTTERY TICKET IN PAST YEAR
q39 Frequency Percent___________________________________No 176.9166 80.16Yes 43.79878 19.84
Frequency Missing = 11.284612962
NON-LOTTERY GAMBLING IN PAST YEAR
q40 Frequency Percent___________________________________No 153.3428 69.19Yes 68.27758 30.81
Frequency Missing = 10.379648423
MONEY SPENT ON GAMBLING IN PAST YEAR
q41 Frequency Percent
___________________________________$0 140.7172 63.64$1 - $10 40.52171 18.33$11 - $50 18.8674 8.53$51 - $100 7.313712 3.31$100+ 13.6848 6.19
Frequency Missing = 10.895203979