Embed Size (px)
Citation preview
8/6/2019 Spring Branch ISD - Northbrook Middle School - 2008 Texas School Survey of Drug and Alcohol Use
http://slidepdf.com/reader/full/spring-branch-isd-northbrook-middle-school-2008-texas-school-survey-of 1/58
Spring Branch ISD - Northbrook Middle School
SPRING 2008
Texas School Survey
of Drug and Alcohol Use
2008
Spring Branch ISD
Campus-Level Analysis
Northbrook Middle School
SECONDARY REPORT-PAGE PA

8/6/2019 Spring Branch ISD - Northbrook Middle School - 2008 Texas School Survey of Drug and Alcohol Use
http://slidepdf.com/reader/full/spring-branch-isd-northbrook-middle-school-2008-texas-school-survey-of 2/58
Spring Branch ISD - Northbrook Middle School
SPRING 2008
Campus-Level AnalysisSecondary (Grades 7-8)
Table of Contents
eneral Substance Tables 5-26
TobaccoAlcoholDrugsInhalantsMiscellaneous
revalence Tables 27-42
Selected Substances:
Table B1: All StudentsTable B2: Male StudentsTable B3: Female StudentsTable B4: White StudentsTable B5: African/American StudentsTable B6: Mexican/American StudentsTable B7: Students Reporting A GradesTable B8: Students Reporting Grades Lower Than an ATable B9: Students Living With 2 ParentsTable B10: Students Not Living With 2 ParentsTable B11: Students who would seek help from adultsTable B12: Students who wouldn’t seek help from adultsTable B13 Students Living in Town More Than 3 YearsTable B14: Students Living in Town 3 Years or Less
argin Tables 43-59
SECONDARY REPORT-PAGE PA

8/6/2019 Spring Branch ISD - Northbrook Middle School - 2008 Texas School Survey of Drug and Alcohol Use
http://slidepdf.com/reader/full/spring-branch-isd-northbrook-middle-school-2008-texas-school-survey-of 3/58
Spring Branch ISD - Northbrook Middle School
SPRING 2008
SECONDARY REPORT-PAGE PA
8/6/2019 Spring Branch ISD - Northbrook Middle School - 2008 Texas School Survey of Drug and Alcohol Use
http://slidepdf.com/reader/full/spring-branch-isd-northbrook-middle-school-2008-texas-school-survey-of 4/58
Spring Branch ISD - Northbrook Middle School
SPRING 2008
1. General Substance Tables
SECONDARY REPORT-PAGE PA

8/6/2019 Spring Branch ISD - Northbrook Middle School - 2008 Texas School Survey of Drug and Alcohol Use
http://slidepdf.com/reader/full/spring-branch-isd-northbrook-middle-school-2008-texas-school-survey-of 5/58
Spring Branch ISD - Northbrook Middle School
SPRING 2008
SECONDARY REPORT-PAGE PA
8/6/2019 Spring Branch ISD - Northbrook Middle School - 2008 Texas School Survey of Drug and Alcohol Use
http://slidepdf.com/reader/full/spring-branch-isd-northbrook-middle-school-2008-texas-school-survey-of 6/58
Spring Branch ISD - Northbrook Middle School
SPRING 2008
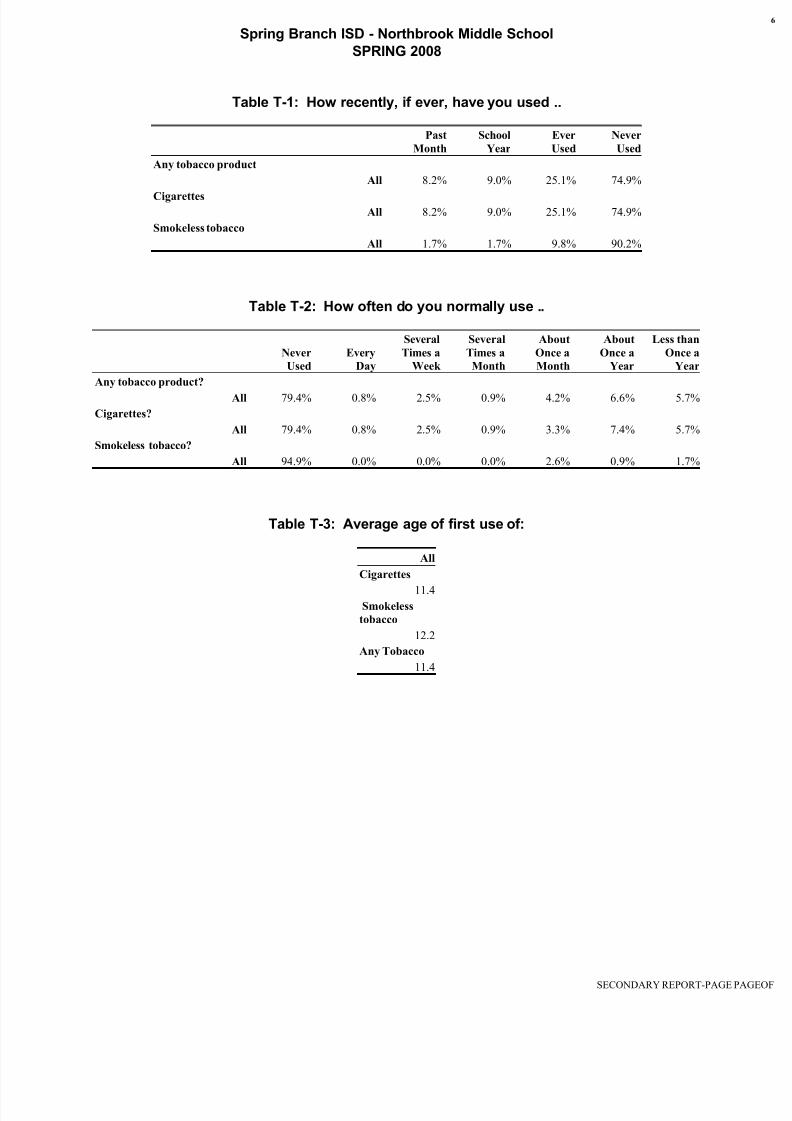
Table T-1: How recently, if ever, have you used ..
Past
Month
School
Year
Ever
Used
Never
Used
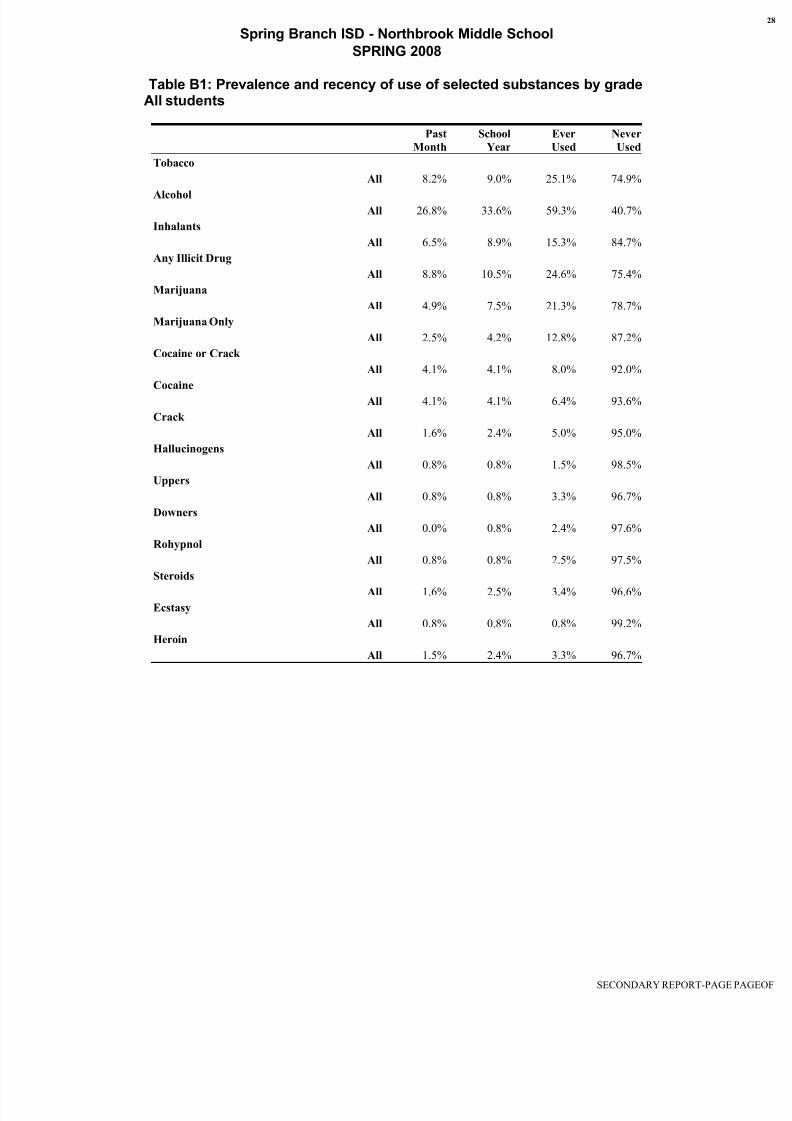
Any tobacco product
All 8.2% 9.0% 25.1% 74.9%
CigarettesAll 8.2% 9.0% 25.1% 74.9%
Smokeless tobacco
All 1.7% 1.7% 9.8% 90.2%
Table T-2: How often do you normally use ..
Never
Used
Every
Day
Several
Times a
Week
Several
Times a
Month
About
Once a
Month
About
Once a
Year
Less than
Once a
Year
Any tobacco product?
All 79.4% 0.8% 2.5% 0.9% 4.2% 6.6% 5.7%
Cigarettes?
All 79.4% 0.8% 2.5% 0.9% 3.3% 7.4% 5.7%
Smokeless tobacco?
All 94.9% 0.0% 0.0% 0.0% 2.6% 0.9% 1.7%
Table T-3: Average age of first use of:
All
Cigarettes
11.4Smokeless
tobacco
12.2
Any Tobacco
11.4
SECONDARY REPORT-PAGE PA
8/6/2019 Spring Branch ISD - Northbrook Middle School - 2008 Texas School Survey of Drug and Alcohol Use
http://slidepdf.com/reader/full/spring-branch-isd-northbrook-middle-school-2008-texas-school-survey-of 7/58
Spring Branch ISD - Northbrook Middle School
SPRING 2008
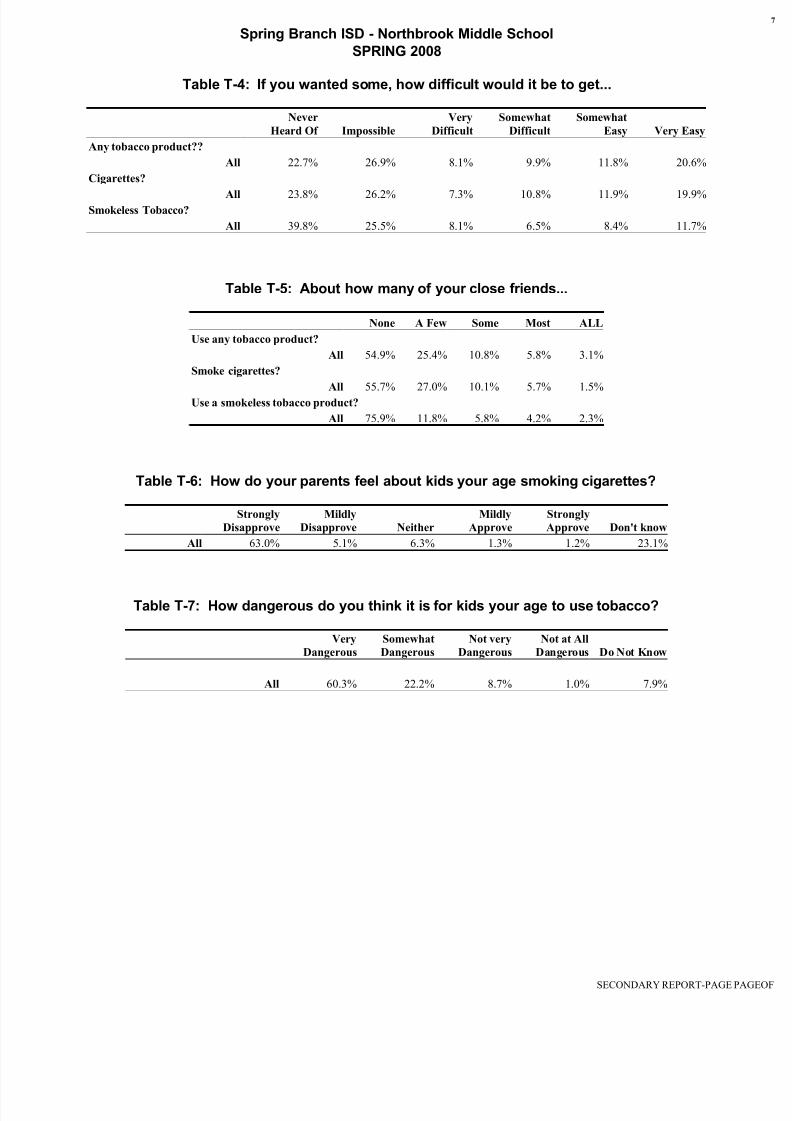
Table T-4: If you wanted some, how difficult would it be to get...
Never
Heard Of Impossible
Very
Difficult
Somewhat
Difficult
Somewhat
Easy Very Easy
Any tobacco product??
All 22.7% 26.9% 8.1% 9.9% 11.8% 20.6%
Cigarettes?
All 23.8% 26.2% 7.3% 10.8% 11.9% 19.9%Smokeless Tobacco?
All 39.8% 25.5% 8.1% 6.5% 8.4% 11.7%
Table T-5: About how many of your close friends...
None A Few Some Most ALL
Use any tobacco product?
All 54.9% 25.4% 10.8% 5.8% 3.1%
Smoke cigarettes?
All 55.7% 27.0% 10.1% 5.7% 1.5%Use a smokeless tobacco product?
All 75.9% 11.8% 5.8% 4.2% 2.3%
Table T-6: How do your parents feel about kids your age smoking cigarettes?
Strongly
Disapprove
Mildly
Disapprove Neither
Mildly
Approve
Strongly
Approve Don't know
All 63.0% 5.1% 6.3% 1.3% 1.2% 23.1%
Table T-7: How dangerous do you think it is for kids your age to use tobacco?
Very
Dangerous
Somewhat
Dangerous
Not very
Dangerous
Not at All
Dangerous Do Not Know
All 60.3% 22.2% 8.7% 1.0% 7.9%
SECONDARY REPORT-PAGE PA

8/6/2019 Spring Branch ISD - Northbrook Middle School - 2008 Texas School Survey of Drug and Alcohol Use
http://slidepdf.com/reader/full/spring-branch-isd-northbrook-middle-school-2008-texas-school-survey-of 8/58
Spring Branch ISD - Northbrook Middle School
SPRING 2008
Table A-1: How recently, if ever, have you used...
Past
Month
School
Year
Ever
Used
Never
Used
Any alcohol product
All 26.8% 33.6% 59.3% 40.7%
Beer
All 12.4% 17.7% 41.6% 58.4%Wine coolers
All 13.0% 18.2% 38.2% 61.8%
Wine
All 9.2% 16.7% 29.3% 70.7%
Liquor
All 10.0% 12.6% 26.6% 73.4%
Table A-2: How often do you normally use...
Never
Used
Every
Day
Several
Times a
Week
Several
Times a
Month
About
Once a
Month
About
Once a
Year
Less than
Once a
Year
Any alcohol product?
All 53.9% 0.8% 6.6% 10.1% 10.0% 9.0% 9.7%
Beer?
All 63.5% 0.0% 5.8% 7.6% 10.1% 4.0% 9.0%
Wine coolers?
All 69.0% 0.8% 3.3% 5.2% 11.9% 5.0% 4.9%
Wine?
All 73.5% 0.0% 1.7% 6.1% 7.5% 6.9% 4.3%
Liquor?
All 80.6% 0.0% 2.5% 5.2% 4.1% 4.4% 3.2%
Table A-3: When you drink the following alcoholic beverages, how many drinks doyou usually have at one time, on average?
Never Ever 5 or More 1 to 4 Less than 1
Beer
All 77.3% 22.7% 4.4% 11.4% 6.9%
Wine Coolers
All 70.5% 29.5% 2.4% 18.3% 8.8%
Wine
All 62.0% 38.0% 10.9% 23.5% 3.5%
Liquor
All 51.1% 48.9% 11.9% 23.3% 13.7%
SECONDARY REPORT-PAGE PA
8/6/2019 Spring Branch ISD - Northbrook Middle School - 2008 Texas School Survey of Drug and Alcohol Use
http://slidepdf.com/reader/full/spring-branch-isd-northbrook-middle-school-2008-texas-school-survey-of 9/58
Spring Branch ISD - Northbrook Middle School
SPRING 2008
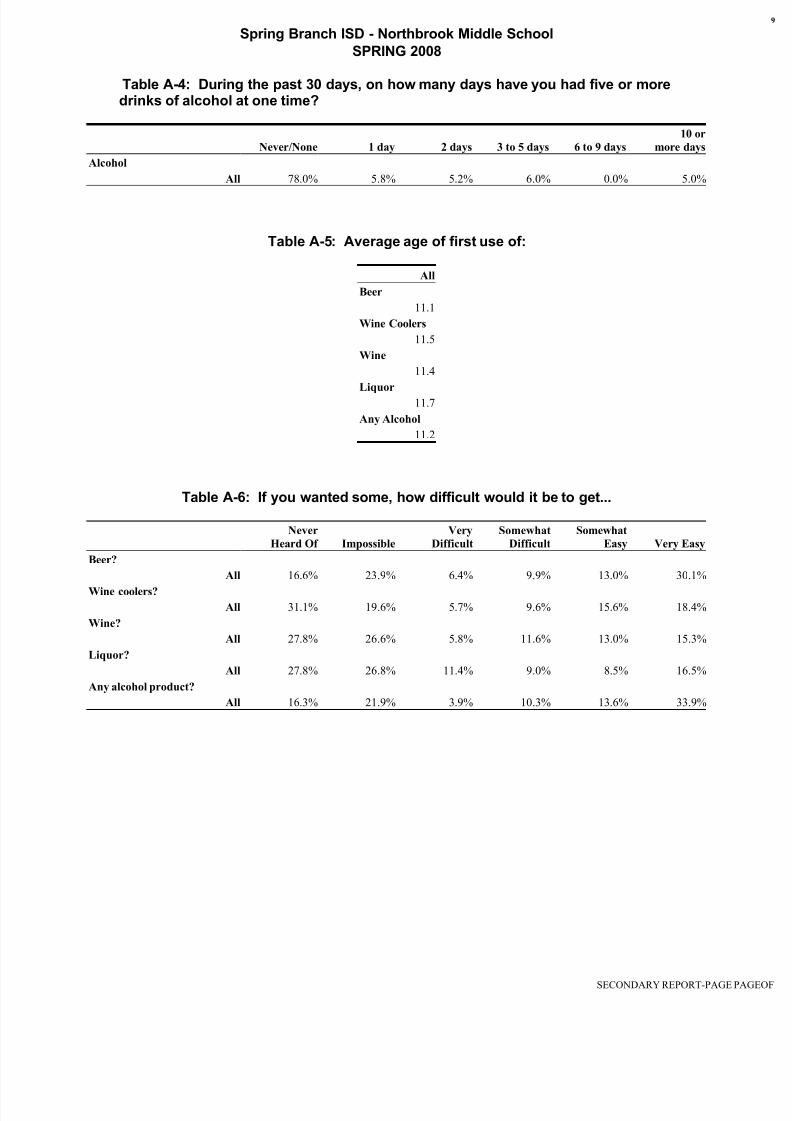
Table A-4: During the past 30 days, on how many days have you had five or moredrinks of alcohol at one time?
Never/None 1 day 2 days 3 to 5 days 6 to 9 days
10 or
more days
Alcohol
All 78.0% 5.8% 5.2% 6.0% 0.0% 5.0%
Table A-5: Average age of first use of:
All
Beer
11.1
Wine Coolers
11.5
Wine
11.4
Liquor11.7
Any Alcohol
11.2
Table A-6: If you wanted some, how difficult would it be to get...
Never
Heard Of Impossible
Very
Difficult
Somewhat
Difficult
Somewhat
Easy Very Easy
Beer?
All 16.6% 23.9% 6.4% 9.9% 13.0% 30.1%
Wine coolers?
All 31.1% 19.6% 5.7% 9.6% 15.6% 18.4%
Wine?
All 27.8% 26.6% 5.8% 11.6% 13.0% 15.3%
Liquor?
All 27.8% 26.8% 11.4% 9.0% 8.5% 16.5%
Any alcohol product?
All 16.3% 21.9% 3.9% 10.3% 13.6% 33.9%
SECONDARY REPORT-PAGE PA

8/6/2019 Spring Branch ISD - Northbrook Middle School - 2008 Texas School Survey of Drug and Alcohol Use
http://slidepdf.com/reader/full/spring-branch-isd-northbrook-middle-school-2008-texas-school-survey-of 10/58
Spring Branch ISD - Northbrook Middle School
SPRING 2008
Table A-7: Since school began in the fall, on how many days (if any) have you...
None 1-3 Times 4-9 Times 10+ Times
Attended class while drunk on alcohol?
All 90.2% 8.7% 1.1% 0.0%
Gotten into trouble with teachers because of your drinking?
All 96.8% 2.1% 1.1% 0.0%
Table A-8: School year use of alcohol by absences and conduct problems:
Average days absent due to
illness or other reasons
Alcohol Users: 4.8
Alcohol Non-use 3.2
Average days conduct problems
reported
Alcohol Users: 5.6
Alcohol Non-use 1.0
Table A-9: During the past twelve months, how many times have you...
None 1-3 Times 4-9 Times 10+ Times
Driven a car when you've had a good bit to drink?
* 0.0% 0.0% 0.0% 0.0%
Gotten into trouble with the police because of drinking?
All 97.9% 1.1% 1.1% 0.0%
SECONDARY REPORT-PAGE PA
8/6/2019 Spring Branch ISD - Northbrook Middle School - 2008 Texas School Survey of Drug and Alcohol Use
http://slidepdf.com/reader/full/spring-branch-isd-northbrook-middle-school-2008-texas-school-survey-of 11/58
Spring Branch ISD - Northbrook Middle School
SPRING 2008
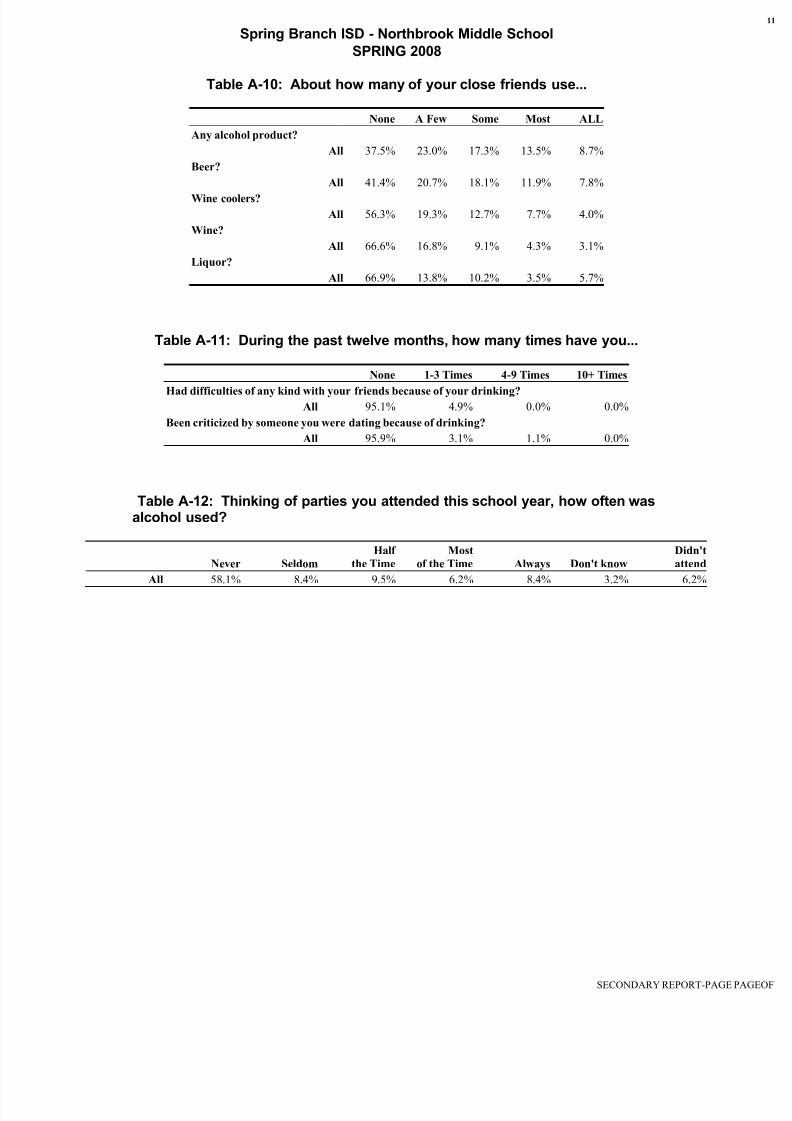
Table A-10: About how many of your close friends use...
None A Few Some Most ALL
Any alcohol product?
All 37.5% 23.0% 17.3% 13.5% 8.7%
Beer?
All 41.4% 20.7% 18.1% 11.9% 7.8%
Wine coolers?
All 56.3% 19.3% 12.7% 7.7% 4.0%
Wine?
All 66.6% 16.8% 9.1% 4.3% 3.1%
Liquor?
All 66.9% 13.8% 10.2% 3.5% 5.7%
Table A-11: During the past twelve months, how many times have you...
None 1-3 Times 4-9 Times 10+ Times
Had difficulties of any kind with your friends because of your drinking?All 95.1% 4.9% 0.0% 0.0%
Been criticized by someone you were dating because of drinking?
All 95.9% 3.1% 1.1% 0.0%
Table A-12: Thinking of parties you attended this school year, how often wasalcohol used?
Never Seldom
Half
the Time
Most
of the Time Always Don't know
Didn't
attend
All 58.1% 8.4% 9.5% 6.2% 8.4% 3.2% 6.2%
SECONDARY REPORT-PAGE PA
8/6/2019 Spring Branch ISD - Northbrook Middle School - 2008 Texas School Survey of Drug and Alcohol Use
http://slidepdf.com/reader/full/spring-branch-isd-northbrook-middle-school-2008-texas-school-survey-of 12/58
Spring Branch ISD - Northbrook Middle School
SPRING 2008
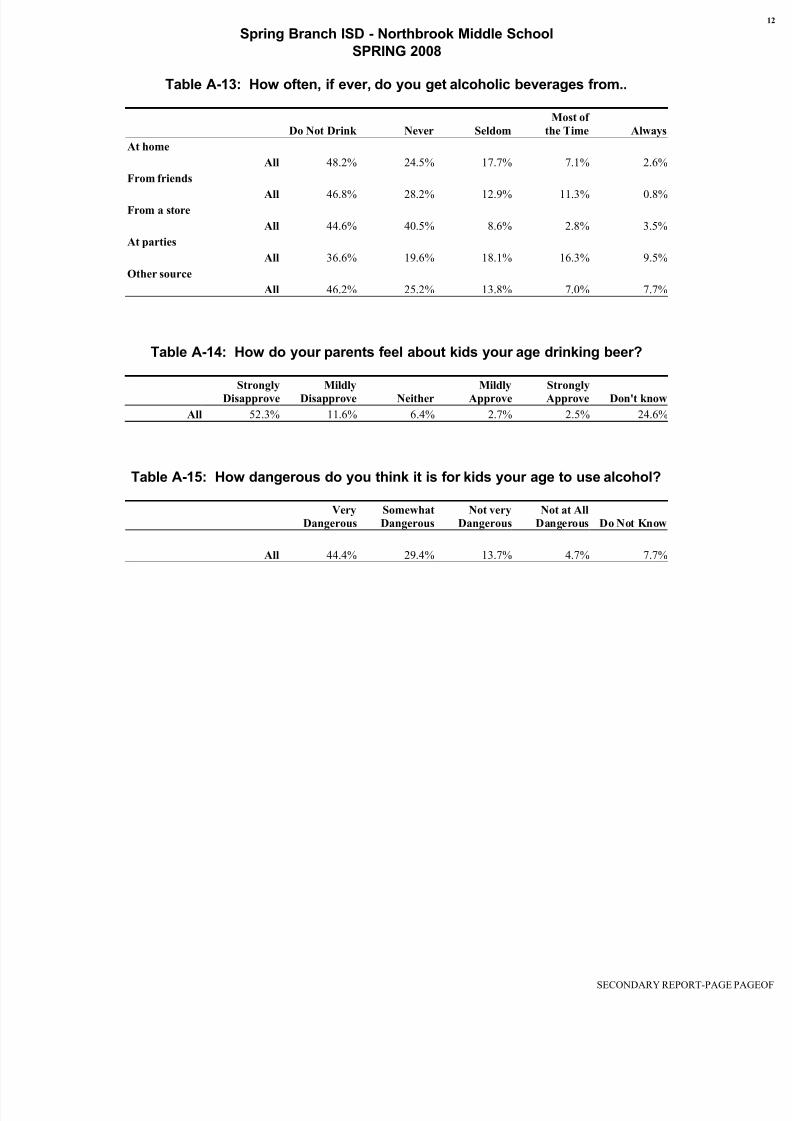
Table A-13: How often, if ever, do you get alcoholic beverages from..
Do Not Drink Never Seldom
Most of
the Time Always
At home
All 48.2% 24.5% 17.7% 7.1% 2.6%
From friends
All 46.8% 28.2% 12.9% 11.3% 0.8%From a store
All 44.6% 40.5% 8.6% 2.8% 3.5%
At parties
All 36.6% 19.6% 18.1% 16.3% 9.5%
Other source
All 46.2% 25.2% 13.8% 7.0% 7.7%
Table A-14: How do your parents feel about kids your age drinking beer?
Strongly
Disapprove
Mildly
Disapprove Neither
Mildly
Approve
Strongly
Approve Don't know
All 52.3% 11.6% 6.4% 2.7% 2.5% 24.6%
Table A-15: How dangerous do you think it is for kids your age to use alcohol?
Very
Dangerous
Somewhat
Dangerous
Not very
Dangerous
Not at All
Dangerous Do Not Know
All 44.4% 29.4% 13.7% 4.7% 7.7%
SECONDARY REPORT-PAGE PA
8/6/2019 Spring Branch ISD - Northbrook Middle School - 2008 Texas School Survey of Drug and Alcohol Use
http://slidepdf.com/reader/full/spring-branch-isd-northbrook-middle-school-2008-texas-school-survey-of 13/58
Spring Branch ISD - Northbrook Middle School
SPRING 2008
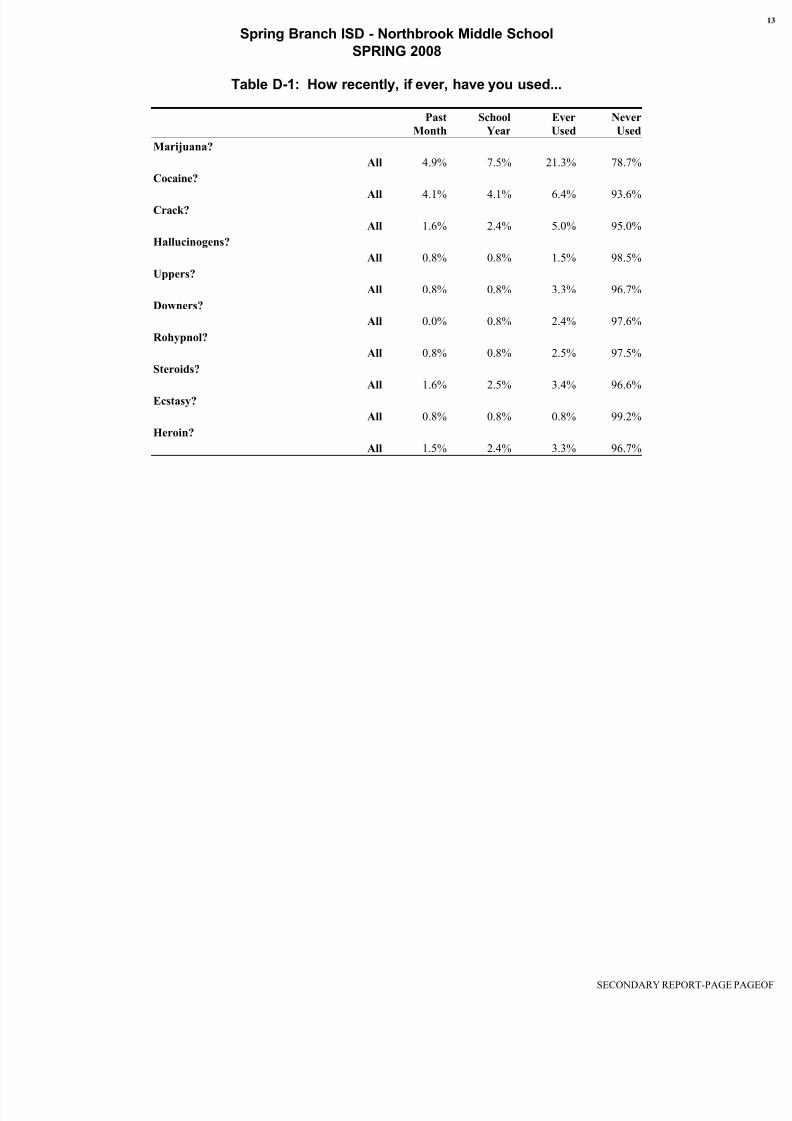
Table D-1: How recently, if ever, have you used...
Past
Month
School
Year
Ever
Used
Never
Used
Marijuana?
All 4.9% 7.5% 21.3% 78.7%
Cocaine?
All 4.1% 4.1% 6.4% 93.6%Crack?
All 1.6% 2.4% 5.0% 95.0%
Hallucinogens?
All 0.8% 0.8% 1.5% 98.5%
Uppers?
All 0.8% 0.8% 3.3% 96.7%
Downers?
All 0.0% 0.8% 2.4% 97.6%
Rohypnol?
All 0.8% 0.8% 2.5% 97.5%
Steroids?
All 1.6% 2.5% 3.4% 96.6%
Ecstasy?
All 0.8% 0.8% 0.8% 99.2%
Heroin?
All 1.5% 2.4% 3.3% 96.7%
SECONDARY REPORT-PAGE PA
8/6/2019 Spring Branch ISD - Northbrook Middle School - 2008 Texas School Survey of Drug and Alcohol Use
http://slidepdf.com/reader/full/spring-branch-isd-northbrook-middle-school-2008-texas-school-survey-of 14/58
Spring Branch ISD - Northbrook Middle School
SPRING 2008
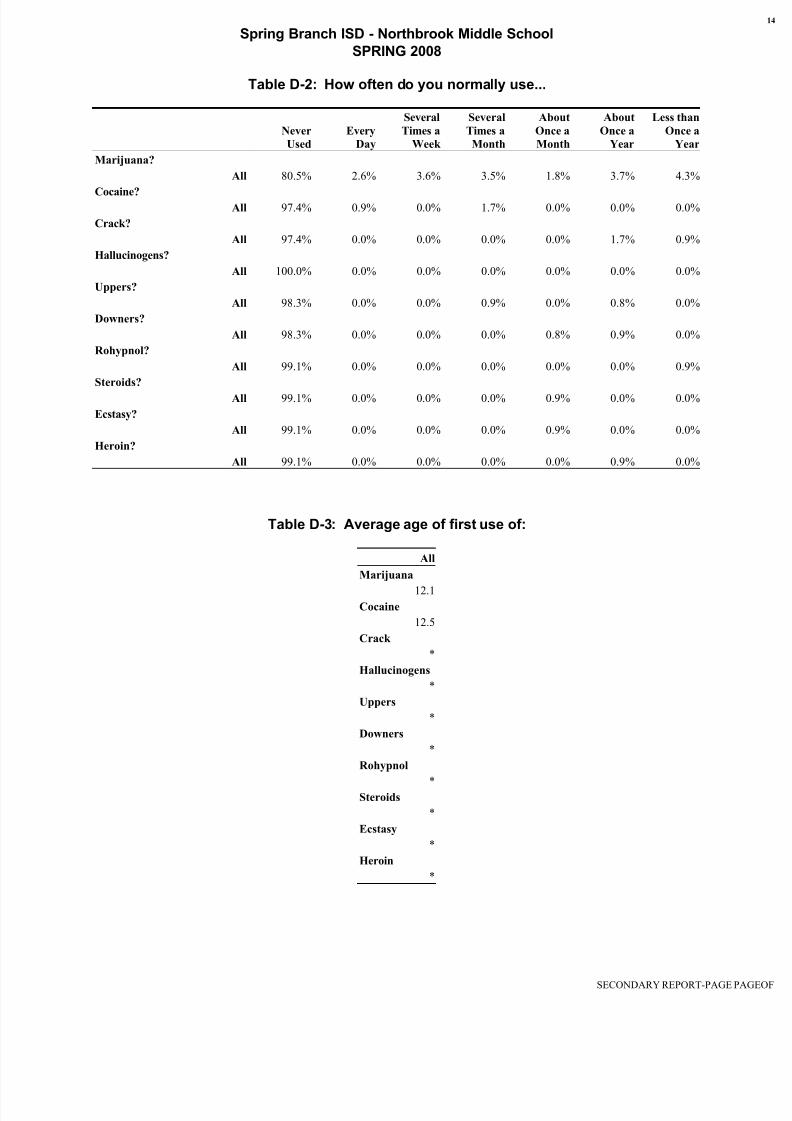
Table D-2: How often do you normally use...
Never
Used
Every
Day
Several
Times a
Week
Several
Times a
Month
About
Once a
Month
About
Once a
Year
Less than
Once a
Year
Marijuana?
All 80.5% 2.6% 3.6% 3.5% 1.8% 3.7% 4.3%
Cocaine?All 97.4% 0.9% 0.0% 1.7% 0.0% 0.0% 0.0%
Crack?
All 97.4% 0.0% 0.0% 0.0% 0.0% 1.7% 0.9%
Hallucinogens?
All 100.0% 0.0% 0.0% 0.0% 0.0% 0.0% 0.0%
Uppers?
All 98.3% 0.0% 0.0% 0.9% 0.0% 0.8% 0.0%
Downers?
All 98.3% 0.0% 0.0% 0.0% 0.8% 0.9% 0.0%
Rohypnol?
All 99.1% 0.0% 0.0% 0.0% 0.0% 0.0% 0.9%
Steroids?
All 99.1% 0.0% 0.0% 0.0% 0.9% 0.0% 0.0%
Ecstasy?
All 99.1% 0.0% 0.0% 0.0% 0.9% 0.0% 0.0%
Heroin?
All 99.1% 0.0% 0.0% 0.0% 0.0% 0.9% 0.0%
Table D-3: Average age of first use of:
All
Marijuana
12.1Cocaine
12.5
Crack
*
Hallucinogens
*
Uppers
*
Downers
*
Rohypnol
*Steroids
*
Ecstasy
*
Heroin
*
SECONDARY REPORT-PAGE PA
8/6/2019 Spring Branch ISD - Northbrook Middle School - 2008 Texas School Survey of Drug and Alcohol Use
http://slidepdf.com/reader/full/spring-branch-isd-northbrook-middle-school-2008-texas-school-survey-of 15/58
Spring Branch ISD - Northbrook Middle School
SPRING 2008
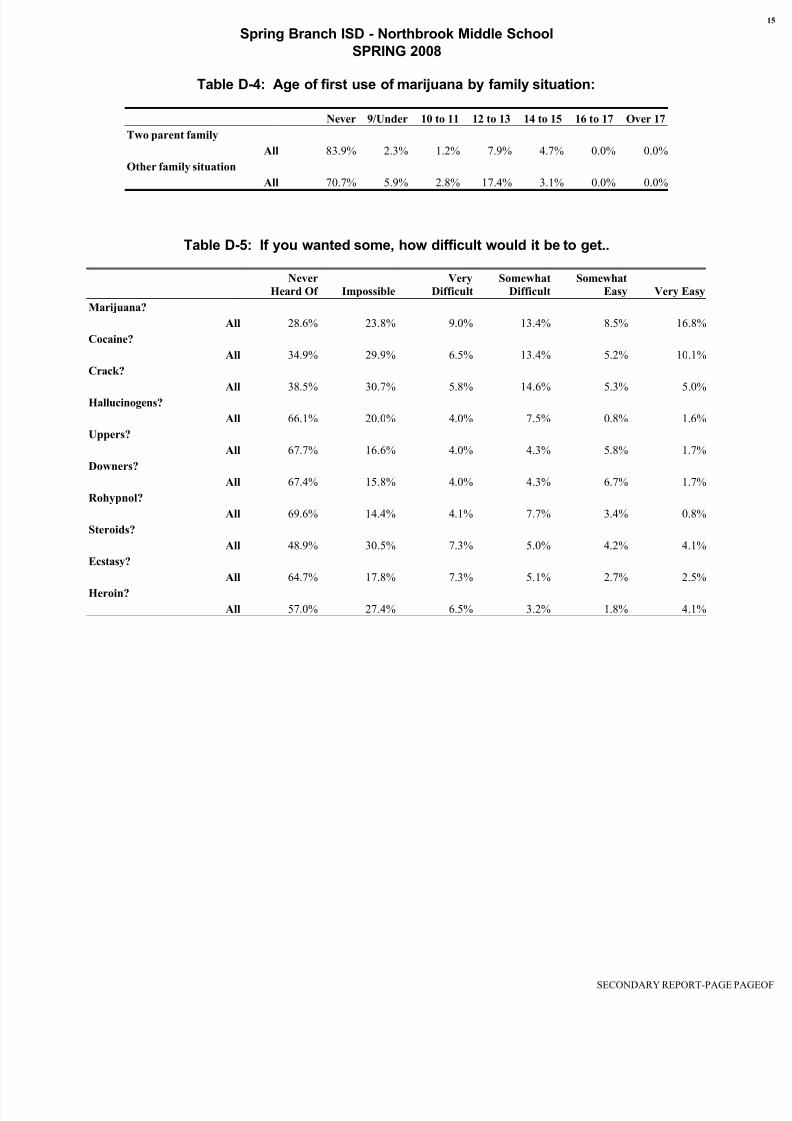
Table D-4: Age of first use of marijuana by family situation:
Never 9/Under 10 to 11 12 to 13 14 to 15 16 to 17 Over 17
Two parent family
All 83.9% 2.3% 1.2% 7.9% 4.7% 0.0% 0.0%
Other family situation
All 70.7% 5.9% 2.8% 17.4% 3.1% 0.0% 0.0%
Table D-5: If you wanted some, how difficult would it be to get..
Never
Heard Of Impossible
Very
Difficult
Somewhat
Difficult
Somewhat
Easy Very Easy
Marijuana?
All 28.6% 23.8% 9.0% 13.4% 8.5% 16.8%
Cocaine?
All 34.9% 29.9% 6.5% 13.4% 5.2% 10.1%
Crack?
All 38.5% 30.7% 5.8% 14.6% 5.3% 5.0%Hallucinogens?
All 66.1% 20.0% 4.0% 7.5% 0.8% 1.6%
Uppers?
All 67.7% 16.6% 4.0% 4.3% 5.8% 1.7%
Downers?
All 67.4% 15.8% 4.0% 4.3% 6.7% 1.7%
Rohypnol?
All 69.6% 14.4% 4.1% 7.7% 3.4% 0.8%
Steroids?
All 48.9% 30.5% 7.3% 5.0% 4.2% 4.1%
Ecstasy?
All 64.7% 17.8% 7.3% 5.1% 2.7% 2.5%
Heroin?
All 57.0% 27.4% 6.5% 3.2% 1.8% 4.1%
SECONDARY REPORT-PAGE PA

8/6/2019 Spring Branch ISD - Northbrook Middle School - 2008 Texas School Survey of Drug and Alcohol Use
http://slidepdf.com/reader/full/spring-branch-isd-northbrook-middle-school-2008-texas-school-survey-of 16/58
Spring Branch ISD - Northbrook Middle School
SPRING 2008
Table D-6: Since school began in the fall, on how many days (if any) have you..
None 1-3 Times 4-9 Times 10+ Times
Attended class while high from marijuana use?
All 89.3% 7.5% 2.1% 1.1%
Attended class while high from use of some other drug?
All 93.3% 4.4% 1.1% 1.1%
Gotten into trouble with teachers because of your drug use?
All 95.9% 3.1% 1.0% 0.0%
Table D-7: School year use of marijuana by absences and conduct problems:
Average days absent due to
illness or other reasons
Marijuana Users: 4.9
Marijuana Non-use 3.6
Average days conduct problems
reported
Marijuana Users: 13.3
Marijuana Non-use 1.7
Table D-8: During the past twelve months, how many times have you..
None 1-3 Times 4-9 Times 10+ Times
Driven a car when you've felt high from drugs?
* 0.0% 0.0% 0.0% 0.0%
Gotten into trouble with the police because of drug use?All 97.9% 1.1% 1.1% 0.0%
SECONDARY REPORT-PAGE PA
8/6/2019 Spring Branch ISD - Northbrook Middle School - 2008 Texas School Survey of Drug and Alcohol Use
http://slidepdf.com/reader/full/spring-branch-isd-northbrook-middle-school-2008-texas-school-survey-of 17/58
8/6/2019 Spring Branch ISD - Northbrook Middle School - 2008 Texas School Survey of Drug and Alcohol Use
http://slidepdf.com/reader/full/spring-branch-isd-northbrook-middle-school-2008-texas-school-survey-of 18/58
Spring Branch ISD - Northbrook Middle School
SPRING 2008
Table D-13: How do your parents feel about kids your age using marijuana?
Strongly
Disapprove
Mildly
Disapprove Neither
Mildly
Approve
Strongly
Approve Don't know
All 65.5% 2.6% 7.6% 1.3% 1.2% 21.8%
Table D-14: How dangerous do you think it is for kids your age to use...
Very
Dangerous
Somewhat
Dangerous
Not very
Dangerous
Not at All
Dangerous Do Not Know
Marijuana?
All 58.8% 19.7% 8.8% 3.9% 8.8%
Cocaine?
All 74.8% 10.2% 5.0% 1.1% 9.0%
Crack?
All 76.7% 10.3% 1.9% 1.1% 10.1%
Ecstasy?
All 73.9% 5.0% 2.7% 0.0% 18.4%
Steroids?
All 69.5% 10.5% 2.7% 0.0% 17.2%
Heroin?
All 68.4% 10.7% 1.8% 0.0% 19.0%
SECONDARY REPORT-PAGE PA
8/6/2019 Spring Branch ISD - Northbrook Middle School - 2008 Texas School Survey of Drug and Alcohol Use
http://slidepdf.com/reader/full/spring-branch-isd-northbrook-middle-school-2008-texas-school-survey-of 19/58
Spring Branch ISD - Northbrook Middle School
SPRING 2008
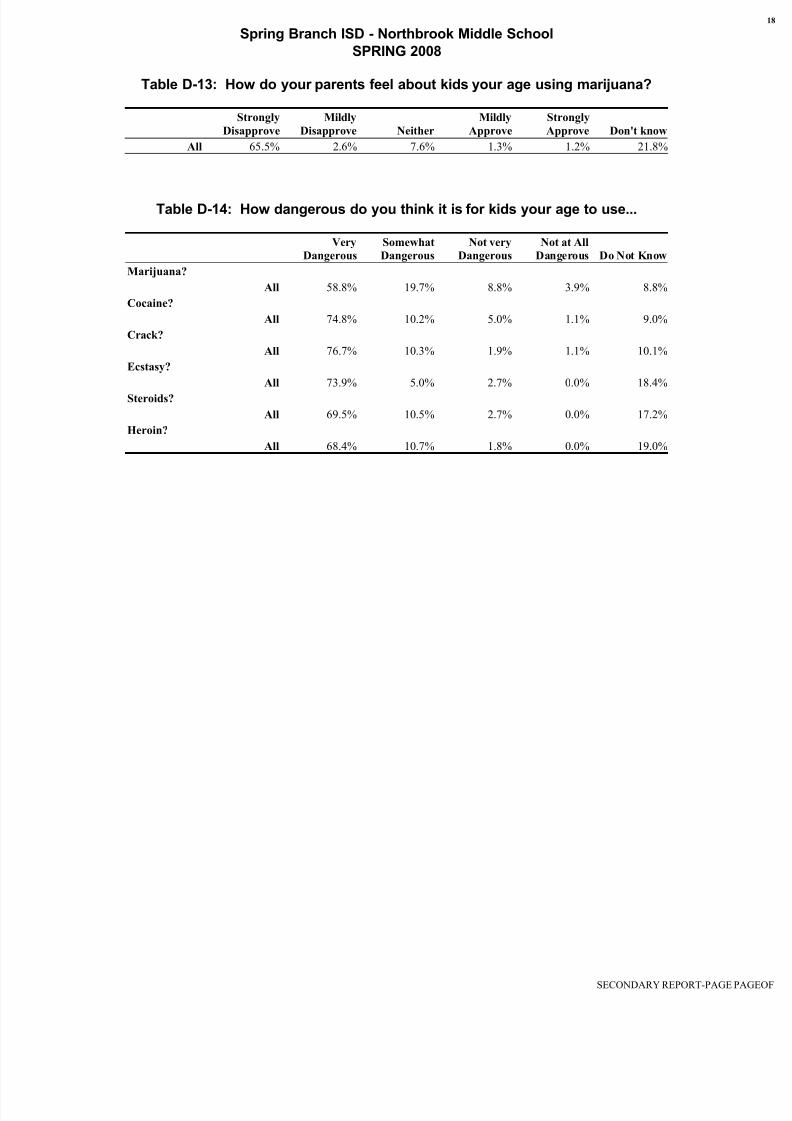
Table D-15: How recently, if ever, have you taken...
Past
Month
School
Year
Ever
Used
Never
Used
Methamphetamine?
All 2.6% 3.5% 7.6% 92.4%
Table D-16: How recently, if ever, have you used...
Past
Month
School
Year
Ever
Used
Never
Used
Codeine?
All 1.0% 1.0% 1.8% 98.2%
Oxycontin, Percodan or Percocet?
All 0.0% 0.0% 1.0% 99.0%
Vicodin, Lortab or Lorcet?
All 0.0% 0.0% 1.0% 99.0%
Valium or Diazepam?
All 0.0% 0.0% 0.0% 100.0%
Xanax or Alprazolam?
All 6.1% 6.9% 9.5% 90.5%
Table D-17: How recently, if ever, have you taken...
Past
Month
School
Year
Ever
Used
Never
Used
DXM, Triple C?
All 1.8% 1.8% 2.8% 97.2%
SECONDARY REPORT-PAGE PA

8/6/2019 Spring Branch ISD - Northbrook Middle School - 2008 Texas School Survey of Drug and Alcohol Use
http://slidepdf.com/reader/full/spring-branch-isd-northbrook-middle-school-2008-texas-school-survey-of 20/58
Spring Branch ISD - Northbrook Middle School
SPRING 2008
Table I-1: How recently, if ever, have you used...
Past
Month
School
Year
Ever
Used
Never
Used
Any inhalant?
All 6.5% 8.9% 15.3% 84.7%
Table I-2: How often do you normally use inhalants?
Never
Used
Every
Day
Several
Times a
Week
Several
Times a
Month
About
Once a
Month
About
Once a
Year
Less than
Once a
Year
All 91.5% 0.8% 0.0% 1.7% 3.4% 1.7% 0.8%
Table I-3: Average age of first use of:
All
Inhalants
11.1
SECONDARY REPORT-PAGE PA
8/6/2019 Spring Branch ISD - Northbrook Middle School - 2008 Texas School Survey of Drug and Alcohol Use
http://slidepdf.com/reader/full/spring-branch-isd-northbrook-middle-school-2008-texas-school-survey-of 21/58
Spring Branch ISD - Northbrook Middle School
SPRING 2008
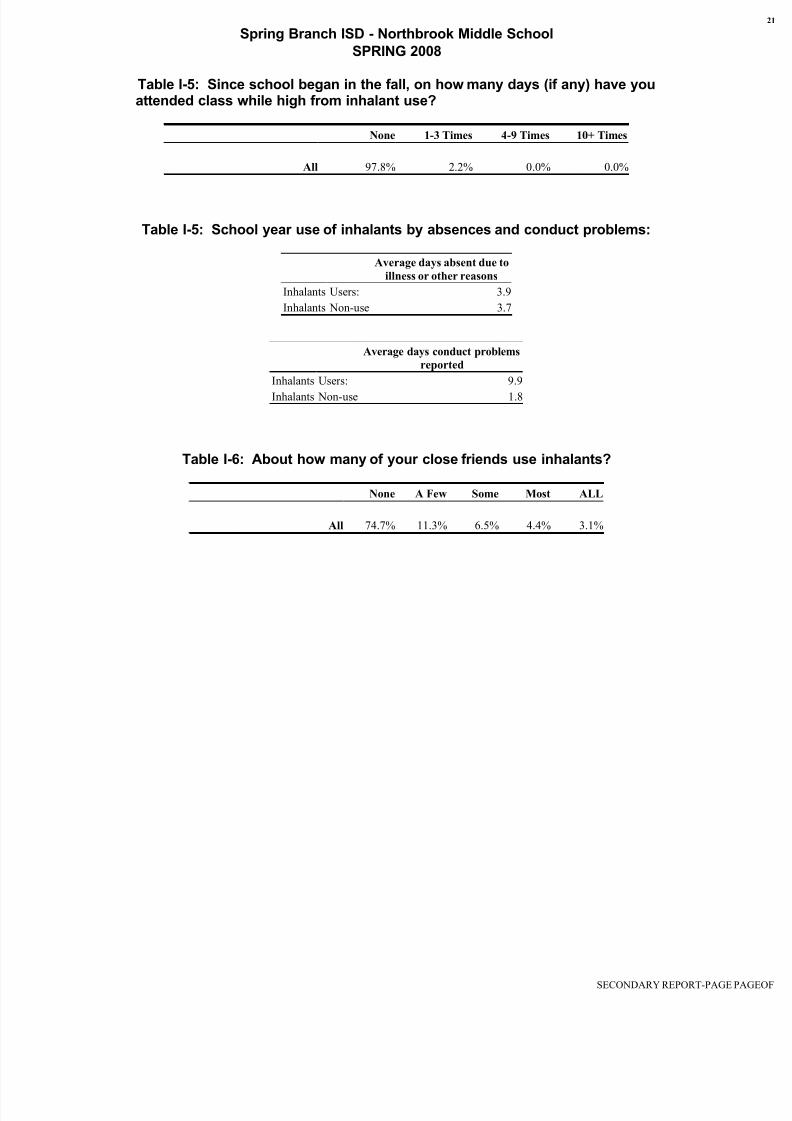
Table I-5: Since school began in the fall, on how many days (if any) have youattended class while high from inhalant use?
None 1-3 Times 4-9 Times 10+ Times
All 97.8% 2.2% 0.0% 0.0%
Table I-5: School year use of inhalants by absences and conduct problems:
Average days absent due to
illness or other reasons
Inhalants Users: 3.9
Inhalants Non-use 3.7
Average days conduct problems
reported
Inhalants Users: 9.9
Inhalants Non-use 1.8
Table I-6: About how many of your close friends use inhalants?
None A Few Some Most ALL
All 74.7% 11.3% 6.5% 4.4% 3.1%
SECONDARY REPORT-PAGE PA
8/6/2019 Spring Branch ISD - Northbrook Middle School - 2008 Texas School Survey of Drug and Alcohol Use
http://slidepdf.com/reader/full/spring-branch-isd-northbrook-middle-school-2008-texas-school-survey-of 22/58
Spring Branch ISD - Northbrook Middle School
SPRING 2008
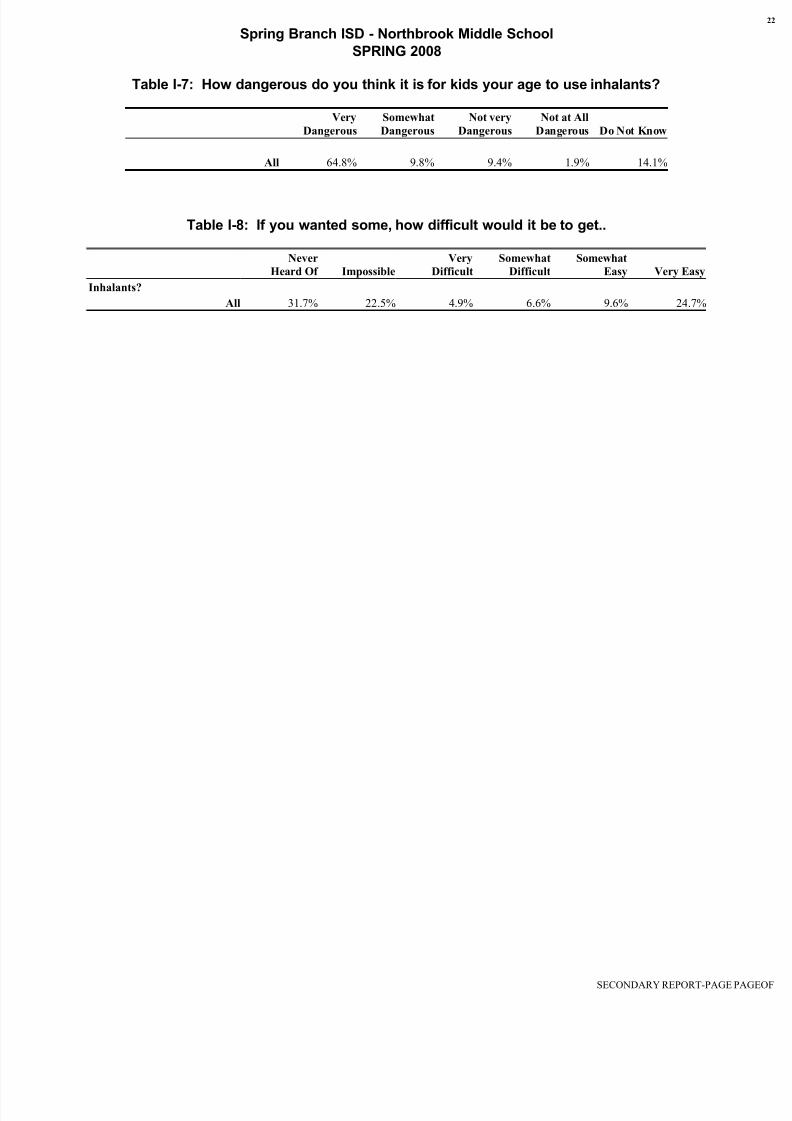
Table I-7: How dangerous do you think it is for kids your age to use inhalants?
Very
Dangerous
Somewhat
Dangerous
Not very
Dangerous
Not at All
Dangerous Do Not Know
All 64.8% 9.8% 9.4% 1.9% 14.1%
Table I-8: If you wanted some, how difficult would it be to get..
Never
Heard Of Impossible
Very
Difficult
Somewhat
Difficult
Somewhat
Easy Very Easy
Inhalants?
All 31.7% 22.5% 4.9% 6.6% 9.6% 24.7%
SECONDARY REPORT-PAGE PA
8/6/2019 Spring Branch ISD - Northbrook Middle School - 2008 Texas School Survey of Drug and Alcohol Use
http://slidepdf.com/reader/full/spring-branch-isd-northbrook-middle-school-2008-texas-school-survey-of 23/58
8/6/2019 Spring Branch ISD - Northbrook Middle School - 2008 Texas School Survey of Drug and Alcohol Use
http://slidepdf.com/reader/full/spring-branch-isd-northbrook-middle-school-2008-texas-school-survey-of 24/58
Spring Branch ISD - Northbrook Middle School
SPRING 2008
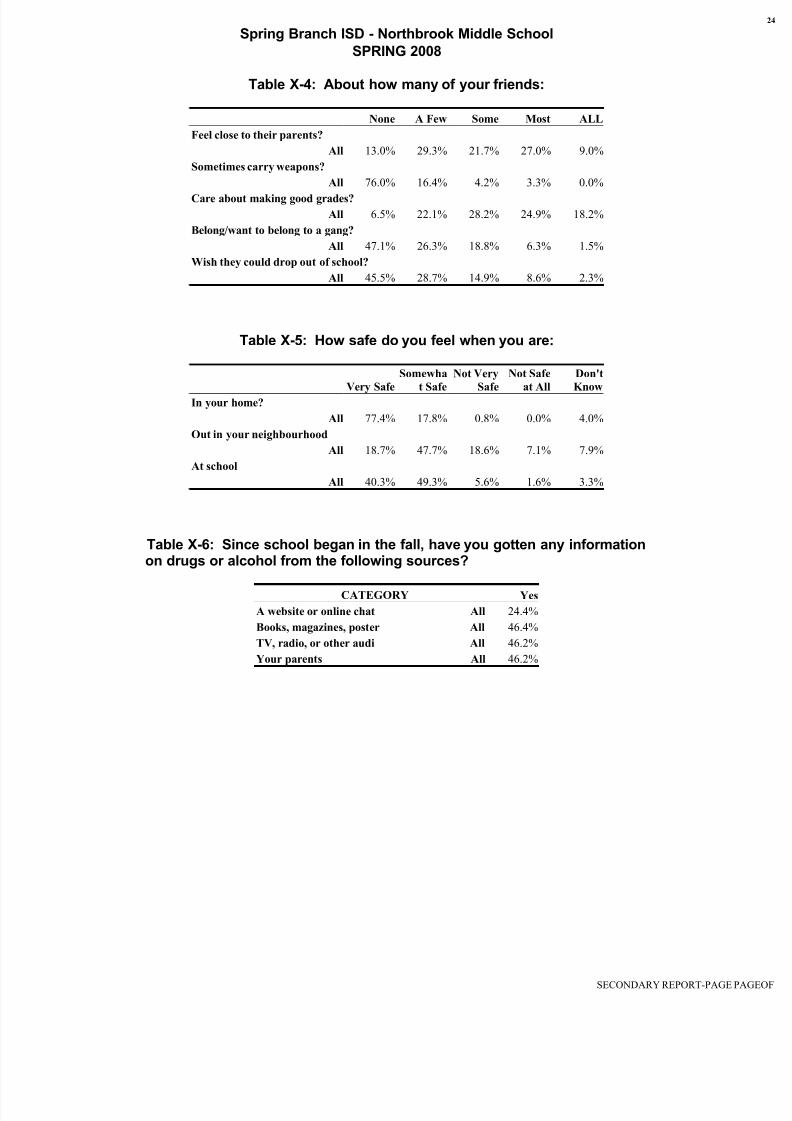
Table X-4: About how many of your friends:
None A Few Some Most ALL
Feel close to their parents?
All 13.0% 29.3% 21.7% 27.0% 9.0%
Sometimes carry weapons?
All 76.0% 16.4% 4.2% 3.3% 0.0%
Care about making good grades?
All 6.5% 22.1% 28.2% 24.9% 18.2%
Belong/want to belong to a gang?
All 47.1% 26.3% 18.8% 6.3% 1.5%
Wish they could drop out of school?
All 45.5% 28.7% 14.9% 8.6% 2.3%
Table X-5: How safe do you feel when you are:
Very Safe
Somewha
t Safe
Not Very
Safe
Not Safe
at All
Don't
KnowIn your home?
All 77.4% 17.8% 0.8% 0.0% 4.0%
Out in your neighbourhood
All 18.7% 47.7% 18.6% 7.1% 7.9%
At school
All 40.3% 49.3% 5.6% 1.6% 3.3%
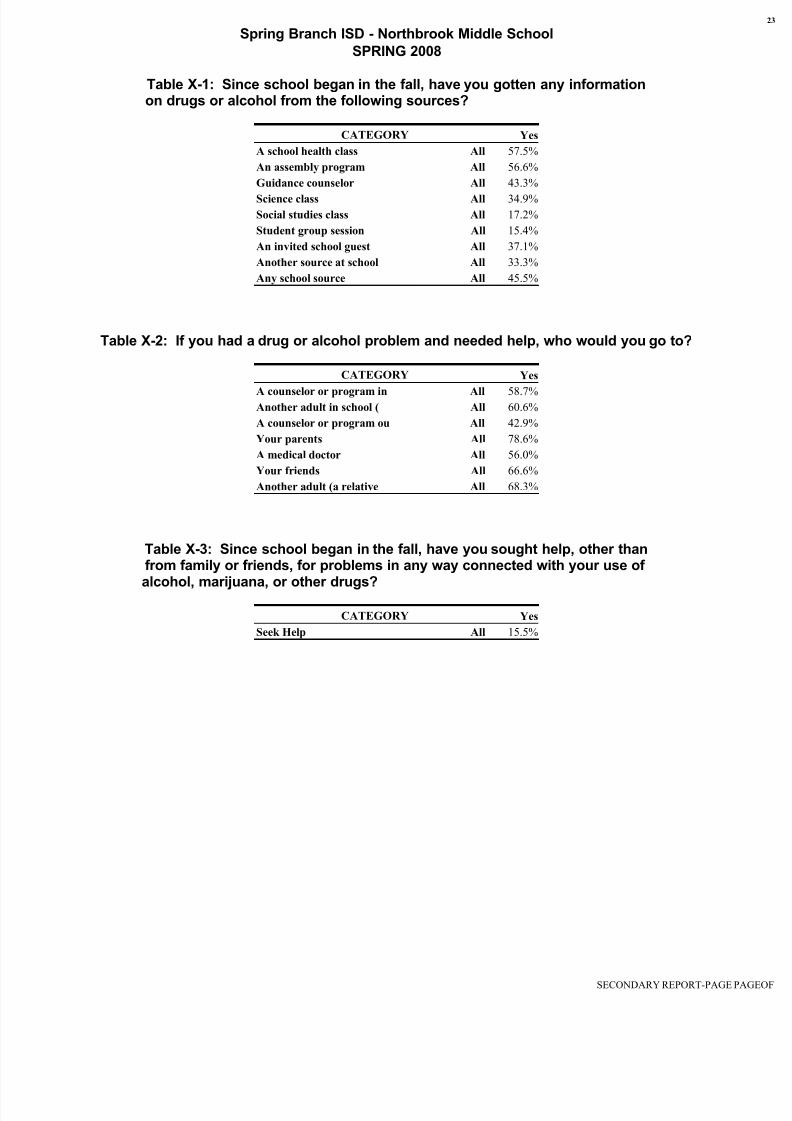
Table X-6: Since school began in the fall, have you gotten any informationon drugs or alcohol from the following sources?
CATEGORY Yes
A website or online chat All 24.4%
Books, magazines, poster All 46.4%
TV, radio, or other audi All 46.2%
Your parents All 46.2%
SECONDARY REPORT-PAGE PA
8/6/2019 Spring Branch ISD - Northbrook Middle School - 2008 Texas School Survey of Drug and Alcohol Use
http://slidepdf.com/reader/full/spring-branch-isd-northbrook-middle-school-2008-texas-school-survey-of 25/58
8/6/2019 Spring Branch ISD - Northbrook Middle School - 2008 Texas School Survey of Drug and Alcohol Use
http://slidepdf.com/reader/full/spring-branch-isd-northbrook-middle-school-2008-texas-school-survey-of 26/58
Spring Branch ISD - Northbrook Middle School
SPRING 2008
2. Prevalence Tables
SECONDARY REPORT-PAGE PA

8/6/2019 Spring Branch ISD - Northbrook Middle School - 2008 Texas School Survey of Drug and Alcohol Use
http://slidepdf.com/reader/full/spring-branch-isd-northbrook-middle-school-2008-texas-school-survey-of 27/58
Spring Branch ISD - Northbrook Middle School
SPRING 2008
SECONDARY REPORT-PAGE PA
8/6/2019 Spring Branch ISD - Northbrook Middle School - 2008 Texas School Survey of Drug and Alcohol Use
http://slidepdf.com/reader/full/spring-branch-isd-northbrook-middle-school-2008-texas-school-survey-of 28/58

8/6/2019 Spring Branch ISD - Northbrook Middle School - 2008 Texas School Survey of Drug and Alcohol Use
http://slidepdf.com/reader/full/spring-branch-isd-northbrook-middle-school-2008-texas-school-survey-of 29/58
Spring Branch ISD - Northbrook Middle School
SPRING 2008
Table B2: Prevalence and recency of use of selected substances by gradeMale students
Past
Month
School
Year
Ever
Used
Never
Used
Tobacco
All 7.6% 7.6% 23.2% 76.8%
AlcoholAll 25.1% 27.1% 54.0% 46.0%
Inhalants
All 5.7% 5.7% 13.6% 86.4%
Any Illicit Drug
All 9.4% 9.4% 26.7% 73.3%
Marijuana
All 5.9% 5.9% 25.1% 74.9%
Marijuana Only
All 3.9% 3.9% 17.2% 82.8%
Cocaine or Crack
All 3.7% 3.7% 5.6% 94.4%
Cocaine
All 3.8% 3.8% 5.7% 94.3%
Crack
All 2.0% 4.0% 4.0% 96.0%
Hallucinogens
All 1.8% 1.8% 3.7% 96.3%
Uppers
All 2.0% 2.0% 2.0% 98.0%
Downers
All 0.0% 1.9% 1.9% 98.1%
Rohypnol
All 1.9% 1.9% 3.8% 96.2%
Steroids
All 2.0% 2.0% 4.2% 95.8%
Ecstasy
All 1.9% 1.9% 1.9% 98.1%
Heroin
All 3.8% 3.8% 3.8% 96.2%
SECONDARY REPORT-PAGE PA

8/6/2019 Spring Branch ISD - Northbrook Middle School - 2008 Texas School Survey of Drug and Alcohol Use
http://slidepdf.com/reader/full/spring-branch-isd-northbrook-middle-school-2008-texas-school-survey-of 30/58
Spring Branch ISD - Northbrook Middle School
SPRING 2008
Table B3: Prevalence and recency of use of selected substances by gradeFemale students
Past
Month
School
Year
Ever
Used
Never
Used
Tobacco
All 8.6% 10.1% 26.5% 73.5%
AlcoholAll 28.1% 38.1% 63.0% 37.0%
Inhalants
All 7.0% 11.2% 16.6% 83.4%
Any Illicit Drug
All 8.3% 11.2% 23.2% 76.8%
Marijuana
All 4.3% 8.7% 18.6% 81.4%
Marijuana Only
All 1.4% 4.3% 9.8% 90.2%
Cocaine or Crack
All 4.3% 4.3% 9.7% 90.3%
Cocaine
All 4.3% 4.3% 6.9% 93.1%
Crack
All 1.4% 1.4% 5.8% 94.2%
Hallucinogens
All 0.0% 0.0% 0.0% 100.0%
Uppers
All 0.0% 0.0% 4.2% 95.8%
Downers
All 0.0% 0.0% 2.8% 97.2%
Rohypnol
All 0.0% 0.0% 1.5% 98.5%
Steroids
All 1.4% 2.9% 2.9% 97.1%
Ecstasy
All 0.0% 0.0% 0.0% 100.0%
Heroin
All 0.0% 1.5% 3.0% 97.0%
SECONDARY REPORT-PAGE PA
8/6/2019 Spring Branch ISD - Northbrook Middle School - 2008 Texas School Survey of Drug and Alcohol Use
http://slidepdf.com/reader/full/spring-branch-isd-northbrook-middle-school-2008-texas-school-survey-of 31/58
Spring Branch ISD - Northbrook Middle School
SPRING 2008
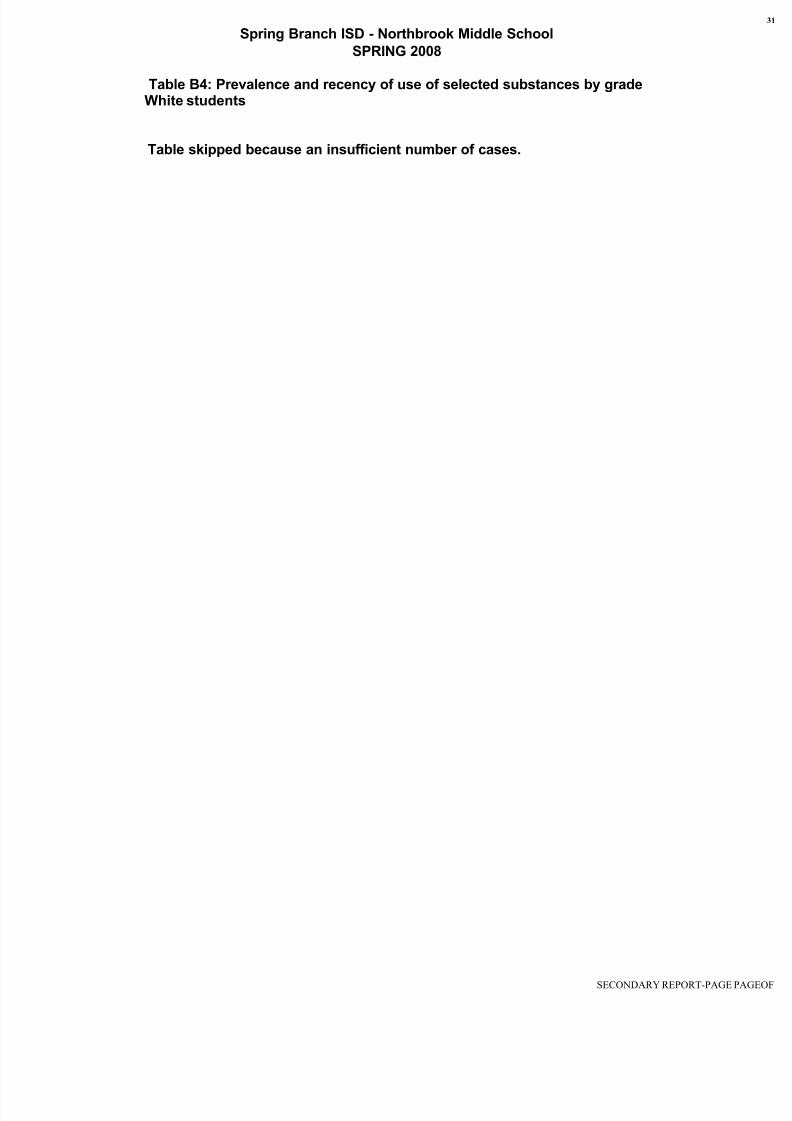
Table B4: Prevalence and recency of use of selected substances by gradeWhite students
Table skipped because an insufficient number of cases.
SECONDARY REPORT-PAGE PA
8/6/2019 Spring Branch ISD - Northbrook Middle School - 2008 Texas School Survey of Drug and Alcohol Use
http://slidepdf.com/reader/full/spring-branch-isd-northbrook-middle-school-2008-texas-school-survey-of 32/58
Spring Branch ISD - Northbrook Middle School
SPRING 2008
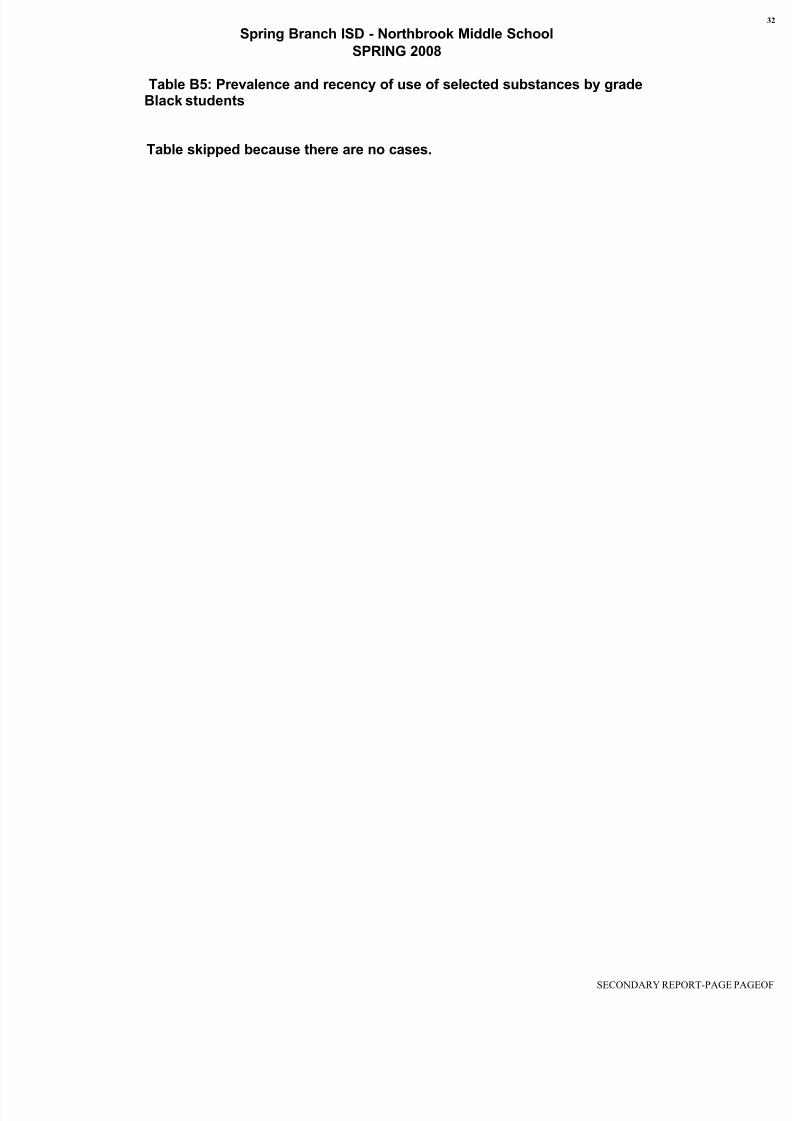
Table B5: Prevalence and recency of use of selected substances by gradeBlack students
Table skipped because there are no cases.
SECONDARY REPORT-PAGE PA

8/6/2019 Spring Branch ISD - Northbrook Middle School - 2008 Texas School Survey of Drug and Alcohol Use
http://slidepdf.com/reader/full/spring-branch-isd-northbrook-middle-school-2008-texas-school-survey-of 33/58
Spring Branch ISD - Northbrook Middle School
SPRING 2008
Table B6: Prevalence and recency of use of selected substances by gradeMexican/American students
Past
Month
School
Year
Ever
Used
Never
Used
Tobacco
All 7.6% 8.9% 24.9% 75.1%
AlcoholAll 27.6% 35.5% 62.4% 37.6%
Inhalants
All 3.6% 6.2% 14.8% 85.2%
Any Illicit Drug
All 7.4% 8.7% 22.1% 77.9%
Marijuana
All 3.8% 6.5% 18.7% 81.3%
Marijuana Only
All 2.5% 3.8% 11.0% 89.0%
Cocaine or Crack
All 3.8% 3.8% 7.5% 92.5%
Cocaine
All 3.9% 3.9% 6.3% 93.7%
Crack
All 0.0% 1.2% 4.0% 96.0%
Hallucinogens
All 0.0% 0.0% 0.0% 100.0%
Uppers
All 1.2% 1.2% 2.4% 97.6%
Downers
All 0.0% 1.2% 2.4% 97.6%
Rohypnol
All 0.0% 0.0% 2.6% 97.4%
Steroids
All 0.0% 1.4% 2.7% 97.3%
Ecstasy
All 0.0% 0.0% 0.0% 100.0%
Heroin
All 1.2% 2.5% 2.5% 97.5%
SECONDARY REPORT-PAGE PA
8/6/2019 Spring Branch ISD - Northbrook Middle School - 2008 Texas School Survey of Drug and Alcohol Use
http://slidepdf.com/reader/full/spring-branch-isd-northbrook-middle-school-2008-texas-school-survey-of 34/58
Spring Branch ISD - Northbrook Middle School
SPRING 2008
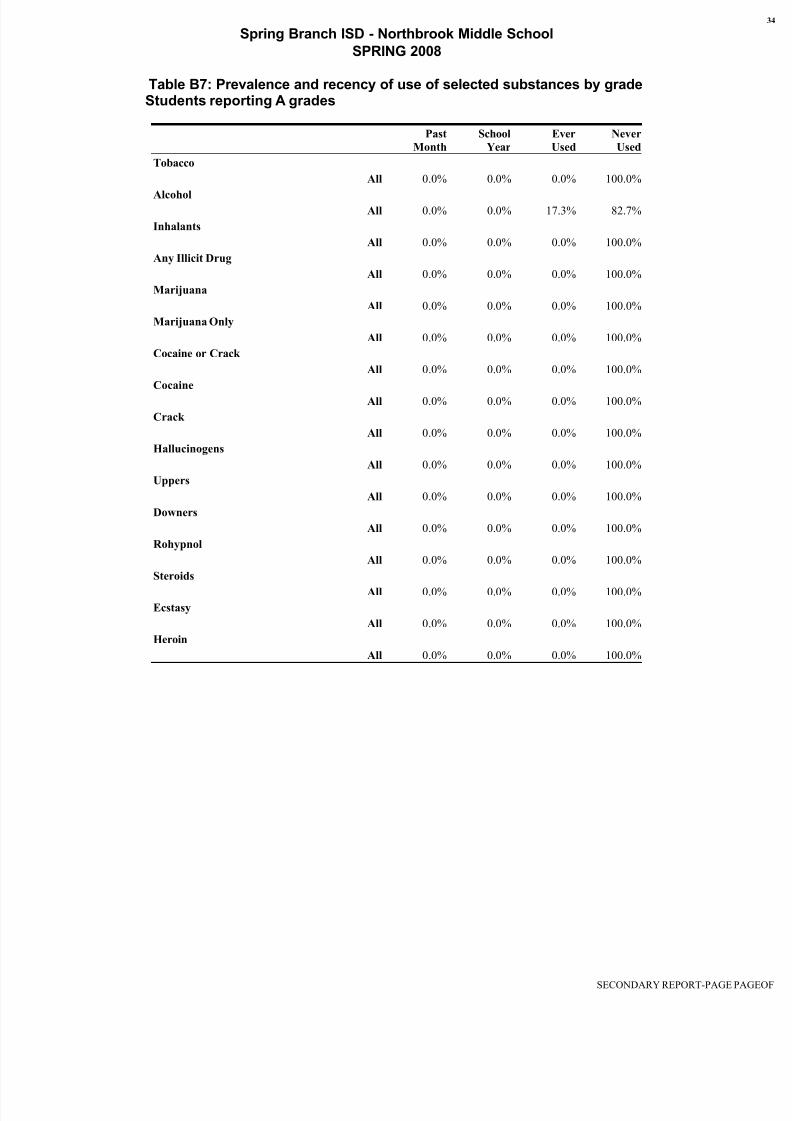
Table B7: Prevalence and recency of use of selected substances by gradeStudents reporting A grades
Past
Month
School
Year
Ever
Used
Never
Used
Tobacco
All 0.0% 0.0% 0.0% 100.0%
AlcoholAll 0.0% 0.0% 17.3% 82.7%
Inhalants
All 0.0% 0.0% 0.0% 100.0%
Any Illicit Drug
All 0.0% 0.0% 0.0% 100.0%
Marijuana
All 0.0% 0.0% 0.0% 100.0%
Marijuana Only
All 0.0% 0.0% 0.0% 100.0%
Cocaine or Crack
All 0.0% 0.0% 0.0% 100.0%
Cocaine
All 0.0% 0.0% 0.0% 100.0%
Crack
All 0.0% 0.0% 0.0% 100.0%
Hallucinogens
All 0.0% 0.0% 0.0% 100.0%
Uppers
All 0.0% 0.0% 0.0% 100.0%
Downers
All 0.0% 0.0% 0.0% 100.0%
Rohypnol
All 0.0% 0.0% 0.0% 100.0%
Steroids
All 0.0% 0.0% 0.0% 100.0%
Ecstasy
All 0.0% 0.0% 0.0% 100.0%
Heroin
All 0.0% 0.0% 0.0% 100.0%
SECONDARY REPORT-PAGE PA
8/6/2019 Spring Branch ISD - Northbrook Middle School - 2008 Texas School Survey of Drug and Alcohol Use
http://slidepdf.com/reader/full/spring-branch-isd-northbrook-middle-school-2008-texas-school-survey-of 35/58
Spring Branch ISD - Northbrook Middle School
SPRING 2008
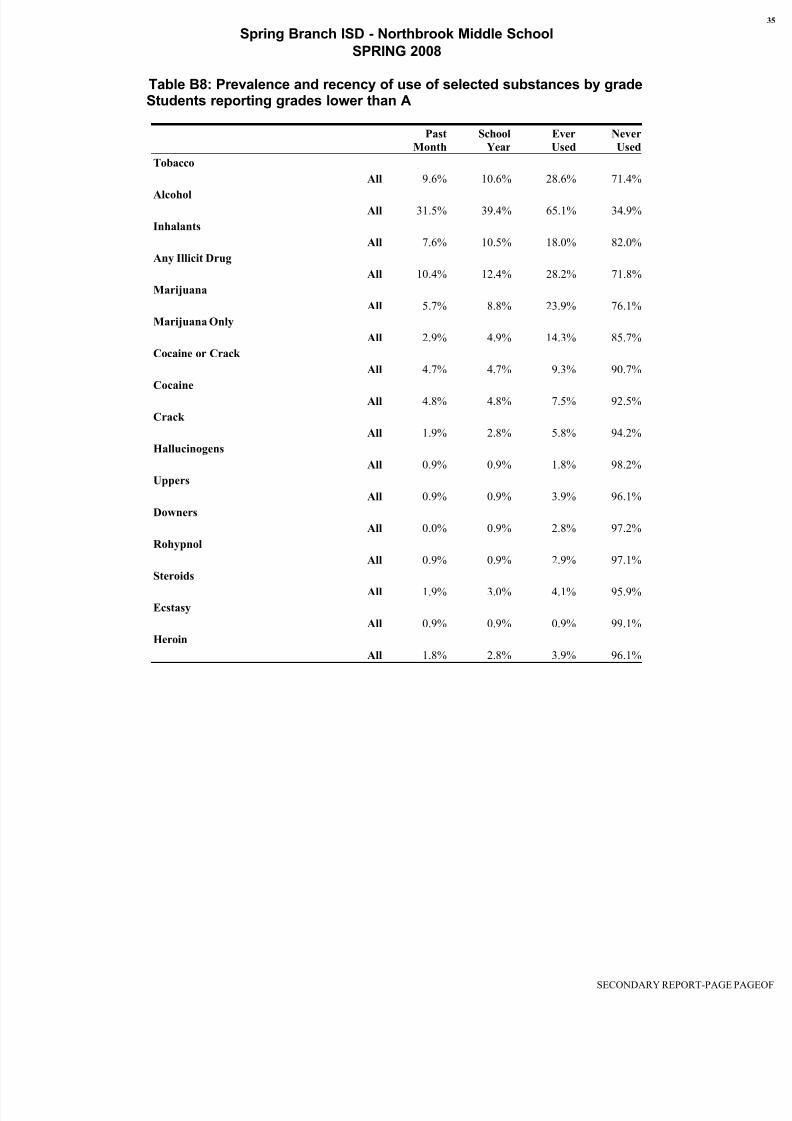
Table B8: Prevalence and recency of use of selected substances by gradeStudents reporting grades lower than A
Past
Month
School
Year
Ever
Used
Never
Used
Tobacco
All 9.6% 10.6% 28.6% 71.4%
AlcoholAll 31.5% 39.4% 65.1% 34.9%
Inhalants
All 7.6% 10.5% 18.0% 82.0%
Any Illicit Drug
All 10.4% 12.4% 28.2% 71.8%
Marijuana
All 5.7% 8.8% 23.9% 76.1%
Marijuana Only
All 2.9% 4.9% 14.3% 85.7%
Cocaine or Crack
All 4.7% 4.7% 9.3% 90.7%
Cocaine
All 4.8% 4.8% 7.5% 92.5%
Crack
All 1.9% 2.8% 5.8% 94.2%
Hallucinogens
All 0.9% 0.9% 1.8% 98.2%
Uppers
All 0.9% 0.9% 3.9% 96.1%
Downers
All 0.0% 0.9% 2.8% 97.2%
Rohypnol
All 0.9% 0.9% 2.9% 97.1%
Steroids
All 1.9% 3.0% 4.1% 95.9%
Ecstasy
All 0.9% 0.9% 0.9% 99.1%
Heroin
All 1.8% 2.8% 3.9% 96.1%
SECONDARY REPORT-PAGE PA

8/6/2019 Spring Branch ISD - Northbrook Middle School - 2008 Texas School Survey of Drug and Alcohol Use
http://slidepdf.com/reader/full/spring-branch-isd-northbrook-middle-school-2008-texas-school-survey-of 36/58
Spring Branch ISD - Northbrook Middle School
SPRING 2008
Table B9: Prevalence and recency of use of selected substances by gradeStudents living with two parents
Past
Month
School
Year
Ever
Used
Never
Used
Tobacco
All 6.9% 8.1% 20.7% 79.3%
AlcoholAll 25.0% 33.2% 57.9% 42.1%
Inhalants
All 4.5% 7.9% 14.6% 85.4%
Any Illicit Drug
All 5.6% 7.9% 21.3% 78.7%
Marijuana
All 3.4% 7.0% 17.3% 82.7%
Marijuana Only
All 1.1% 3.4% 10.2% 89.8%
Cocaine or Crack
All 4.6% 4.6% 9.1% 90.9%
Cocaine
All 4.7% 4.7% 6.8% 93.2%
Crack
All 1.1% 2.2% 5.9% 94.1%
Hallucinogens
All 0.0% 0.0% 0.0% 100.0%
Uppers
All 1.1% 1.1% 3.2% 96.8%
Downers
All 0.0% 1.1% 2.2% 97.8%
Rohypnol
All 0.0% 0.0% 1.2% 98.8%
Steroids
All 1.1% 2.4% 3.6% 96.4%
Ecstasy
All 0.0% 0.0% 0.0% 100.0%
Heroin
All 1.1% 2.3% 2.3% 97.7%
SECONDARY REPORT-PAGE PA

8/6/2019 Spring Branch ISD - Northbrook Middle School - 2008 Texas School Survey of Drug and Alcohol Use
http://slidepdf.com/reader/full/spring-branch-isd-northbrook-middle-school-2008-texas-school-survey-of 37/58
Spring Branch ISD - Northbrook Middle School
SPRING 2008
Table B10: Prevalence and recency of use of selected substances by gradeStudents not living with two parents
Past
Month
School
Year
Ever
Used
Never
Used
Tobacco
All 9.0% 9.0% 35.5% 64.5%
AlcoholAll 33.3% 33.3% 60.6% 39.4%
Inhalants
All 12.2% 12.2% 18.3% 81.7%
Any Illicit Drug
All 14.6% 14.6% 28.9% 71.1%
Marijuana
All 9.3% 9.3% 26.9% 73.1%
Marijuana Only
All 6.3% 6.3% 17.8% 82.2%
Cocaine or Crack
All 2.9% 2.9% 5.7% 94.3%
Cocaine
All 2.9% 2.9% 5.7% 94.3%
Crack
All 3.0% 3.0% 3.0% 97.0%
Hallucinogens
All 2.9% 2.9% 5.7% 94.3%
Uppers
All 0.0% 0.0% 0.0% 100.0%
Downers
All 0.0% 0.0% 0.0% 100.0%
Rohypnol
All 3.0% 3.0% 5.9% 94.1%
Steroids
All 3.2% 3.2% 3.2% 96.8%
Ecstasy
All 2.9% 2.9% 2.9% 97.1%
Heroin
All 3.0% 3.0% 3.0% 97.0%
SECONDARY REPORT-PAGE PA

8/6/2019 Spring Branch ISD - Northbrook Middle School - 2008 Texas School Survey of Drug and Alcohol Use
http://slidepdf.com/reader/full/spring-branch-isd-northbrook-middle-school-2008-texas-school-survey-of 38/58

8/6/2019 Spring Branch ISD - Northbrook Middle School - 2008 Texas School Survey of Drug and Alcohol Use
http://slidepdf.com/reader/full/spring-branch-isd-northbrook-middle-school-2008-texas-school-survey-of 39/58
Spring Branch ISD - Northbrook Middle School
SPRING 2008
Table B12: Prevalence and recency of use of selected substances by gradeStudents wouldn''t seek help from adults for substance abuse problems
Table skipped because an insufficient number of cases.
SECONDARY REPORT-PAGE PA

8/6/2019 Spring Branch ISD - Northbrook Middle School - 2008 Texas School Survey of Drug and Alcohol Use
http://slidepdf.com/reader/full/spring-branch-isd-northbrook-middle-school-2008-texas-school-survey-of 40/58
Spring Branch ISD - Northbrook Middle School
SPRING 2008
Table B13: Prevalence and recency of use of selected substances by gradeStudents living in town three years or less
Past
Month
School
Year
Ever
Used
Never
Used
Tobacco
All 5.3% 8.1% 29.2% 70.8%
AlcoholAll 18.8% 24.4% 55.2% 44.8%
Inhalants
All 5.3% 5.3% 13.2% 86.8%
Any Illicit Drug
All 12.9% 15.7% 26.3% 73.7%
Marijuana
All 5.5% 8.4% 21.5% 78.5%
Marijuana Only
All 2.8% 5.6% 8.1% 91.9%
Cocaine or Crack
All 5.1% 5.1% 13.2% 86.8%
Cocaine
All 5.1% 5.1% 10.3% 89.7%
Crack
All 2.7% 5.4% 8.5% 91.5%
Hallucinogens
All 2.6% 2.6% 5.1% 94.9%
Uppers
All 2.6% 2.6% 5.2% 94.8%
Downers
All 0.0% 2.5% 5.0% 95.0%
Rohypnol
All 2.6% 2.6% 2.6% 97.4%
Steroids
All 2.6% 2.6% 2.6% 97.4%
Ecstasy
All 2.6% 2.6% 2.6% 97.4%
Heroin
All 5.1% 5.1% 5.1% 94.9%
SECONDARY REPORT-PAGE PA
8/6/2019 Spring Branch ISD - Northbrook Middle School - 2008 Texas School Survey of Drug and Alcohol Use
http://slidepdf.com/reader/full/spring-branch-isd-northbrook-middle-school-2008-texas-school-survey-of 41/58
Spring Branch ISD - Northbrook Middle School
SPRING 2008
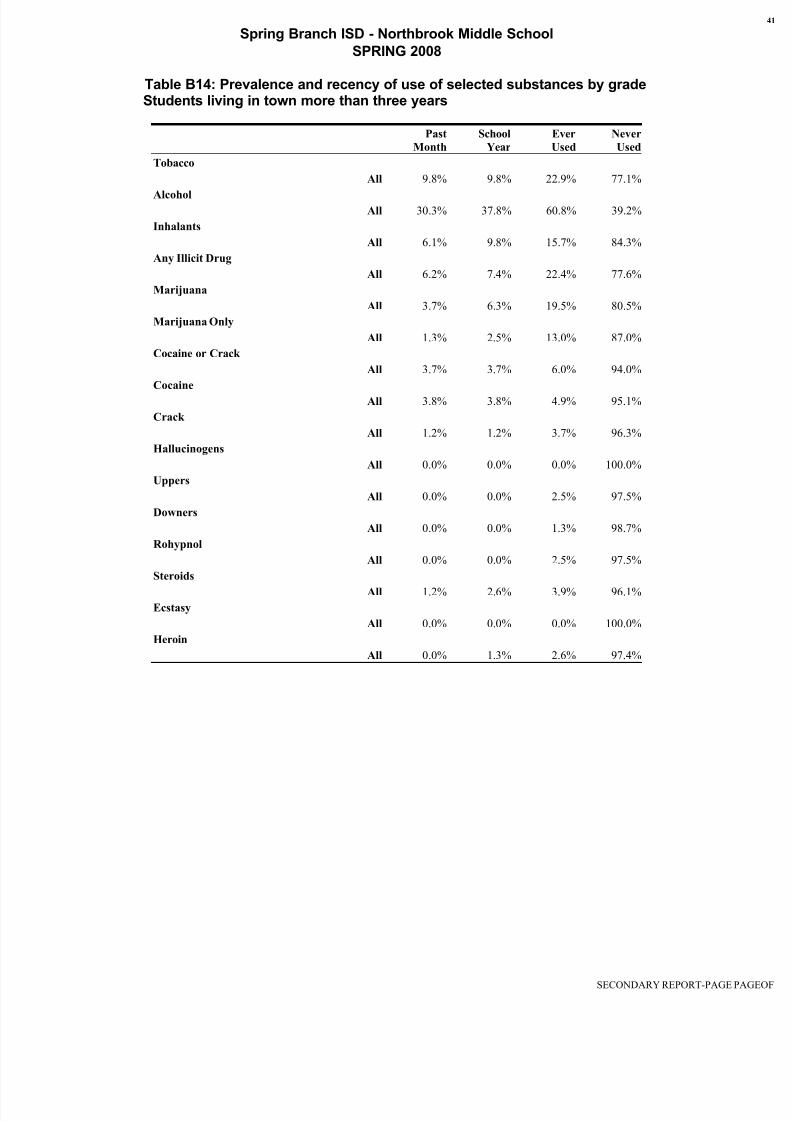
Table B14: Prevalence and recency of use of selected substances by gradeStudents living in town more than three years
Past
Month
School
Year
Ever
Used
Never
Used
Tobacco
All 9.8% 9.8% 22.9% 77.1%
AlcoholAll 30.3% 37.8% 60.8% 39.2%
Inhalants
All 6.1% 9.8% 15.7% 84.3%
Any Illicit Drug
All 6.2% 7.4% 22.4% 77.6%
Marijuana
All 3.7% 6.3% 19.5% 80.5%
Marijuana Only
All 1.3% 2.5% 13.0% 87.0%
Cocaine or Crack
All 3.7% 3.7% 6.0% 94.0%
Cocaine
All 3.8% 3.8% 4.9% 95.1%
Crack
All 1.2% 1.2% 3.7% 96.3%
Hallucinogens
All 0.0% 0.0% 0.0% 100.0%
Uppers
All 0.0% 0.0% 2.5% 97.5%
Downers
All 0.0% 0.0% 1.3% 98.7%
Rohypnol
All 0.0% 0.0% 2.5% 97.5%
Steroids
All 1.2% 2.6% 3.9% 96.1%
Ecstasy
All 0.0% 0.0% 0.0% 100.0%
Heroin
All 0.0% 1.3% 2.6% 97.4%
SECONDARY REPORT-PAGE PA

8/6/2019 Spring Branch ISD - Northbrook Middle School - 2008 Texas School Survey of Drug and Alcohol Use
http://slidepdf.com/reader/full/spring-branch-isd-northbrook-middle-school-2008-texas-school-survey-of 42/58

8/6/2019 Spring Branch ISD - Northbrook Middle School - 2008 Texas School Survey of Drug and Alcohol Use
http://slidepdf.com/reader/full/spring-branch-isd-northbrook-middle-school-2008-texas-school-survey-of 43/58
Spring Branch ISD - Northbrook Middle School
SPRING 2008
SECONDARY REPORT-PAGE PA
8/6/2019 Spring Branch ISD - Northbrook Middle School - 2008 Texas School Survey of Drug and Alcohol Use
http://slidepdf.com/reader/full/spring-branch-isd-northbrook-middle-school-2008-texas-school-survey-of 44/58
Spring Branch ISD - Northbrook Middle School
Spring 2008
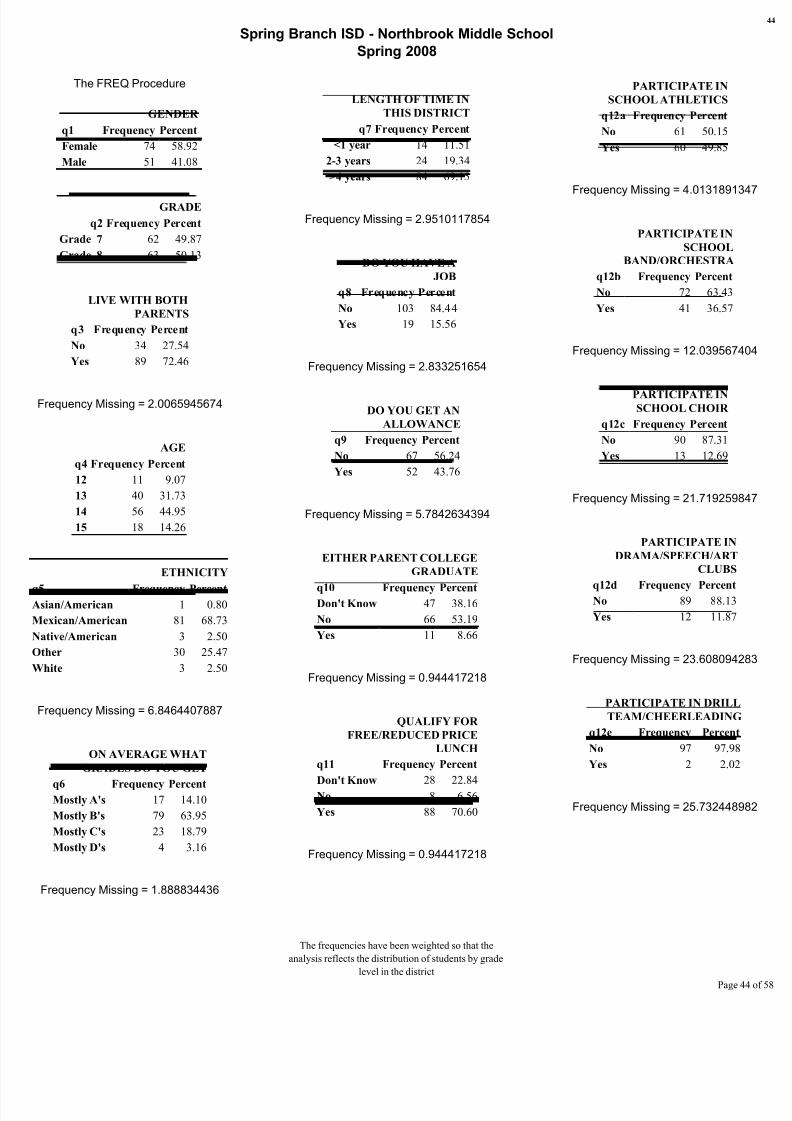
The FREQ Procedure
GENDER
q1 Frequency Percent
Female 74 58.92
Male 51 41.08
GRADE
q2 Frequency Percent
Grade 7 62 49.87
Grade 8 63 50.13
LIVE WITH BOTH
PARENTS
q3 Frequency Percent
No 34 27.54
Yes 89 72.46
Frequency Missing = 2.0065945674
AGE
q4 Frequency Percent
12 11 9.07
13 40 31.73
14 56 44.95
15 18 14.26
ETHNICITY
q5 Frequency PercentAsian/American 1 0.80
Mexican/American 81 68.73
Native/American 3 2.50
Other 30 25.47
White 3 2.50
Frequency Missing = 6.8464407887
ON AVERAGE WHAT
GRADES DO YOU GET
q6 Frequency PercentMostly A's 17 14.10
Mostly B's 79 63.95
Mostly C's 23 18.79
Mostly D's 4 3.16
Frequency Missing = 1.888834436
LENGTH OF TIME IN
THIS DISTRICT
q7 Frequency Percent
<1 year 14 11.51
2-3 years 24 19.34
>4 years 84 69.15
Frequency Missing = 2.9510117854
DO YOU HAVE A
JOB
q8 Frequency Percent
No 103 84.44
Yes 19 15.56
Frequency Missing = 2.833251654
DO YOU GET AN
ALLOWANCE
q9 Frequency Percent
No 67 56.24
Yes 52 43.76
Frequency Missing = 5.7842634394
EITHER PARENT COLLEGE
GRADUATE
q10 Frequency PercentDon't Know 47 38.16
No 66 53.19
Yes 11 8.66
Frequency Missing = 0.944417218
QUALIFY FOR
FREE/REDUCED PRICE
LUNCH
q11 Frequency Percent
Don't Know 28 22.84No 8 6.56
Yes 88 70.60
Frequency Missing = 0.944417218
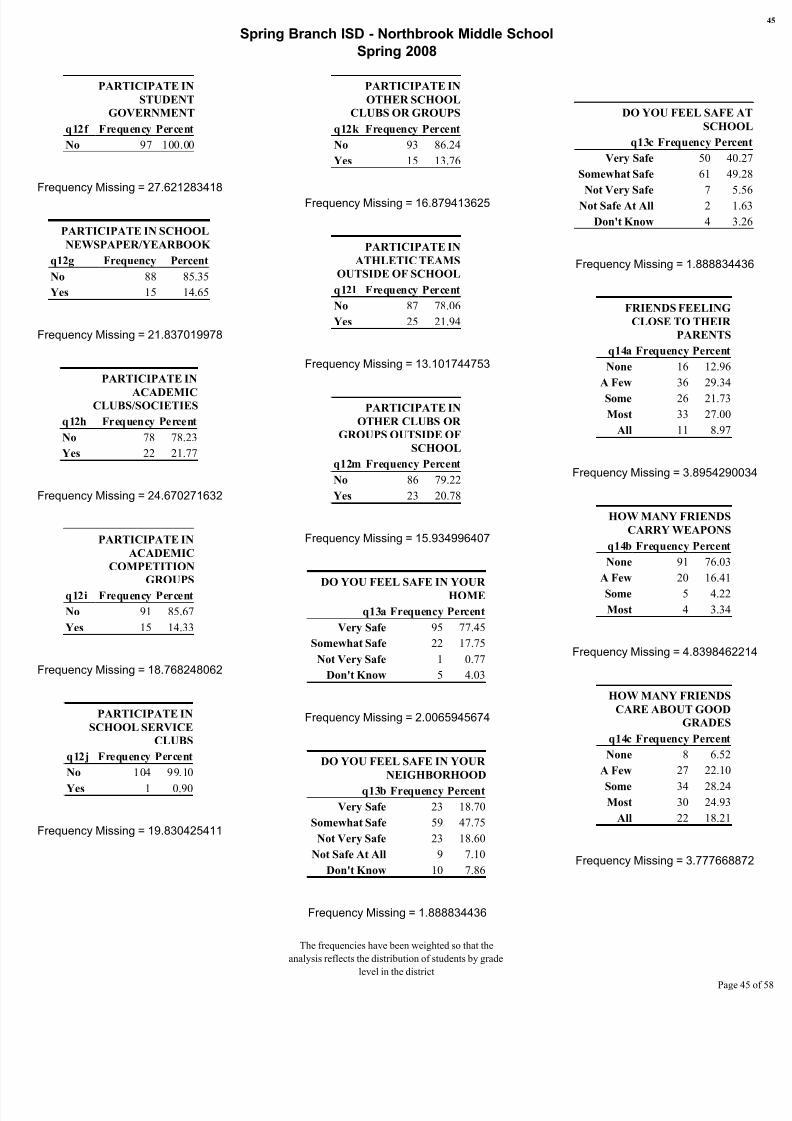
PARTICIPATE IN
SCHOOL ATHLETICS
q12a Frequency Percent
No 61 50.15
Yes 60 49.85
Frequency Missing = 4.01318913
PARTICIPATE IN
SCHOOL
BAND/ORCHESTRA
q12b Frequency Percent
No 72 63.43
Yes 41 36.57
Frequency Missing = 12.0395674
PARTICIPATE INSCHOOL CHOIR
q12c Frequency Percent
No 90 87.31
Yes 13 12.69
Frequency Missing = 21.7192598
PARTICIPATE IN
DRAMA/SPEECH/ART
CLUBS
q12d Frequency PercentNo 89 88.13
Yes 12 11.87
Frequency Missing = 23.6080942
PARTICIPATE IN DRILL
TEAM/CHEERLEADING
q12e Frequency Percent
No 97 97.98
Yes 2 2.02
Frequency Missing = 25.7324489
The frequencies have been weighted so that the
analysis reflects the distribution of students by grade
level in the district
Page
8/6/2019 Spring Branch ISD - Northbrook Middle School - 2008 Texas School Survey of Drug and Alcohol Use
http://slidepdf.com/reader/full/spring-branch-isd-northbrook-middle-school-2008-texas-school-survey-of 45/58
Spring Branch ISD - Northbrook Middle School
Spring 2008
PARTICIPATE IN
STUDENT
GOVERNMENT
q12f Frequency Percent
No 97 100.00
Frequency Missing = 27.621283418
PARTICIPATE IN SCHOOL
NEWSPAPER/YEARBOOK
q12g Frequency Percent
No 88 85.35
Yes 15 14.65
Frequency Missing = 21.837019978
PARTICIPATE IN
ACADEMICCLUBS/SOCIETIES
q12h Frequency Percent
No 78 78.23
Yes 22 21.77
Frequency Missing = 24.670271632
PARTICIPATE IN
ACADEMIC
COMPETITION
GROUPS
q12i Frequency Percent
No 91 85.67
Yes 15 14.33
Frequency Missing = 18.768248062
PARTICIPATE IN
SCHOOL SERVICE
CLUBS
q12j Frequency Percent
No 104 99.10
Yes 1 0.90
Frequency Missing = 19.830425411
PARTICIPATE IN
OTHER SCHOOL
CLUBS OR GROUPS
q12k Frequency Percent
No 93 86.24
Yes 15 13.76
Frequency Missing = 16.879413625
PARTICIPATE IN
ATHLETIC TEAMS
OUTSIDE OF SCHOOL
q12l Frequency Percent
No 87 78.06
Yes 25 21.94
Frequency Missing = 13.101744753
PARTICIPATE IN
OTHER CLUBS OR
GROUPS OUTSIDE OF
SCHOOL
q12m Frequency Percent
No 86 79.22
Yes 23 20.78
Frequency Missing = 15.934996407
DO YOU FEEL SAFE IN YOUR
HOME
q13a Frequency Percent
Very Safe 95 77.45
Somewhat Safe 22 17.75
Not Very Safe 1 0.77
Don't Know 5 4.03
Frequency Missing = 2.0065945674
DO YOU FEEL SAFE IN YOUR
NEIGHBORHOOD
q13b Frequency Percent
Very Safe 23 18.70
Somewhat Safe 59 47.75
Not Very Safe 23 18.60
Not Safe At All 9 7.10
Don't Know 10 7.86
Frequency Missing = 1.888834436
DO YOU FEEL SAFE A
SCHOO
q13c Frequency Perce
Very Safe 50 40.
Somewhat Safe 61 49.
Not Very Safe 7 5.
Not Safe At All 2 1.
Don't Know 4 3.
Frequency Missing = 1.8888344
FRIENDS FEELING
CLOSE TO THEIR
PARENTS
q14a Frequency Percent
None 16 12.96
A Few 36 29.34
Some 26 21.73
Most 33 27.00
All 11 8.97
Frequency Missing = 3.89542900
HOW MANY FRIENDS
CARRY WEAPONS
q14b Frequency Percent
None 91 76.03
A Few 20 16.41
Some 5 4.22
Most 4 3.34
Frequency Missing = 4.83984622
HOW MANY FRIENDS
CARE ABOUT GOOD
GRADES
q14c Frequency Percent
None 8 6.52
A Few 27 22.10
Some 34 28.24Most 30 24.93
All 22 18.21
Frequency Missing = 3.7776688
The frequencies have been weighted so that the
analysis reflects the distribution of students by grade
level in the district
Page

8/6/2019 Spring Branch ISD - Northbrook Middle School - 2008 Texas School Survey of Drug and Alcohol Use
http://slidepdf.com/reader/full/spring-branch-isd-northbrook-middle-school-2008-texas-school-survey-of 46/58
Spring Branch ISD - Northbrook Middle School
Spring 2008
HOW MANY FRIENDS
BELONG TO A GANG
q14d Frequency Percent
None 58 47.08
A Few 32 26.27
Some 23 18.79
Most 8 6.33
All 2 1.53
Frequency Missing = 1.888834436
FRIENDS WISHING TO
DROP OUT OF
SCHOOL
q14e Frequency Percent
None 56 45.54
A Few 35 28.67
Some 18 14.86
Most 11 8.63All 3 2.30
Frequency Missing = 1.888834436
PARENTS ATTEND
PTA/SCHOOL OPEN
HOUSES
q15 Frequency Percent
No 68 61.11
Yes 43 38.89
Frequency Missing = 14.519538664
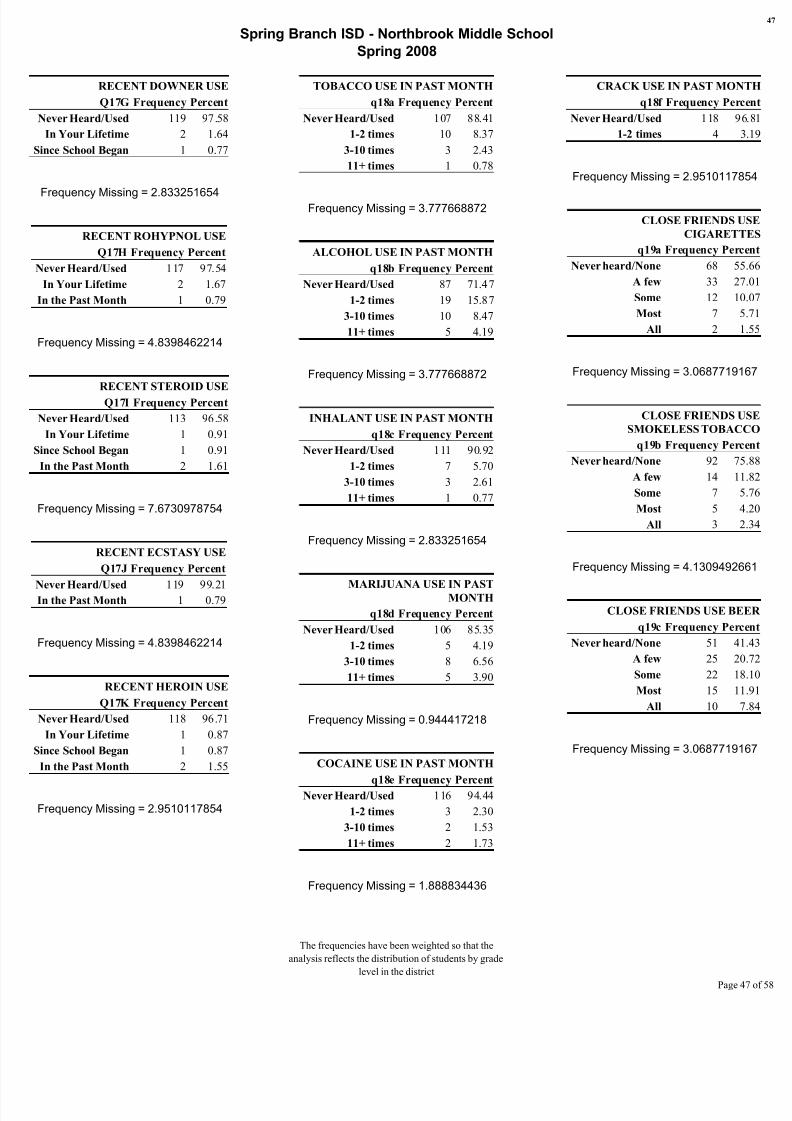
RECENT CIGARETTE USE
Q16A Frequency Percent
Never Heard/Used 93 74.88
In Your Lifetime 20 16.08
Since School Began 1 0.86
In the Past Month 10 8.18
Frequency Missing = 0.944417218
RECENT SMOKELESS TOBACCO
USE
Q16B Frequency Percent
Never Heard/Used 107 90.19
In Your Lifetime 10 8.13
In the Past Month 2 1.68
Frequency Missing = 5.9020235707
RECENT BEER USE
Q16C Frequency Percent
Never Heard/Used 70 58.37
In Your Lifetime 29 23.92
Since School Began 6 5.31
In the Past Month 15 12.40
Frequency Missing = 5.0753664841
RECENT WINE COOLER USE
Q16D Frequency Percent
Never Heard/Used 77 61.75
In Your Lifetime 25 20.08
Since School Began 6 5.14
In the Past Month 16 13.03
Frequency Missing = 0.944417218
RECENT WINE USE
Q16E Frequency Percent
Never Heard/Used 86 70.69
In Your Lifetime 15 12.56
Since School Began 9 7.59
In the Past Month 11 9.15
Frequency Missing = 3.777668872
RECENT LIQUOR USE
Q16F Frequency Percent
Never Heard/Used 90 73.43
In Your Lifetime 17 14.01
Since School Began 3 2.51
In the Past Month 12 10.05
Frequency Missing = 2.833251654
RECENT INHALANT USE
Q16G Frequency Percent
Never Heard/Used 105 84.68
In Your Lifetime 8 6.38
Since School Began 3 2.47
In the Past Month 8 6.47
Frequency Missing = 0.9444172
RECENT MARIJUANA
Q17A Frequency Per
Never Heard/Used 96 7
In Your Lifetime 17 1
Since School Began 3 In the Past Month 6
Frequency Missing = 2.8332516
RECENT COCAINE U
Q17B Frequency Per
Never Heard/Used 113 9
In Your Lifetime 3
In the Past Month 5
Frequency Missing = 3.7776688
RECENT CRACK
Q17C Frequency Per
Never Heard/Used 111 9
In Your Lifetime 3
Since School Began 1
In the Past Month 2
Frequency Missing = 7.67309787
RECENT HALLUCINOGEN U
Q17E Frequency Per
Never Heard/Used 120 9
In Your Lifetime 1
In the Past Month 1
Frequency Missing = 2.8332516
RECENT UPPER U
Q17F Frequency Per
Never Heard/Used 115 9
In Your Lifetime 3
In the Past Month 1
Frequency Missing = 5.90202357
The frequencies have been weighted so that the
analysis reflects the distribution of students by grade
level in the district
Page
8/6/2019 Spring Branch ISD - Northbrook Middle School - 2008 Texas School Survey of Drug and Alcohol Use
http://slidepdf.com/reader/full/spring-branch-isd-northbrook-middle-school-2008-texas-school-survey-of 47/58
Spring Branch ISD - Northbrook Middle School
Spring 2008
RECENT DOWNER USE
Q17G Frequency Percent
Never Heard/Used 119 97.58
In Your Lifetime 2 1.64
Since School Began 1 0.77
Frequency Missing = 2.833251654
RECENT ROHYPNOL USE
Q17H Frequency Percent
Never Heard/Used 117 97.54
In Your Lifetime 2 1.67
In the Past Month 1 0.79
Frequency Missing = 4.8398462214
RECENT STEROID USE
Q17I Frequency Percent
Never Heard/Used 113 96.58
In Your Lifetime 1 0.91
Since School Began 1 0.91
In the Past Month 2 1.61
Frequency Missing = 7.6730978754
RECENT ECSTASY USE
Q17J Frequency Percent
Never Heard/Used 119 99.21In the Past Month 1 0.79
Frequency Missing = 4.8398462214
RECENT HEROIN USE
Q17K Frequency Percent
Never Heard/Used 118 96.71
In Your Lifetime 1 0.87
Since School Began 1 0.87
In the Past Month 2 1.55
Frequency Missing = 2.9510117854
TOBACCO USE IN PAST MONTH
q18a Frequency Percent
Never Heard/Used 107 88.41
1-2 times 10 8.37
3-10 times 3 2.43
11+ times 1 0.78
Frequency Missing = 3.777668872
ALCOHOL USE IN PAST MONTH
q18b Frequency Percent
Never Heard/Used 87 71.47
1-2 times 19 15.87
3-10 times 10 8.47
11+ times 5 4.19
Frequency Missing = 3.777668872
INHALANT USE IN PAST MONTH
q18c Frequency Percent
Never Heard/Used 111 90.92
1-2 times 7 5.70
3-10 times 3 2.61
11+ times 1 0.77
Frequency Missing = 2.833251654
MARIJUANA USE IN PASTMONTH
q18d Frequency Percent
Never Heard/Used 106 85.35
1-2 times 5 4.19
3-10 times 8 6.56
11+ times 5 3.90
Frequency Missing = 0.944417218
COCAINE USE IN PAST MONTH
q18e Frequency PercentNever Heard/Used 116 94.44
1-2 times 3 2.30
3-10 times 2 1.53
11+ times 2 1.73
Frequency Missing = 1.888834436
CRACK USE IN PAST MON
q18f Frequency Per
Never Heard/Used 118 9
1-2 times 4
Frequency Missing = 2.95101178
CLOSE FRIENDS U
CIGARETT
q19a Frequency Perc
Never heard/None 68 5
A few 33 27
Some 12 10
Most 7
All 2
Frequency Missing = 3.06877191
CLOSE FRIENDS U
SMOKELESS TOBAC
q19b Frequency Perc
Never heard/None 92 7
A few 14 1
Some 7
Most 5 4
All 3 2
Frequency Missing = 4.13094926
CLOSE FRIENDS USE BE
q19c Frequency Perc
Never heard/None 51 4
A few 25 20
Some 22 1
Most 15 1
All 10 7
Frequency Missing = 3.06877191
The frequencies have been weighted so that the
analysis reflects the distribution of students by grade
level in the district
Page

8/6/2019 Spring Branch ISD - Northbrook Middle School - 2008 Texas School Survey of Drug and Alcohol Use
http://slidepdf.com/reader/full/spring-branch-isd-northbrook-middle-school-2008-texas-school-survey-of 48/58

8/6/2019 Spring Branch ISD - Northbrook Middle School - 2008 Texas School Survey of Drug and Alcohol Use
http://slidepdf.com/reader/full/spring-branch-isd-northbrook-middle-school-2008-texas-school-survey-of 49/58
Spring Branch ISD - Northbrook Middle School
Spring 2008
DIFFICULT TO GET
MARIJUANA
q20h Frequency Percent
Never heard of 35 28.59
Impossible 29 23.81
Very difficult 11 8.98
Somewhat diff 16 13.37
Somewhat easy 10 8.49Very easy 20 16.78
Frequency Missing = 4.0131891347
DIFFICULT TO GET COCAINE
q20i Frequency Percent
Never heard of 42 34.91
Impossible 36 29.89
Very difficult 8 6.49
Somewhat diff 16 13.37
Somewhat easy 6 5.21Very easy 12 10.13
Frequency Missing = 4.9576063527
DIFFICULT TO GET CRACK
q20j Frequency Percent
Never heard of 45 38.55
Impossible 36 30.68
Very difficult 7 5.75
Somewhat diff 17 14.63
Somewhat easy 6 5.35Very easy 6 5.05
Frequency Missing = 8.0263782694
DIFFICULT TO GET
HALLUCINOGENS
q20l Frequency Percent
Never heard of 80 66.15
Impossible 24 20.00
Very difficult 5 4.00
Somewhat diff 9 7.51Somewhat easy 1 0.78
Very easy 2 1.56
Frequency Missing = 4.0131891347
DIFFICULT TO GET UPPERS
q20m Frequency Percent
Never heard of 82 67.71
Impossible 20 16.59
Very difficult 5 4.00
Somewhat diff 5 4.29
Somewhat easy 7 5.76
Very easy 2 1.66
Frequency Missing = 4.0131891347
DIFFICULT TO GET DOWNERS
q20n Frequency Percent
Never heard of 81 67.42
Impossible 19 15.85
Very difficult 5 4.04
Somewhat diff 5 4.33
Somewhat easy 8 6.69
Very easy 2 1.67
Frequency Missing = 5.0753664841
DIFFICULT TO GET
ROHYPNOL
q20o Frequency Percent
Never heard of 83 69.64
Impossible 17 14.38
Very difficult 5 4.07
Somewhat diff 9 7.74
Somewhat easy 4 3.37Very easy 1 0.79
Frequency Missing = 6.0197837021
DIFFICULT TO GET STEROIDS
q20p Frequency Percent
Never heard of 59 48.88
Impossible 37 30.54
Very difficult 9 7.32
Somewhat diff 6 4.98
Somewhat easy 5 4.19
Very easy 5 4.10
Frequency Missing = 4.0131891347
DIFFICULT TO GET ECSTAS
q20q Frequency Perce
Never heard of 77 64.
Impossible 21 17.
Very difficult 9 7.
Somewhat diff 6 5.
Somewhat easy 3 2.
Very easy 3 2.
Frequency Missing = 6.01978370
DIFFICULT TO GET HEROI
q20r Frequency Perce
Never heard of 69 56.
Impossible 33 27.
Very difficult 8 6.
Somewhat diff 4 3.
Somewhat easy 2 1.
Very easy 5 4.
Frequency Missing = 4.01318913
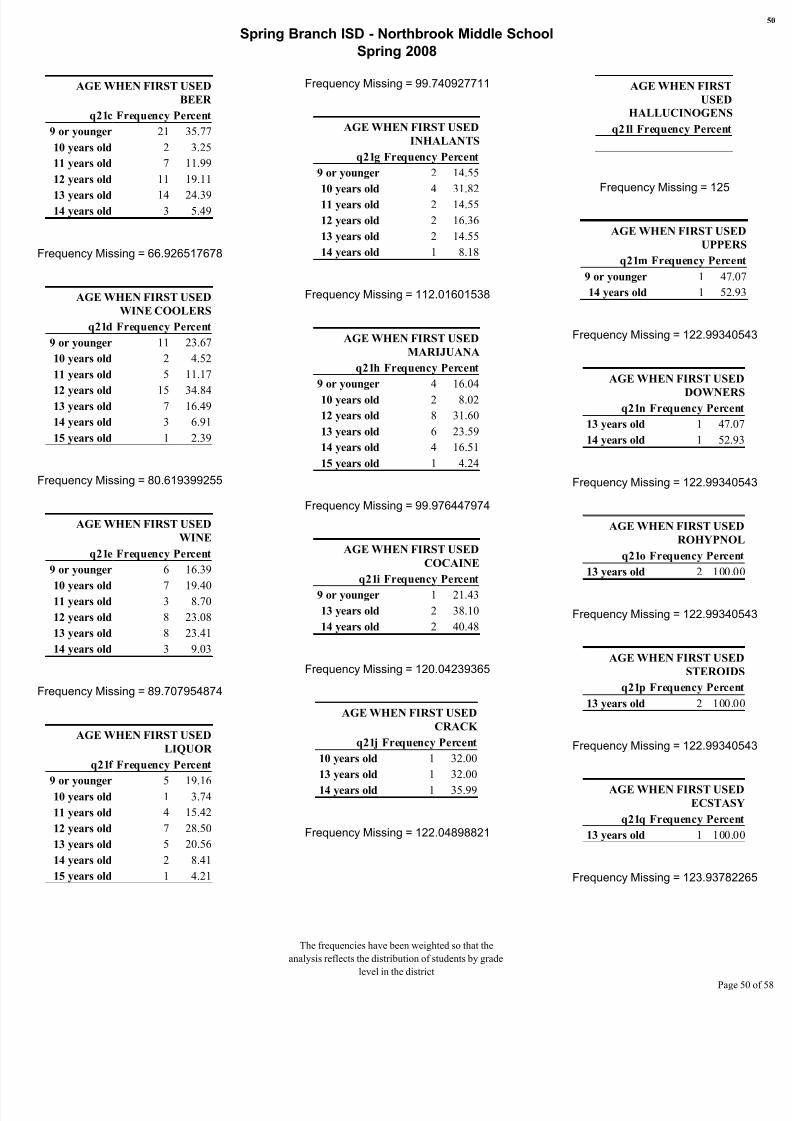
AGE WHEN FIRST USED
CIGARETTE
q21a Frequency Percen
9 or younger 9 27.0
10 years old 5 14.5
11 years old 3 9.2
12 years old 4 12.1
13 years old 8 24.514 years old 2 6.0
15 years old 2 6.4
Frequency Missing = 91.8323095
AGE WHEN FIRST USED
SMOKELESS TOBACCO
q21b Frequency Percen
10 years old 3 32.90
11 years old 1 11.84
13 years old 2 21.0614 years old 2 22.37
15 years old 1 11.84
Frequency Missing = 116.029204
The frequencies have been weighted so that the
analysis reflects the distribution of students by grade
level in the district
Page
8/6/2019 Spring Branch ISD - Northbrook Middle School - 2008 Texas School Survey of Drug and Alcohol Use
http://slidepdf.com/reader/full/spring-branch-isd-northbrook-middle-school-2008-texas-school-survey-of 50/58
Spring Branch ISD - Northbrook Middle School
Spring 2008
AGE WHEN FIRST USED
BEER
q21c Frequency Percent
9 or younger 21 35.77
10 years old 2 3.25
11 years old 7 11.99
12 years old 11 19.11
13 years old 14 24.3914 years old 3 5.49
Frequency Missing = 66.926517678
AGE WHEN FIRST USED
WINE COOLERS
q21d Frequency Percent
9 or younger 11 23.67
10 years old 2 4.52
11 years old 5 11.17
12 years old 15 34.8413 years old 7 16.49
14 years old 3 6.91
15 years old 1 2.39
Frequency Missing = 80.619399255
AGE WHEN FIRST USED
WINE
q21e Frequency Percent
9 or younger 6 16.39
10 years old 7 19.4011 years old 3 8.70
12 years old 8 23.08
13 years old 8 23.41
14 years old 3 9.03
Frequency Missing = 89.707954874
AGE WHEN FIRST USED
LIQUOR
q21f Frequency Percent
9 or younger 5 19.1610 years old 1 3.74
11 years old 4 15.42
12 years old 7 28.50
13 years old 5 20.56
14 years old 2 8.41
15 years old 1 4.21
Frequency Missing = 99.740927711
AGE WHEN FIRST USED
INHALANTS
q21g Frequency Percent
9 or younger 2 14.55
10 years old 4 31.82
11 years old 2 14.55
12 years old 2 16.36
13 years old 2 14.55
14 years old 1 8.18
Frequency Missing = 112.01601538
AGE WHEN FIRST USED
MARIJUANA
q21h Frequency Percent
9 or younger 4 16.04
10 years old 2 8.02
12 years old 8 31.60
13 years old 6 23.59
14 years old 4 16.51
15 years old 1 4.24
Frequency Missing = 99.976447974
AGE WHEN FIRST USED
COCAINE
q21i Frequency Percent
9 or younger 1 21.43
13 years old 2 38.10
14 years old 2 40.48
Frequency Missing = 120.04239365
AGE WHEN FIRST USED
CRACK
q21j Frequency Percent
10 years old 1 32.00
13 years old 1 32.00
14 years old 1 35.99
Frequency Missing = 122.04898821
AGE WHEN FIRST
USED
HALLUCINOGENS
q21l Frequency Percent
Frequency Missing = 125
AGE WHEN FIRST USED
UPPER
q21m Frequency Percen
9 or younger 1 47.0
14 years old 1 52.9
Frequency Missing = 122.993405
AGE WHEN FIRST USED
DOWNERSq21n Frequency Percen
13 years old 1 47.07
14 years old 1 52.93
Frequency Missing = 122.993405
AGE WHEN FIRST USED
ROHYPNOL
q21o Frequency Percen
13 years old 2 100.00
Frequency Missing = 122.993405
AGE WHEN FIRST USED
STEROIDS
q21p Frequency Percen
13 years old 2 100.00
Frequency Missing = 122.993405
AGE WHEN FIRST USED
ECSTASY
q21q Frequency Percen
13 years old 1 100.00
Frequency Missing = 123.937822
The frequencies have been weighted so that the
analysis reflects the distribution of students by grade
level in the district
Page

8/6/2019 Spring Branch ISD - Northbrook Middle School - 2008 Texas School Survey of Drug and Alcohol Use
http://slidepdf.com/reader/full/spring-branch-isd-northbrook-middle-school-2008-texas-school-survey-of 51/58
Spring Branch ISD - Northbrook Middle School
Spring 2008
AGE WHEN FIRST USED
HEROIN
q21r Frequency Percent
9 or younger 1 47.07
12 years old 1 52.93
Frequency Missing = 122.99340543
HOW OFTEN NORMALLY USE
CIGARETTES
q22a Frequency Percent
Every day 1 0.77
Several times/wk 3 2.51
Several times/mo 1 0.87
About once/month 4 3.29
About once/year 9 7.44
< once/year 7 5.70
Never used 97 79.42
Frequency Missing = 2.833251654
HOW OFTEN NORMALLY USE
SMOKELESS TOBACCO
q22b Frequency Percent
About once/month 3 2.57
About once/year 1 0.89
< once/year 2 1.68
Never used 113 94.85
Frequency Missing = 5.7842634394
HOW OFTEN NORMALLY USE
BEER
q22c Frequency Percent
Several times/wk 7 5.75
Several times/mo 9 7.60
About once/month 12 10.14
About once/year 5 4.00
< once/year 11 8.97
Never used 77 63.55
Frequency Missing = 3.8954290034
HOW OFTEN NORMALLY USE
WINE COOLERS
q22d Frequency Percent
Every day 1 0.78
Several times/wk 4 3.31
Several times/mo 6 5.16
About once/month 14 11.88
About once/year 6 4.97< once/year 6 4.87
Never used 84 69.04
Frequency Missing = 3.777668872
HOW OFTEN NORMALLY USE
WINE
q22e Frequency Percent
Several times/wk 2 1.68
Several times/mo 7 6.13
About once/month 9 7.52About once/year 8 6.92
< once/year 5 4.25
Never used 88 73.49
Frequency Missing = 5.666503308
HOW OFTEN NORMALLY USE
LIQUOR
q22f Frequency Percent
Several times/wk 3 2.53
Several times/mo 6 5.16About once/month 5 4.09
About once/year 5 4.38
< once/year 4 3.21
Never used 98 80.62
Frequency Missing = 3.777668872
HOW OFTEN NORMALLY USE
INHALANTS
q22g Frequency Percent
Every day 1 0.81Several times/mo 2 1.71
About once/month 4 3.42
About once/year 2 1.71
< once/year 1 0.81
Never used 107 91.54
Frequency Missing = 7.7908580067
HOW OFTEN NORMALLY U
MARIJUA
q22h Frequency Per
Every day 3
Several times/wk 4
Several times/mo 4
About once/month 2
About once/year 4
< once/year 5
Never used 92 8
Frequency Missing = 10.5063495
HOW OFTEN NORMALLY U
COCAI
q22i Frequency Perc
Every day 1 0
Several times/mo 2 1
Never used 116 97
Frequency Missing = 5.6665033
HOW OFTEN NORMALLY U
CRAC
q22j Frequency Perc
About once/year 2 1
< once/year 1 0
Never used 115 97
Frequency Missing = 6.72868065
HOW OFTEN NORMALLY
USE HALLUCINOGENS
q22l Frequency Percent
Never used 118 100.00
Frequency Missing = 6.72868065
HOW OFTEN NORMALLY U
UPPE
q22m Frequency Perc
Several times/mo 1 0
About once/year 1 0
Never used 115 98
The frequencies have been weighted so that the
analysis reflects the distribution of students by grade
level in the district
Page

8/6/2019 Spring Branch ISD - Northbrook Middle School - 2008 Texas School Survey of Drug and Alcohol Use
http://slidepdf.com/reader/full/spring-branch-isd-northbrook-middle-school-2008-texas-school-survey-of 52/58
Spring Branch ISD - Northbrook Middle School
Spring 2008
Frequency Missing = 7.6730978754
HOW OFTEN NORMALLY USE
DOWNERS
q22n Frequency Percent
About once/month 1 0.80
About once/year 1 0.91
Never used 115 98.29
Frequency Missing = 7.6730978754
HOW OFTEN NORMALLY
USE ROHYPNOL
q22o Frequency Percent
< once/year 1 0.92
Never used 114 99.08
Frequency Missing = 9.5619323114
HOW OFTEN NORMALLY USE
STEROIDS
q22p Frequency Percent
About once/month 1 0.87
Never used 121 99.13
Frequency Missing = 2.833251654
HOW OFTEN NORMALLY USEECSTASY
q22q Frequency Percent
About once/month 1 0.87
Never used 121 99.13
Frequency Missing = 2.833251654
HOW OFTEN NORMALLY USE
HEROIN
q22r Frequency Percent
About once/year 1 0.90
Never used 117 99.10
Frequency Missing = 6.610920526
AMOUNT OF BEER AT ONE
TIME
q23a Frequency Percent
Never drink this 90 77.31
12+ drinks 1 0.81
9-11 drinks 1 0.92
5-8 drinks 3 2.64
3-4 drinks 2 1.732 drinks 11 9.66
< 1 drink 8 6.92
Frequency Missing = 8.9707954874
AMOUNT OF WINE COOLERS
AT ONE TIME
q23b Frequency Percent
Never drink this 82 70.47
9-11 drinks 1 0.81
5-8 drinks 2 1.633-4 drinks 6 5.30
2 drinks 7 6.01
1 drink 8 7.03
< 1 drink 10 8.76
Frequency Missing = 9.0885556188
AMOUNT OF WINE AT ONE
TIME
q23c Frequency Percent
Never drink this 72 62.0212+ drinks 4 3.23
9-11 drinks 2 1.72
5-8 drinks 7 5.96
3-4 drinks 12 10.40
2 drinks 9 7.88
1 drink 6 5.25
< 1 drink 4 3.54
Frequency Missing = 8.1441384008
AMOUNT OF LIQUOR AT ON
TIM
q23d Frequency Perc
Never drink this 60 51
12+ drinks 1 0
9-11 drinks 4 3
5-8 drinks 9 7
3-4 drinks 8 62 drinks 11 9
1 drink 8 7
< 1 drink 16 13
Frequency Missing = 8.02637826
HOW MANY 5+ DRINKS IN PA
30 DA
q24 Frequency Perc
Never 5+ at time 38 32
None 54 451 day 7 5
2 days 6 5
3 to 5 days 7 6
10 or more days 6 5
Frequency Missing = 6.96420092
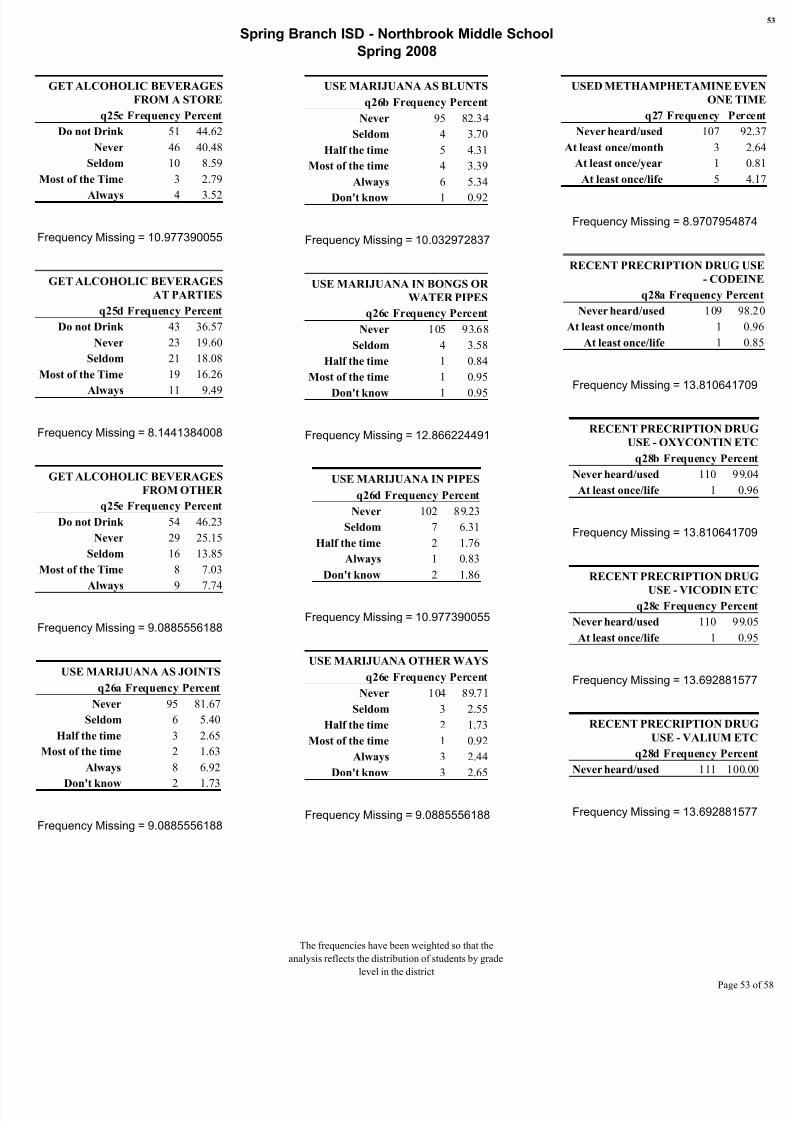
GET ALCOHOLIC BEVERAG
FROM HOM
q25a Frequency Perc
Do not Drink 55 48Never 28 24
Seldom 20 17
Most of the Time 8 7
Always 3 2
Frequency Missing = 10.0329728
GET ALCOHOLIC BEVERAG
FROM FRIEN
q25b Frequency Perc
Do not Drink 55 46Never 33 28
Seldom 15 12
Most of the Time 13 11
Always 1 0
Frequency Missing = 8.14413840
The frequencies have been weighted so that the
analysis reflects the distribution of students by grade
level in the district
Page
8/6/2019 Spring Branch ISD - Northbrook Middle School - 2008 Texas School Survey of Drug and Alcohol Use
http://slidepdf.com/reader/full/spring-branch-isd-northbrook-middle-school-2008-texas-school-survey-of 53/58
Spring Branch ISD - Northbrook Middle School
Spring 2008
GET ALCOHOLIC BEVERAGES
FROM A STORE
q25c Frequency Percent
Do not Drink 51 44.62
Never 46 40.48
Seldom 10 8.59
Most of the Time 3 2.79
Always 4 3.52
Frequency Missing = 10.977390055
GET ALCOHOLIC BEVERAGES
AT PARTIES
q25d Frequency Percent
Do not Drink 43 36.57
Never 23 19.60
Seldom 21 18.08
Most of the Time 19 16.26
Always 11 9.49
Frequency Missing = 8.1441384008
GET ALCOHOLIC BEVERAGES
FROM OTHER
q25e Frequency Percent
Do not Drink 54 46.23
Never 29 25.15
Seldom 16 13.85
Most of the Time 8 7.03
Always 9 7.74
Frequency Missing = 9.0885556188
USE MARIJUANA AS JOINTS
q26a Frequency Percent
Never 95 81.67
Seldom 6 5.40
Half the time 3 2.65
Most of the time 2 1.63
Always 8 6.92
Don't know 2 1.73
Frequency Missing = 9.0885556188
USE MARIJUANA AS BLUNTS
q26b Frequency Percent
Never 95 82.34
Seldom 4 3.70
Half the time 5 4.31
Most of the time 4 3.39
Always 6 5.34
Don't know 1 0.92
Frequency Missing = 10.032972837
USE MARIJUANA IN BONGS OR
WATER PIPES
q26c Frequency Percent
Never 105 93.68
Seldom 4 3.58
Half the time 1 0.84
Most of the time 1 0.95
Don't know 1 0.95
Frequency Missing = 12.866224491
USE MARIJUANA IN PIPES
q26d Frequency Percent
Never 102 89.23
Seldom 7 6.31
Half the time 2 1.76
Always 1 0.83
Don't know 2 1.86
Frequency Missing = 10.977390055
USE MARIJUANA OTHER WAYS
q26e Frequency Percent
Never 104 89.71
Seldom 3 2.55
Half the time 2 1.73
Most of the time 1 0.92
Always 3 2.44
Don't know 3 2.65
Frequency Missing = 9.0885556188
USED METHAMPHETAMINE E
ONE T
q27 Frequency Pe
Never heard/used 107
At least once/month 3
At least once/year 1
At least once/life 5
Frequency Missing = 8.97079548
RECENT PRECRIPTION DRUG
- CODE
q28a Frequency Per
Never heard/used 109 9
At least once/month 1
At least once/life 1
Frequency Missing = 13.8106417
RECENT PRECRIPTION DR
USE - OXYCONTIN E
q28b Frequency Perc
Never heard/used 110 99
At least once/life 1 0
Frequency Missing = 13.8106417
RECENT PRECRIPTION DR
USE - VICODIN Eq28c Frequency Perc
Never heard/used 110 99
At least once/life 1 0
Frequency Missing = 13.6928815
RECENT PRECRIPTION DR
USE - VALIUM E
q28d Frequency Perc
Never heard/used 111 100
Frequency Missing = 13.6928815
The frequencies have been weighted so that the
analysis reflects the distribution of students by grade
level in the district
Page
8/6/2019 Spring Branch ISD - Northbrook Middle School - 2008 Texas School Survey of Drug and Alcohol Use
http://slidepdf.com/reader/full/spring-branch-isd-northbrook-middle-school-2008-texas-school-survey-of 54/58
Spring Branch ISD - Northbrook Middle School
Spring 2008
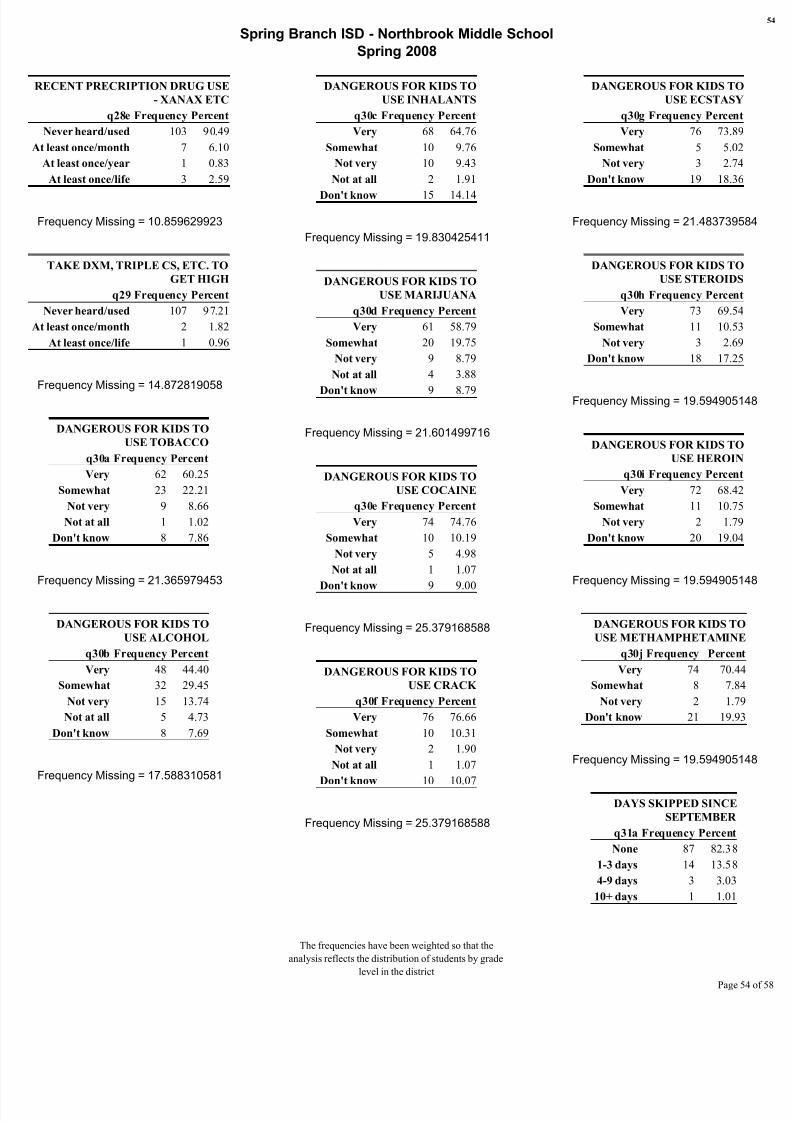
RECENT PRECRIPTION DRUG USE
- XANAX ETC
q28e Frequency Percent
Never heard/used 103 90.49
At least once/month 7 6.10
At least once/year 1 0.83
At least once/life 3 2.59
Frequency Missing = 10.859629923
TAKE DXM, TRIPLE CS, ETC. TO
GET HIGH
q29 Frequency Percent
Never heard/used 107 97.21
At least once/month 2 1.82
At least once/life 1 0.96
Frequency Missing = 14.872819058
DANGEROUS FOR KIDS TO
USE TOBACCO
q30a Frequency Percent
Very 62 60.25
Somewhat 23 22.21
Not very 9 8.66
Not at all 1 1.02
Don't know 8 7.86
Frequency Missing = 21.365979453
DANGEROUS FOR KIDS TO
USE ALCOHOL
q30b Frequency Percent
Very 48 44.40
Somewhat 32 29.45
Not very 15 13.74
Not at all 5 4.73
Don't know 8 7.69
Frequency Missing = 17.588310581
DANGEROUS FOR KIDS TO
USE INHALANTS
q30c Frequency Percent
Very 68 64.76
Somewhat 10 9.76
Not very 10 9.43
Not at all 2 1.91
Don't know 15 14.14
Frequency Missing = 19.830425411
DANGEROUS FOR KIDS TO
USE MARIJUANA
q30d Frequency Percent
Very 61 58.79
Somewhat 20 19.75
Not very 9 8.79
Not at all 4 3.88
Don't know 9 8.79
Frequency Missing = 21.601499716
DANGEROUS FOR KIDS TO
USE COCAINE
q30e Frequency Percent
Very 74 74.76
Somewhat 10 10.19
Not very 5 4.98
Not at all 1 1.07
Don't know 9 9.00
Frequency Missing = 25.379168588
DANGEROUS FOR KIDS TO
USE CRACK
q30f Frequency Percent
Very 76 76.66
Somewhat 10 10.31
Not very 2 1.90
Not at all 1 1.07
Don't know 10 10.07
Frequency Missing = 25.379168588
DANGEROUS FOR KIDS TO
USE ECSTASY
q30g Frequency Percen
Very 76 73.89
Somewhat 5 5.02
Not very 3 2.74
Don't know 19 18.36
Frequency Missing = 21.4837395
DANGEROUS FOR KIDS TO
USE STEROIDS
q30h Frequency Percen
Very 73 69.54
Somewhat 11 10.53
Not very 3 2.69
Don't know 18 17.25
Frequency Missing = 19.5949051
DANGEROUS FOR KIDS TO
USE HEROIN
q30i Frequency Percen
Very 72 68.42
Somewhat 11 10.75
Not very 2 1.79
Don't know 20 19.04
Frequency Missing = 19.5949051
DANGEROUS FOR KIDS TO
USE METHAMPHETAMINE
q30j Frequency Percen
Very 74 70.4
Somewhat 8 7.8
Not very 2 1.7
Don't know 21 19.9
Frequency Missing = 19.5949051
DAYS SKIPPED SINCE
SEPTEMBER
q31a Frequency Percent
None 87 82.38
1-3 days 14 13.58
4-9 days 3 3.03
10+ days 1 1.01
The frequencies have been weighted so that the
analysis reflects the distribution of students by grade
level in the district
Page
8/6/2019 Spring Branch ISD - Northbrook Middle School - 2008 Texas School Survey of Drug and Alcohol Use
http://slidepdf.com/reader/full/spring-branch-isd-northbrook-middle-school-2008-texas-school-survey-of 55/58
Spring Branch ISD - Northbrook Middle School
Spring 2008
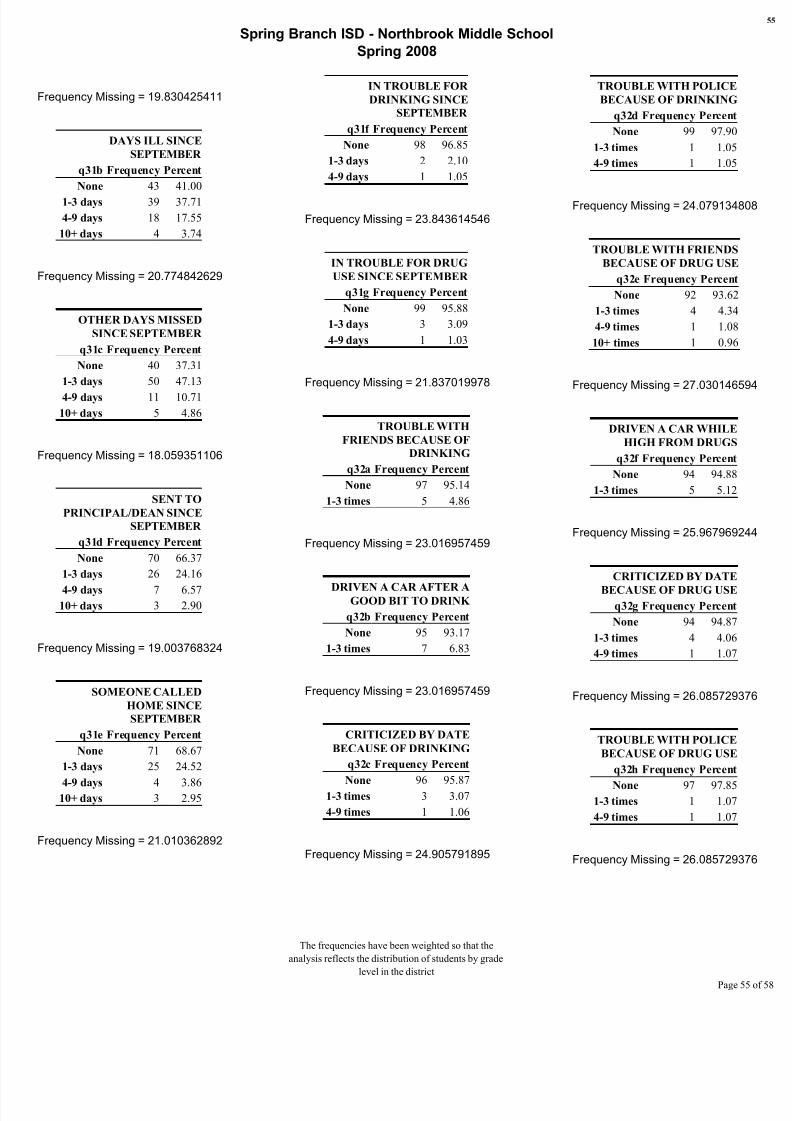
Frequency Missing = 19.830425411
DAYS ILL SINCE
SEPTEMBER
q31b Frequency Percent
None 43 41.00
1-3 days 39 37.71
4-9 days 18 17.55
10+ days 4 3.74
Frequency Missing = 20.774842629
OTHER DAYS MISSED
SINCE SEPTEMBER
q31c Frequency Percent
None 40 37.31
1-3 days 50 47.13
4-9 days 11 10.71
10+ days 5 4.86
Frequency Missing = 18.059351106
SENT TO
PRINCIPAL/DEAN SINCE
SEPTEMBER
q31d Frequency Percent
None 70 66.37
1-3 days 26 24.16
4-9 days 7 6.5710+ days 3 2.90
Frequency Missing = 19.003768324
SOMEONE CALLED
HOME SINCE
SEPTEMBER
q31e Frequency Percent
None 71 68.67
1-3 days 25 24.52
4-9 days 4 3.8610+ days 3 2.95
Frequency Missing = 21.010362892
IN TROUBLE FOR
DRINKING SINCE
SEPTEMBER
q31f Frequency Percent
None 98 96.85
1-3 days 2 2.10
4-9 days 1 1.05
Frequency Missing = 23.843614546
IN TROUBLE FOR DRUG
USE SINCE SEPTEMBER
q31g Frequency Percent
None 99 95.88
1-3 days 3 3.09
4-9 days 1 1.03
Frequency Missing = 21.837019978
TROUBLE WITH
FRIENDS BECAUSE OF
DRINKING
q32a Frequency Percent
None 97 95.14
1-3 times 5 4.86
Frequency Missing = 23.016957459
DRIVEN A CAR AFTER AGOOD BIT TO DRINK
q32b Frequency Percent
None 95 93.17
1-3 times 7 6.83
Frequency Missing = 23.016957459
CRITICIZED BY DATE
BECAUSE OF DRINKING
q32c Frequency Percent
None 96 95.871-3 times 3 3.07
4-9 times 1 1.06
Frequency Missing = 24.905791895
TROUBLE WITH POLICE
BECAUSE OF DRINKING
q32d Frequency Percent
None 99 97.90
1-3 times 1 1.05
4-9 times 1 1.05
Frequency Missing = 24.0791348
TROUBLE WITH FRIENDS
BECAUSE OF DRUG USE
q32e Frequency Percent
None 92 93.62
1-3 times 4 4.34
4-9 times 1 1.08
10+ times 1 0.96
Frequency Missing = 27.0301465
DRIVEN A CAR WHILE
HIGH FROM DRUGS
q32f Frequency Percent
None 94 94.88
1-3 times 5 5.12
Frequency Missing = 25.9679692
CRITICIZED BY DATE
BECAUSE OF DRUG USEq32g Frequency Percent
None 94 94.87
1-3 times 4 4.06
4-9 times 1 1.07
Frequency Missing = 26.0857293
TROUBLE WITH POLICE
BECAUSE OF DRUG USE
q32h Frequency Percent
None 97 97.851-3 times 1 1.07
4-9 times 1 1.07
Frequency Missing = 26.0857293
The frequencies have been weighted so that the
analysis reflects the distribution of students by grade
level in the district
Page
8/6/2019 Spring Branch ISD - Northbrook Middle School - 2008 Texas School Survey of Drug and Alcohol Use
http://slidepdf.com/reader/full/spring-branch-isd-northbrook-middle-school-2008-texas-school-survey-of 56/58
Spring Branch ISD - Northbrook Middle School
Spring 2008
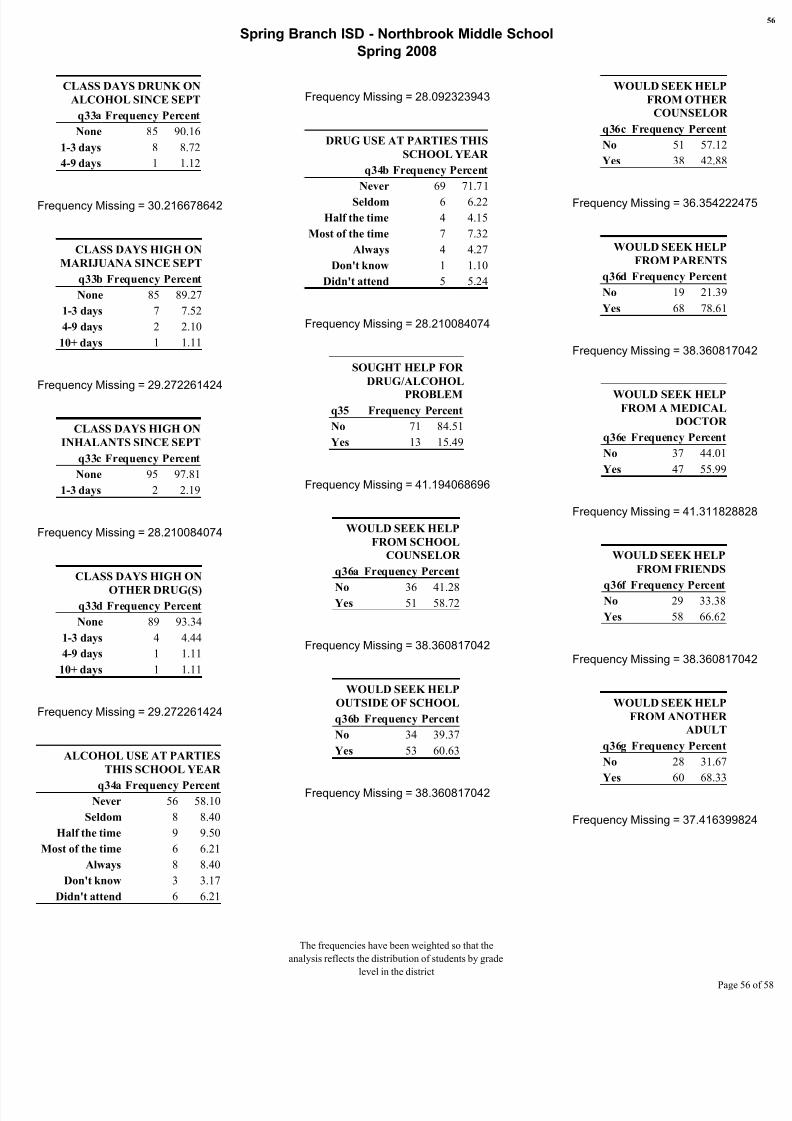
CLASS DAYS DRUNK ON
ALCOHOL SINCE SEPT
q33a Frequency Percent
None 85 90.16
1-3 days 8 8.72
4-9 days 1 1.12
Frequency Missing = 30.216678642
CLASS DAYS HIGH ON
MARIJUANA SINCE SEPT
q33b Frequency Percent
None 85 89.27
1-3 days 7 7.52
4-9 days 2 2.10
10+ days 1 1.11
Frequency Missing = 29.272261424
CLASS DAYS HIGH ON
INHALANTS SINCE SEPT
q33c Frequency Percent
None 95 97.81
1-3 days 2 2.19
Frequency Missing = 28.210084074
CLASS DAYS HIGH ON
OTHER DRUG(S)q33d Frequency Percent
None 89 93.34
1-3 days 4 4.44
4-9 days 1 1.11
10+ days 1 1.11
Frequency Missing = 29.272261424
ALCOHOL USE AT PARTIES
THIS SCHOOL YEAR
q34a Frequency PercentNever 56 58.10
Seldom 8 8.40
Half the time 9 9.50
Most of the time 6 6.21
Always 8 8.40
Don't know 3 3.17
Didn't attend 6 6.21
Frequency Missing = 28.092323943
DRUG USE AT PARTIES THIS
SCHOOL YEAR
q34b Frequency Percent
Never 69 71.71
Seldom 6 6.22
Half the time 4 4.15
Most of the time 7 7.32
Always 4 4.27
Don't know 1 1.10
Didn't attend 5 5.24
Frequency Missing = 28.210084074
SOUGHT HELP FOR
DRUG/ALCOHOL
PROBLEM
q35 Frequency Percent
No 71 84.51
Yes 13 15.49
Frequency Missing = 41.194068696
WOULD SEEK HELP
FROM SCHOOL
COUNSELOR
q36a Frequency Percent
No 36 41.28Yes 51 58.72
Frequency Missing = 38.360817042
WOULD SEEK HELP
OUTSIDE OF SCHOOL
q36b Frequency Percent
No 34 39.37
Yes 53 60.63
Frequency Missing = 38.360817042
WOULD SEEK HELP
FROM OTHER
COUNSELOR
q36c Frequency Percent
No 51 57.12
Yes 38 42.88
Frequency Missing = 36.3542224
WOULD SEEK HELP
FROM PARENTS
q36d Frequency Percent
No 19 21.39
Yes 68 78.61
Frequency Missing = 38.3608170
WOULD SEEK HELPFROM A MEDICAL
DOCTOR
q36e Frequency Percent
No 37 44.01
Yes 47 55.99
Frequency Missing = 41.3118288
WOULD SEEK HELP
FROM FRIENDS
q36f Frequency PercentNo 29 33.38
Yes 58 66.62
Frequency Missing = 38.3608170
WOULD SEEK HELP
FROM ANOTHER
ADULT
q36g Frequency Percent
No 28 31.67
Yes 60 68.33
Frequency Missing = 37.4163998
The frequencies have been weighted so that the
analysis reflects the distribution of students by grade
level in the district
Page

8/6/2019 Spring Branch ISD - Northbrook Middle School - 2008 Texas School Survey of Drug and Alcohol Use
http://slidepdf.com/reader/full/spring-branch-isd-northbrook-middle-school-2008-texas-school-survey-of 57/58
8/6/2019 Spring Branch ISD - Northbrook Middle School - 2008 Texas School Survey of Drug and Alcohol Use
http://slidepdf.com/reader/full/spring-branch-isd-northbrook-middle-school-2008-texas-school-survey-of 58/58
Spring Branch ISD - Northbrook Middle School
Spring 2008
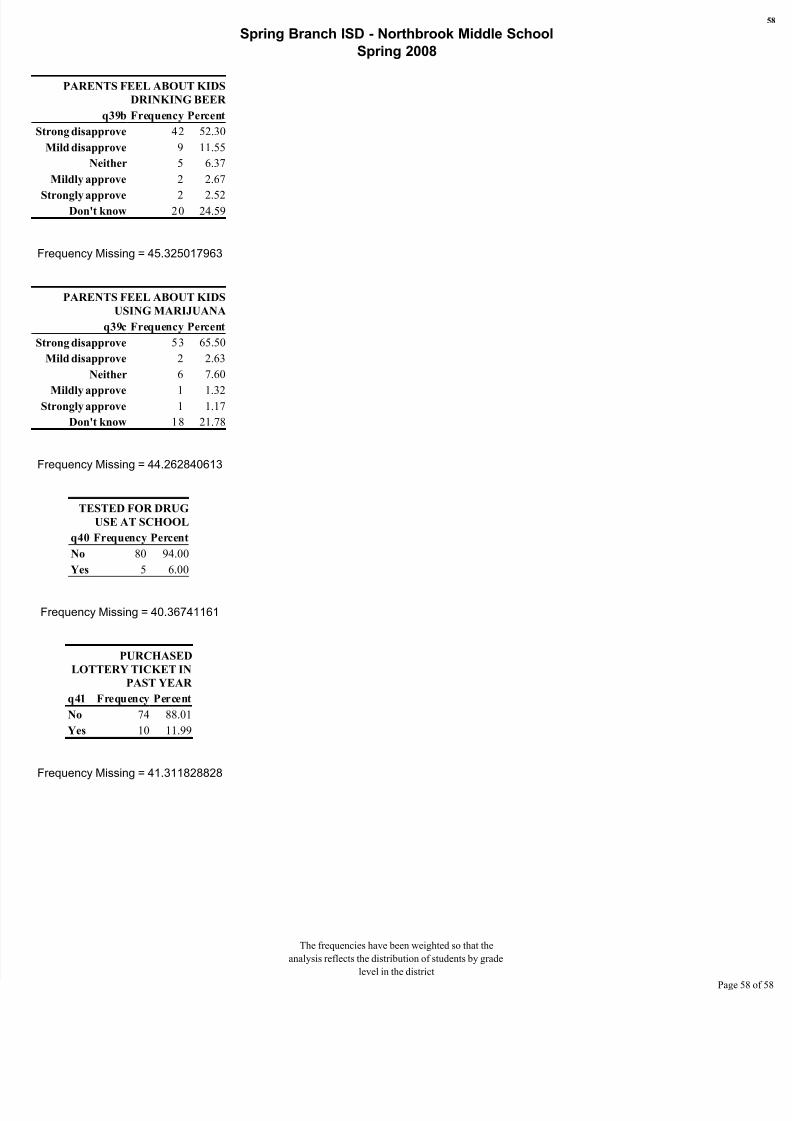
PARENTS FEEL ABOUT KIDS
DRINKING BEER
q39b Frequency Percent
Strong disapprove 42 52.30
Mild disapprove 9 11.55
Neither 5 6.37
Mildly approve 2 2.67
Strongly approve 2 2.52Don't know 20 24.59
Frequency Missing = 45.325017963
PARENTS FEEL ABOUT KIDS
USING MARIJUANA
q39c Frequency Percent
Strong disapprove 53 65.50
Mild disapprove 2 2.63
Neither 6 7.60
Mildly approve 1 1.32Strongly approve 1 1.17
Don't know 18 21.78
Frequency Missing = 44.262840613
TESTED FOR DRUG
USE AT SCHOOL
q40 Frequency Percent
No 80 94.00
Yes 5 6.00
Frequency Missing = 40.36741161
PURCHASED
LOTTERY TICKET IN
PAST YEAR
q41 Frequency Percent
No 74 88.01
Yes 10 11.99
Frequency Missing = 41.311828828