Embed Size (px)
Citation preview
Page | 1
Kishan Patel
Sainath Baragada
Abdulwaheb O. Abulgasem
Project Report
System Simulation @ Burger King
EGRM 6617
System Simulation
Spri
ng 2
017
Date:05/04/2017

Page | 2
Table of Content
Sr. No. Topic Page No. 0 Group Identification 3 1 Executive Summary 3 2 Introduction of Project Focus Area 3 3 Problem Statement 3 4 System Analysis 4 5 Input Data Collection and Analysis 6 6 Conceptual Simulation Model 15 7 ARENA Simulation Model 16 8 Model Validation 21 9 Initial Performance Analysis (Base model) 23 10 Test of the Scenarios with Process Analyzer (PAN), Output Analys is
(OA) and OptQuest. 24
11 Proposed Performance Improvement Scenarios 27 12 Animation 28 13 Conclusion & Recommendations 28
Page | 3
0. Team & Group Name Identification
Team Name: Simulation Rockers.
Team Member: Kishan Patel, Sianath Baragada, Abdulwahab O. Abulgasem
1. Executive Summary
Burger King is one of the fastest growing fast food chain in the USA. Burger King is an American global chain of hamburger fast food restaurants. Headquartered in the unincorporated area of Miami-Dade County, Florida, the company was founded in 1953 as InstaBurger King, a Jacksonville, Florida-based restaurant chain. The growth then become exponential in coming years. With growth comes are much difficult responsibilities of customer satisfaction. There starts coming of the complains regarding the servicing times and waiting time.
In the project, we tried to understand these problems at a local Burger King. With the help of Arena Simula t ion software, we tried to analyze and study the system for reducing the wait time and servicing time. With the help of ARENA, we simulated the actual working of system at burger king, then for validation With the help of PAN, we come up with different scenarios. That helped to come up with solution at the end.
2. Introduction of Project focus area
During first team meeting, with the help of brainstorming and initial discussion all agreed to do system simula t ion project in the field of service industry. So, we tried to search around for the location of business of such kind.
Project focus area: Fast Food restaurant- Burger King
Location: 644 Campbell Avenue, West Haven CT- 06516
Type of system: Service based system. The location seems to be busy so, we thought of using system simula t ion methods to analyses the working and running of the system and give recommendations.
3. Problem statement
The first problem what we have seen there is long queue and more waiting time. The restaurant seems to be busy most of the time. The downtown street of West Haven and crossing with many residency around it makes it busier.
During our research over there we noticed that there are less number of employee working during the busy time of the day-Lunch Time. Due to these is usually a queue of 2-3 customer. There is two cashier machine but only one was used always when we were taking the data, making long wait time during lunch time.
The motivation came for choosing this topic for project is our own experience during the visits over there. The restaurant seems to be busy during day time and at night on weekends. Usually during our visits, we all have seen that there is always waiting time in queue. So, it gave us thought to check and make a real-time simulation model for the store and give recommendations.
We are using Arena 15.0 simulation software for our project.

Page | 4
4. System Analysis
4.1 Graphical Representation of the system
There is fixed layout of the store. The store has two entrance and there is sitting of almost 70 customers. The store also has Drive-Thru. The store has shift based working system of the employee. The drive-thru employee are just focused on giving service to the drive-thru and some employee gives service to instore. There is just one cashier for instore activities.
The store has accessibility for disabled also.
The following simple layout of the store shows basic parts and system of it.
Figure 1: Graphical layout of system
4.2 Objective of the system
The main objective of the system is proper utilization of resource which we think is not properly used. The objective is based on our observation that only one cashier is used when the store is on the pick time of business. The resource such are wasted and same time making conjections in the system. So, we got the objective that we must give the result regarding proper utilization of resource and making waiting time less. There were only six Employee working with one cashier. The store was designed such that only some Employees is allocated the drive-thru and some are given the in-store order.

Page | 5
4.3 Elements of the system
The elements of the system are; customers, cashier, employees, grill machine, fryer, coke machine, tables, frozen freezer, raw materials required for making burger, and others. The elements are mostly obtained locally. Like the main customers are the local people from West Haven, any very little from the from interstate. The use of grill machine is used to make sandwich for them and frozen is used to store the frozen products. Fryer are used to make fries and all.
Simply it could include:
• Employees • Customers • Machines • Raw materials such as; Bun, Frozen products, vegetables etc.
4.4 Type of system
The type of system that could best describe the system is Dynamic/Discrete/Stochastic/Open system
Following are the reasons for these type of system
• Dynamic: It is because the system is affected by change in time. Time is the factor that is analyzed. • Discrete: Because the arrival of customers is one by one and not continuous as a line. Also, the arrival is
countable so these is discrete type. • Stochastic: It is because the arrival of eutomer is in random way. • Open system: The system can be affected by any other things from outside so it is open in nature.
4.5 Variables of the system
The variable is the generally time dependent. The variance noted in the variable is of importance in the simulat ion. In study of the store we have considered # of customers serviced during the noting of time. Also, interarrival time and service time are also variable as they are influenced by order and time of the day. Waiting and queue time are also of importance.
4.6 Parameters of the system
Parameters are # of employee working during particular time of the day, sitting capacity of the store, # of cashier working, data collection time is also parameter in the system. Some are controllable parameter and some are uncontrollable parameter.
4.7 Feedback or causal relations (Relationships)
The relationships in the system are space based and time based. As the machine and type of products are having space based relationship. There is also a dependent relationship between fryer and frozen. As the frozen machine and fryer are adjacent steps from fries and frozen foods. The same is with grill and frozen.

Page | 6
4.8 System performance metrics
• Minimum/Maximum/Average length of queue, • Minimum/Maximum/Average waiting time for the customers/service time, • Minimum/Maximum/Average utilization (resource schedule) with efficiency of workers which are the major
performance metrics
4.9 Constants of the system
Anything that can’t be changed over time is constants in the system. The layout of the system is one of constant parameter in the system. The positions of the machine and time of operation of the store.
4.10 Constraints of the system
Constraints of the system are one that is having restriction for further use then allotted. Example number of employee in the shifts, number of workers can work, supply, maximum number of customers allowed in the store by city, capacities of the machines.
4.11 Environment around the system
The environment around the store is very dynamic in the sense that there is always moment of cars, buses, people and more. There is bus stand near by which also makes it busier place. And there is exit for interstate that also impact the business of the store.
4.12 Subsystems
No subsystems are presents.
5 Input Data Collection and Analysis
Data for the simulation were collected from the location directly with the help of team mates. The strategy for collection of data was to take the help of stopwatch and visually noting the timings of the customer as they pass the point where the timing was to be taken. The timings were noted on the sheet made specially made to take time.The data were collected for following days and time
• Wednesday - Afternoon and Evening • Saturday – Afternoon and Evening
Figure 2: Points of timing that were taken

Page | 7
The data were taken then the timings were placed in Excel file for further help in analysis. The timings were taken with following rule.
• Interarrival Time: The time difference between the arrival of customers. The time depends on the rate of arrival.
• Waiting Time: The time difference between the customers’ arrival and the time he starts to place his/her order. These will give the waiting time in the queue.
• Order Time: The time difference between the customer placing and finishing the order. These times can help in analysis the complexity of placing the order if the customer is new/old.
• Service Time: The time difference between the customer finishing his/her order and getting food. The time will help in analysis the service timing and its effects.
Page | 8
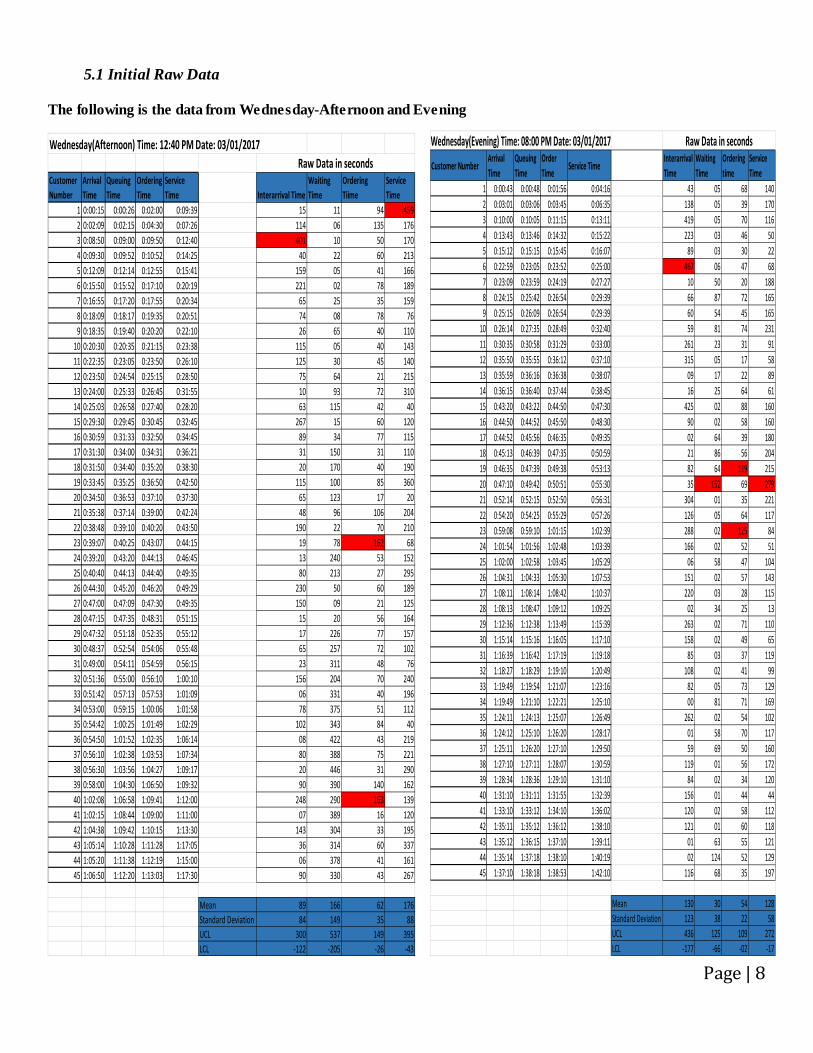
5.1 Initial Raw Data
The following is the data from Wednesday-Afternoon and Evening
Wednesday(Afternoon) Time: 12:40 PM Date: 03/01/2017
Customer Number
Arrival Time
Queuing Time
Ordering Time
Service Time Interarrival Time
Waiting Time
Ordering Tiime
Service Time
1 0:00:15 0:00:26 0:02:00 0:09:39 15 11 94 4592 0:02:09 0:02:15 0:04:30 0:07:26 114 06 135 1763 0:08:50 0:09:00 0:09:50 0:12:40 401 10 50 1704 0:09:30 0:09:52 0:10:52 0:14:25 40 22 60 2135 0:12:09 0:12:14 0:12:55 0:15:41 159 05 41 1666 0:15:50 0:15:52 0:17:10 0:20:19 221 02 78 1897 0:16:55 0:17:20 0:17:55 0:20:34 65 25 35 1598 0:18:09 0:18:17 0:19:35 0:20:51 74 08 78 769 0:18:35 0:19:40 0:20:20 0:22:10 26 65 40 110
10 0:20:30 0:20:35 0:21:15 0:23:38 115 05 40 14311 0:22:35 0:23:05 0:23:50 0:26:10 125 30 45 14012 0:23:50 0:24:54 0:25:15 0:28:50 75 64 21 21513 0:24:00 0:25:33 0:26:45 0:31:55 10 93 72 31014 0:25:03 0:26:58 0:27:40 0:28:20 63 115 42 4015 0:29:30 0:29:45 0:30:45 0:32:45 267 15 60 12016 0:30:59 0:31:33 0:32:50 0:34:45 89 34 77 11517 0:31:30 0:34:00 0:34:31 0:36:21 31 150 31 11018 0:31:50 0:34:40 0:35:20 0:38:30 20 170 40 19019 0:33:45 0:35:25 0:36:50 0:42:50 115 100 85 36020 0:34:50 0:36:53 0:37:10 0:37:30 65 123 17 2021 0:35:38 0:37:14 0:39:00 0:42:24 48 96 106 20422 0:38:48 0:39:10 0:40:20 0:43:50 190 22 70 21023 0:39:07 0:40:25 0:43:07 0:44:15 19 78 162 6824 0:39:20 0:43:20 0:44:13 0:46:45 13 240 53 15225 0:40:40 0:44:13 0:44:40 0:49:35 80 213 27 29526 0:44:30 0:45:20 0:46:20 0:49:29 230 50 60 18927 0:47:00 0:47:09 0:47:30 0:49:35 150 09 21 12528 0:47:15 0:47:35 0:48:31 0:51:15 15 20 56 16429 0:47:32 0:51:18 0:52:35 0:55:12 17 226 77 15730 0:48:37 0:52:54 0:54:06 0:55:48 65 257 72 10231 0:49:00 0:54:11 0:54:59 0:56:15 23 311 48 7632 0:51:36 0:55:00 0:56:10 1:00:10 156 204 70 24033 0:51:42 0:57:13 0:57:53 1:01:09 06 331 40 19634 0:53:00 0:59:15 1:00:06 1:01:58 78 375 51 11235 0:54:42 1:00:25 1:01:49 1:02:29 102 343 84 4036 0:54:50 1:01:52 1:02:35 1:06:14 08 422 43 21937 0:56:10 1:02:38 1:03:53 1:07:34 80 388 75 22138 0:56:30 1:03:56 1:04:27 1:09:17 20 446 31 29039 0:58:00 1:04:30 1:06:50 1:09:32 90 390 140 16240 1:02:08 1:06:58 1:09:41 1:12:00 248 290 163 13941 1:02:15 1:08:44 1:09:00 1:11:00 07 389 16 12042 1:04:38 1:09:42 1:10:15 1:13:30 143 304 33 19543 1:05:14 1:10:28 1:11:28 1:17:05 36 314 60 33744 1:05:20 1:11:38 1:12:19 1:15:00 06 378 41 16145 1:06:50 1:12:20 1:13:03 1:17:30 90 330 43 267
Mean 89 166 62 176Standard Deviation 84 149 35 88UCL 300 537 149 395LCL -122 -205 -26 -43
Raw Data in seconds Customer NumberArrival Time
Queuing Time
Order Time
Service TimeInterarrival Time
Waiting Time
Ordering time
Service Time
1 0:00:43 0:00:48 0:01:56 0:04:16 43 05 68 1402 0:03:01 0:03:06 0:03:45 0:06:35 138 05 39 1703 0:10:00 0:10:05 0:11:15 0:13:11 419 05 70 1164 0:13:43 0:13:46 0:14:32 0:15:22 223 03 46 505 0:15:12 0:15:15 0:15:45 0:16:07 89 03 30 226 0:22:59 0:23:05 0:23:52 0:25:00 467 06 47 687 0:23:09 0:23:59 0:24:19 0:27:27 10 50 20 1888 0:24:15 0:25:42 0:26:54 0:29:39 66 87 72 1659 0:25:15 0:26:09 0:26:54 0:29:39 60 54 45 165
10 0:26:14 0:27:35 0:28:49 0:32:40 59 81 74 23111 0:30:35 0:30:58 0:31:29 0:33:00 261 23 31 9112 0:35:50 0:35:55 0:36:12 0:37:10 315 05 17 5813 0:35:59 0:36:16 0:36:38 0:38:07 09 17 22 8914 0:36:15 0:36:40 0:37:44 0:38:45 16 25 64 6115 0:43:20 0:43:22 0:44:50 0:47:30 425 02 88 16016 0:44:50 0:44:52 0:45:50 0:48:30 90 02 58 16017 0:44:52 0:45:56 0:46:35 0:49:35 02 64 39 18018 0:45:13 0:46:39 0:47:35 0:50:59 21 86 56 20419 0:46:35 0:47:39 0:49:38 0:53:13 82 64 119 21520 0:47:10 0:49:42 0:50:51 0:55:30 35 152 69 27921 0:52:14 0:52:15 0:52:50 0:56:31 304 01 35 22122 0:54:20 0:54:25 0:55:29 0:57:26 126 05 64 11723 0:59:08 0:59:10 1:01:15 1:02:39 288 02 125 8424 1:01:54 1:01:56 1:02:48 1:03:39 166 02 52 5125 1:02:00 1:02:58 1:03:45 1:05:29 06 58 47 10426 1:04:31 1:04:33 1:05:30 1:07:53 151 02 57 14327 1:08:11 1:08:14 1:08:42 1:10:37 220 03 28 11528 1:08:13 1:08:47 1:09:12 1:09:25 02 34 25 1329 1:12:36 1:12:38 1:13:49 1:15:39 263 02 71 11030 1:15:14 1:15:16 1:16:05 1:17:10 158 02 49 6531 1:16:39 1:16:42 1:17:19 1:19:18 85 03 37 11932 1:18:27 1:18:29 1:19:10 1:20:49 108 02 41 9933 1:19:49 1:19:54 1:21:07 1:23:16 82 05 73 12934 1:19:49 1:21:10 1:22:21 1:25:10 00 81 71 16935 1:24:11 1:24:13 1:25:07 1:26:49 262 02 54 10236 1:24:12 1:25:10 1:26:20 1:28:17 01 58 70 11737 1:25:11 1:26:20 1:27:10 1:29:50 59 69 50 16038 1:27:10 1:27:11 1:28:07 1:30:59 119 01 56 17239 1:28:34 1:28:36 1:29:10 1:31:10 84 02 34 12040 1:31:10 1:31:11 1:31:55 1:32:39 156 01 44 4441 1:33:10 1:33:12 1:34:10 1:36:02 120 02 58 11242 1:35:11 1:35:12 1:36:12 1:38:10 121 01 60 11843 1:35:12 1:36:15 1:37:10 1:39:11 01 63 55 12144 1:35:14 1:37:18 1:38:10 1:40:19 02 124 52 12945 1:37:10 1:38:18 1:38:53 1:42:10 116 68 35 197
Mean 130 30 54 128Standard Deviation 123 38 22 58UCL 436 125 109 272LCL -177 -66 -02 -17
Raw Data in secondsWednesday(Evening) Time: 08:00 PM Date: 03/01/2017

Page | 9
The following is the data from Saturday-Afternoon
Customer Number
Arrival Time
Queuing Time
Order Time
Service Time Interarrival Time Waiting Time Ordering Time Service Time
1 0:00:23 0:00:58 0:02:14 0:04:17 23 35 76 1232 0:01:15 0:02:23 0:03:36 0:05:31 52 68 73 1153 0:01:23 0:03:49 0:04:38 0:06:26 08 146 49 1084 0:01:56 0:04:53 0:05:58 0:06:51 33 177 65 535 0:02:48 0:06:43 0:07:52 0:09:28 52 235 69 966 0:05:14 0:07:58 0:08:46 0:11:29 146 164 48 1637 0:06:23 0:08:50 0:10:41 0:14:15 69 147 111 2148 0:06:44 0:10:55 0:12:35 0:14:56 21 251 100 1419 0:07:12 0:12:42 0:13:53 0:16:09 28 330 71 136
10 0:09:11 0:13:58 0:14:37 0:15:44 119 287 39 6711 0:12:39 0:14:48 0:15:59 0:17:12 208 129 71 7312 0:15:48 0:16:53 0:17:38 0:19:54 189 65 45 13613 0:16:55 0:17:49 0:19:27 0:22:17 67 54 98 17014 0:19:45 0:19:56 0:21:01 0:22:53 170 11 65 11215 0:21:16 0:21:48 0:22:22 0:25:51 91 32 34 20916 0:24:12 0:24:20 0:25:39 0:27:32 176 08 79 11317 0:25:23 0:25:45 0:27:55 0:30:11 71 22 130 13618 0:28:19 0:28:54 0:29:48 0:32:25 176 35 54 15719 0:28:54 0:30:00 0:32:21 0:33:58 35 66 141 9720 0:30:22 0:32:29 0:33:49 0:36:51 88 127 80 18221 0:32:16 0:33:53 0:35:42 0:38:12 114 97 109 15022 0:35:19 0:35:58 0:37:21 0:39:43 183 39 83 14223 0:36:20 0:37:59 0:38:46 0:42:54 61 99 47 24824 0:37:48 0:40:18 0:41:12 0:44:19 88 150 54 18725 0:39:26 0:41:20 0:42:56 0:44:53 98 114 96 11726 0:43:51 0:44:19 0:45:57 0:48:28 265 28 98 15127 0:44:12 0:46:58 0:48:14 0:51:23 21 166 76 18928 0:44:24 0:48:19 0:49:10 0:51:57 12 235 51 16729 0:45:52 0:49:16 0:50:17 0:53:25 88 204 61 18830 0:45:55 0:50:23 0:51:17 0:53:49 03 268 54 15231 0:49:56 0:51:53 0:52:44 0:55:21 241 117 51 15732 0:50:41 0:52:48 0:54:15 0:56:07 45 127 87 11233 0:50:52 0:54:28 0:55:49 0:58:28 11 216 81 15934 0:51:31 0:55:56 0:57:12 0:59:56 39 265 76 16435 0:53:24 0:57:17 0:59:18 1:02:19 113 233 121 18136 0:56:45 0:59:24 1:00:47 1:03:41 201 159 83 17437 0:58:21 1:00:52 1:02:32 1:04:55 96 151 100 14338 0:58:51 1:02:47 1:03:39 1:06:24 30 236 52 16539 0:59:44 1:03:45 1:04:58 1:06:55 53 241 73 11740 1:00:13 1:05:03 1:05:46 1:08:12 29 290 43 14641 1:00:39 1:05:52 1:06:33 1:08:39 26 313 41 12642 1:00:55 1:06:40 1:07:29 1:09:47 16 345 49 13843 1:03:26 1:07:34 1:08:54 1:11:15 151 248 80 14144 1:04:52 1:08:58 1:09:51 1:11:28 86 246 53 9745 1:06:49 1:09:57 1:10:36 1:12:19 117 188 39 103
Mean 89 159 72 143Std Dev 69 95 26 39UCL 261 397 136 241LCL -83 -78 08 44
Saturday(Evening) Time: 1:00 PM Date: 03/04/2017 Raw Data in secondsCustomer Number Arrival Time Queuing Time
Order Time
Service Time Interarrival Time Waiting Time Ordering Time Service Time
1 0:00:18 0:00:25 0:02:05 0:07:48 18 07 100 3432 0:00:37 0:02:15 0:02:57 0:07:50 19 98 42 2933 0:01:50 0:03:06 0:04:32 0:10:56 73 76 86 3844 0:04:26 0:05:10 0:05:59 0:12:19 156 44 49 3805 0:06:17 0:08:29 0:09:04 0:13:56 111 132 35 2926 0:07:12 0:09:11 0:10:05 0:16:56 55 119 54 4117 0:09:27 0:10:12 0:11:31 0:18:35 135 45 79 4248 0:10:08 0:14:12 0:15:09 0:15:55 41 244 57 469 0:13:58 0:15:16 0:16:07 0:17:11 230 78 51 64
10 0:17:49 0:17:52 0:18:38 0:26:56 231 03 46 49811 0:18:13 0:18:40 0:19:48 0:21:28 24 27 68 10012 0:19:46 0:20:25 0:21:56 0:23:05 93 39 91 6913 0:24:10 0:24:30 0:25:49 0:28:55 264 20 79 18614 0:25:28 0:26:35 0:27:18 0:29:14 78 67 43 11615 0:27:16 0:27:52 0:28:17 0:31:01 108 36 25 16416 0:30:14 0:31:04 0:32:35 0:35:24 178 50 91 16917 0:31:06 0:32:43 0:33:05 0:37:03 52 97 22 23818 0:32:20 0:33:10 0:34:03 0:38:10 74 50 53 24719 0:37:29 0:37:35 0:38:28 0:38:54 309 06 53 2620 0:37:46 0:38:33 0:39:09 0:44:00 17 47 36 29121 0:40:27 0:40:46 0:41:28 0:44:34 161 19 42 18622 0:40:35 0:41:39 0:42:28 0:44:42 08 64 49 13423 0:42:20 0:44:54 0:45:30 0:47:25 105 154 36 11524 0:43:11 0:45:35 0:46:11 0:47:10 51 144 36 5925 0:44:18 0:46:14 0:47:59 0:50:29 67 116 105 15026 0:45:59 0:48:09 0:48:53 0:51:30 101 130 44 15727 0:49:33 0:50:50 0:51:35 0:53:38 214 77 45 12328 0:51:30 0:52:16 0:53:24 0:56:11 117 46 68 16729 0:51:35 0:53:28 0:54:15 0:56:46 05 113 47 15130 0:51:57 0:54:22 0:54:50 0:56:59 22 145 28 12931 0:53:32 0:54:54 0:55:38 0:58:26 95 82 44 16832 0:54:35 0:55:50 0:56:30 0:58:45 63 75 40 13533 0:54:40 0:56:48 0:57:55 1:01:03 05 128 67 18834 0:57:01 0:57:58 0:58:50 1:03:10 141 57 52 26035 0:59:32 1:00:25 1:01:29 1:03:50 151 53 64 14136 1:01:18 1:01:50 1:03:25 1:05:18 106 32 95 11337 1:03:00 1:04:09 1:05:42 1:06:13 102 69 93 3138 1:03:46 1:05:55 1:06:50 1:09:09 46 129 55 13939 1:06:23 1:06:59 1:08:26 1:10:11 157 36 87 10540 1:07:41 1:08:32 1:09:18 1:11:21 78 51 46 12341 1:07:48 1:09:42 1:09:54 1:12:45 07 114 12 17142 1:08:37 1:09:59 1:10:26 1:14:38 49 82 27 25243 1:09:22 1:11:26 1:11:45 1:15:26 45 124 19 22144 1:13:58 1:14:05 1:14:58 1:16:53 276 07 53 11545 1:14:10 1:15:04 1:16:10 1:18:19 12 54 66 129
Mean 99 75 55 187Std Dev 78 49 23 110UCL 295 199 113 462LCL -97 -48 -03 -89
Saturday(Afternoon) Time: 1:00 PM Date: 03/04/2017 Raw Data in seconds

Page | 10
The red and yellow marks are the outliers in the data.
5.2 Data after removing outliers
The outliers were found with the help of rule of thumb. It is used to find the UCL and LCL so that the outliers can be found from the data. The UCL/LCL can be found with the help of 𝑀𝑀𝑀𝑀𝑀𝑀𝑀𝑀± 2.5 𝑠𝑠𝑠𝑠𝑀𝑀𝑀𝑀𝑠𝑠𝑀𝑀𝑠𝑠𝑠𝑠 𝑠𝑠𝑀𝑀𝑑𝑑𝑑𝑑𝑀𝑀𝑠𝑠𝑑𝑑𝑑𝑑𝑀𝑀.
Following are the data after removing the outliers Wednesday(Afternoon)
Interarrival TimeWaiting Time
Ordering Tiime
Service Time
15 11 94 176114 06 135 170
40 10 50 213159 22 60 166221 05 41 189
65 02 78 15974 25 35 7626 08 78 110
115 65 40 143125 05 40 140
75 30 45 21510 64 21 31063 93 72 40
267 115 42 12089 15 60 11531 34 77 11020 150 31 190
115 170 40 36065 100 85 2048 123 17 204
190 96 106 21019 22 70 6813 78 53 15280 240 27 295
230 213 60 189150 50 21 125
15 09 56 16417 20 77 15765 226 72 10223 257 48 76
156 311 70 24006 204 40 19678 331 51 112
102 375 84 4008 343 43 21980 422 75 22120 388 31 29090 446 140 162
248 390 16 13907 290 33 120
143 389 60 19536 304 41 33706 314 43 16190 378 267
330
After Removal of OutliersWednesday(Evening)
Interarrival Time
Waiting Time
Ordering time
Service Time
43 05 68 140138 05 39 170419 05 70 116223 03 46 50
89 03 30 2210 06 47 6866 50 20 18860 87 72 16559 54 45 165
261 81 74 231315 23 31 91
09 05 17 5816 17 22 89
425 25 64 6190 02 88 16002 02 58 16021 64 39 18082 86 56 20435 64 69 215
304 01 35 221126 05 64 117288 02 52 84166 02 47 51
06 58 57 104151 02 28 143220 03 25 115
02 34 71 13263 02 49 110158 02 37 65
85 03 41 119108 02 73 99
82 05 71 12900 81 54 169
262 02 70 10201 58 50 11759 69 56 160
119 01 34 17284 02 44 120
156 01 58 44120 02 60 112121 01 55 118
01 63 52 12102 124 35 129
116 68 197
After Removal of Outliers

Page | 11
Saturday(Evening)
Interarrival Time
Waiting Time
Ordering Time
Service Time
23 35 76 12352 68 73 11508 146 49 10833 177 65 5352 235 69 96
146 164 48 16369 147 111 21421 251 100 14128 330 71 136
119 287 39 67208 129 71 73189 65 45 136
67 54 98 170170 11 65 112
91 32 34 209176 08 79 113
71 22 130 136176 35 54 157
35 66 80 9788 127 109 182
114 97 83 150183 39 47 142
61 99 54 18788 150 96 11798 114 98 15121 28 76 18912 166 51 16788 235 61 18803 204 54 152
241 268 51 15745 117 87 11211 127 81 15939 216 76 164
113 265 121 181201 233 83 174
96 159 100 14330 151 52 16553 236 73 11729 241 43 14626 290 41 12616 313 49 138
151 345 80 14186 248 53 97
117 246 39 103188
After Removal of OutliersSaturday(Afternoon)
Interarrival Time
Waiting Time
Ordering Time
Service Time
18 07 100 34319 98 42 29373 76 86 384
156 44 49 380111 132 35 292
55 119 54 411135 45 79 424
41 78 57 46230 03 51 64231 27 46 100
24 39 68 6993 20 91 186
264 67 79 11678 36 43 164
108 50 25 169178 97 91 238
52 50 22 24774 06 53 2617 47 53 291
161 19 36 18608 64 42 134
105 154 49 11551 144 36 5967 116 36 150
101 130 105 157214 77 44 123117 46 45 167
05 113 68 15122 145 47 12995 82 28 16863 75 44 13505 128 40 188
141 57 67 260151 53 52 141106 32 64 113102 69 95 31
46 129 93 139157 36 55 105
78 51 87 12307 114 46 17149 82 12 25245 124 27 221
276 07 19 11512 54 53 129
66
After Removal of Outliers

Page | 12
Figure 3: Normality Plot for All the timings
Here it can be seen that some data are following normal distribution and some are not following normal distribution.
Above is the display for descriptive timing for all the timing taken. The data gives very good explanations for working of system. All the data here are in seconds. The interarrival time for is weekday in afternoon is less that because it was lunch time, it’s almost 1:30 mins. And during these times only the service time is more in comparison with evening on weekdays.
The important thing to note is waiting for week day afternoon and weekend evening is almost same. It is due to lunch time on weekday and busy on weekend is due to all being free at that time. It about 2:30 mins.The service time is almost same for all the days and time. The service time is almost of 3 mins.
So it came out that on an average 7:30-8 mins for all the stuffs before you starts eating.
6005004003002001000-100-200-300
99
95
90
80
70
605040
30
20
10
5
1
82.02 70.40 44 1.484 <0.00557.16 27.98 43 0.834 0.029169.6 77.01 44 0.362 0.429166.2 148.5 45 2.063 <0.005121.9 112.8 44 1.490 <0.005
50.53 16.98 43 0.277 0.639124.2 53.58 44 0.269 0.665
Mean StDev N AD P
Data
Perc
ent
Ordering Time Sat-AFService Time Sat-AFWaiting Time Sat-AFInterarrival Time Sat-EveOrdering Time Sat-EveService Time Sat-EveWaiting Time Sat-Eve
Interarrival Time Wed-AFOrdering Time Wed-AFService Time Wed-AFWaiting Time Wed-AFInterarrival Time Wed-EveOrdering Time Wed-EveService Time Wed-EveWaiting Time Wed-EveInterarrival Time Sat-AF
Variable
Normal - 95% CIProbability Plot

Page | 13
5.3 Input analysis
Analysis for Wednesday afternoon time
Analysis for Wednesday Evening time

Page | 14
Analysis for Saturday afternoon time
Analysis for Saturday Evening time

Page | 15
The following table show the distribution details
6 Conceptual Simulation Model
Figure 2: Flow Chart for the System
Day Time Timing Taken Type of distribution Distributiion DetailsInterarrival Time Weibull 6+WEIB(68, 0.764)Ordering Time Normal NORM(57.2,27.7)Waiting Time Beta 2+444*BETA(0.40+0.683)Service Time Normal NORM(170,76.1)
Interarrival Time Beta -0.001+425*BETA(0.398,0.754)Ordering Time Normal NORM(50.5,16.8)Waiting Time Triangular TRIA(13,119,231)Service Time Beta .999+123*BETA(0.258,0.972)
Everning
Afternoon
Wednesday
Day Time Timing Taken Type of distribution Distributiion DetailsInterarrival Time Beta 5+271BETA(0.693,1.41)Ordering Time Triangular TRIA(11.5,48.3,106)Waiting Time Beta 3+151*BETA(0.957,1.16)Service Time Triangular TRIA(26,130,424)
Interarrival Time Weibull 3+WEIB(84,1.08)Ordering Time Triangular TRAI(33.5,48.4,131)Waiting Time Beta 8+337*BETA(0.946,1.16)Service Time Normal NORM(140,35.8)
Saturday
Afternoon
Everning

Page | 16
7 ARENA Simulation Model
The following is the overview model for simulation with the help of Arena for Burger King system analysis. The model shows that it is having multiple arrival for different days and for different times. The model has different run parameters. The model then has Decide Module for checking the condition for different times and different types of days in week like weekday and weekend.
As can be seen that after Decide Module there are two Process Modules. These modules are for Ordering and Service Times for the systems. And as the data were taken for different days and different times they are made for individual types of days. The module is made with the expression that we got from Input Analyzer and the expression are kept in a table in 4.3 Section of Input Analysis.
As can be seen that the model is having four Create Modules, eight Decide Modules and eight Process Modules. With these there is module created for fake entity. The Assign Module is created for counting the fake entities that would be generated during the running of simulation. The model will be explained in following section.
7.1 Resources and Entities
There are two Entity in the model. One is Customer and Other is Fake Entity. The Customer is Entity made for Customer Arrival and Fake Entity is one that is not matching with the Decision Modules.
The Resource is a set of four as there are four Employees that are working. And it is assumed that the pay of all the employees are $10/hrs.

Page | 17
7.2 Creation of different expression for different Modules.
Expression Table
The expression followed would be the one that is explained in Section 4.3 of Input Analysis.
7.3 Create Modules for different Interarrivals
These are the Create Modules created for Interarrival of the Customer Entity. The Unites for all the modules are in Seconds as can be seen in the screenshot below with the Expression they are following according to
Expressioon Table.
Expression Name Time Timing Taken Type of distribution Distributiion DetailsWeekday Lunch Interarrival Time Weibull 6+WEIB(68, 0.764)Weekday Cashier Lunch Ordering Time Normal NORM(57.2,27.7)Weekday Service Lunch Service Time Normal NORM(170,76.1)Weekday Dinner Interarrival Time Beta -0.001+425*BETA(0.398,0.754)Weekday Cashier Dinner Ordering Time Normal NORM(50.5,16.8)WeekDay Service Dinner Service Time Beta .999+123*BETA(0.258,0.972)Weekend Lunch Interarrival Time Beta 5+271BETA(0.693,1.41)Weekend Cashier Lunch1 Ordering Time Triangular TRIA(11.5,48.3,106)Weekend Service Dinner Service Time Triangular TRIA(26,130,424)Weekend Dinner Everning Interarrival Time Weibull 3+WEIB(84,1.08)Weekend Cashier Dinner 1 Ordering Time Triangular TRAI(33.5,48.4,131)Weekend Service Dinner 1 Service Time Normal NORM(140,35.8)
Everning
Afternoon
Afternoon
Page | 18
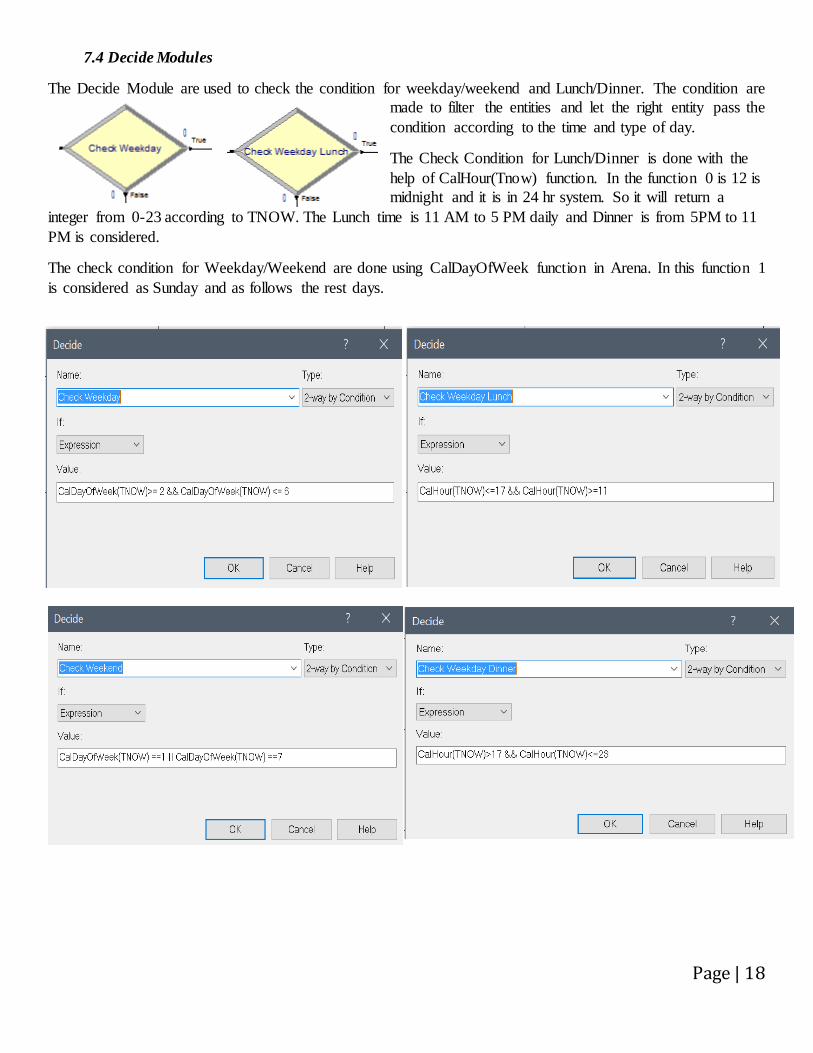
7.4 Decide Modules
The Decide Module are used to check the condition for weekday/weekend and Lunch/Dinner. The condition are made to filter the entities and let the right entity pass the condition according to the time and type of day.
The Check Condition for Lunch/Dinner is done with the help of CalHour(Tnow) function. In the function 0 is 12 is midnight and it is in 24 hr system. So it will return a
integer from 0-23 according to TNOW. The Lunch time is 11 AM to 5 PM daily and Dinner is from 5PM to 11 PM is considered.
The check condition for Weekday/Weekend are done using CalDayOfWeek function in Arena. In this function 1 is considered as Sunday and as follows the rest days.

Page | 19
The all the Decide Module table is shown above with the condition it is following and the Value of that condition.
7.5 Process Modules
The process module is for ordering and service. The Ordering Process has the expression of arrival according to the expression generated from the input analyzer. Same is the case for the Service Process Modules. There are eight order and service module. The Ordering is for Cashier Process and Servicing is for Servicing Process. In Cashier Process the resource used is Cashier1 and for Service Process the Resource used is Set of 4 employees.
Below shows example for Weekday Lunch. Same would be case for different arrivals.
Below table shows the other process and the condition they are following. The resouces they are using the arrival entities are accoring to the specified expression.

Page | 20
7.6 Assign Modules
The Assign Module is used because to check and count the Fake entity.
7.7 Record Module
The record module is used for recording the customer out at the same time calculating the cost of the serving the customers.
The expression is according to the usage/idle/busy condition of the employees.
7.8 Dispose Module
The dispose module is used for disposing the entity be it Fake or Customer Entity.

Page | 21
7.9 Run Parameters
• Number of Replication: 7
• Warm Up time: 1 Hour
• Replication Length: 7 Days
• Hours Per Day: 24 Hours
• Base time Units: Seconds
8 Model Validation.
For validating our model, we used Read/Write Module to extract the model data from actual running of simula t ion model. The process is using assign module for attributing the process start time and same way at the end again with the help of assign module storing the TNOW in that assign module subtracting the TNOW from previous assign Module. The value is then stored in the Read/Write Module.
All the data that are generated are stored in a notepad and with that data and the actual data that we collected are kept in Minitab for validation. Our data did not follow the normal distribution so we tried to validate on the parameter of comparison of Median as base. The test is done according to Kruskal-Wallis Test.
The screenshot below show that the model is validating as the p-value is grater then 0.05 for all the three timings.

Page | 22

Page | 23
9 Initial Performance Analysis (Base model)
From the initial report of the model it seems that the problem that was there in real world seems to be still there. The analysis shows that the Cashier is the most utilized resource. The problem observed is due to just one Cashier the problem of Waiting time is continuing. At the same time the less employee is making service queue bigger.
Below shows some of the initial Report.

Page | 24
10 Test of the Scenarios with Process Analyzer (PAN), Output Analysis (OA) and OptQuest 10.1 Process Analyzer (PAN)
With the help PAN we generated different scenarios on the bases of problem observed in the initial report. We tried to make scenarios by increasing the employees, replications, and cost. The control for the PAN were all the resources and number of Reps. And the Response that we wanted to study of the customer wait time and the cost of increasing the employees. The utilization of the employees was also an important response to study.
Below shows different scenarios with different control and the response is generated according to it.
Graphical Analysis of the scenarios.
Page | 25
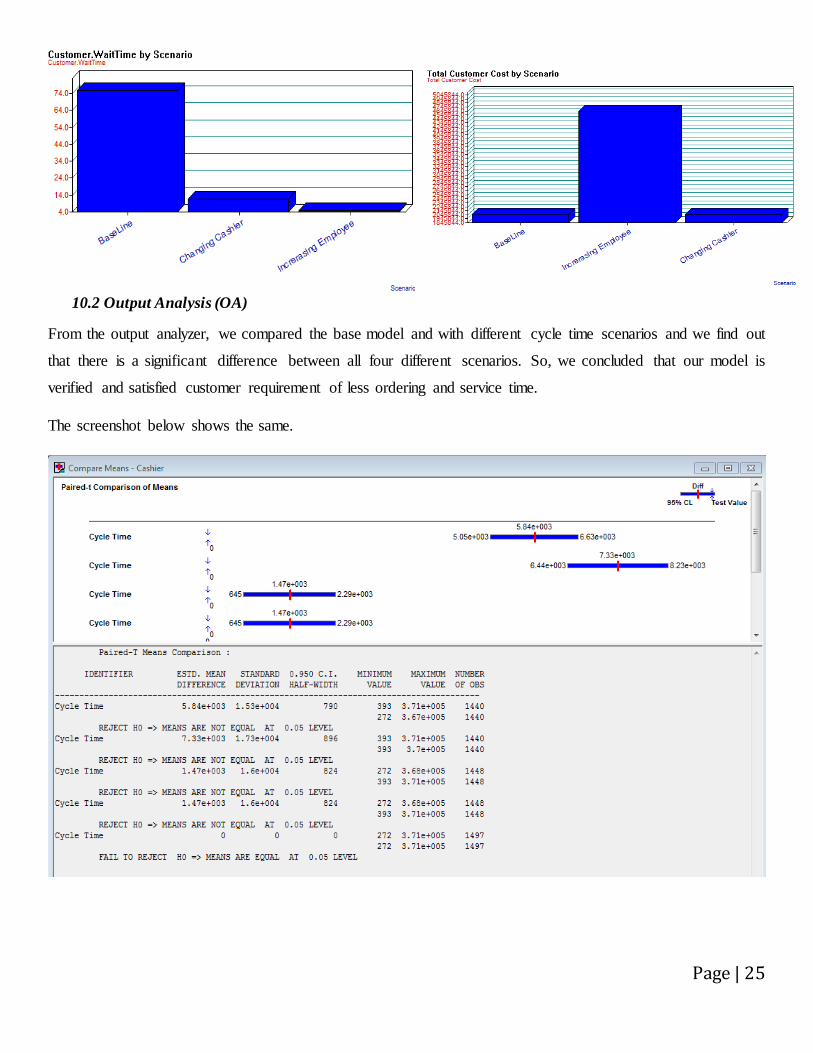
10.2 Output Analysis (OA)
From the output analyzer, we compared the base model and with different cycle time scenarios and we find out
that there is a significant difference between all four different scenarios. So, we concluded that our model is
verified and satisfied customer requirement of less ordering and service time.
The screenshot below shows the same.
Page | 26
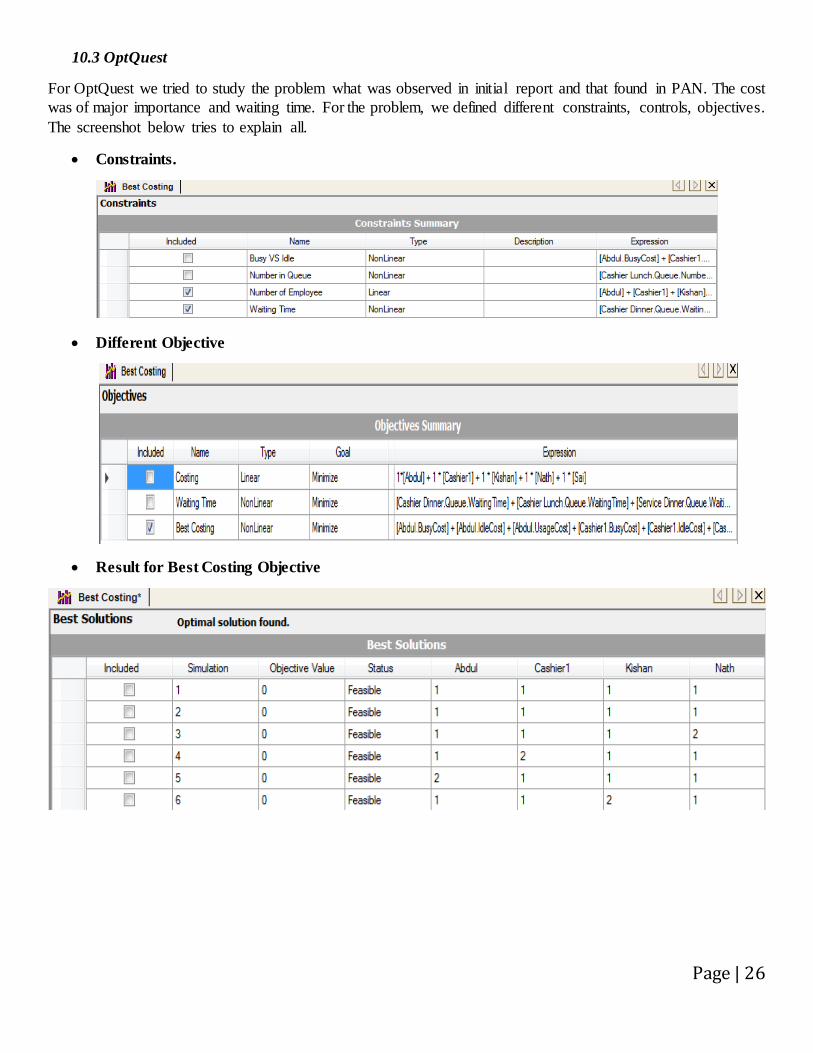
10.3 OptQuest
For OptQuest we tried to study the problem what was observed in initial report and that found in PAN. The cost was of major importance and waiting time. For the problem, we defined different constraints, controls, objectives. The screenshot below tries to explain all.
• Constraints.
• Different Objective
• Result for Best Costing Objective

Page | 27
• Optimization of Best Costing objective
11 Proposed Performance Improvement Scenarios
As Per all the Process Analysis (PAN) that is done for the scenarios we came up with best case scenario that the store should increase one more cashier to reduce the wait time at low cost rather than increasing the service employee. The utilization should be increased with more productive working. For customer satisfaction, we need to reduce the wait time and ordering time. We also suggest to use Kaizen methods to decrease the wait and ordering time.

Page | 28
12 2 D Animation
13 Conclusions
• With the help of all analysis we came up with the conclusion that the queue in the system is mostly due to difference in interarrival time and servicing time. The interarrival time is almost half of the service time. These is making the working of system complicated
• By doing these the service time and customer service will improve From the above analysis, we came to know that the system working is little complicated due to only one cashier working. The complication can be reduced if there is more number of employees and cashier for instore ordering.
• Here we saw that the arrival time of the customer is less than the service time. These is the reason that makes the queue in the store. We would conclude by give recommendation that the store should increase the employment so as decrease the servicing time. It’s almost double for all time except for Wednesday evening time.


![[Gokhan Cetinsaya] the Ottoman Administration of I(BookZZ.org)](https://img.pdfslide.us/doc/110x75/55cf9178550346f57b8da480/gokhan-cetinsaya-the-ottoman-administration-of-ibookzzorg.jpg)