Embed Size (px)
DESCRIPTION
n/a
Citation preview
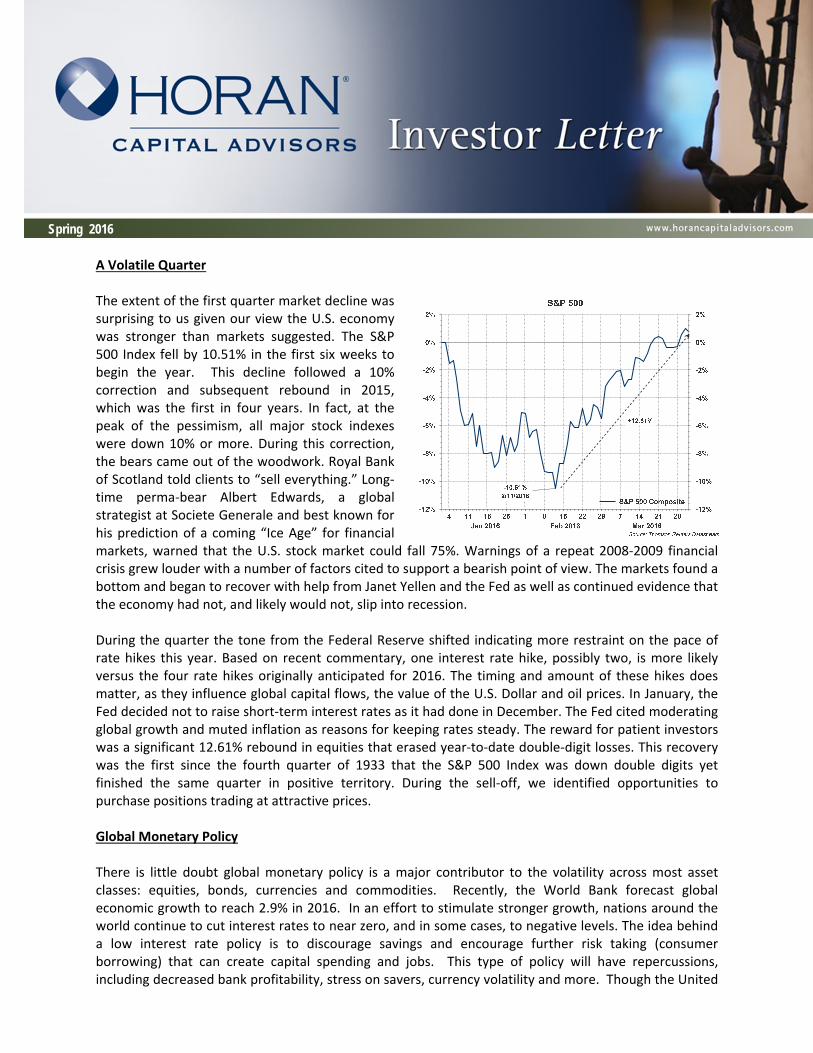
Spring 2016 A Volatile Quarter The extent of the first quarter market decline was surprising to us given our view the U.S. economy was stronger than markets suggested. The S&P 500 Index fell by 10.51% in the first six weeks to begin the year. This decline followed a 10% correction and subsequent rebound in 2015, which was the first in four years. In fact, at the peak of the pessimism, all major stock indexes were down 10% or more. During this correction, the bears came out of the woodwork. Royal Bank of Scotland told clients to “sell everything.” Long‐time perma‐bear Albert Edwards, a global strategist at Societe Generale and best known for his prediction of a coming “Ice Age” for financial markets, warned that the U.S. stock market could fall 75%. Warnings of a repeat 2008‐2009 financial crisis grew louder with a number of factors cited to support a bearish point of view. The markets found a bottom and began to recover with help from Janet Yellen and the Fed as well as continued evidence that the economy had not, and likely would not, slip into recession. During the quarter the tone from the Federal Reserve shifted indicating more restraint on the pace of rate hikes this year. Based on recent commentary, one interest rate hike, possibly two, is more likely versus the four rate hikes originally anticipated for 2016. The timing and amount of these hikes does matter, as they influence global capital flows, the value of the U.S. Dollar and oil prices. In January, the Fed decided not to raise short‐term interest rates as it had done in December. The Fed cited moderating global growth and muted inflation as reasons for keeping rates steady. The reward for patient investors was a significant 12.61% rebound in equities that erased year‐to‐date double‐digit losses. This recovery was the first since the fourth quarter of 1933 that the S&P 500 Index was down double digits yet finished the same quarter in positive territory. During the sell‐off, we identified opportunities to purchase positions trading at attractive prices. Global Monetary Policy There is little doubt global monetary policy is a major contributor to the volatility across most asset classes: equities, bonds, currencies and commodities. Recently, the World Bank forecast global economic growth to reach 2.9% in 2016. In an effort to stimulate stronger growth, nations around the world continue to cut interest rates to near zero, and in some cases, to negative levels. The idea behind a low interest rate policy is to discourage savings and encourage further risk taking (consumer borrowing) that can create capital spending and jobs. This type of policy will have repercussions, including decreased bank profitability, stress on savers, currency volatility and more. Though the United
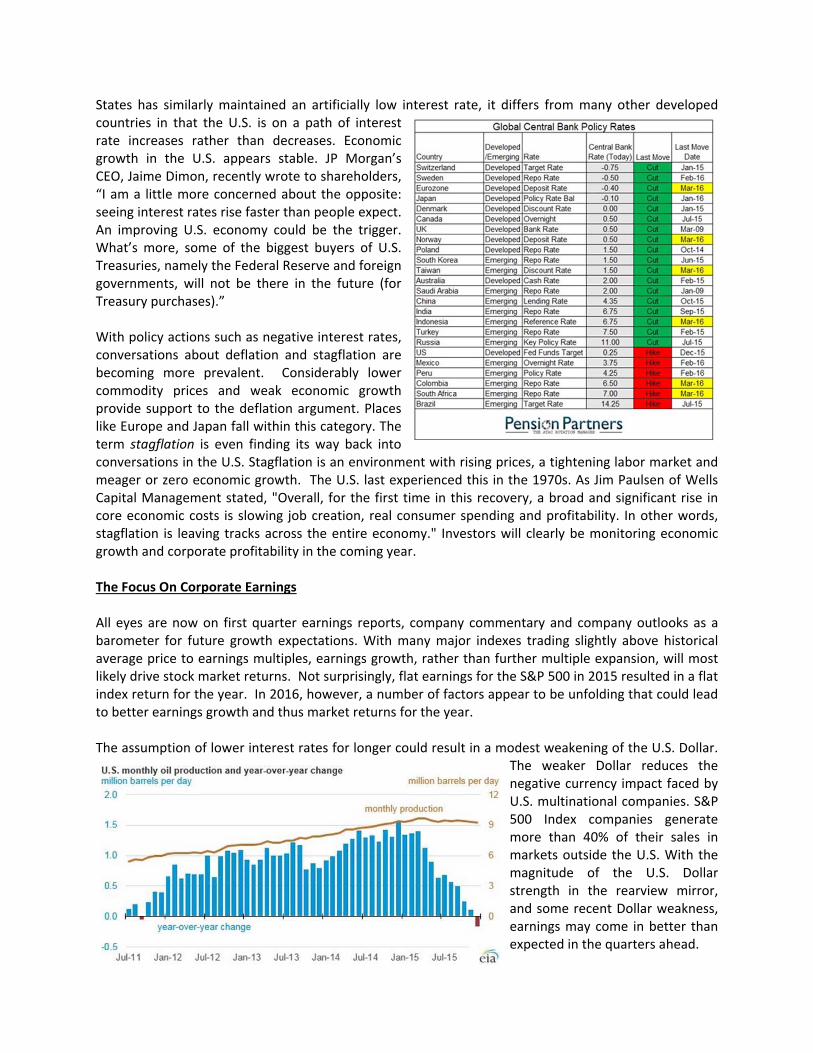
States has similarly maintained an artificially low interest rate, it differs from many other developed countries in that the U.S. is on a path of interest rate increases rather than decreases. Economic growth in the U.S. appears stable. JP Morgan’s CEO, Jaime Dimon, recently wrote to shareholders, “I am a little more concerned about the opposite: seeing interest rates rise faster than people expect. An improving U.S. economy could be the trigger. What’s more, some of the biggest buyers of U.S. Treasuries, namely the Federal Reserve and foreign governments, will not be there in the future (for Treasury purchases).” With policy actions such as negative interest rates, conversations about deflation and stagflation are becoming more prevalent. Considerably lower commodity prices and weak economic growth provide support to the deflation argument. Places like Europe and Japan fall within this category. The term stagflation is even finding its way back into conversations in the U.S. Stagflation is an environment with rising prices, a tightening labor market and meager or zero economic growth. The U.S. last experienced this in the 1970s. As Jim Paulsen of Wells Capital Management stated, "Overall, for the first time in this recovery, a broad and significant rise in core economic costs is slowing job creation, real consumer spending and profitability. In other words, stagflation is leaving tracks across the entire economy." Investors will clearly be monitoring economic growth and corporate profitability in the coming year. The Focus On Corporate Earnings All eyes are now on first quarter earnings reports, company commentary and company outlooks as a barometer for future growth expectations. With many major indexes trading slightly above historical average price to earnings multiples, earnings growth, rather than further multiple expansion, will most likely drive stock market returns. Not surprisingly, flat earnings for the S&P 500 in 2015 resulted in a flat index return for the year. In 2016, however, a number of factors appear to be unfolding that could lead to better earnings growth and thus market returns for the year. The assumption of lower interest rates for longer could result in a modest weakening of the U.S. Dollar.
The weaker Dollar reduces the negative currency impact faced by U.S. multinational companies. S&P 500 Index companies generate more than 40% of their sales in markets outside the U.S. With the magnitude of the U.S. Dollar strength in the rearview mirror, and some recent Dollar weakness, earnings may come in better than expected in the quarters ahead.
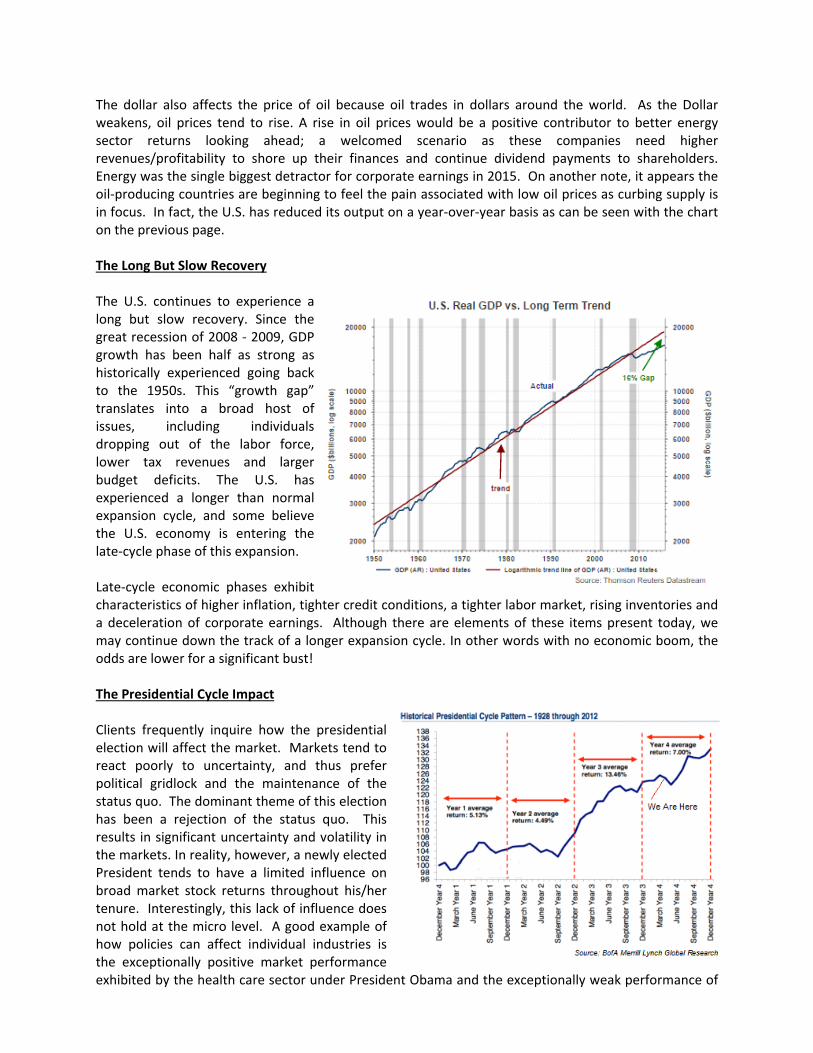
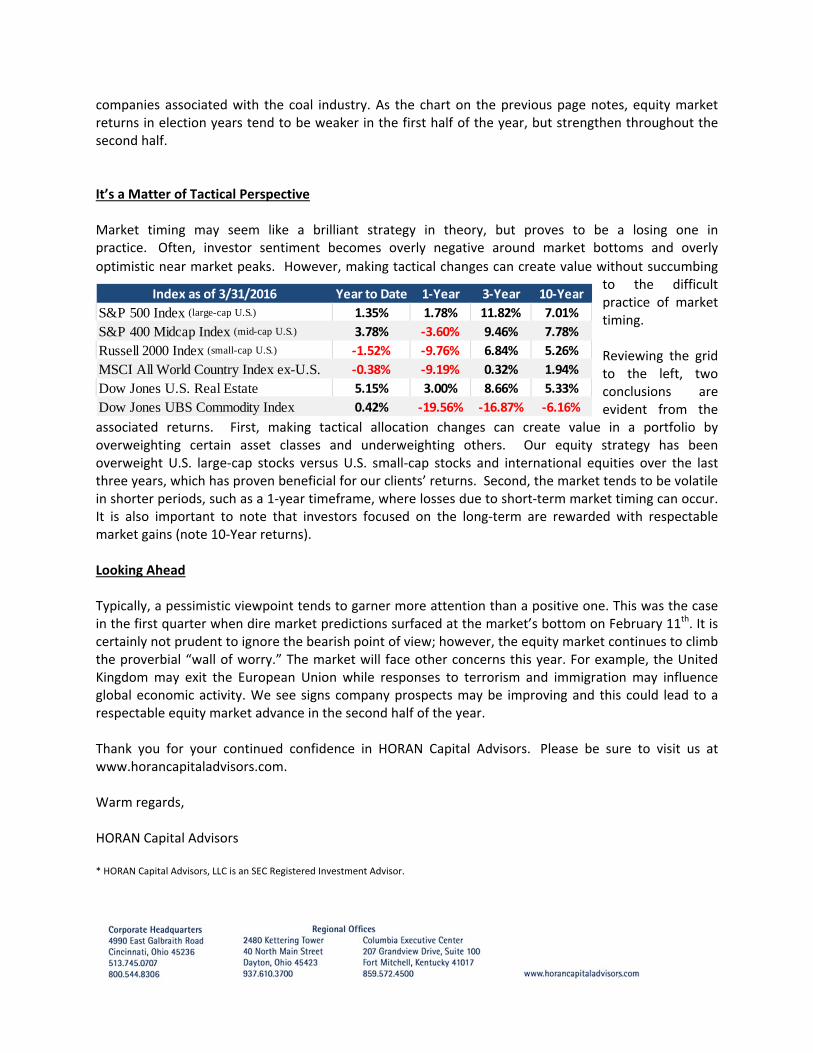
The dollar also affects the price of oil because oil trades in dollars around the world. As the Dollar weakens, oil prices tend to rise. A rise in oil prices would be a positive contributor to better energy sector returns looking ahead; a welcomed scenario as these companies need higher revenues/profitability to shore up their finances and continue dividend payments to shareholders. Energy was the single biggest detractor for corporate earnings in 2015. On another note, it appears the oil‐producing countries are beginning to feel the pain associated with low oil prices as curbing supply is in focus. In fact, the U.S. has reduced its output on a year‐over‐year basis as can be seen with the chart on the previous page. The Long But Slow Recovery The U.S. continues to experience a long but slow recovery. Since the great recession of 2008 ‐ 2009, GDP growth has been half as strong as historically experienced going back to the 1950s. This “growth gap” translates into a broad host of issues, including individuals dropping out of the labor force, lower tax revenues and larger budget deficits. The U.S. has experienced a longer than normal expansion cycle, and some believe the U.S. economy is entering the late‐cycle phase of this expansion. Late‐cycle economic phases exhibit characteristics of higher inflation, tighter credit conditions, a tighter labor market, rising inventories and a deceleration of corporate earnings. Although there are elements of these items present today, we may continue down the track of a longer expansion cycle. In other words with no economic boom, the odds are lower for a significant bust! The Presidential Cycle Impact Clients frequently inquire how the presidential election will affect the market. Markets tend to react poorly to uncertainty, and thus prefer political gridlock and the maintenance of the status quo. The dominant theme of this election has been a rejection of the status quo. This results in significant uncertainty and volatility in the markets. In reality, however, a newly elected President tends to have a limited influence on broad market stock returns throughout his/her tenure. Interestingly, this lack of influence does not hold at the micro level. A good example of how policies can affect individual industries is the exceptionally positive market performance exhibited by the health care sector under President Obama and the exceptionally weak performance of
Index as of 3/31/2016 Year to Date 1‐Year 3‐Year 10‐Year
S&P 500 Index (large-cap U.S.) 1.35% 1.78% 11.82% 7.01%
S&P 400 Midcap Index (mid-cap U.S.) 3.78% ‐3.60% 9.46% 7.78%
Russell 2000 Index (small-cap U.S.) ‐1.52% ‐9.76% 6.84% 5.26%
MSCI All World Country Index ex-U.S. ‐0.38% ‐9.19% 0.32% 1.94%
Dow Jones U.S. Real Estate 5.15% 3.00% 8.66% 5.33%
Dow Jones UBS Commodity Index 0.42% ‐19.56% ‐16.87% ‐6.16%
companies associated with the coal industry. As the chart on the previous page notes, equity market returns in election years tend to be weaker in the first half of the year, but strengthen throughout the second half. It’s a Matter of Tactical Perspective Market timing may seem like a brilliant strategy in theory, but proves to be a losing one in practice. Often, investor sentiment becomes overly negative around market bottoms and overly
optimistic near market peaks. However, making tactical changes can create value without succumbing to the difficult practice of market timing. Reviewing the grid to the left, two conclusions are evident from the
associated returns. First, making tactical allocation changes can create value in a portfolio by overweighting certain asset classes and underweighting others. Our equity strategy has been overweight U.S. large‐cap stocks versus U.S. small‐cap stocks and international equities over the last three years, which has proven beneficial for our clients’ returns. Second, the market tends to be volatile in shorter periods, such as a 1‐year timeframe, where losses due to short‐term market timing can occur. It is also important to note that investors focused on the long‐term are rewarded with respectable market gains (note 10‐Year returns). Looking Ahead Typically, a pessimistic viewpoint tends to garner more attention than a positive one. This was the case in the first quarter when dire market predictions surfaced at the market’s bottom on February 11th. It is certainly not prudent to ignore the bearish point of view; however, the equity market continues to climb the proverbial “wall of worry.” The market will face other concerns this year. For example, the United Kingdom may exit the European Union while responses to terrorism and immigration may influence global economic activity. We see signs company prospects may be improving and this could lead to a respectable equity market advance in the second half of the year. Thank you for your continued confidence in HORAN Capital Advisors. Please be sure to visit us at www.horancapitaladvisors.com. Warm regards, HORAN Capital Advisors * HORAN Capital Advisors, LLC is an SEC Registered Investment Advisor.