Embed Size (px)
Citation preview

1Copyright Barbara Mitchell, MA, CSP, Cambria Cty Comm Coll
Spring 2004
Parsing* Peanut Butter
An investigation of data types in the behavioral sciences
*Parse: to analyze something in an orderly way.
featuring
Spring 2004 Copyright Barbara Mitchell, MA, CSP, Cambria Cty Comm Coll
page 2
Knowing About Data Types• Who cares? You do!
• Why?– Knowing the type of data helps you to judge the
validity (value??) of research• And therefore the amount of “trust” you can put in a claim
– Knowing the type of data allows you to choose the type of statistical analysis to conduct
Based on Graziano & Raulin, 2004, Allyn Bacon

Spring 2004 Copyright Barbara Mitchell, MA, CSP, Cambria Cty Comm Coll
page 3
Let’s get started• There are
fundamentally two types of data– Categorical
– Continuous
Measurement (Score data)

Spring 2004 Copyright Barbara Mitchell, MA, CSP, Cambria Cty Comm Coll
page 4
Categorical sorts data into categories or groups
• Nominal – where the order of the items
or objects is arbitrary (unordered)– For example: all colors of cats
• Ordinal– where there is a logical ordering to the items or
objects (ordered or ranked in a meaningful way)– For example: all shades of blue
Spring 2004 Copyright Barbara Mitchell, MA, CSP, Cambria Cty Comm Coll
page 5
Nominal Datum (plural=Data)
• The only property of nominal data is IDENTITY• Nominal Scales are NAMING scales:
– Names of babies– Names of political parties
• Numbers may be assigned but they are meaningless, ex. Blue = 1 and red = 2 does not mean that blue is ½ of red
• Nominal Scales classify or categorize• Nominal data can only be understood in terms of the
frequency of occurrence• Chi Square is the most common statistical test for
nominal data
Spring 2004 Copyright Barbara Mitchell, MA, CSP, Cambria Cty Comm Coll
page 6
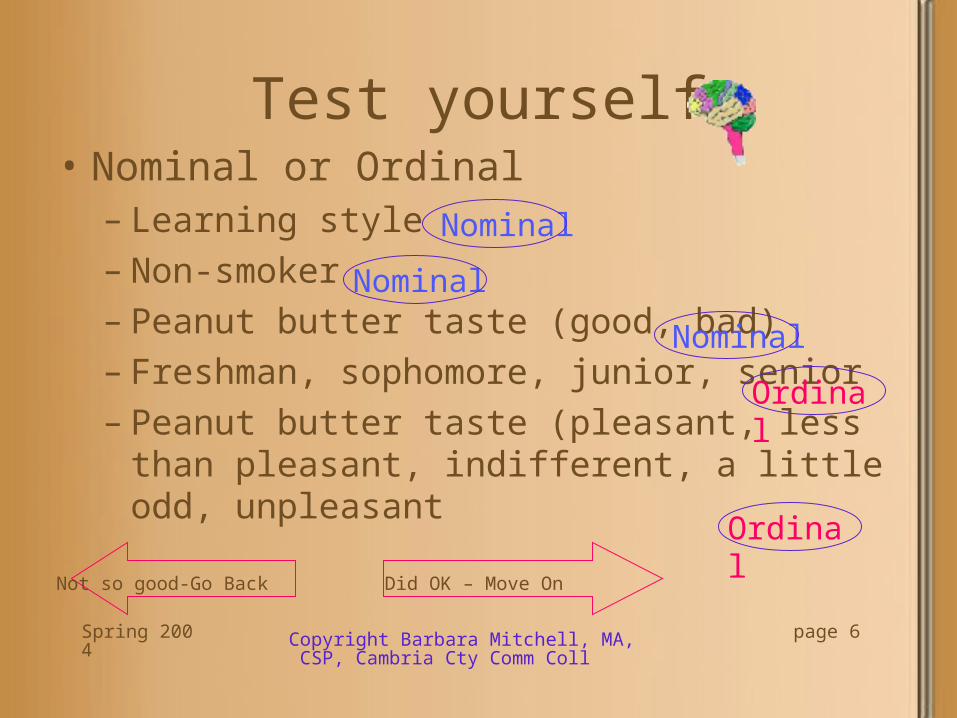
Test yourself• Nominal or Ordinal
– Learning style – Non-smoker– Peanut butter taste (good, bad)– Freshman, sophomore, junior, senior– Peanut butter taste (pleasant, less than
pleasant, indifferent, a little odd, unpleasant
Nominal
Nominal
Nominal
Ordinal
Ordinal
Not so good-Go Back Did OK – Move On
Spring 2004 Copyright Barbara Mitchell, MA, CSP, Cambria Cty Comm Coll
page 7
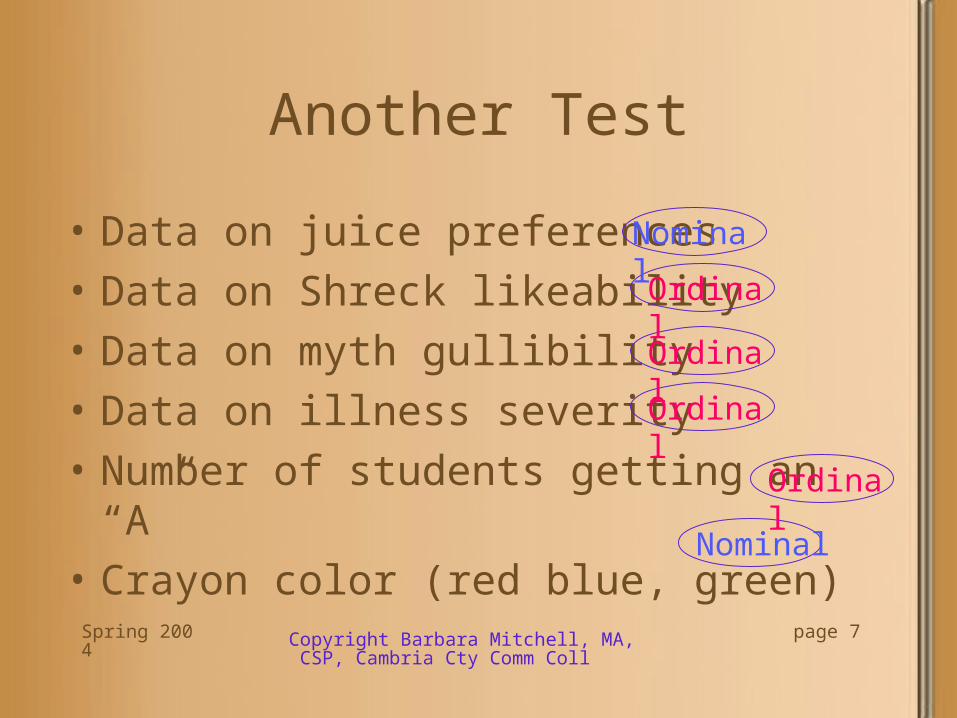
Another Test
• Data on juice preferences
• Data on Shreck likeability
• Data on myth gullibility
• Data on illness severity
• Number of students getting an “A”
• Crayon color (red blue, green)
Ordinal
Ordinal
Ordinal
Ordinal
Nominal
Nominal
Spring 2004 Copyright Barbara Mitchell, MA, CSP, Cambria Cty Comm Coll
page 8
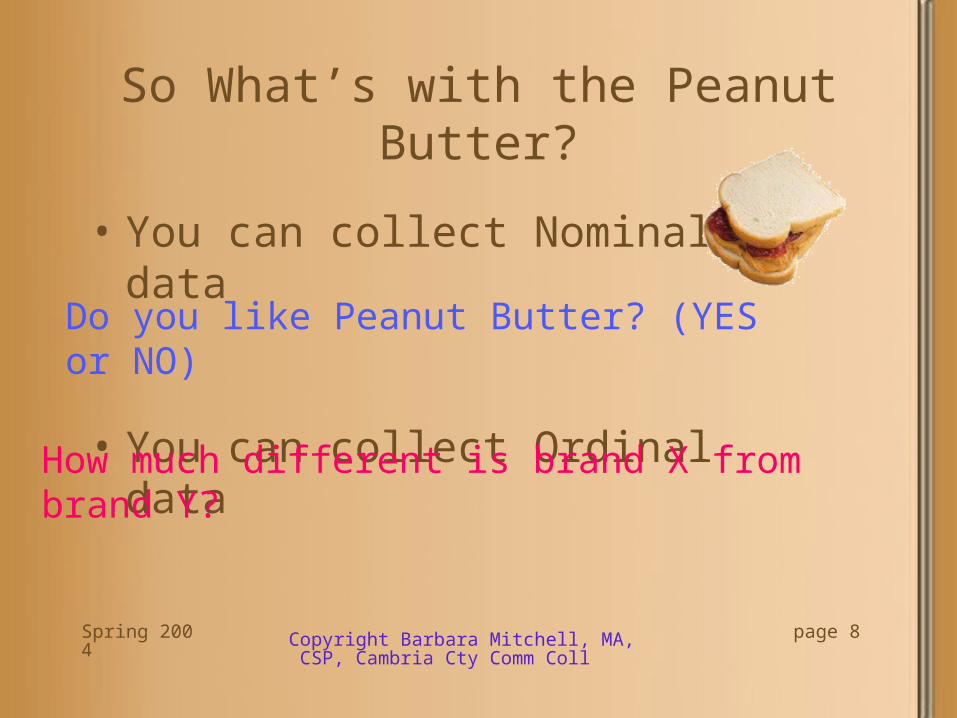
So What’s with the Peanut Butter?
• You can collect Nominal data
• You can collect Ordinal data
Do you like Peanut Butter? (YES or NO)
How much different is brand X from brand Y?

Spring 2004 Copyright Barbara Mitchell, MA, CSP, Cambria Cty Comm Coll
page 9
Nominal Data• IS
– Unordered– Objects cannot be put
in a logical (increasing or decreasing) sequence
– There is no better or worse– Often found in a
YES/NO (more/less) format

Spring 2004 Copyright Barbara Mitchell, MA, CSP, Cambria Cty Comm Coll
page 10
Statistical Evaluation of Nominal Data• Since you cannot mathematically operate on
YES /NO type questions…• And you have the problem that there is no
MAGNITUDE between any two items, by definition, cannot be the same…
• Your analytical choices are– Frequency distributions, percentages– Chi-square(Χ2) goodness of fit, and (Χ2) test for
independence

Spring 2004 Copyright Barbara Mitchell, MA, CSP, Cambria Cty Comm Coll
page 11
Ordinal Data• IS
– In some sort of logical order
– Each relates to the other in some way
– May indicate a preference or value, asks HOW MUCH? But is not ‘measurable’
– Most often seen in a “Likert” scale• “totally agree’ |‘agree’ | ‘no preference’ | ‘disagree’ | ‘totally
disagree’
In 1932, Renis Likert invented a measurement method, called the Likert Scales, used in attitude surveys. They allowed answers that ranged from "strongly disagree" to "strongly agree."
Retrieved 3.14.04 from www.nwlink.com/~donclark/hrd/history/likert.html
Spring 2004 Copyright Barbara Mitchell, MA, CSP, Cambria Cty Comm Coll
page 12
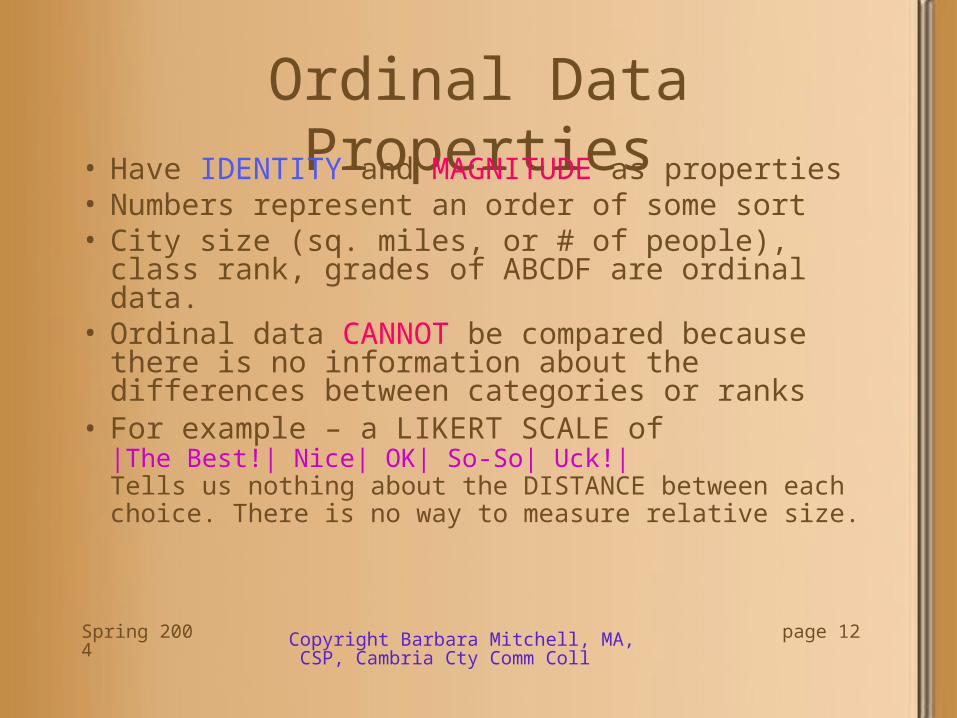
Ordinal Data Properties• Have IDENTITY and MAGNITUDE as properties• Numbers represent an order of some sort• City size (sq. miles, or # of people), class rank,
grades of ABCDF are ordinal data.• Ordinal data CANNOT be compared because
there is no information about the differences between categories or ranks
• For example – a LIKERT SCALE of |The Best!| Nice| OK| So-So| Uck!|Tells us nothing about the DISTANCE between each choice. There is no way to measure relative size.

Spring 2004 Copyright Barbara Mitchell, MA, CSP, Cambria Cty Comm Coll
page 13
Statistical Evaluation of Ordinal Data
• Ordered (ordinal) data indicated that there is a relationship between the elements in the group.
• A Median can be located in an ordinal grouping to measure central tendency,
• A Range or Inter-quartile range can be calculated for variability,
• If describing a relationship in the data, then a Spearman rank-order correlation between the items can be calculated.
Ways to DESCRIBE the data
Spring 2004 Copyright Barbara Mitchell, MA, CSP, Cambria Cty Comm Coll
page 14
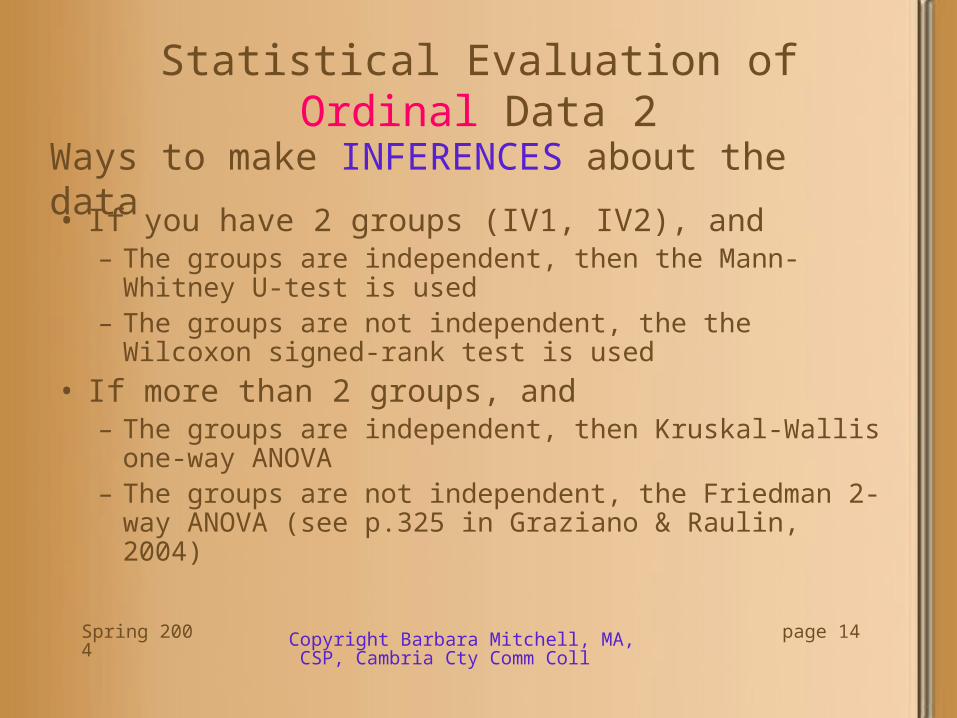
Statistical Evaluation of Ordinal Data 2
• If you have 2 groups (IV1, IV2), and – The groups are independent, then the Mann-Whitney U-
test is used– The groups are not independent, the the Wilcoxon
signed-rank test is used
• If more than 2 groups, and– The groups are independent, then Kruskal-Wallis one-
way ANOVA– The groups are not independent, the Friedman 2-way
ANOVA (see p.325 in Graziano & Raulin, 2004)
Ways to make INFERENCES about the data
Spring 2004 Copyright Barbara Mitchell, MA, CSP, Cambria Cty Comm Coll
page 15
Quiz Time
• Take the Quiz on Course Compass (Categorical Quiz)
If you did well, link to Part 2
If you need to see this section again

Spring 2004 Copyright Barbara Mitchell, MA, CSP, Cambria Cty Comm Coll
page 16
Part 2a – Score Data (continuous) • Interval and Ratio data is continuous
with equal intervals between points…….– Have equal intervals between each measure,– That is, the distance (depth, temperature, amount)
from one point to the next (say point 1 to point 2) is the same as the interval between any other two consecutive points (so it would be the same from point 30 to point 31)
– All interval and ratio data can be operated on mathematically (add, subtract, multiply, divide, square root)*
• Ratio data has a meaningful ZERO pointOur book states that you can only add and subtract with interval data, however, others argue that you can conduct all five operations on interval data. Ratios can only be calculated on ratio data
Spring 2004 Copyright Barbara Mitchell, MA, CSP, Cambria Cty Comm Coll
page 17
Part 2b – Interval Data Properties• Interval data have the properties if IDENTITY,
MAGNITUDE, and EQUAL INTERVALS between values on the scale- They ask HOW MUCH?
• Interval:– Fahrenheit & Centigrade (Zero is a reference
point)– Calendar Years– I.Q.– Family Income
• Note about I.Q. type tests: We CAN say that a score of 120 points is 60 points higher than a score of 60 points. But we CANNOT say that the one person is twice a smart as the other because there is NO TRUE ZERO
Spring 2004 Copyright Barbara Mitchell, MA, CSP, Cambria Cty Comm Coll
page 18
Interval Statistical Properties
• Interval data cane be ADDED and SUBTRACTED.
• The Students t-test and the
• Analysis of Variance (ANOVA) are statistical tests that respect the limits if INTERVAL data

Spring 2004 Copyright Barbara Mitchell, MA, CSP, Cambria Cty Comm Coll
page 19
Part 2c – Ratio Data Properties
• Ratio data has the properties of IDENTITY, MAGNITUDE, EQUAL INTERVAL, and a TRUE ZERO.
• Ratio– Kelvin (absolute Zero)– Years of Experience– Length– Age– Reaction times
Spring 2004 Copyright Barbara Mitchell, MA, CSP, Cambria Cty Comm Coll
page 20
Ratio Statistical Tests
• The Students t-test and the
• Analysis of Variance (ANOVA) are statistical tests
• Product moment correlational tests, many others.
• Ratio/proportional data

Spring 2004 Copyright Barbara Mitchell, MA, CSP, Cambria Cty Comm Coll
page 21
Test yourself• Interval or Ratio Data
– Response time to a customer – Smoking Reduction Program– Score on the SAT– Effects of medication training program– Improving speed of response
Interval
Interval
Ratio
Interval
Interval
Not so good-Go Back Did OK – Move On

Spring 2004 Copyright Barbara Mitchell, MA, CSP, Cambria Cty Comm Coll
page 22
Another Test
• Sugar concentration in Peanut Butter• Variation of Volume on Shrek Movie and
viewer complaints• Fat content of Peanut Butter & salivation• Data on childhood temperature ranges• SAT score of 560• Crayon quality as a % of wax
Ratio
Ratio
Interval
Interval
Ratio
Ratio
Spring 2004 Copyright Barbara Mitchell, MA, CSP, Cambria Cty Comm Coll
page 23
More about Peanut Butter?• Interval Scale:
– Measuring sugar concentration in the mouth following eating of several different brands of peanut butter
• Ratio Scale– Measuring fat concentrations of peanut
butter relative to the amount of liquid drunk following the ingestion of 2 tablespoons of peanut butter.

Spring 2004 Copyright Barbara Mitchell, MA, CSP, Cambria Cty Comm Coll
page 24
Statistical Tests for Interval and Ratio Data• Descriptive:
– Mean– Median– Mode
• Variability– Variance– Standard Deviation
• Related Groups: – Pearson product-moment
correlation
•Inferential:–T-test–ANOVA
See pp. 323 & 324 in Graziano & Raulin, 2004

Spring 2004 Copyright Barbara Mitchell, MA, CSP, Cambria Cty Comm Coll
page 25
Quiz Time
• Take the Quiz on Course Compass (Score Quiz)
If you did well, link
If you need to see Section 2 again

Spring 2004 Copyright Barbara Mitchell, MA, CSP, Cambria Cty Comm Coll
page 26
PaRtY!
• By, George, I think you’ve gOt iT!