Embed Size (px)
Citation preview
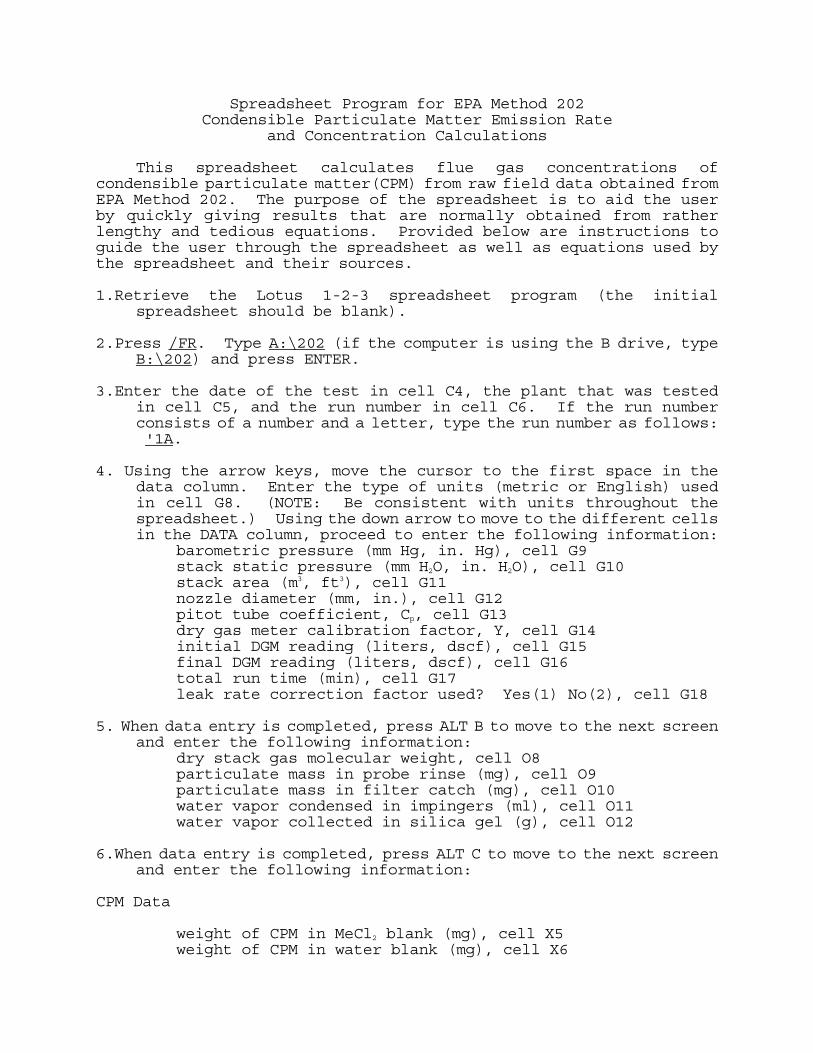
Spreadsheet Program for EPA Method 202 Condensible Particulate Matter Emission Rate and Concentration Calculations This spreadsheet calculates flue gas concentrations of condensible particulate matter(CPM) from raw field data obtained from EPA Method 202. The purpose of the spreadsheet is to aid the user by quickly giving results that are normally obtained from rather lengthy and tedious equations. Provided below are instructions to guide the user through the spreadsheet as well as equations used by the spreadsheet and their sources. 1.Retrieve the Lotus 1-2-3 spreadsheet program (the initial
spreadsheet should be blank). 2.Press /FR. Type A:\202 (if the computer is using the B drive, type
B:\202) and press ENTER. 3.Enter the date of the test in cell C4, the plant that was tested
in cell C5, and the run number in cell C6. If the run number consists of a number and a letter, type the run number as follows: '1A.
4. Using the arrow keys, move the cursor to the first space in the
data column. Enter the type of units (metric or English) used in cell G8. (NOTE: Be consistent with units throughout the spreadsheet.) Using the down arrow to move to the different cells in the DATA column, proceed to enter the following information:
barometric pressure (mm Hg, in. Hg), cell G9 stack static pressure (mm H2O, in. H2O), cell G10 stack area (m3, ft3), cell G11 nozzle diameter (mm, in.), cell G12 pitot tube coefficient, Cp, cell G13 dry gas meter calibration factor, Y, cell G14 initial DGM reading (liters, dscf), cell G15 final DGM reading (liters, dscf), cell G16 total run time (min), cell G17 leak rate correction factor used? Yes(1) No(2), cell G18 5. When data entry is completed, press ALT B to move to the next screen
and enter the following information: dry stack gas molecular weight, cell O8 particulate mass in probe rinse (mg), cell O9 particulate mass in filter catch (mg), cell O10 water vapor condensed in impingers (ml), cell O11 water vapor collected in silica gel (g), cell O12 6.When data entry is completed, press ALT C to move to the next screen
and enter the following information: CPM Data weight of CPM in MeCl2 blank (mg), cell X5 weight of CPM in water blank (mg), cell X6
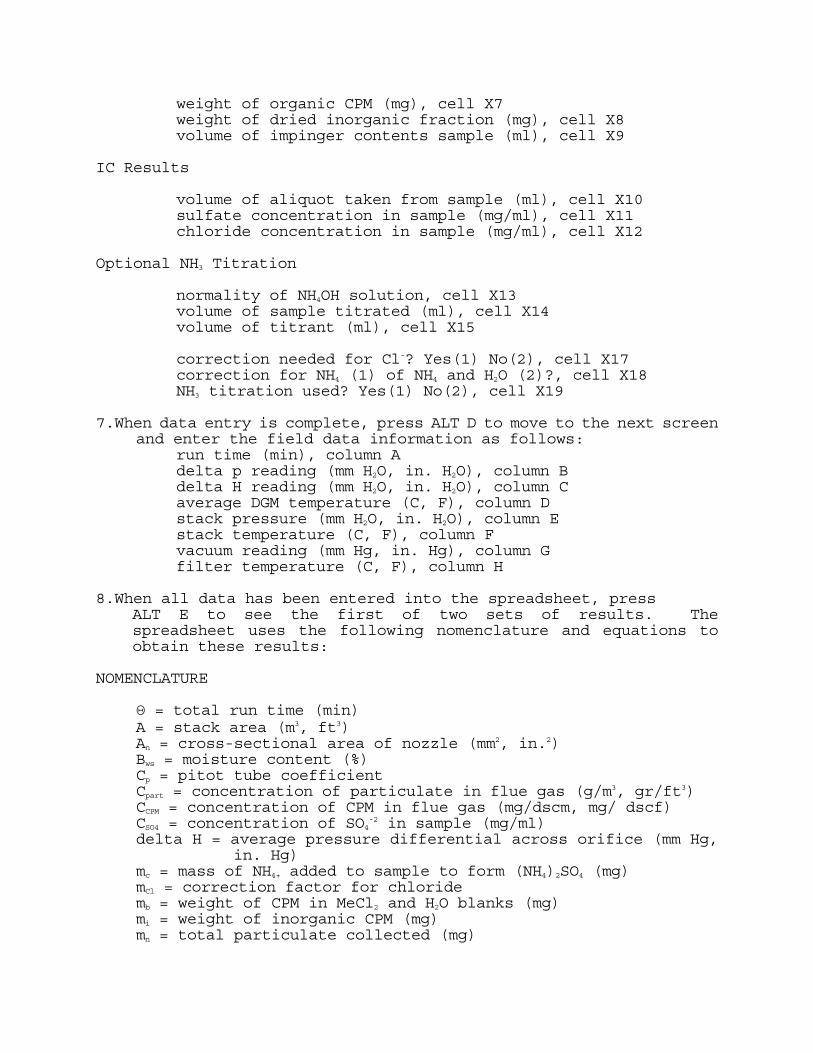
weight of organic CPM (mg), cell X7 weight of dried inorganic fraction (mg), cell X8 volume of impinger contents sample (ml), cell X9 IC Results volume of aliquot taken from sample (ml), cell X10 sulfate concentration in sample (mg/ml), cell X11 chloride concentration in sample (mg/ml), cell X12 Optional NH3 Titration normality of NH4OH solution, cell X13 volume of sample titrated (ml), cell X14 volume of titrant (ml), cell X15 correction needed for Cl-? Yes(1) No(2), cell X17 correction for NH4 (1) of NH4 and H2O (2)?, cell X18 NH3 titration used? Yes(1) No(2), cell X19 7.When data entry is complete, press ALT D to move to the next screen
and enter the field data information as follows: run time (min), column A delta p reading (mm H2O, in. H2O), column B delta H reading (mm H2O, in. H2O), column C average DGM temperature (C, F), column D stack pressure (mm H2O, in. H2O), column E stack temperature (C, F), column F vacuum reading (mm Hg, in. Hg), column G filter temperature (C, F), column H 8.When all data has been entered into the spreadsheet, press ALT E to see the first of two sets of results. The spreadsheet uses the following nomenclature and equations to obtain these results: NOMENCLATURE Θ = total run time (min) A = stack area (m3, ft3) An = cross-sectional area of nozzle (mm2, in.2) Bws = moisture content (%) Cp = pitot tube coefficient Cpart = concentration of particulate in flue gas (g/m3, gr/ft3) CCPM = concentration of CPM in flue gas (mg/dscm, mg/ dscf) CSO4 = concentration of SO4
-2 in sample (mg/ml) delta H = average pressure differential across orifice (mm Hg, in. Hg) mc = mass of NH4+ added to sample to form (NH4)2SO4 (mg) mCl = correction factor for chloride mb = weight of CPM in MeCl2 and H2O blanks (mg) mi = weight of inorganic CPM (mg) mn = total particulate collected (mg)
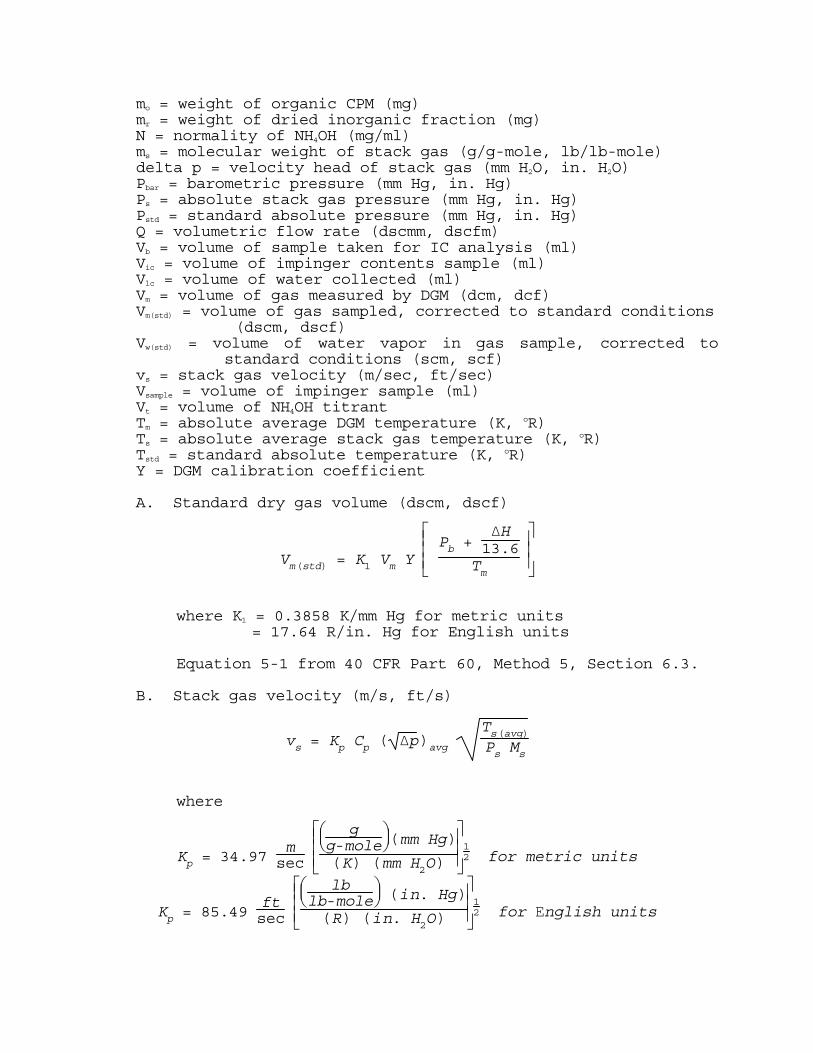
mo = weight of organic CPM (mg) mr = weight of dried inorganic fraction (mg) N = normality of NH4OH (mg/ml) ms = molecular weight of stack gas (g/g-mole, lb/lb-mole) delta p = velocity head of stack gas (mm H2O, in. H2O) Pbar = barometric pressure (mm Hg, in. Hg) Ps = absolute stack gas pressure (mm Hg, in. Hg) Pstd = standard absolute pressure (mm Hg, in. Hg) Q = volumetric flow rate (dscmm, dscfm) Vb = volume of sample taken for IC analysis (ml) Vic = volume of impinger contents sample (ml) Vlc = volume of water collected (ml) Vm = volume of gas measured by DGM (dcm, dcf) Vm(std) = volume of gas sampled, corrected to standard conditions (dscm, dscf) Vw(std) = volume of water vapor in gas sample, corrected to standard conditions (scm, scf) vs = stack gas velocity (m/sec, ft/sec) Vsample = volume of impinger sample (ml) Vt = volume of NH4OH titrant Tm = absolute average DGM temperature (K, oR) Ts = absolute average stack gas temperature (K, oR) Tstd = standard absolute temperature (K, oR) Y = DGM calibration coefficient A. Standard dry gas volume (dscm, dscf)
where K1 = 0.3858 K/mm Hg for metric units = 17.64 R/in. Hg for English units Equation 5-1 from 40 CFR Part 60, Method 5, Section 6.3. B. Stack gas velocity (m/s, ft/s)
where
Vm(std) = K1 Vm Y
Pb +
ΔH13.6
Tm
vs = Kp Cp ( Δp)avg Ts(avg)Ps Ms
Kp = 34.97 msec
g
g-mole (mm Hg)
(K) (mm H2O)12 for metric units
Kp = 85.49 ftsec
lb
lb-mole (in. Hg)
(R) (in. H2O)12 for Εnglish units
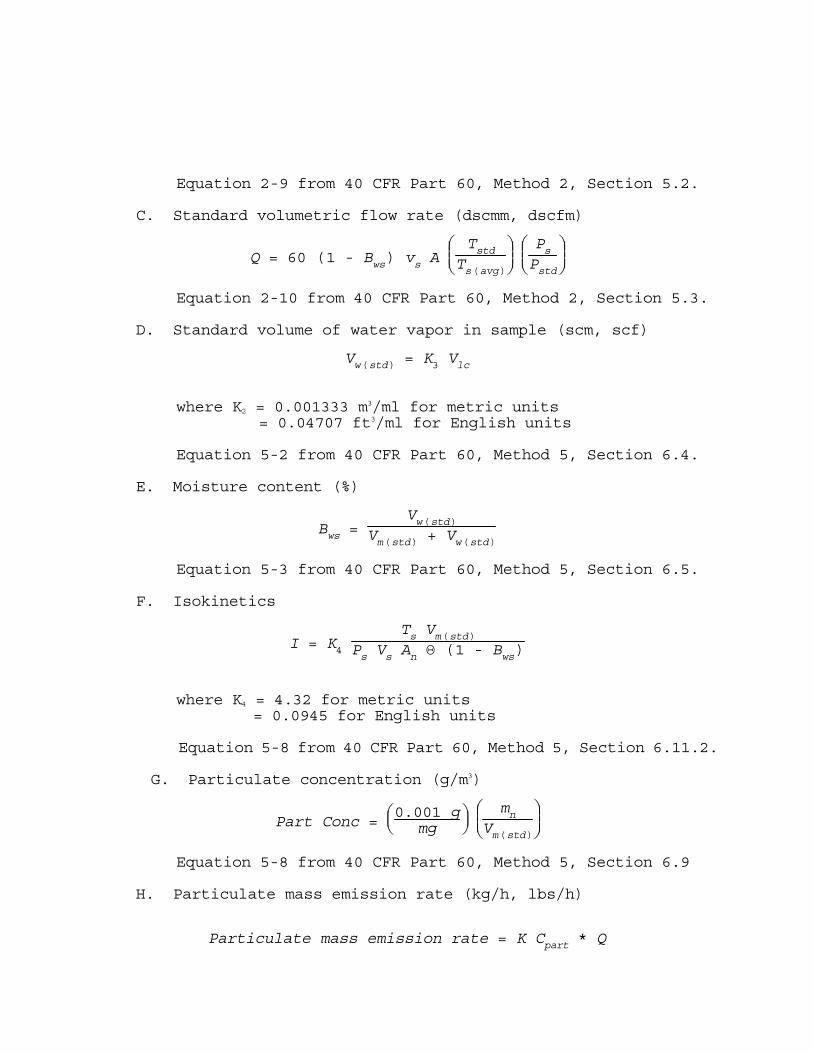
Equation 2-9 from 40 CFR Part 60, Method 2, Section 5.2. C. Standard volumetric flow rate (dscmm, dscfm)
Equation 2-10 from 40 CFR Part 60, Method 2, Section 5.3. D. Standard volume of water vapor in sample (scm, scf)
where K2 = 0.001333 m3/ml for metric units = 0.04707 ft3/ml for English units Equation 5-2 from 40 CFR Part 60, Method 5, Section 6.4. E. Moisture content (%)
Equation 5-3 from 40 CFR Part 60, Method 5, Section 6.5. F. Isokinetics
where K4 = 4.32 for metric units = 0.0945 for English units Equation 5-8 from 40 CFR Part 60, Method 5, Section 6.11.2. G. Particulate concentration (g/m3)
Equation 5-8 from 40 CFR Part 60, Method 5, Section 6.9 H. Particulate mass emission rate (kg/h, lbs/h)
Q = 60 (1 - Bws) vs A
Tstd
Ts(avg)
Ps
Pstd
Vw(std) = K3 Vlc
Bws = Vw(std)
Vm(std) + Vw(std)
I = K4 Ts Vm(std)
Ps Vs An Θ (1 - Bws)
Part Conc =
0.001 g
mg
mn
Vm(std)
Particulate mass emission rate = K Cpart * Q
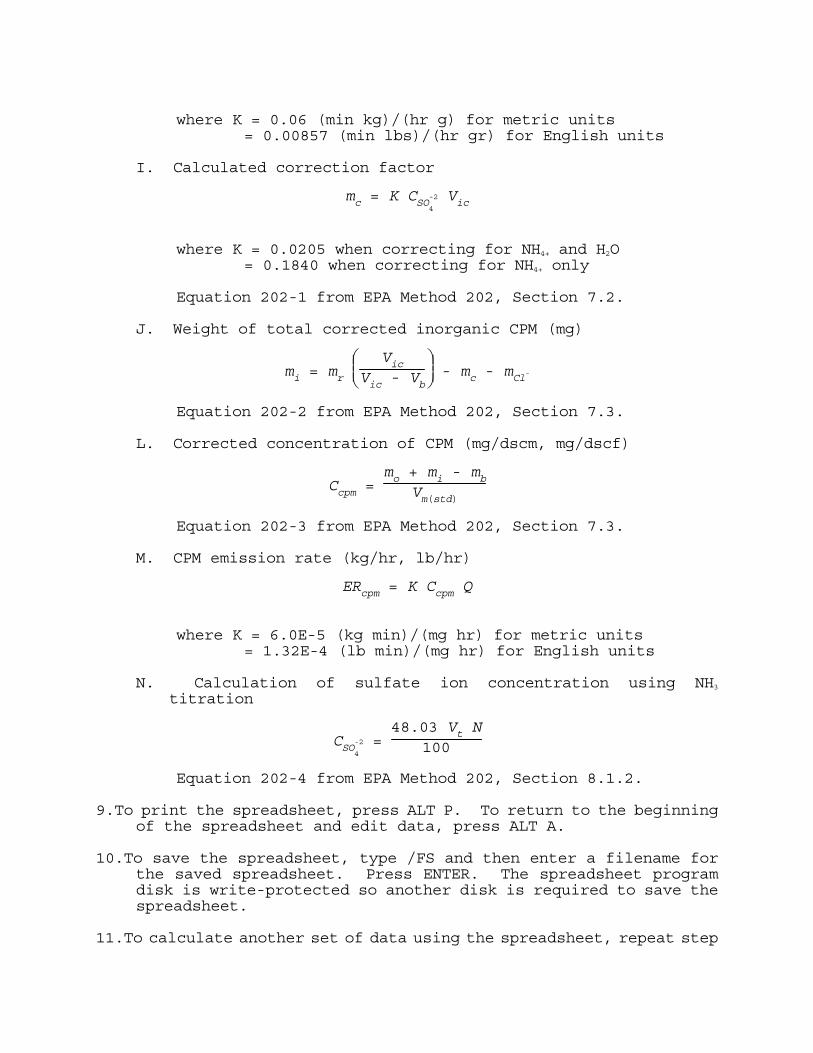
where K = 0.06 (min kg)/(hr g) for metric units = 0.00857 (min lbs)/(hr gr) for English units I. Calculated correction factor
where K = 0.0205 when correcting for NH4+ and H2O = 0.1840 when correcting for NH4+ only Equation 202-1 from EPA Method 202, Section 7.2. J. Weight of total corrected inorganic CPM (mg)
Equation 202-2 from EPA Method 202, Section 7.3. L. Corrected concentration of CPM (mg/dscm, mg/dscf)
Equation 202-3 from EPA Method 202, Section 7.3. M. CPM emission rate (kg/hr, lb/hr)
where K = 6.0E-5 (kg min)/(mg hr) for metric units = 1.32E-4 (lb min)/(mg hr) for English units N. Calculation of sulfate ion concentration using NH3 titration
Equation 202-4 from EPA Method 202, Section 8.1.2. 9.To print the spreadsheet, press ALT P. To return to the beginning
of the spreadsheet and edit data, press ALT A. 10.To save the spreadsheet, type /FS and then enter a filename for
the saved spreadsheet. Press ENTER. The spreadsheet program disk is write-protected so another disk is required to save the spreadsheet.
11.To calculate another set of data using the spreadsheet, repeat step
mc = K CSO-24
Vic
mi = mr
Vic
Vic - Vb - mc - mCl-
Ccpm = mo + mi - mb
Vm(std)
ERcpm = K Ccpm Q
CSO-24
= 48.03 Vt N
100

2 and proceed with entering the necessary data. 12. To quit Lotus, press /QYE.