Embed Size (px)
Citation preview
1
Market Update March 2012
SPP’s Middle Market Leverage Cash Flow Market At A Glance
Deal Component March ‘12 February ‘12 January ‘11
CF Senior Debt (x EBITDA): <$10MM EBITDA 1.50-2.25x
>$15MM EBITDA 2.50-3.50x >$25MM EBITDA 2.75-4.00x
<$10MM EBITDA 1.50-2.25x >$15MM EBITDA 2.50-3.50x >$25MM EBITDA 2.75-4.00x
<$10MM EBITDA 1.50-2.00x >$15MM EBITDA 2.00-3.25x >$25MM EBITDA 2.50-3.50x
Total Debt Limit
(x EBITDA): <$10MM EBITDA 3.00-4.00x >$15MM EBITDA 3.50-4.75x >$25MM EBITDA 4.00-5.00x
<$10MM EBITDA 3.00-4.00x >$15MM EBITDA 3.50-4.75x >$25MM EBITDA 4.00-5.00x
<$10MM EBITDA 3.00-3.75x >$15MM EBITDA 3.50-4.50x >$25MM EBITDA 3.50-4.50x
Senior CASH Flow Pricing: L+3.00%-4.50% (bank)
L+4.50%-6.00% (non-bank) L+3.50%-4.50% (bank) L+4.50%-6.00% (non-bank)
L+3.50%-5.50% (bank) L+5.50%-7.00% (non-bank)
Second Lien Pricing (Avg): L+7.5%-9%, (with 1% floor) L+8%-10%, (with 1% floor) L+9%-11%, (with 1%-2% floor)
Subordinated Debt Pricing: <$10MM EBITDA 14%-17%
>$15MM EBITDA 13%-15% >$25MM EBITDA 11%-14%
<$10MM EBITDA 14%-17% >$15MM EBITDA 13%-15% >$25MM EBITDA 12%-14%
14%-18% >$50MM EBITDA 13%-15%
“One Stop” Pricing: 10.0 %-11.5% Fixed
L+8-9% Floating (1% Floor) 8.5%-11.5% Fixed L+8-9% Floating (1% Floor)
10%-13% (1%-1.5% Floor)
Warrants Feature: Coupon only deals the norm in the
market absent compelling circumstances (>4.5X leverage, sub $7.5 MM EBITDA, challenged/distress credits
Coupon only deals the norm in the market absent compelling circumstances (>4.5X leverage, sub $7.5 MM EBITDA, challenged/distress credits
Requested, not Required Equity Appreciation Rights alternative where required.
LIBOR Floors: 0%-1% for most Bank Club Deals;
1.00%-1.75% Libor Floor for syndicated or non-bank deals in most cases.
0%-1% for most Bank Club Deals; 1.00%-1.75% Libor Floor for syndicated or non-bank deals in most cases.
1.00%-2.00% Libor floor
Mezzanine Opt. Pre-Payment
(first 3 years): Highly negotiated; most mezzanine lenders seeking increased call protection on coupon only deals (i.e. non-call 1-2 years, with declining prepayment penalties 103, 102, 101, par). Significantly more latitude in warrant deals. (SBIC 5,4,3,2,1). As coupon only deals dominate, pre-payment premiums scrutinized
Highly negotiated; most mezzanine lenders seeking increased call protection on coupon only deals (i.e. non-call 1-2 years, with declining coupon 103, 102, 101, par). Significantly more latitude in warrant deals. (SBIC 5,4,3,2,1). As coupon only deals dominate, pre-payment premiums scrutinized
2nd Lien: 102,101 Par Sub: No-Call year one, 103, 102, par
Minimum Equity Contribution: 25%-35% 25%-35% 30%-40%
Recap Liquidity: Plentiful; Market making little
distinction on use of proceeds if underlying asset is performing well. Stricter provisions in non-sponsored deals.
Plentiful; Market making little distinction on use of proceeds if underlying asset is performing well. Stricter provisions in non-sponsored deals.
Exceedingly Liquid - Preference for Sponsors, sensitivity to
dividends in excess of initial investment, recent trends;
- Generally less Leverage.
"Story" Receptivity: Until activity picks up and investors’ time becomes more precious, this is still a forgiving market; pricing may be at a premium but there is still a willingness to look at challenged credits or sectors.
Financing markets remain exceedingly liquid and open to “storied” credits and deals with a little “hair”. Credit Opportunity funds awash in cash willing to dig deep but expect more mezzanine like returns for senior debt.
Readily Available
“Tone” of Market: Biggest development is the return of
commercial banks to the cash flow market, and with them no Libor Floors and better pricing (range L+3.0%-4.5%). Lack of product combined with increased competition forcing traditional sub players into increasingly smaller companies (sub $5MM EBITDA).
Market still characterized by excess liquidity where investor interest exceeds transaction flow. Lots of talk of the February “deluge” of new M&A opportunities that have hit sponsors desks that will morph into financing opportunities in March. Expectation for increasing volume through Q1 as M&A pipeline builds.
Market characterized by excess liquidity and lack of new deals across all asset classes. New allocations combined with scant deal flow combining to create unprecedented leverage opportunities. Pricing remains consistent with Q4 2010 levels.
Mezzanine Investors: Participation across most sectors:
Traditional LPs, SBICs, Non-Bank-Finance Company Alternative Asset Groups; Credit Opportunity Funds, Cross-Over Sponsor, Hedge Funds, BDCs
Participation across most sectors: Traditional LPs, SBICs, Non-Bank-Finance Company Alternative Asset Groups; Credit Opportunity Funds, Cross-Over Sponsor, Hedge Funds, BDCs
Full Participation across all sectors: Traditional LPs, SBICs, Non-Bank- Finance Company Alternative Asset Groups; Cross-Over Sponsor, Hedge Funds, BDCs, CLOs.
Changes from previous month in red
2
“Welcome back, Welcome back, welcome back Welcome back, welcome back, Welcome back, We always could spot a friend Welcome back, And I smile when I think How you must have been And I know what a scene You were learning in Was there something that Made you come back again”
“Welcome Back", John Sebastian “Welcome Back” The banks are back. After almost three years of a cash flow lending market dominated by non-bank commercial lenders, one-stops and credit opportunity funds, the commercial banks are back in the business of providing cash flow deals (“enterprise loans”). With more competitive commercial banking institutions in the mix, issuers are the beneficiaries of more competitive pricing, often without the requirement of a Libor floor. And, not insignificantly, bank term loans are generally prepayable at par, at anytime. As has always been the case, on the down side, these banks tend to be more covenant intensive (SD/EBITDA, TD/EBITDA, Fixed Charge Coverage, and, often, Min. EBITDA) and require more aggressive amortization than their non-bank counterparts (customarily equal annual amortization based on a seven to ten year maturity). Additionally, for the present time, most of the new wave of bank cash flow lending is focused on issuers with EBITDA levels in excess of $15 million. Those companies with less than $10 million EBITDA are still in large part relegated to the non-bank commercial lending market or combining the senior and subordinated elements for a one-stop or uni-tranche provided by a Business Development Company (“BDC”) or Credit Opportunity Fund. The non-bank lending constituency may be more expensive than their commercial banking counterpart, but often this lending sector will provide greater latitude on amortization (1%-5% per annum with a 50% excess cash flow sweep) and less restrictive covenant structure. It should be noted, however, that as a result of the proliferation of new funds in the “one–stop/uni-tranche” space, and heightened competition for assets, more often than not the blended cost of capital for a combined facility is equal to or more competitive than a traditional bifurcated structure comprised of senior bank debt and subordinated notes. SPP’s anecdotal experience confirms this trend; recently the firm hosted a road show for an acquisition financing in the oil and gas services sector, an industry generally shunned by the traditional commercial bank lending community (especially in the absence of any sufficient collateral to secure the financing). A year ago, the road show would be comprised of a handful of participants almost exclusively from the non-bank commercial lending community (BDCs, Hedge Funds, Alternative Asset and Credit Opportunity Funds); this year, eighteen (yes, 18) different commercial banks attended the road show—each with the capacity to provide the entire senior debt component. As liquidity continues to outpace deal flow, we are witnessing a private-capital-markets version of natural selection in the leveraged lending
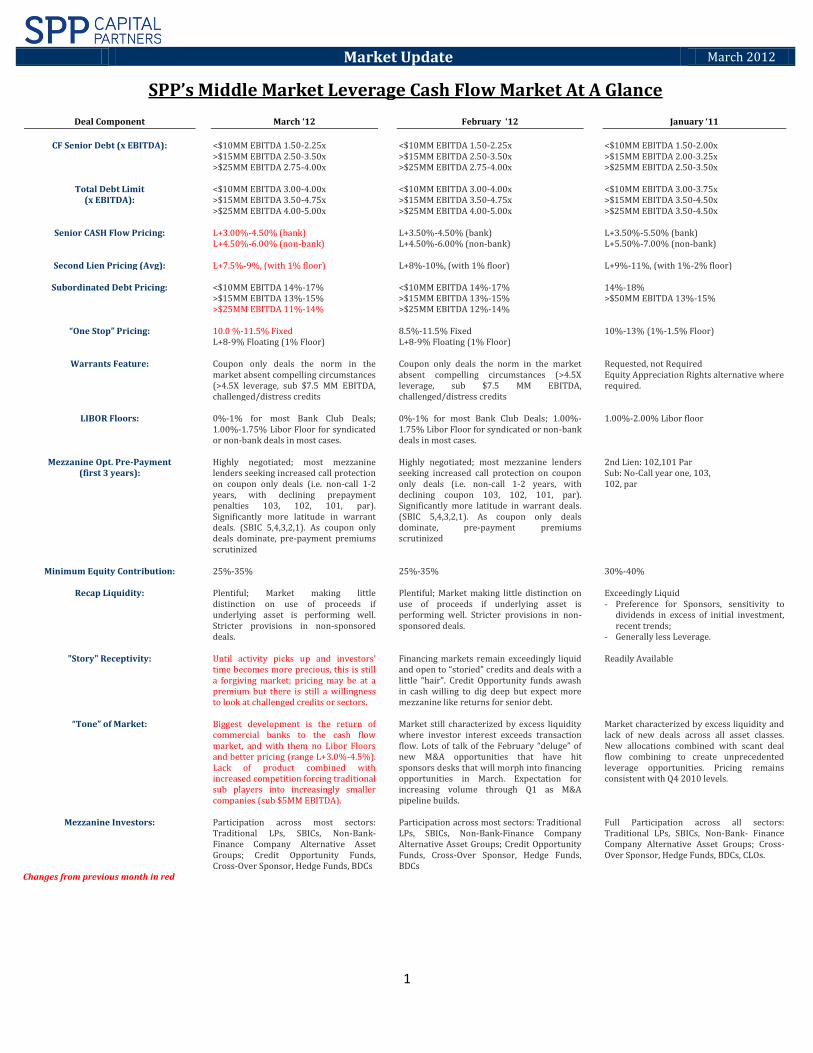
North American High Yield Spreads
Source: CDX Index
Loan Availability Compared to Three Months Ago
Source: National Federation of Independent Business “Small Business Economic Trends – Monthly Report”
Net Loan Availability Percent (“Easier” Minus “Harder”)
Source: National Federation of Independent Business “Small Business Economic Trends – Monthly Report”
New Issue Loan Volume – by Year
Source: Standard & Poors
220.2
255.9243.4
184.7
138.7 139.4165.6
265.2
295.4
480.1
535.2
156.9
76.6
233.6
374.0
129.6
85.7
$0B
$200B
$400B
$600B
1997
1998
1999
2000
2001
2002
2003
2004
2005
2006
2007
2008
2009
2010
2011
1/1
- 3/1
5/11
1/1
- 3/1
5/12
Institutional Pro Rata
3
community:
Lower cost commercial banks seize the most competitive senior debt assets (L+2.50%-4%);
Non-bank commercial lenders morph to one-stop/uni-tranche structures or quasi-mezzanine structures to maintain yield
‒ i.e. last out notes, senior unsecured notes, second lien notes (L+5%-8%);
BDC’s and Credit Opportunity Funds that normally provide one-stops/uni-tranche facilities go down-market for lower middle market assets (L+9%-10%), or compete for the most competitive subordinated assets (11%-14%); and
Traditional mezzanine lenders (SBICs, Traditional Mezzanine LPS) are relegated to the riskiest mezzanine assets (“storied” credits, distressed, or the lower middle market ($3 million to $7 million of EBITDA) in an effort to maintain yield (14%-18%)).
Middle Market Source Overview Senior Asset Based Market:
Most lenders report positive fixed charge coverage (> 1.0x) required to qualify for funding, regardless of collateral coverage or quality of collateral;
Fewer refinancing and light new issuance through February; Lenders comfortable with a modest (approx. 15%) airball for
traditional asset based structures; Middle market pricing among the most competitive, and most
active; Market remains competitive and characterized by increasing
flexibility, including the usage of fixed assets in borrowing base; Pricing L+1.50%-2.25% for most “clean” deals (larger $150 million
deals toward outer band) o L+2.50%-3.00% for more “storied” credits o No Libor floors;
Undrawn pricing ranging from 25-50 bps inversely related to usage of facility;
Four to five year maturities; and Closing fees in the 25-50 bps range.
Senior Cash Flow Market:
Banks back in the cash flow market; Pricing levels beginning to compress marginally:
o Best pricing at L+2.5%; most deals range from L-3.0%-4.5% o True “Club” deals remain most competitive senior capital
available o Banks generally seeking funded assets o Libor floors absent for better club deals, 1.0%-1.5% for
“challenged” credits and larger syndicated facilities o Five year tenors most common o “Accordion” provisions limited to 40% of initial principal
amount; Lower middle market gaining momentum for competitive cash flow
loans: o Lenders wary to go above 1.5x-2.0x LTM EBITDA for credits
with less than $10 million in EBITDA o Less than $5.0 million EBITDA deals generally limited to
“one stop” structures
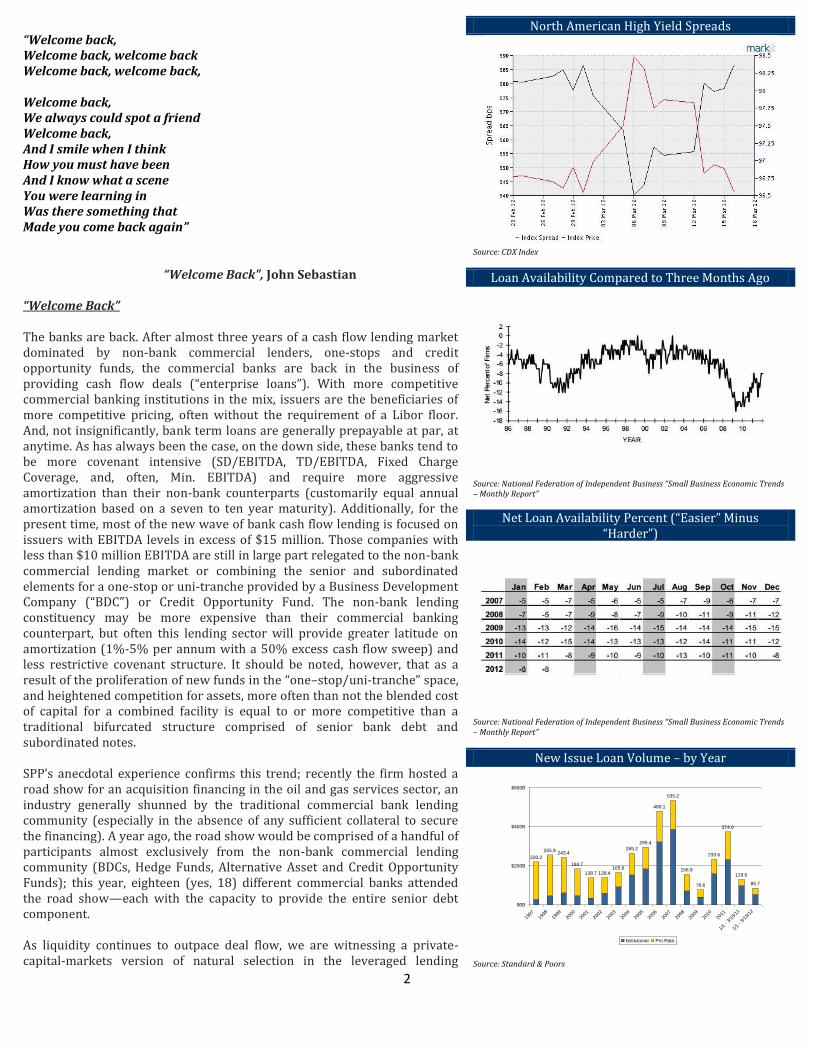
Leveraged Finance Volume – By Year
Source: Standard & Poors
Leveraged Finance Volume – By Month
Source: Standard & Poors
New-Issue Loan Value
Source: Standard & Poors
New Issue First Lien Spreads
Source: Standard & Poors
350.9
410.4
351.3
239.5
307.4
398.0 389.2
624.1
679.0
242.2
172.1201.5
222.2 221.7
592.3
522.4
192.9
$0B
$250B
$500B
$750B
$1000B
1997
1998
1999
2000
2001
2002
2003
2004
2005
2006
2007
2008
2009
2010
2011
1/1
- 3/1
5/11
1/1
- 3/1
5/12
Pro Rata Institutional High-Yield
29.1
60.056.5
31.4
24.528.8
40.9
65.161.1
43.2
68.364.5
82.2
52.4
44.3
4.8
29.129.0
46.6
22.0
51.4
72.1
48.6
89.4
27.0
53.0
61.5
$0B
$25B
$50B
$75B
$100B
Jan-
10
Feb-1
0
Mar
-10
Apr
-10
May
-10
Jun-
10
Jul-1
0
Aug
-10
Sep
-10
Oct
-10
Nov
-10
Dec
-10
Jan-
11
Feb-1
1
Mar
-11
Apr
-11
May
-11
Jun-
11
Jul-1
1
Aug
-11
Sep
-11
Oct
-11
Nov
-11
Dec
-11
Jan-
12
Feb-1
2
3/1
- 3/1
5/12
Pro Rata Institutional High-Yield
L+100
L+200
L+300
L+400
L+500
L+600
L+700
Mar
-00
Mar
-01
Mar
-02
Mar
-03
Mar
-04
Mar
-05
Mar
-06
Mar
-07
Mar
-08
Mar
-09
Mar
-10
Mar
-11
ME 3
/15/
12
Pro Rata Institutional
4
Looking for “blended” (combined senior and sub) pricing of 10%-12%
o Recap liquidity still available for both sponsored and non-sponsored deals;
Term facilities being priced at a 25-50 bps premium to revolving credit facilities;
Amortization structures: o Commercial banks
Seven to 10 year straight line amortization with balloon in year five
Generally want to see minimum of 25%-30% amortized in first three years, will look at slightly back-loaded structures
o Non-bank commercial lenders 1%-5% per annum with a 50% excess cash flow
sweep; and Pricing grids:
o Commercial bank lenders Pricing: L+3.00%-4.50% for leveraged middle
market deals Higher quality, less leveraged deals as low
as 2.50% Upfront fees: 0.375%-0.563% 25-38 bps unused—generally higher where there
are more unused proceeds Par call
o Non-bank commercial lenders Pricing
L+4.50%-6.00% for < 2.5x SD/EBITDA L+5.00%-6.00% for > 2.5x SD/EBITDA
Fees: 0.75%-2.00% upfront, 75 bps unused Non-call year one, 1% in year 2, par call in year 3.
Mezzanine Market:
Characterized by excess liquidity, intense competition for assets and continuing pricing compression;
Surplus of BDCs, credit opportunity and alternative asset funds creating more pressure on traditional subordinated debt lenders;
Additional mezzanine alternatives increasingly available—last-out notes, senior unsecured notes, second lien notes;
Subordinated pricing schemes: o <$10MM EBITDA 14%-17% o >$15MM EBITDA 13%-15% o >$20MM EBITDA 11%-14%;
“Coupon Only”: Warrants rarely required; limited to leveraged recaps where more than initial equity investment returned, lack of equity sponsor, smaller issuers, “storied credits”, or “nose-bleed” leverage (in excess of 4.5x)
o Investors “asking” for second lien positions (often “silent”) o Leverage tolerances:
<$10MM EBITDA 3.00x-4.00x <$15MM EBITDA 3.50x-4.75x >$25MM EBITDA 4.00x-5.00x Leveraged recaps or “storied” credits: 3.75x-4.25x;
Maturities equal to the greater of five years or six months after maturity of the senior debt facility;
“Storied” credits/recap liquidity remains robust; Full participation by all investor constituencies
o Traditional LP funds, credit opportunity funds, captive bank
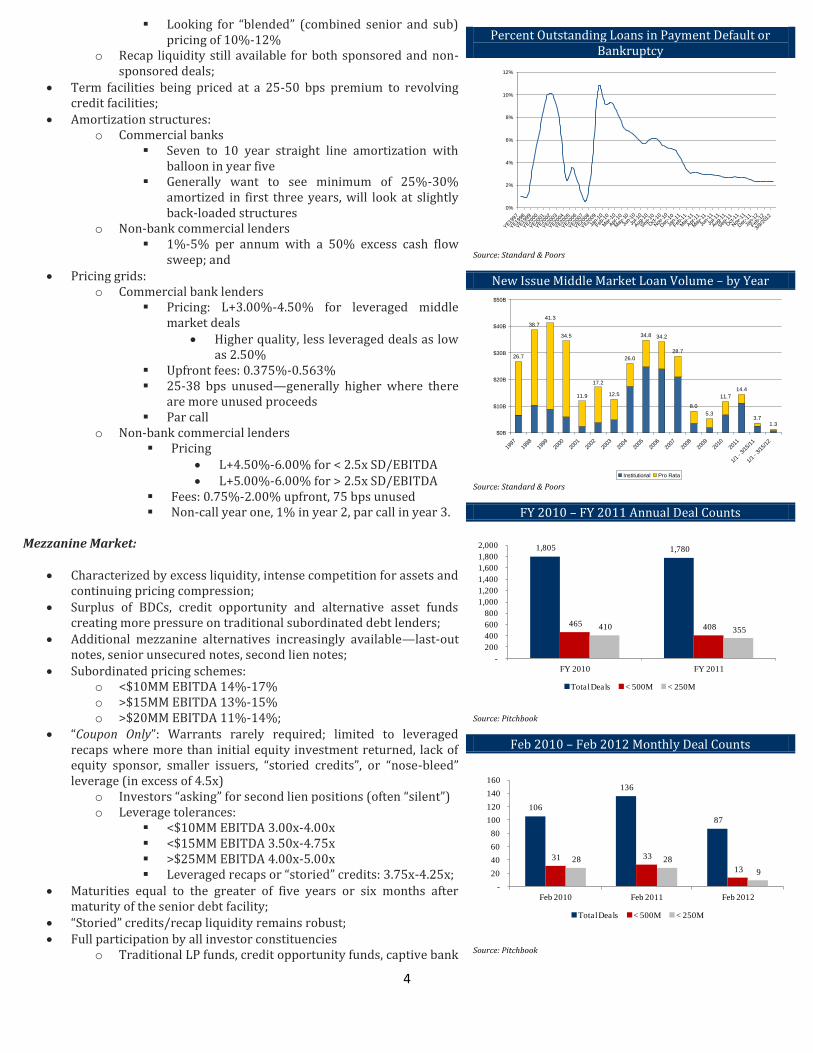
Percent Outstanding Loans in Payment Default or Bankruptcy
Source: Standard & Poors
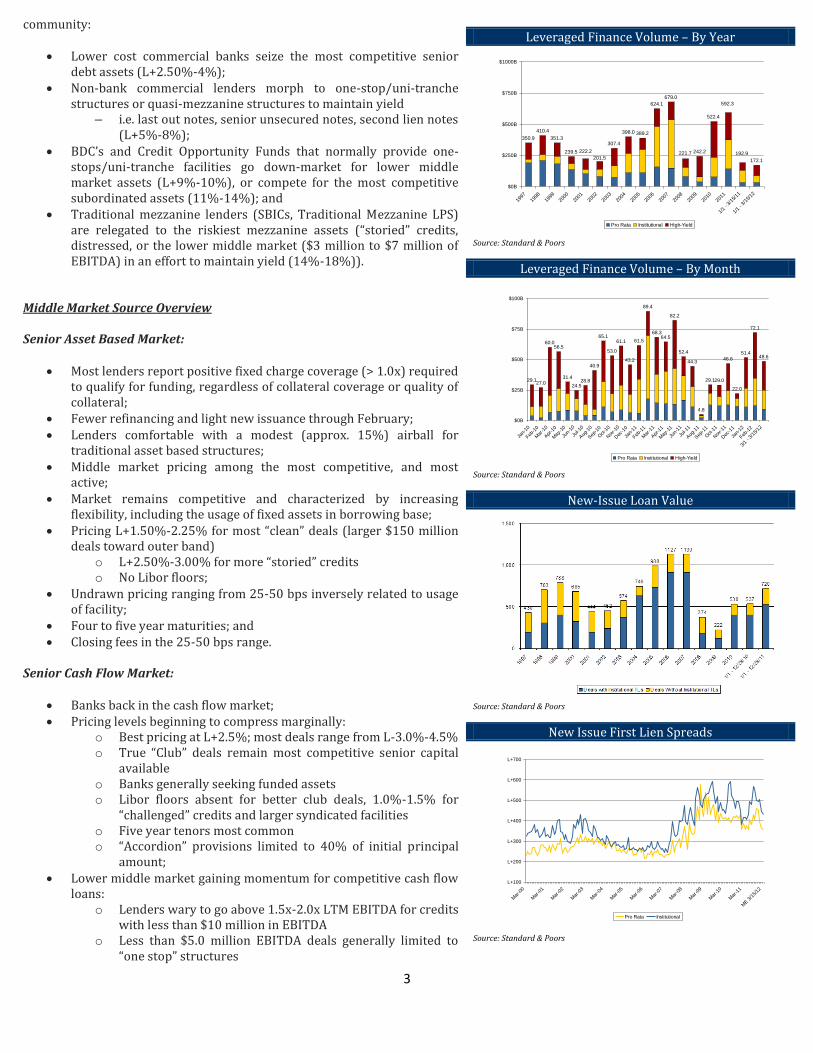
New Issue Middle Market Loan Volume – by Year
Source: Standard & Poors
FY 2010 – FY 2011 Annual Deal Counts
Source: Pitchbook
Feb 2010 – Feb 2012 Monthly Deal Counts
Source: Pitchbook
0%
2%
4%
6%
8%
10%
12%
YE19
97
YE19
98
YE19
99
YE20
00
YE20
01
YE20
02
YE20
03
YE20
04
YE20
05
YE20
06
YE20
07
YE20
08
YE20
09
Jan-
10
Feb-1
0
Mar
-10
Apr
-10
May
-10
Jun-
10
Jul-1
0
Aug
-10
Sep
-10
Oct
-10
Nov
-10
Dec
-10
Jan-
11
Feb-1
1
Mar
-11
Apr
-11
May
-11
Jun-
11
Jul-1
1
Aug
-11
Sep
-11
Oct
-11
Nov
-11
Dec
-11
Jan-
12
Feb-1
2
3/9/
2012
26.7
38.7
41.3
34.5
11.9 12.5
26.0
34.8 34.2
28.7
8.0
5.3
11.7
14.4
3.71.3
17.2
$0B
$10B
$20B
$30B
$40B
$50B
1997
1998
1999
2000
2001
2002
2003
2004
2005
2006
2007
2008
2009
2010
2011
1/1
- 3/1
5/11
1/1
- 3/1
5/12
Institutional Pro Rata
1,805 1,780
465 408 410 355
-
200
400
600
800
1,000
1,200
1,400
1,600
1,800
2,000
FY 2010 FY 2011
Total Deals < 500M < 250M
106
136
87
31 33
13
28 28
9
-
20
40
60
80
100
120
140
160
Feb 2010 Feb 2011 Feb 2012
Total Deals < 500M < 250M
5
funds, hedge funds, commercial finance companies, BDCs, credit opportunity funds, and insurance companies creating pricing pressure
o Regional bank mezz funds often provide below market pricing dynamics
13%-15% subordinated and L+6%-9% second lien pricing for less than $15 million EBITDA issuers, but will only lend where the bank provides the senior debt
Transactions generally less than $15 million in aggregate principal amount;
Minority equity and co-invest equity “strips” readily available; Prepayment provisions highly negotiable, very investor specific; Investors wary to provide par call for coupon-only deals: Non-call
periods range from 1-2 years as investors try to maintain a cash-on-cash minimum return; and
Upfront fees average 1%-2%. Please feel free to call any of the professionals at SPP Capital to discuss a particular financing need, amendment or restructuring advisory, or just to get a little more color on the market; you don’t need a deal ready to go to the market to call us. Our hope is that you use SPP as your “go to” resource for any information, analysis and review of potential transactions in concert with your internal evaluation process. Stefan Shaffer Managing Partner (212) 455-4502 [email protected] DISCLAIMER: The "SPP Leveraged Cash Flow Market At-A-Glance" and supporting commentary is derived by the anecdotal experience of SPP Capital Partners, LLC, its specific transactions, discussion with issuers, lenders and investors consistent with its standard operating practices. Any empirical data specifically derived by third parties, or intellectual property or opinions of third parties are expressly attributed when utilized. The factual information provided has been obtained from sources believed to be reliable, but is not guaranteed as to accuracy or completeness. All data, facts, tables or analyses provided by Governmental or other regulatory bodies are deemed to be in the public domain and not otherwise expressly attributed herein. SPP Capital Partners, LLC is a member of FINRA and SIPC. This information represents the opinion of SPP Capital and is not intended to be a forecast of future events, a guarantee of future results or investment advice. It is not intended to provide specific advice or to be construed as an offering of securities or recommendation to invest. To unsubscribe to this email, please click here. To request to be added to our distribution list, please click here
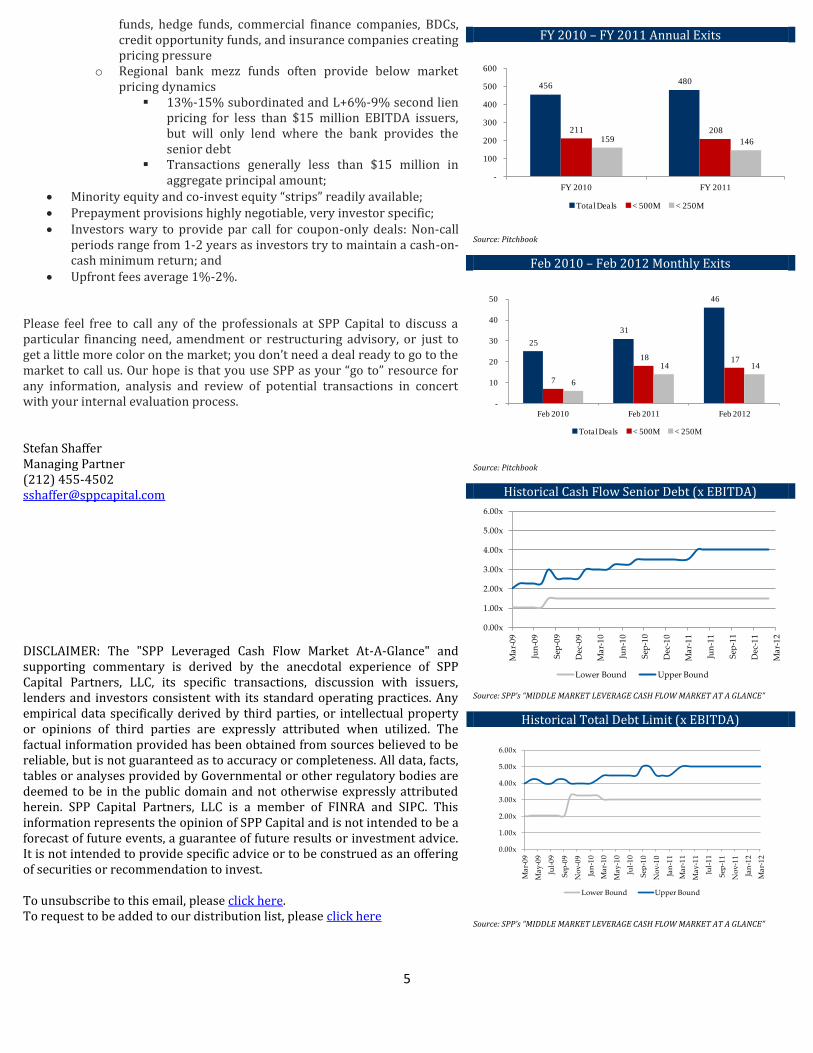
FY 2010 – FY 2011 Annual Exits
Source: Pitchbook
Feb 2010 – Feb 2012 Monthly Exits
Source: Pitchbook
Historical Cash Flow Senior Debt (x EBITDA)
Source: SPP’s “MIDDLE MARKET LEVERAGE CASH FLOW MARKET AT A GLANCE”
Historical Total Debt Limit (x EBITDA)
Source: SPP’s “MIDDLE MARKET LEVERAGE CASH FLOW MARKET AT A GLANCE”
456 480
211 208 159 146
-
100
200
300
400
500
600
FY 2010 FY 2011
Total Deals < 500M < 250M
25
31
46
7
18 17
6
14 14
-
10
20
30
40
50
Feb 2010 Feb 2011 Feb 2012
Total Deals < 500M < 250M
0.00x
1.00x
2.00x
3.00x
4.00x
5.00x
6.00xM
ar-
09
Jun
-09
Sep
-09
Dec
-09
Ma
r-1
0
Jun
-10
Sep
-10
Dec
-10
Ma
r-1
1
Jun
-11
Sep
-11
Dec
-11
Ma
r-1
2
Lower Bound Upper Bound
0.00x
1.00x
2.00x
3.00x
4.00x
5.00x
6.00x
Ma
r-0
9
Ma
y-0
9
Jul-
09
Sep
-09
No
v-0
9
Jan
-10
Ma
r-1
0
Ma
y-1
0
Jul-
10
Sep
-10
No
v-1
0
Jan
-11
Ma
r-1
1
Ma
y-1
1
Jul-
11
Sep
-11
No
v-1
1
Jan
-12
Ma
r-1
2
Lower Bound Upper Bound
6
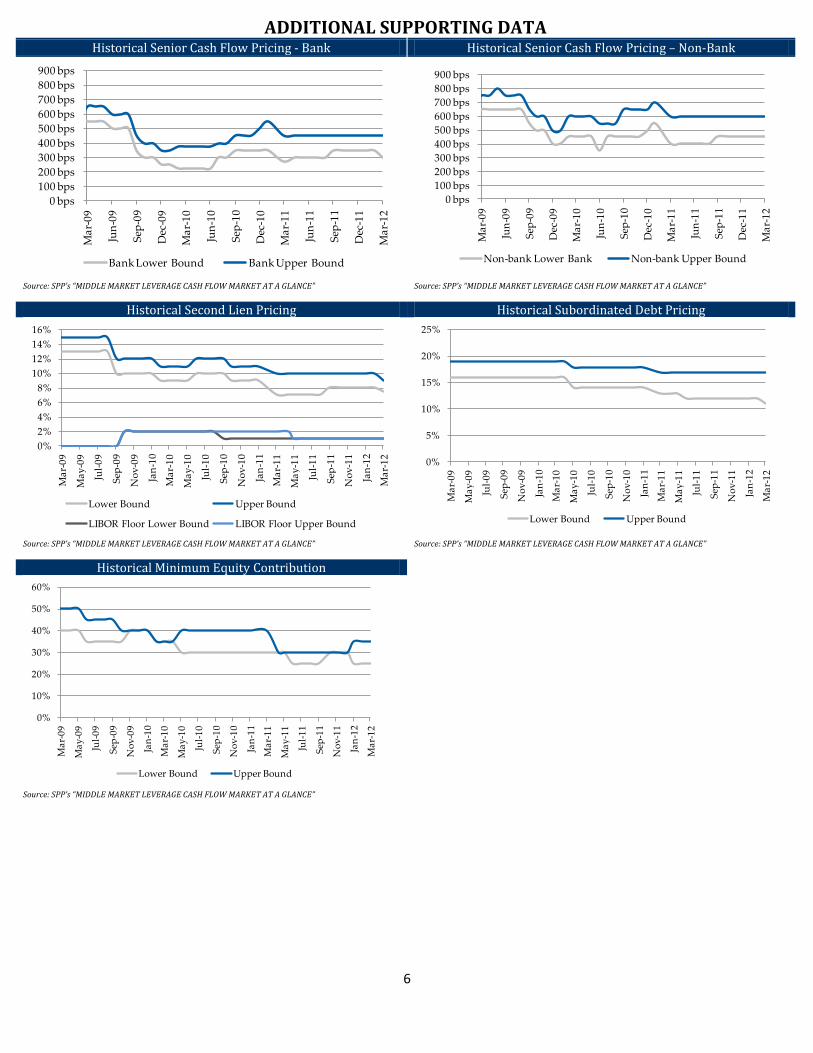
ADDITIONAL SUPPORTING DATA Historical Senior Cash Flow Pricing - Bank Historical Senior Cash Flow Pricing – Non-Bank
Source: SPP’s “MIDDLE MARKET LEVERAGE CASH FLOW MARKET AT A GLANCE” Source: SPP’s “MIDDLE MARKET LEVERAGE CASH FLOW MARKET AT A GLANCE”
Historical Second Lien Pricing Historical Subordinated Debt Pricing
Source: SPP’s “MIDDLE MARKET LEVERAGE CASH FLOW MARKET AT A GLANCE” Source: SPP’s “MIDDLE MARKET LEVERAGE CASH FLOW MARKET AT A GLANCE”
Historical Minimum Equity Contribution
Source: SPP’s “MIDDLE MARKET LEVERAGE CASH FLOW MARKET AT A GLANCE”
0 bps
100 bps
200 bps
300 bps
400 bps
500 bps
600 bps
700 bps
800 bps
900 bps
Ma
r-0
9
Jun
-09
Sep
-09
Dec
-09
Ma
r-1
0
Jun
-10
Sep
-10
Dec
-10
Ma
r-1
1
Jun
-11
Sep
-11
Dec
-11
Ma
r-1
2
Bank Lower Bound Bank Upper Bound
0 bps
100 bps
200 bps
300 bps
400 bps
500 bps
600 bps
700 bps
800 bps
900 bps
Ma
r-0
9
Jun
-09
Sep
-09
Dec
-09
Ma
r-1
0
Jun
-10
Sep
-10
Dec
-10
Ma
r-1
1
Jun
-11
Sep
-11
Dec
-11
Ma
r-1
2
Non-bank Lower Bank Non-bank Upper Bound
0%
2%
4%
6%
8%
10%
12%
14%
16%
Ma
r-0
9
Ma
y-0
9
Jul-
09
Sep
-09
No
v-0
9
Jan
-10
Ma
r-1
0
Ma
y-1
0
Jul-
10
Sep
-10
No
v-1
0
Jan
-11
Ma
r-1
1
Ma
y-1
1
Jul-
11
Sep
-11
No
v-1
1
Jan
-12
Ma
r-1
2
Lower Bound Upper Bound
LIBOR Floor Lower Bound LIBOR Floor Upper Bound
0%
5%
10%
15%
20%
25%
Ma
r-0
9
Ma
y-0
9
Jul-
09
Sep
-09
No
v-0
9
Jan
-10
Ma
r-1
0
Ma
y-1
0
Jul-
10
Sep
-10
No
v-1
0
Jan
-11
Ma
r-1
1
Ma
y-1
1
Jul-
11
Sep
-11
No
v-1
1
Jan
-12
Ma
r-1
2
Lower Bound Upper Bound
0%
10%
20%
30%
40%
50%
60%
Ma
r-0
9
Ma
y-0
9
Jul-
09
Sep
-09
No
v-0
9
Jan
-10
Ma
r-1
0
Ma
y-1
0
Jul-
10
Sep
-10
No
v-1
0
Jan
-11
Ma
r-1
1
Ma
y-1
1
Jul-
11
Sep
-11
No
v-1
1
Jan
-12
Ma
r-1
2
Lower Bound Upper Bound