Embed Size (px)
DESCRIPTION
The Sports Club Survey is the largest ever survey of British sports clubs. Taking in finances, member numbers, facilities, volunteers and more – the survey tells the story of what life is like for grassroots community clubs.
Citation preview

SPORTS CLUB
SURVEY 2013
A review of clubs including membership, facility access,
f nances, challenges and opportunities
CONTENTS
INTRODUCTION 07
EXECUTIVE SUMMARY 03
Adult membershipAdult membership levels by club typeAdult membership levels by sportJunior membershipJunior membership levels by club typeJunior membership levels by sportThe impact of London 2012
MEMBERSHIP NUMBERS 09
09111418192123
FINANCES 29
Income and expenditureClubs in surplus, deficit and breaking evenManaging income and expenditureMembership feesFacility costs Rate reliefHiring facilities
29343638434546
CLUB SET-UP 49
Volunteers and paid staffVolunteers and paid staff by club typeEquipment FacilitiesTypes of facility accessHiring and leasingFacility ownershipPublic spaceFacilities and disability access
495152555556585960
Bar 61
1
SPORTS CLUBS, LOCAL COMMUNITIES AND SUPPORT 63
Links with schoolsCommunity projectsCSP, local authority and NGB support
646668
LOOKING FORWARD 73
Support and trainingUpcoming challengesUpcoming opportunities
737582
APPENDIX - METHODOLOGY AND SAMPLE 87
The surveySurvey promotionSurvey sample and weighting Comparisons with earlier Sports Club SurveysLimitations
8787
9388
95
The Sport and Recreation AllianceThe Sport and Recreation Alliance is the independent umbrella body for sport and recreation.
Almost every recognised sport and recreation activity in the UK has its own governing or representative body – organisations like The FA, The Amateur Swimming Association, British Gymnastics and The Ramblers – who exist to organise, to set rules and to encourage more people to join their activity. The Sport and Recreation Alliance is their voice.
Where there is a problem affecting our members or where there is an opportunity to promote the work they do, our job is to speak up on their behalf and to advance their interests. We also help our members become more effective by providing them with a wide range of services and expert advice.
Established in 1935 and originally named the Central Council of Physical Recreation, the Alliance exists to protect, promote and provide for its members.
This survey has been researched and written by Syann Cox and Poppy Sparham.
This document is © Sport and Recreation Alliance. All rights reservedThis document can be found in the research section of sportandrecreation.org.uk This document is correct as of October 2013

2
EXECUTIVE SUMMARY
Sports Club Survey | Executive summary
3
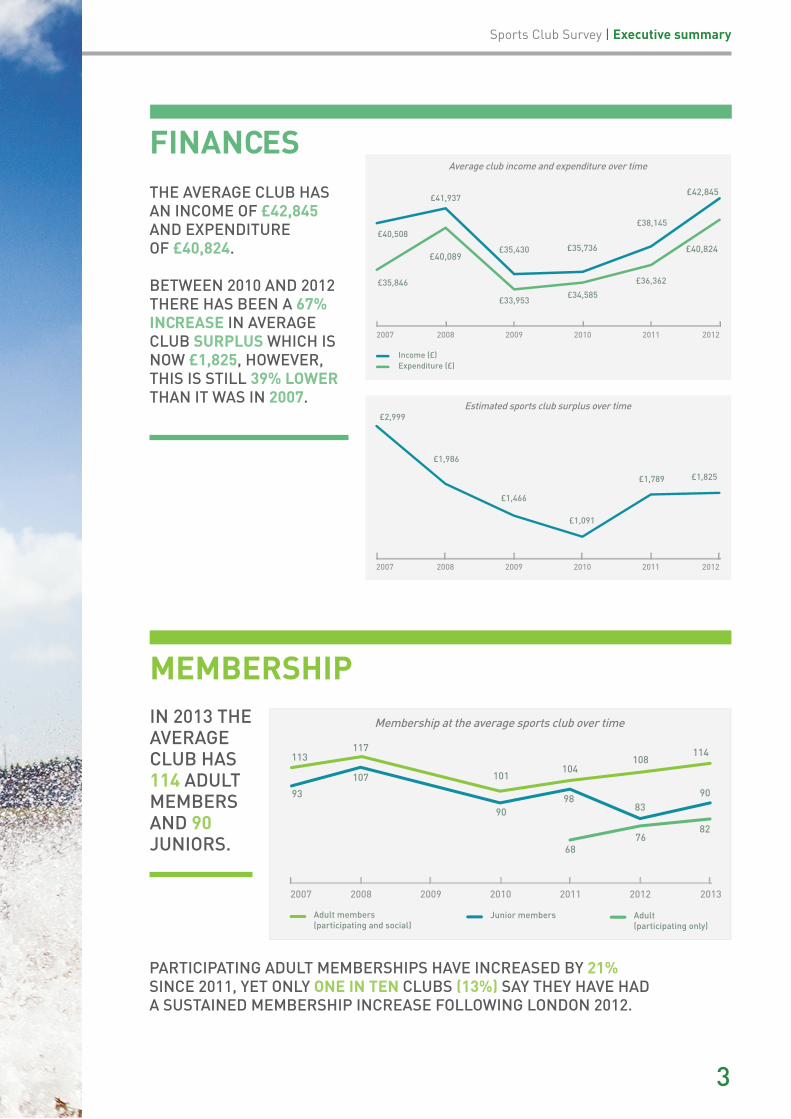
FINANCESTHE AVERAGE CLUB HAS AN INCOME OF £42,845 AND EXPENDITURE OF £40,824.
BETWEEN 2010 AND 2012 THERE HAS BEEN A 67% INCREASE IN AVERAGE CLUB SURPLUS WHICH IS NOW £1,825, HOWEVER, THIS IS STILL 39% LOWER THAN IT WAS IN 2007.
MEMBERSHIP
PARTICIPATING ADULT MEMBERSHIPS HAVE INCREASED BY 21% SINCE 2011, YET ONLY ONE IN TEN CLUBS (13%) SAY THEY HAVE HAD A SUSTAINED MEMBERSHIP INCREASE FOLLOWING LONDON 2012.
IN 2013 THE AVERAGE CLUB HAS 114 ADULT MEMBERS AND 90 JUNIORS.
FACILITIES
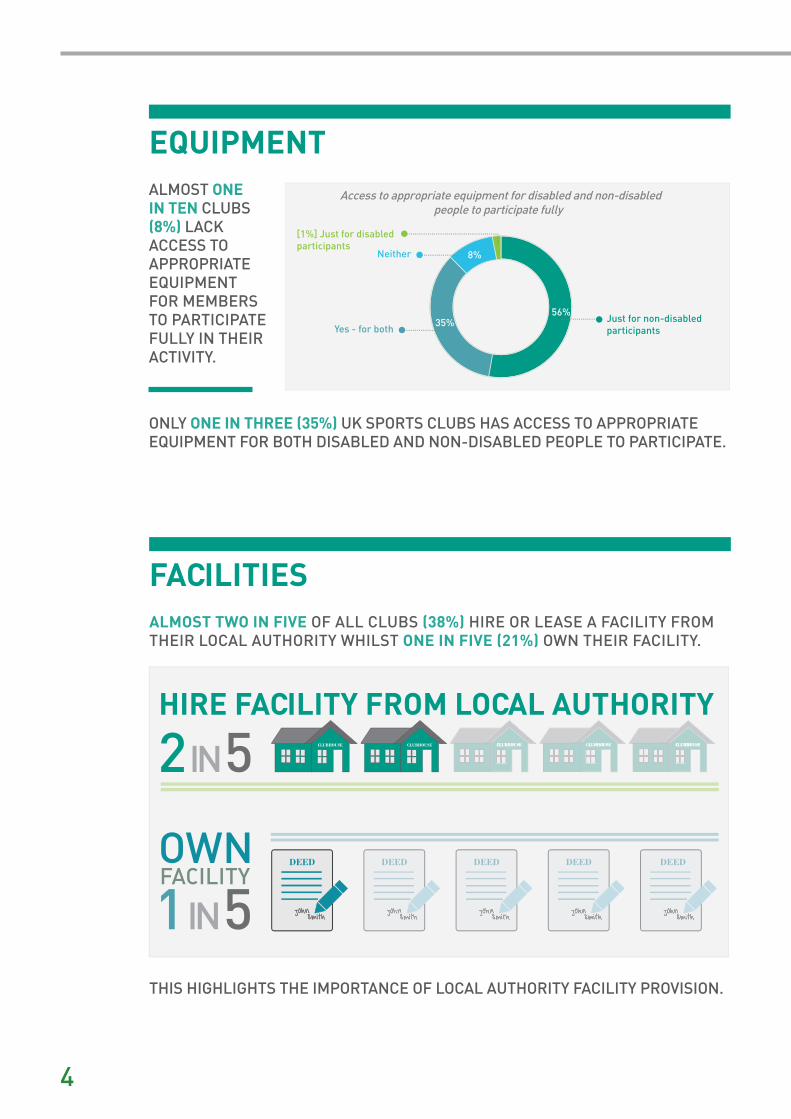
THIS HIGHLIGHTS THE IMPORTANCE OF LOCAL AUTHORITY FACILITY PROVISION.
EQUIPMENT
ONLY ONE IN THREE (35%) UK SPORTS CLUBS HAS ACCESS TO APPROPRIATE EQUIPMENT FOR BOTH DISABLED AND NON-DISABLED PEOPLE TO PARTICIPATE.
ALMOST ONE IN TEN CLUBS (8%) LACK ACCESS TO APPROPRIATE EQUIPMENT FOR MEMBERS TO PARTICIPATE FULLY IN THEIR ACTIVITY.
ALMOST TWO IN FIVE OF ALL CLUBS (38%) HIRE OR LEASE A FACILITY FROM THEIR LOCAL AUTHORITY WHILST ONE IN FIVE (21%) OWN THEIR FACILITY.
4
LOOKING FORWARD
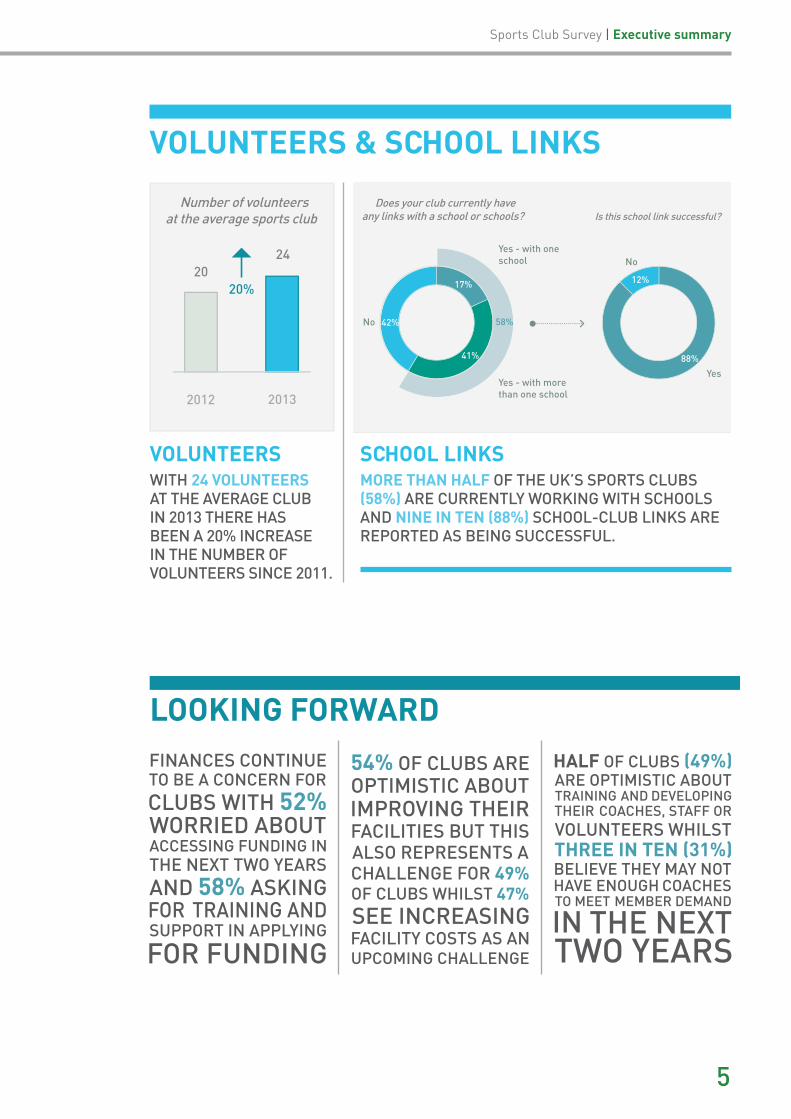
VOLUNTEERS & SCHOOL LINKS
MORE THAN HALF OF THE UK’S SPORTS CLUBS (58%) ARE CURRENTLY WORKING WITH SCHOOLS AND NINE IN TEN (88%) SCHOOL-CLUB LINKS ARE REPORTED AS BEING SUCCESSFUL.
WITH 24 VOLUNTEERS AT THE AVERAGE CLUB IN 2013 THERE HAS BEEN A 20% INCREASE IN THE NUMBER OF VOLUNTEERS SINCE 2011.
5
Sports Club Survey | Executive summary
VOLUNTEERS SCHOOL LINKS
INTRODUCTION
Sports Club Survey | Introduction
INTRODUCTION
Every two years the Alliance takes a look at the health of our sports clubs to inform our understanding of the sport and recreation sector and to pin down important policy areas moving forwards.
Although the idea of building a legacy began the moment London won the bid, this year we’re keen to see how the set-up, finances and future focuses of sports clubs have changed following London’s successful 2012 Olympic and Paralympic Games.
As well as asking about some of the same topics we covered in our 2011, 2009 and 2007 surveys, alongside the impact of the Games we’ve also sought out information on priority issues such as school sport, the Community Amateur Sports Club (CASC) scheme and the role of sport in providing community projects.
All of the information we gather is vital to the Alliance as it informs and shapes our policy positions and provides us with a rich data source to model the potential impact of financial changes that the sector might face.
Many of our members also benefit directly from this research, with national governing bodies (NGBs) offered the chance to include up to five questions to be asked of their specific sports clubs as well as the main survey.
The findings in this report are based on responses from 2,909 sports clubs across more than 100 different sports. Not all clubs answered all questions so base sizes are included throughout.
As in previous Sports Club Surveys, the data has been weighted to represent the estimated 151,000 sports clubs thought to be in existence across the UK.
Full details of our methodological approach can be found in Appendix A whilst a breakdown of the types of clubs we heard from can be found in Appendix B.
EVERY TWO YEARS THE ALLIANCE TAKES A LOOK AT THE HEALTH OF OUR SPORTS CLUBS
7

MEMBERSHIP NUMBERS
SECTION 03
MEMBERSHIP NUMBERS
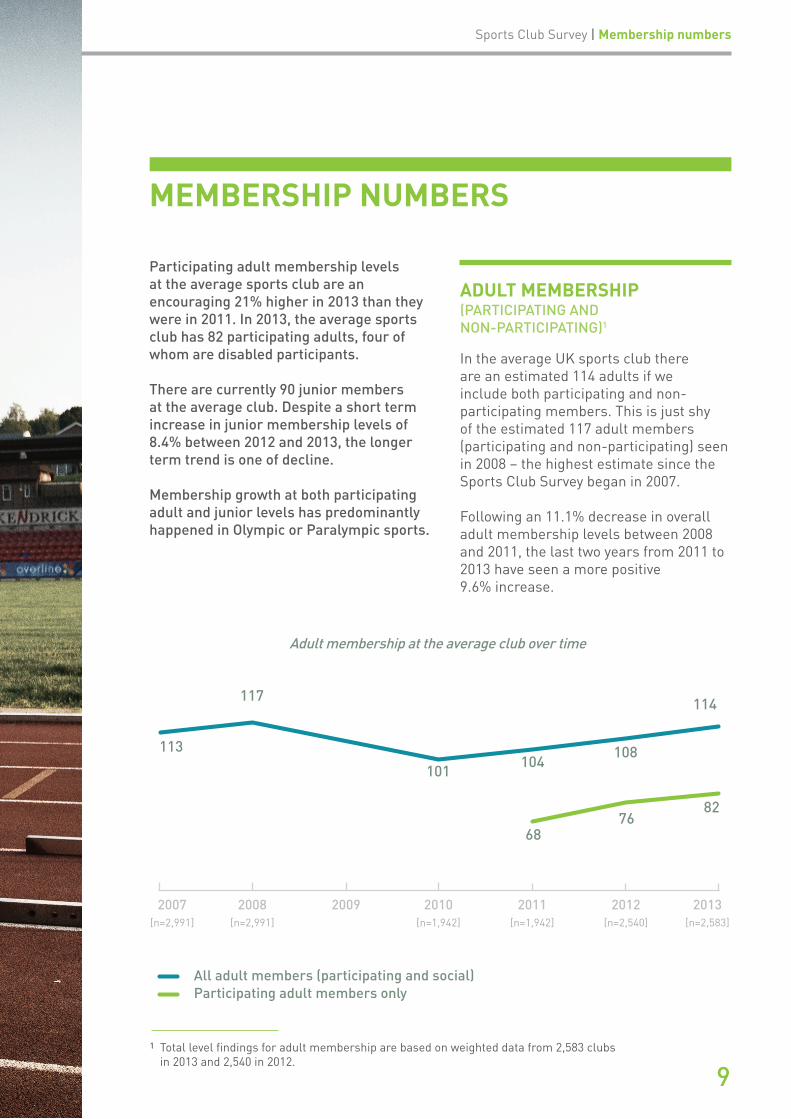
Participating adult membership levels at the average sports club are an encouraging 21% higher in 2013 than they were in 2011. In 2013, the average sports club has 82 participating adults, four of whom are disabled participants.
There are currently 90 junior members at the average club. Despite a short term increase in junior membership levels of 8.4% between 2012 and 2013, the longer term trend is one of decline.
Membership growth at both participating adult and junior levels has predominantly happened in Olympic or Paralympic sports.
ADULT MEMBERSHIP (PARTICIPATING AND NON-PARTICIPATING)1
In the average UK sports club there are an estimated 114 adults if we include both participating and non-participating members. This is just shy of the estimated 117 adult members (participating and non-participating) seen in 2008 – the highest estimate since the Sports Club Survey began in 2007.
Following an 11.1% decrease in overall adult membership levels between 2008 and 2011, the last two years from 2011 to 2013 have seen a more positive 9.6% increase.
Sports Club Survey | Membership numbers
113
2007 2008 2009 2010
117
101104
108
114
6876
82
2011 2012 2013[n=2,991] [n=2,991] [n=1,942] [n=1,942] [n=2,540] [n=2,583]
All adult members (participating and social)Participating adult members only
Adult membership at the average club over time
1 Total level fndings for adult membership are based on weighted data from 2,583 clubs in 2013 and 2,540 in 2012.
9
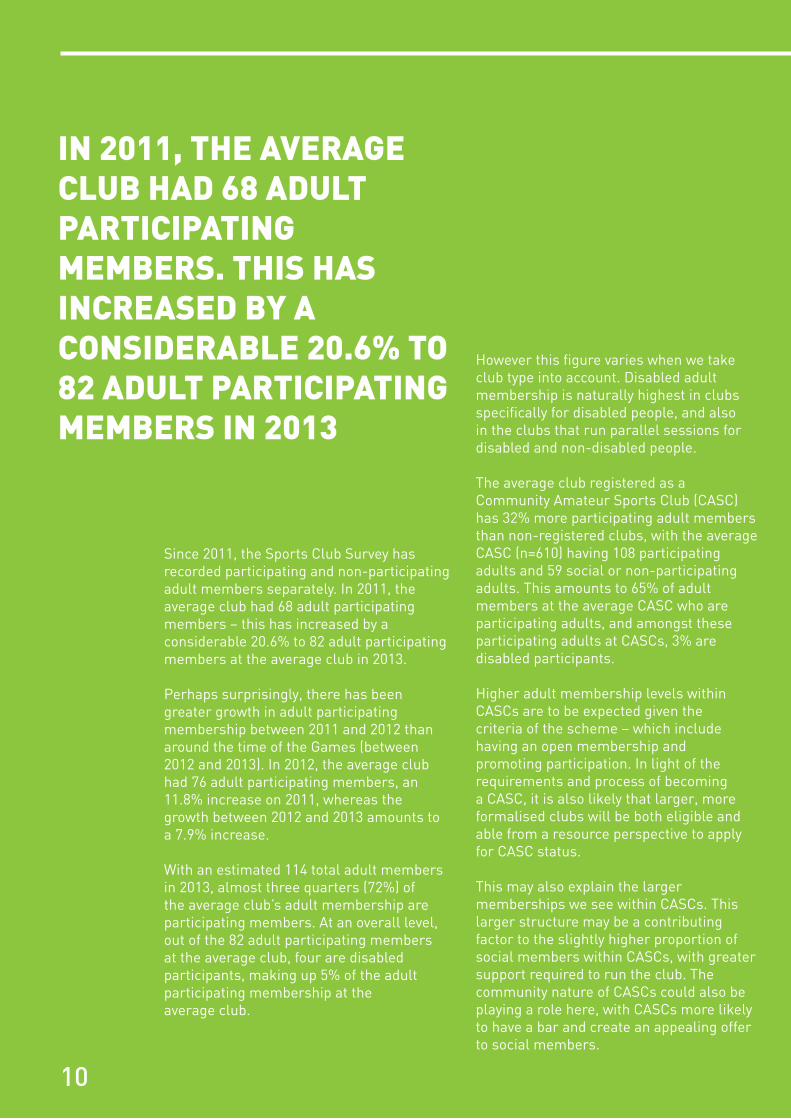
IN 2011, THE AVERAGE CLUB HAD 68 ADULT PARTICIPATING MEMBERS. THIS HAS INCREASED BY A CONSIDERABLE 20.6% TO 82 ADULT PARTICIPATING MEMBERS IN 2013
Since 2011, the Sports Club Survey has recorded participating and non-participating adult members separately. In 2011, the average club had 68 adult participating members – this has increased by a considerable 20.6% to 82 adult participating members at the average club in 2013.
Perhaps surprisingly, there has been greater growth in adult participating membership between 2011 and 2012 than around the time of the Games (between 2012 and 2013). In 2012, the average club had 76 adult participating members, an 11.8% increase on 2011, whereas the growth between 2012 and 2013 amounts to a 7.9% increase.
With an estimated 114 total adult members in 2013, almost three quarters (72%) of the average club’s adult membership are participating members. At an overall level, out of the 82 adult participating members at the average club, four are disabled participants, making up 5% of the adult participating membership at the average club.
However this fgure varies when we take club type into account. Disabled adult membership is naturally highest in clubs specifcally for disabled people, and also in the clubs that run parallel sessions for disabled and non-disabled people.
The average club registered as a Community Amateur Sports Club (CASC) has 32% more participating adult members than non-registered clubs, with the average CASC (n=610) having 108 participating adults and 59 social or non-participating adults. This amounts to 65% of adult members at the average CASC who are participating adults, and amongst these participating adults at CASCs, 3% are disabled participants.
Higher adult membership levels within CASCs are to be expected given the criteria of the scheme – which include having an open membership and promoting participation. In light of the requirements and process of becoming a CASC, it is also likely that larger, more formalised clubs will be both eligible and able from a resource perspective to apply for CASC status.
This may also explain the larger memberships we see within CASCs. This larger structure may be a contributing factor to the slightly higher proportion of social members within CASCs, with greater support required to run the club. The community nature of CASCs could also be playing a role here, with CASCs more likely to have a bar and create an appealing offer to social members.
10
ADULT MEMBERSHIP LEVELS BY CLUB TYPE
When taking club type into account, mainstream clubs2 are larger than clubs either specifcally for disabled people, or specifcally for non-disabled people. In the average club that runs parallel sessions for disabled people and non-disabled people (n=190), there are 123 participating adults, 11 of whom are disabled, meaning that around one in ten (9%) adult participants at these clubs are disabled.
At the average club where both disabled and non-disabled adults participate together (n=1,106), there are 102 adult participating members, three of whom are disabled, making up 3% of their adult participating membership. This shows that clubs which offer specifc sessions for disabled people in an inclusive way have three times as many disabled adult participants in relation to their overall membership levels.
Clubs offering parallel sessions are also more likely to have disabled members. Amongst clubs that provide opportunities where disabled and non-disabled people take part in their activity together, in 2013, two in fve (43%) have no disabled adult members compared to 28% of clubs which offer parallel sessions.
Interestingly, one in four (26%) clubs which offer opportunities for participation together currently have no disabled members at all, either adults or juniors. This is compared to just under one in ten (9%) clubs who offer parallel sessions.
Although we can’t establish from our survey data why this is, research conducted by the English Federation of Disability Sport EFDS (2013) amongst disabled people in relation to their participation habits indicates that there is a disconnect between the number of people who say they would like to take part in sessions where people participate together and those who are actually doing so.
Although 64% of their respondents expressed an interest in doing so, only 51% actually were. It may therefore be that clubs running parallel sessions are able to promote these better or are better resourced to support disabled participation given that they run separate sessions.
Alternatively, there may be additional barriers to participation in clubs offering participation together, possibly in terms of the opportunities that are available to people across a wide range of disabilities or the knowledge within these clubs to make activities truly inclusive.
Sports Club Survey | Membership numbers
2 In this report, mainstream clubs are defned as those which provide opportunities where disabled and non-disabled people participate together, or provide specifc, or parallel sessions for disabled people alongside sessions for non-disabled people.
11

There may also be other external factors at play, such as the location of the club and demand in the local area. It is also worth bearing in mind that clubs running parallel sessions are likely to be able to cater better for elite pathway development, and that the focus and therefore appeal of these clubs may be different to clubs offering sessions together.
In sports clubs that are specifcally for disabled people (n=52) there are 38 adult participating members. This is lower than in the average UK club by more than half, but only slightly lower than the 52 adult participating members at the average club which provides specifcally for non-disabled people (n=926).
These smaller membership sizes amongst clubs with specifc memberships, and the larger membership sizes amongst mainstream clubs suggest that a certain club size or structure may be necessary in order for the club to be able to open its activities to all, and that the very nature of a wider offer will result in more members.
This is further reinforced by the fact that mainstream clubs are more likely to own their facilities than clubs specifcally for disabled or non-disabled people.
Almost one in four clubs that provide opportunities for disabled and non-disabled participation together (24%, n=1,156) and clubs providing parallel sessions (23%, n=175) own their facilities compared to 16% and 7% of clubs specifcally for non-disabled (n=880) and disabled people (n=52) respectively.
This higher frequency of facility ownership probably ensures greater flexibility as to when these clubs can run sessions, and how many members they can accommodate at any one time.
Within mainstream clubs however, there are fewer volunteers or employees per member than in clubs specifcally for disabled or non-disabled people.
The average club offering opportunities for participation together has ten members to each volunteer/employee and clubs running parallel sessions for disabled and non-disabled participants have eight members to each volunteer/employee.
This is compared to three members to one volunteer/employee in clubs specifcally for disabled people and a six to one ratio in clubs specifcally for non-disabled people.
This suggests that mainstream clubs may be limited in their ability to grow their memberships by much more in the future unless they can also grow their number of volunteers or paid staff.
12

Sports Club Survey | Membership numbers
Adult participating members by club type (2013)
Club typeAverage number of participating adult members
Average number of disabled adult
members
Average % of adult participants that are disabled
All clubs
Base
82
2,583
4
1,213
5%
Clubs currently with one or more adult participants
92 4 4%
Base 2,292 1,213
Clubs specifcally for non-disabled people
52 - -
Base 926 -
Clubs specifcally for disabled people
38 - -
Base 52 -
Clubs that provide opportunities to take part together
102 3 3%
Base 1,106 945
Clubs that provide parallel sessions
123 11 9%
Base 190 138
Don’t know/Not sure
65 0[0.27] 0%
Base 203 129
13
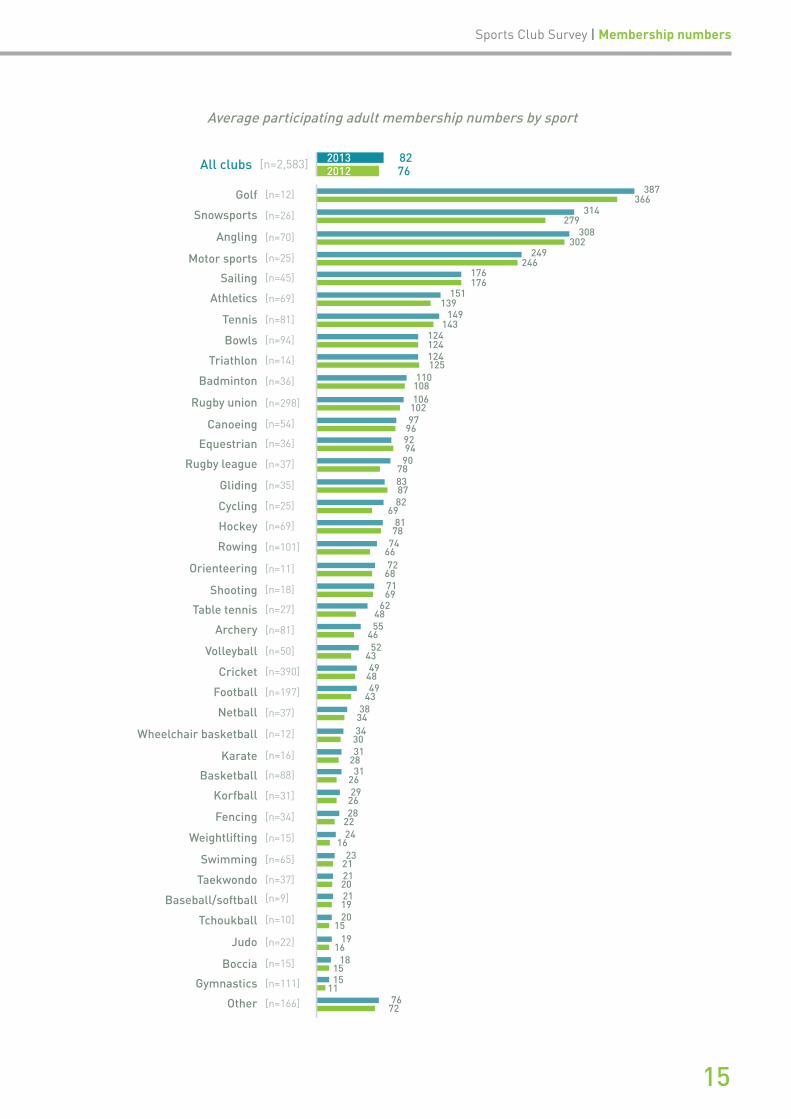
ADULT MEMBERSHIP LEVELS BY SPORT
The fve sports with the highest overall participating adult membership levels can be characterised by the types of facilities they use.
With 387 participating adult members at the average golf club (n=12), 314 at the average snowsports club (n=26), 308 at the average angling club (n=70), 249 at the average motor sports club (n=25) and 176 at the average sailing club (n=45), we see the highest memberships where activities predominantly take place in large, open spaces where more members are able to share the space without compromising on the sporting experience.
Sports with the lowest levels of participating adult members tend to be either those in which the majority of members are juniors – such as gymnastics, swimming and judo,
or sports which are relatively new (gaining popularity from around the 1980’s onwards) such as tchoukball or boccia.
However, although adult participating membership levels are lower here than in the average UK club, some of these sports have seen increases in adult participants between 2012 and 2013 that are higher than the 8% increase seen across all UK clubs over this time.
The average gymnastics club (n=111) has seen a 35% increase in adult membership between 2012 and 2013, the average tchoukball club (n=10) a 27% increase, judo (n=22) a 20% increase and boccia (n=15) a 17% increase.
This growth should be treated with some caution given a smaller change will have a larger impact where participating adult memberships are low, but it does show growth amongst these sports.
14
Sports Club Survey | Membership numbers
Golf
Snowsports
Angling
Motor sports
Sailing
Athletics
Tennis
Bowls
Triathlon
Badminton
Rugby union
Canoeing
Equestrian
Rugby league
Gliding
Cycling
Hockey
Rowing
Orienteering
Shooting
Table tennis
Archery
Volleyball
Cricket
Football
Netball
Wheelchair basketball
Karate
Basketball
Korfball
Fencing
Weightlifting
Swimming
Taekwondo
Baseball/softball
Tchoukball
Judo
Boccia
Gymnastics
Other
387366
314279
308302
249246
176176
151139
149143
124124124125
110108106
10297
969294
9078838782
6981
7874
6672
68
7672
7169
624855
4652
4349
4849
4338
3434
3031
2831
2629
2628
2224
1623
212120211920
1519
1618
1515
11
[n=12]
[n=26]
[n=70]
[n=25]
[n=45]
[n=69]
[n=81]
[n=94]
[n=14]
[n=36]
[n=298]
[n=54]
[n=36]
[n=37]
[n=35]
[n=25]
[n=69]
[n=101]
[n=11]
[n=18]
[n=27]
[n=81]
[n=50]
[n=390]
[n=197]
[n=37]
[n=12]
[n=16]
[n=88]
[n=31]
[n=34]
[n=15]
[n=65]
[n=37]
[n=9]
[n=10]
[n=22]
[n=15]
[n=111]
[n=166]
All clubs 8276[n=2,583] 2013
2012
Average participating adult membership numbers by sport
15

As to be expected given the strong overall trend for participating adult membership growth, on a sport by sport basis, 35 out of 40 sports report an increase in average participating adult membership numbers between 2012 and 2013.
The greatest increases have been seen in weightlifting with the average club increasing its adult participating membership by 45% (n=15), gymnastics (n=111) as already noted at 35%, and table tennis (n=27) where the average club has seen a 29% increase in adult participating members.
Interestingly, these are all sports which competed in the London 2012 Olympic Games.
In fact, nine of the ten sports with the highest increases in adult participants are Olympic sports. The only non-Olympic sport is Tchoukball – a relatively new sport with its NGB founded in 2002, which has been making concerted efforts to grow in recent years.
Highest increases in adult participating members by sport
Base Sport 2012 2013 % increase
15 Weightlifting 16 24 45%
111 Gymnastics 11 15 35%
27 Table tennis 48 62 29%
34 Fencing 22 28 27%
10 Tchoukball 15 20 27%
50 Volleyball 43 52 22%
88 Basketball 26 31 20%
22 Judo 16 19 20%
25 Cycling 69 82 19%
81 Archery 46 55 18%
In the three sports in which adult participating membership hasn’t increased, memberships have either remained steady (sailing n=45 and bowls n=94), or the decrease has only been very small at between one and fve per cent (triathlon n=14, equestrian n=36, gliding n=35).
Over the last two years, in contrast to participating adult membership, social or non-participating adult memberships have declined slightly from 36 non-participating members in 2011 to 33 at the average club in 2013.
16
Sports Club Survey | Membership numbers
It isn’t possible to tell from our data what’s prompted this and whether the overall trend is that these non-participating members have left the club altogether or become participating members.
Fees for adult social members have not increased in recent years, remaining at a low £13 a year at the average club. This would suggest that social membership is not reducing because of increasing fnancial pressures.
With 33 non-participating adult members at the average swimming club (n=65) compared to 23 participating members, when including both types of adult members the overall adult membership of swimming clubs increases considerably.
Although it may seem high that 59% of adults at the average swimming club do not participate, given that there are 163 junior members at the average swimming club, this is likely to consist of parents, volunteers, offcials and coaches. This ensures that in training, participants are safe and well supervised, and that at events they are marshalled by enough people.
In this wider context, only 15% of the members at an average swimming club are non-participating adults. A similar scenario is occurring at the average gymnastics club (n=111) where 45% of their adult membership are non-participating but in the context of 252 junior members this accounts for only 4% of their total membership.
Within the average rugby union club (n=298), we also see that more than half (55%) of adults are non-participating members. In this instance although there are again large junior membership levels, the sport of rugby also tends to have a very social ethos which may be influencing this.
Rugby clubs are also more likely to own, part own, or long term lease their facilities with seven in ten (71%) owning, part owning or long term leasing their facility and 17% using multiple facilities with two thirds of these clubs owning as well (n=278).
As a result, nine in ten (90%) rugby clubs have access to a bar and six in ten (60%) have access to a non-bar social area allowing them to maximise on providing social events and activities for non-participating members alongside generating club income.
It may be for this reason that non-participating adults account for 29% of the total membership in the average rugby union club. Although it’s likely that some of these members will take an active role in looking after junior members, others may be involved predominantly for the social side, perhaps because they are ex-players.
A similar scenario may be occurring in cricket clubs (n=390) which again have large numbers of junior members but where non-participating adults account for 28% of their total membership.
These examples demonstrate that many sports clubs play a wider role in our communities than just offering chances to participate, creating a social environment and also opportunities to help children develop and progress.
They also show how, through drawing on resources within the community, sports clubs can deliver their activities safely and effectively.
17

THE ESTIMATED NUMBER OF JUNIORS IN 2013 AT THE AVERAGE UK SPORTS CLUB IS 90
The picture for junior membership4 is more varied. The estimated number of juniors in 2013 at the average UK sports club is 90. At an overall average club level, three of these 90 junior members are disabled participants.
Again at the average CASC (n=611) we see that membership levels are higher than the UK average, this time by 43% with 127 junior members at the average CASC – 2% of whom are disabled participants.
Whilst at an overall level there has been an increase of 8.4% on 2012 fgures when the average club had 83 junior members; in comparison to our highest recorded levels in 2008 (107 junior members), there has been a 15.9% decrease in junior membership levels.
It is in stark contrast to the 11.8% participating adult membership growth seen between 2011 and 2012 that we see a 15.3% decrease in junior membership over the same time.
JUNIOR MEMBERSHIP3
98
107
90
98
8390
Junior members
2007 2008 2009 2010 2011 2012 2013[n=2,991] [n=2,991] [n=1,942] [n=1,942] [n=2,533] [n=2,588]
Junior membership at the average club over time
3 Total level fndings for junior membership are based on weighted data from 2,588 clubs in 2013 and 2,533 in 2012.
4 Junior membership is defned differently across sports. Half of sports clubs (51%) defne junior membership as those aged 18 and younger, whilst a quarter (25%) defne them as under 16 and one in ten (11%) defne them as between 19 and 21. Junior membership data in this survey refers to juniors as defned by each individual club.
18
Sports Club Survey | Membership numbers
Since 2007, junior memberships have fluctuated. The two-year period between 2008 and 2010 showed a 15.9% decline. Since 2010 there has been an 8-9% increase followed by a 15-16% decrease every other year. This pattern suggests declining membership over time as the extent of the decreases is greater than the increases occurring.
What remains to be seen is whether the 8.4% increase seen between 2012 and 2013 marks the beginning of an upward trend, or if we can expect to see around a 15-16% decline again in the next year. Data from the 2015 Sports Club Survey will provide important insight in this area and help address the question of whether we have inspired a generation through the London 2012 Olympic and Paralympic Games.
This year-on-year variation in junior membership levels is diffcult to understand from our data and not helped by an absence of robust data over time on participation levels amongst children. Department for Culture, Media and Sport (DCMS) data from the latest Taking Part Survey (2012/13) also shows that amongst all children (aged 5-15 years) the participation rate in any sport in the four weeks prior to interview had decreased from 91% in 2008/09 to 88% in 2012/13.
In terms of participation outside of school in the week prior to the interview, this data again shows a signifcant decrease over this time period for 5-10 year olds (down from 75% in 2008/09 to 67% in 2012/13) and no signifcant change for 11-15 year olds – 89% of whom participated in sport outside of school in the week prior to interview5.
Given that the Taking Part data indicates higher participation levels amongst older children, a possible hypothesis is that there is a natural ebb and flow in junior memberships created from older children losing interest and younger children becoming old enough to express an interest and begin participating.
It is also plausible that capacity issues amongst clubs may prevent junior members joining at certain times.
5 DCMS (2013) Taking Part 2012/13: Annual Child Release.
JUNIOR MEMBERSHIP LEVELSBY CLUB TYPE
With regards to junior membership, again we see that mainstream clubs have the highest number of members. In particular with 181 junior members, the average club providing parallel sessions (n=190) has double the amount of junior members than the average UK club. One in 20 (6%) of these juniors are currently disabled participants.
As with adult disabled participants, clubs running parallel sessions have three times as many disabled junior participants than those who offer opportunities to participate together. Clubs that provide these opportunities (n=1,216) have an average of 92 junior members, 2% of whom are disabled participants.
19

In contrast, the average club specifcally for disabled people (n=52) has only 14 junior members whilst the average club specifcally for non-disabled people (n=927) has 77 junior members suggesting that there may be barriers to participation for disabled juniors, or that resources may be an issue in clubs specifcally for disabled people.
Similar to adult participation, two in fve (42%) clubs offering opportunities for participation together do not have any disabled junior participants currently, compared to just over one in four (26%) of clubs which run parallel sessions.
Junior members by club type (2013)
Club typeAverage number
of junior membersAverage number of disabled junior
members
Average % of junior membership
that are disabled
All clubs
Base
90
2,588
3
1,201
3%
Clubs currently with one or more junior participants
109 3 3%
Base 2,142 1,201
Clubs specifcally for non-disabled people
77 - -
Base 927 -
Clubs specifcally for disabled people
14 - -
Base 52 -
Clubs that provide opportunities to take part together
92 2 2%
Base 1,216 940
Clubs that provide parallel sessions
181 10 6%
Base 190 151
Don’t know/Not sure
68 0[0.2] 0%
Base 203 110
20
-
-
-
-
-
-
-

All clubs
Gymnastics
Rugby union
Swimming
Snowsports
Rugby league
Tennis
Football
Judo
Athletics
Hockey
Sailing
Cricket
Triathlon
Wheelchair basketball
Basketball
Taekwondo
Canoeing
9083
252197
216213
163143
162157
130114
130123
121112
121106
10586
9184
9189
706870
6765
5664
5761
5349
47
[n=2,588]
[n=112]
[n=299]
[n=65]
[n=26]
[n=37]
[n=82]
[n=198]
[n=22]
[n=69]
[n=69]
[n=45]
[n=390]
[n=13]
[n=12]
[n=88]
[n=37]
[n=54]
Golf
Karate
Rowing
Netball
4848
433842
3540
35
[n=12]
[n=16]
[n=101]
[n=37]
Badminton
Angling
Table tennis
Cycling
Fencing
Orienteering
Volleyball
Equestrian
Weightlifting
Archery
Boccia
Baseball/softball
Gliding
Motor sports
Shooting
Korfball
Bowls
Tchoukball
Other
38363839
3526
322426
22212020
151818
1612
161216151618
1011
999
84
24
321
5044
[n=36]
[n=70]
[n=27]
[n=25]
[n=34]
[n=11]
[n=50]
[n=36]
[n=15]
[n=81]
[n=15]
[n=9]
[n=35]
[n=25]
[n=18]
[n=31]
[n=94]
[n=10]
[n=166]
20132012
Average participating junior membership numbers by sport
JUNIOR MEMBERSHIP LEVELS BY SPORT
As would be expected given their appeal and suitability for young people, the highest average levels of junior membership are found within gymnastics (252 junior members
Sports Club Survey | Membership numbers
at the average club, n=112), rugby union (216 junior members at the average club, n=299) and swimming (163 junior members at the average club, n=65).
21
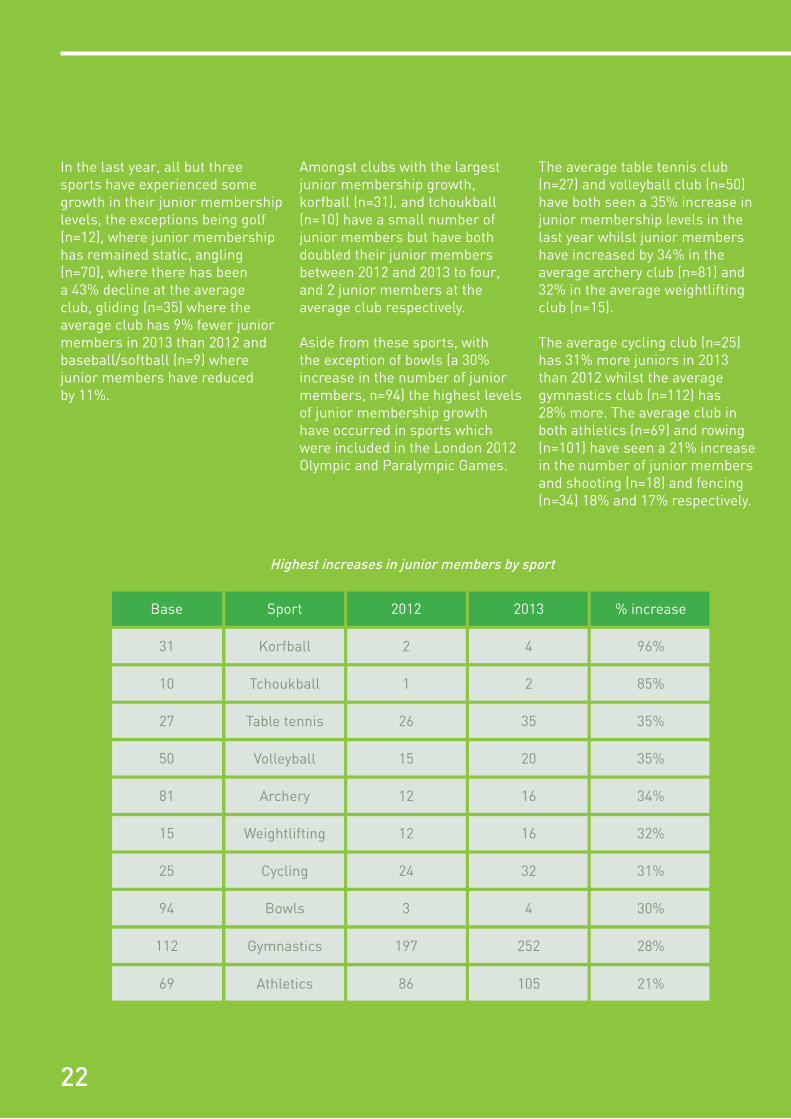
In the last year, all but three sports have experienced some growth in their junior membership levels, the exceptions being golf (n=12), where junior membership has remained static, angling (n=70), where there has been a 43% decline at the average club, gliding (n=35) where the average club has 9% fewer junior members in 2013 than 2012 and baseball/softball (n=9) where junior members have reduced by 11%.
Amongst clubs with the largest junior membership growth, korfball (n=31), and tchoukball (n=10) have a small number of junior members but have both doubled their junior members between 2012 and 2013 to four, and 2 junior members at the average club respectively.
Aside from these sports, with the exception of bowls (a 30% increase in the number of junior members, n=94) the highest levels of junior membership growth have occurred in sports which were included in the London 2012 Olympic and Paralympic Games.
Highest increases in junior members by sport
Base Sport 2012 2013 % increase
31 Korfball 2 4 96%
10 Tchoukball 1 2 85%
27 Table tennis 26 35 35%
50 Volleyball 15 20 35%
81 Archery 12 16 34%
15 Weightlifting 12 16 32%
25 Cycling 24 32 31%
94 Bowls 3 4 30%
112 Gymnastics 197 252 28%
69 Athletics 86 105 21%
The average table tennis club (n=27) and volleyball club (n=50) have both seen a 35% increase in junior membership levels in the last year whilst junior members have increased by 34% in the average archery club (n=81) and 32% in the average weightlifting club (n=15).
The average cycling club (n=25) has 31% more juniors in 2013 than 2012 whilst the average gymnastics club (n=112) has 28% more. The average club in both athletics (n=69) and rowing (n=101) have seen a 21% increase in the number of junior members and shooting (n=18) and fencing (n=34) 18% and 17% respectively.
22

Sports Club Survey | Membership numbers
THE LONDON 2012 OLYMPIC AND PARALYMPIC GAMES6
There already exists a wide range of research aiming to assess the impact the London 2012 Games had on participation, the economy and in leaving a wider legacy – but a defnitive answer is yet to be found.
Whilst our membership fgures data is largely positive and shows that the growth between March/April/May 2012 and March/April/May 2013 has occurred most within Olympic and Paralympic sports, sports clubs are not reporting a noticeable impact in membership levels directly after the Games.
In some instances, participation has been on an upward trend prior to the Games, and arguably the legacy began in 2005 when the bid was won. In other instances, clubs are unwilling to associate any apparent increases in membership with the Games.
Drawing on Active People data, evaluations of the Games frequently cite that since we won the bid in 2005, 1.4 million more people are now playing sport once a week. This equates to 15.3 million people participating in total (35.2%) in 2012/13 compared to 13.9 million in 2005/06 (34.2%).
However, the highest participation fgures recorded by the Active People survey were between October 2011 and October 2012 when just over 15.5 million people were participating (36.0%), and the biggest increase in participation (1.6%) was seen between the frst Active People survey in 2005/06 and the second in 2007/087.
The statement that 1.4 million more people are now playing sport once a week whilst true, does not necessarily convey the entire picture, with this data demonstrating that although there has been an overall positive trend in participation, there has also been some degree of variation in participant levels, and we have not necessarily seen a peak in relation to the Games.
The latest Sports Club Survey membership fgures show that there has been growth in both adult (5.6%) and junior (8.4%) memberships between March/April/May 2012 and March/April/May 2013, and that this growth has predominantly happened in Olympic and Paralympic sports. The longer term picture however is less positive with adult and junior membership levels lower now than they were in 2008.
6 Total level fndings for the impact of the Games are based on weighted data from 2,461 clubs.
7 Sport England (2013), Active People 7, Q2 data.
23
Junior membership levels are 15 members higher than in the average UK club, with 105 junior members in 2013, 23 of whom joined directly following the Games and two (9%) of whom are disabled participants.
These fndings show that memberships have increased following the Games predominantly in sports that were featured in London 2012 and that only a small proportion of new members are disabled. On average, clubs that have benefted had similar membership levels to the average UK club prior to this Games related boost.
At the average club running parallel sessions and reporting a sustained increase after the Games (n=41), there are 85 participating adults –12 of whom joined after the Games with four of these (33%) being disabled participants.
With 209 junior members at the average of these clubs, junior membership is considerably higher than the UK average club’s 90 junior members. These clubs report an average of 20 juniors joining following the Games, with six (30%) of these being disabled participants.
In addition, when asked directly what happened to club membership levels during or following the Games, only one in ten (13%) told us that their membership had increased directly after the Games, and that most of these members had remained.
This is comparable with the 12% of British people who said that the London 2012 Olympics inspired them to take up a new sport or recreation activity, and similarly the 14% who say that they have increased the amount of time spent being physically active since the Games8.
However, amongst clubs that run parallel sessions (n=182), two in ten (22%) saw an increase that has been sustained with increases across both their disabled and non-disabled members.
Of the clubs that reported a sustained increase in members (n=321), 85% are Olympic or Paralympic sports and there seems to be greater evidence for inspiring the younger generation with more new junior members than adults.
The average of these clubs has 94 participating adult members in 2013, with 13 of these joining directly following the Games and one (8%) of these new adult members being disabled participants.
This Games related increase means that the average of these clubs has 12 more adult participants than the overall UK average club.
8 YouGov (2013), ‘Olympics’ .
JUNIOR MEMBERSHIP LEVELS ARE 15 MEMBERS HIGHER THAN IN THE AVERAGE UK CLUB, WITH 105 JUNIOR MEMBERS IN 2013, 23 OF WHOM JOINED DIRECTLY FOLLOWING THE GAMES
24
Sports Club Survey | Membership numbers
This indicates that their larger junior memberships existed prior to a Games related surge and that their participating adult memberships were smaller pre-Games and are now on a par with the UK average club.
Clubs offering parallel sessions appear to have attracted higher proportions of disabled members following the Games, but again the majority of new members are non-disabled people.
Conversely, two in fve (41%) clubs told us that their membership didn’t increase noticeably after the Games, although this was as high as 61% in clubs specifcally for disabled people (n=47).
Amongst all clubs that reported no noticeable increase (n=1,006) when looking at their membership fgures, 42% experienced no change in their participating adult or junior membership levels between 2012 and 2013 compared to 48% who saw an increase in both.
Amongst clubs with increases in adult participating members who said that the Games had no noticeable impact on membership levels (n=442), one third (33%) experienced membership growth of 10% or less, just over a third (36%) an increase of between 11% and 20% and the remaining 31% growth of more than 21%.
This suggests that for around seven in ten clubs which said the Games had no noticeable impact (n=1,006), adult participating membership growth was minimal.
For around three in ten, membership increased by more than 11% but that was not felt by these clubs to be a noticeable change, suggesting this is a rate of growth they have been experiencing for some time or that perhaps occurred prior to the Games.
For clubs which stated that there was no noticeable impact from the Games but with membership fgures showing an increase in junior members between 2012 and 2013 (n=360) – one in four (25%) saw their junior membership increase by less than 10%, one in three (32%) by between 11% and 20%, and two in fve (43%) by more than 20%.
Although higher proportions of clubs have seen greater membership increases amongst their juniors, fewer clubs which answered ‘no noticeable increase’ saw a change in their junior membership.
These fgures again equate to just under three in ten clubs stating ‘no noticeable impact’ (n=1,006) seeing an increase of more than 10% in their junior membership levels, which their answer would indicate was to be expected and not related to the Games.
These membership fgures, demonstrating the actual changes occurring in clubs which believed the Games to have no noticeable impact, reinforce their statement with the majority experiencing no, or little change, and a small proportion experiencing membership increases which they do not feel is attributable to the Games.
25
This is perhaps because it reflects a steady rate of growth they’ve been experiencing over a longer period, due to the timing of growth, or other external factors which may have allowed them to increase membership fgures.
This suggests that for many clubs the benefts of the Games have genuinely not been felt.
One in fve clubs (21%) didn’t feel able to summarise changes around membership given the seasonal nature of their sport and the times of year at which they recruit members, highlighting one of the methodological diffculties with trying to quantify the impact of the Games.
Somewhat surprisingly, a further one in fve clubs (21%) told us that none of the answer options we posed to them applied9.
Follow-up research with those who stated ‘none of the above’ revealed that many clubs which chose this answer did not feel comfortable associating their answer with the Games.
The most common reasons for this were that they were either not an Olympic or Paralympic sport, or had been implementing their own initiatives to drive up participation, although many other reasons were provided relating to changes in facility access and provision, coach availability and so on.
9 The answer options provided for this question were, ‘our membership increased directly after the Games and most of these new members have remained at the club’, ‘our membership increased directly after the Games but most of these new members have since left the club’, ‘our membership didn’t increase noticeably after the Games’, ‘our membership decreased noticeably after the Games’, ‘we’re a seasonal sport so it’s hard to say’, ‘none of the above’ and a ‘don’t know’ option.
Around a quarter (23%) of responses indicated that their answer genuinely fell into the ‘none of the above’ category, for example because the club was newly established or undergoing signifcant change at the time, or knew that changes in membership were based on relationships with local schools or other organisations.
Amongst clubs which answered ‘none of the above’ (n=511), just under half (49%) saw some increase in their membership numbers (both adult participating and junior members) whilst two in fve (39%) saw no change at all and just over one in ten (12%) had decreases in both.
A considerable 77% of clubs which chose to answer none of the above but had increases in their junior members (n=213) have had an increase of 11% or higher in their junior memberships between 2012 and 2013 with a similar 76% of those with increases in participating adults (n=224) seeing more than an 11% increase in adult participating members.
These fgures mean that around three in ten clubs which answered ‘none of the above’ saw an increase in junior membership (32%) and adult participating membership (30%) in 2013 that was greater than a 10% increase on 2012.
26

Sports Club Survey | Membership numbers
Combined with the additional feedback from clubs in this category, this would suggest that answers given here are a combination of other external factors making it impossible to isolate the impact of the Games, or that in fact, there was no noticeable increase after the Games.
Many clubs within this answer appear to have interpreted this last statement as suggesting causality with the Games, instead choosing to say ‘none of the above’ to convey that any increases they experienced were unrelated to the Games.
This reluctance to make an association with the Games has been a surprising
FOR ONE IN FIVE CLUBS, THE IDEA OF A LEGACY IS NOT WELL RECEIVED AND THEY DO NOT BELIEVE IT TO BE IN EXISTENCE
fnding but is a subjective opinion from the perspective of the club and does not capture the motivation behind individuals joining.
These arguments also simplify the ways in which the Games may have brought about participation benefts as improvements to facilities, or the training of new coaches for example which ultimately led to more participants, may have been possible due to funding made available as a result of the Games.
What this does highlight however, is that for one in fve clubs, the idea of a legacy is not well received and they do not believe it to be in existence, regardless of any changes or otherwise to their membership levels.
27

FINANCES
SECTION 04

FINANCES
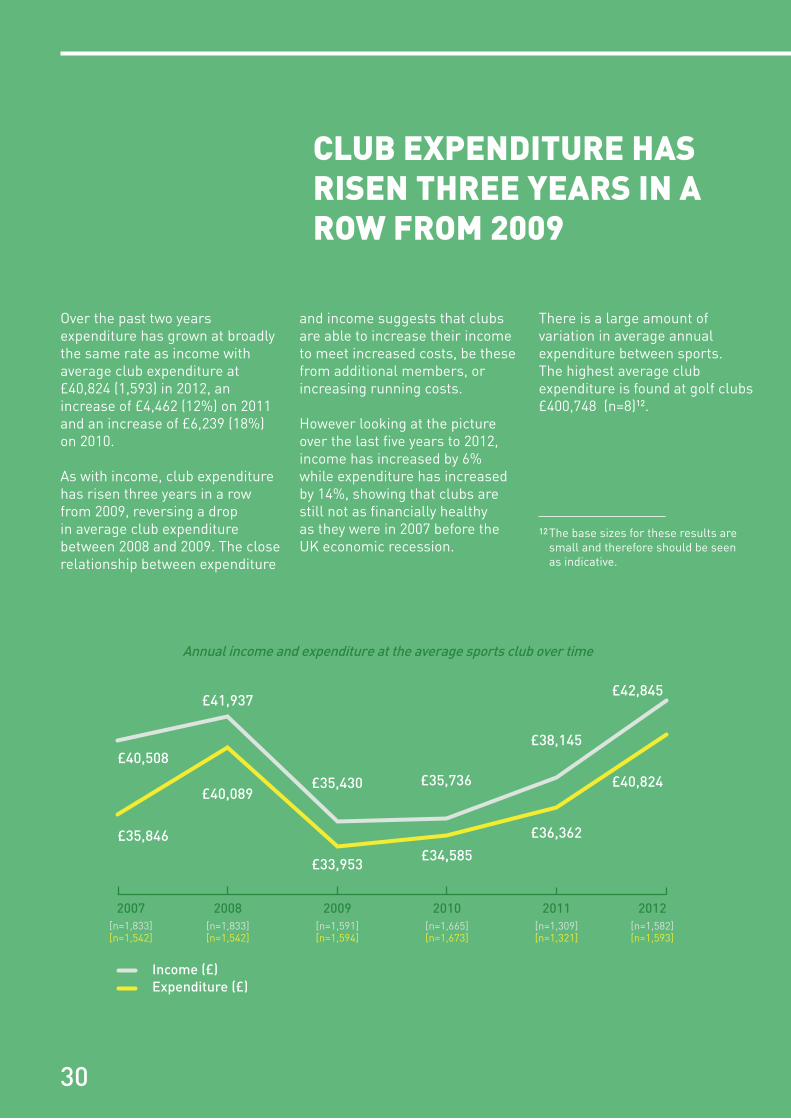
Since 2009 club income has risen for three years in a row – the average club now has an income of £42,845. However, over the two years from 2010 to 2012 expenditure has grown at broadly the same rate as income, now standing at £40,824.
Average club surplus over the same time has increased by 67% and is now £1,825. Positive as this is, average club surplus remains 39% lower than it was in 2007 and nearly nine in ten clubs (84%) have been actively trying to reduce expenditure or increase income in the last year.
As in 2010, just under half of UK clubs (48%) are running at a surplus but encouragingly the number of clubs breaking even has risen from 23% to 28% whilst those at a deficit have dropped from 28% to 24%.
INCOME AND EXPENDITURE10
Average club income has increased to £42,845 in 201211, an increase of £4,700 (12%) on 2011 and an increase of £7,109 (20%) over two years from £35,736 in 2010. Encouragingly this means that club income has risen three years in a row from 2009, reversing a drop in average club income seen between 2008 and 2009.
Nine in ten sports clubs which responded to the survey are not for proft clubs and therefore are likely to need to cover their yearly expenditure costs from their income and will reinvest any excess of income over expenditure in the club (n=2900).
Five per cent of the clubs responding were incorporated companies and may, although not necessarily, aim to generate a proft (n=2900). Over four out of fve clubs (84%) have taken at least one measure in the past 12 months to increase income or decrease expenditure and these measures tended to focus on increasing income rather than limiting their expenditure, so that the focus is around growth.
Sports Club Survey | Finances
10Total level fndings for 2012 income and expenditure are based on weighted data from 1,582 and 1,593 clubs respectively. Total level fndings for 2011 income and expenditure are based on weighted data from 1,309 and 1,321 clubs respectively.
11The years asked about in the survey relate to the club’s last full fnancial year and the one before this. These are assumed to be 2012 and 2011 respectively for the 2013 Sports Club Survey, either as calendar years or fnancial years. Where clubs provided a date for the end of their last fnancial year end, for eight out of ten clubs this included expenditure in 2012 suggesting that in the majority of instances this assumption is appropriate.
29
£35,846
2007 2008 2009 2010
£40,508
Income (£)Expenditure (£)
2011 2012
[n=1,542][n=1,833]
£41,937
[n=1,833]
£40,089
[n=1,542]
£35,430
[n=1,591]
£35,736
[n=1,665] [n=1,309]
£33,953
[n=1,594]
£34,585
[n=1,673]
£36,362
[n=1,321][n=1,582][n=1,593]
£38,145
£40,824
£42,845
Annual income and expenditure at the average sports club over time
Over the past two years expenditure has grown at broadly the same rate as income with average club expenditure at £40,824 (1,593) in 2012, an increase of £4,462 (12%) on 2011 and an increase of £6,239 (18%) on 2010.
As with income, club expenditure has risen three years in a row from 2009, reversing a drop in average club expenditure between 2008 and 2009. The close relationship between expenditure
and income suggests that clubs are able to increase their income to meet increased costs, be these from additional members, or increasing running costs.
However looking at the picture over the last fve years to 2012, income has increased by 6% while expenditure has increased by 14%, showing that clubs are still not as fnancially healthy as they were in 2007 before the UK economic recession.
12The base sizes for these results are small and therefore should be seen as indicative.
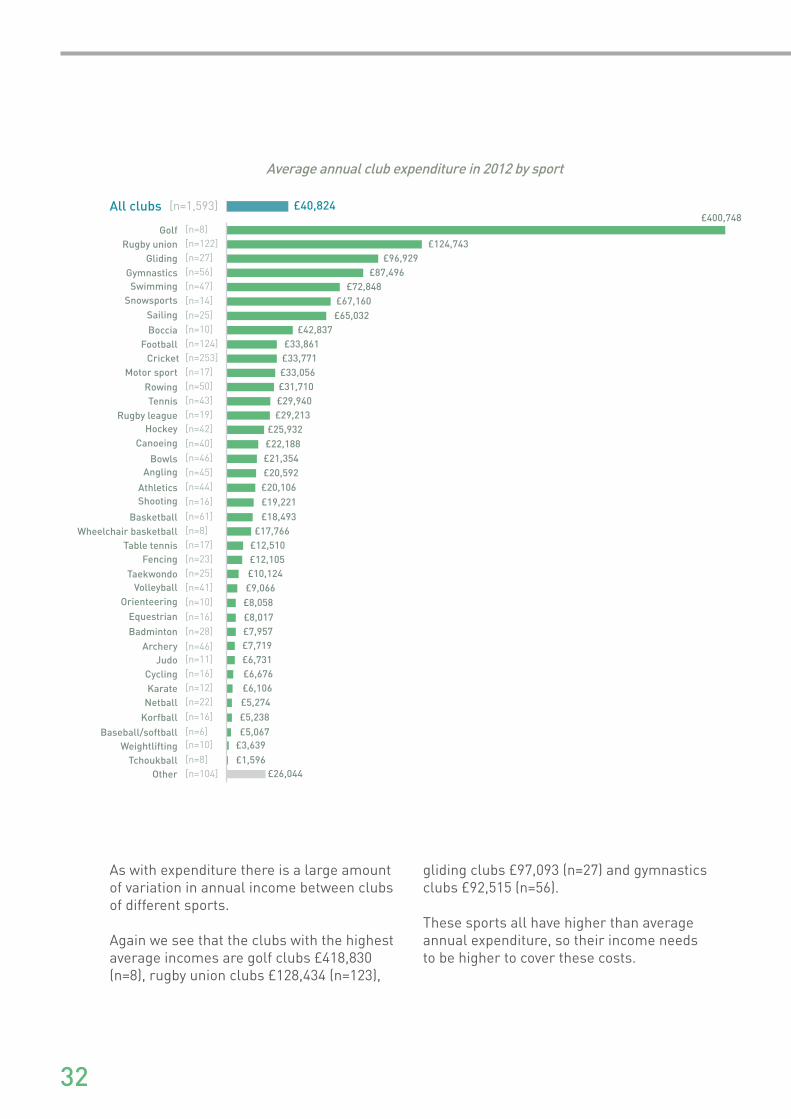
There is a large amount of variation in average annual expenditure between sports. The highest average club expenditure is found at golf clubs £400,748 (n=8)12.
CLUB EXPENDITURE HAS RISEN THREE YEARS IN A ROW FROM 2009
30
Sports Club Survey | Finances
Although the base size for golf clubs is small, this result is consistent with previous Sport and Recreation Alliance Sports Club Surveys where golf clubs have had the highest expenditure and income, underlining the more commercial model of many golf clubs and the greater expenses of maintaining large golf courses.
The next highest levels of average club expenditure are from rugby union clubs £124,743 (n=122), gliding clubs £96,929 (n=27), gymnastics clubs £87,496 (n=56) and swimming clubs £72,848 (n=47).
Gliding and rugby union clubs are more likely to own or long term lease their facilities, and less likely to hire than the average club and therefore facility ownership may be contributing to the increased expenditure here.
Looking at money spent in the club on hiring facilities in 2012, the average annual amount spent on hiring at swimming clubs £37,992 (n=41) and gymnastics clubs £10,349 (n=45) is above the all club average £5,224 (n=992) and this will increase average overall expenditure. Both these sports are also likely to want access to facilities multiple times a week.
Additionally swimming, gymnastics and rugby union clubs are the top three sports included in the survey for average junior membership size. This means that expenditure is likely to be higher because junior members are more likely to require a greater number of sessions, coaches and equipment.
The lowest average club expenditure is at tchoukball clubs £1,596 (n=8), weightlifting clubs £3,639 (n=10), baseball/softball clubs £5,067 (n=6) and korfball clubs £5,238 (n=16). These sports have lower average numbers of junior and adult participating members than the averages for all clubs and this may be one of the factors contributing to lower average club expenditure.
JUNIOR MEMBERS ARE MORE LIKELY TO REQUIRE A GREATER NUMBER OF SESSIONS, COACHES AND EQUIPMENT
31
All clubs £40,824[n=1,593]
Golf£400,748
[n=8]Rugby union £124,743[n=122]
Gliding £96,929[n=27]
Gymnastics £87,496[n=56]Swimming £72,848[n=47]
Snowsports £67,160[n=14]Sailing £65,032[n=25]Boccia £42,837[n=10]
Football £33,861[n=124]Cricket £33,771[n=253]
Motor sport £33,056[n=17]
Rowing £31,710[n=50]Tennis £29,940[n=43]
Rugby league £29,213[n=19]Hockey £25,932[n=42]
Canoeing £22,188[n=40]
Bowls £21,354[n=46]Angling £20,592[n=45]
Athletics £20,106[n=44]Shooting £19,221[n=16]
Basketball £18,493[n=61]Wheelchair basketball £17,766[n=8]
Table tennis £12,510[n=17]Fencing £12,105[n=23]
Taekwondo £10,124[n=25]Volleyball £9,066[n=41]
Orienteering £8,058[n=10]Equestrian £8,017[n=16]
£7,957[n=28]BadmintonArchery £7,719[n=46]
Judo £6,731[n=11]Cycling £6,676[n=16]
Karate £6,106[n=12]Netball £5,274[n=22]
Korfball £5,238[n=16]
Baseball/softball £5,067[n=6]Weightlifting £3,639[n=10]
Tchoukball £1,596[n=8]Other £26,044[n=104]
Average annual club expenditure in 2012 by sport
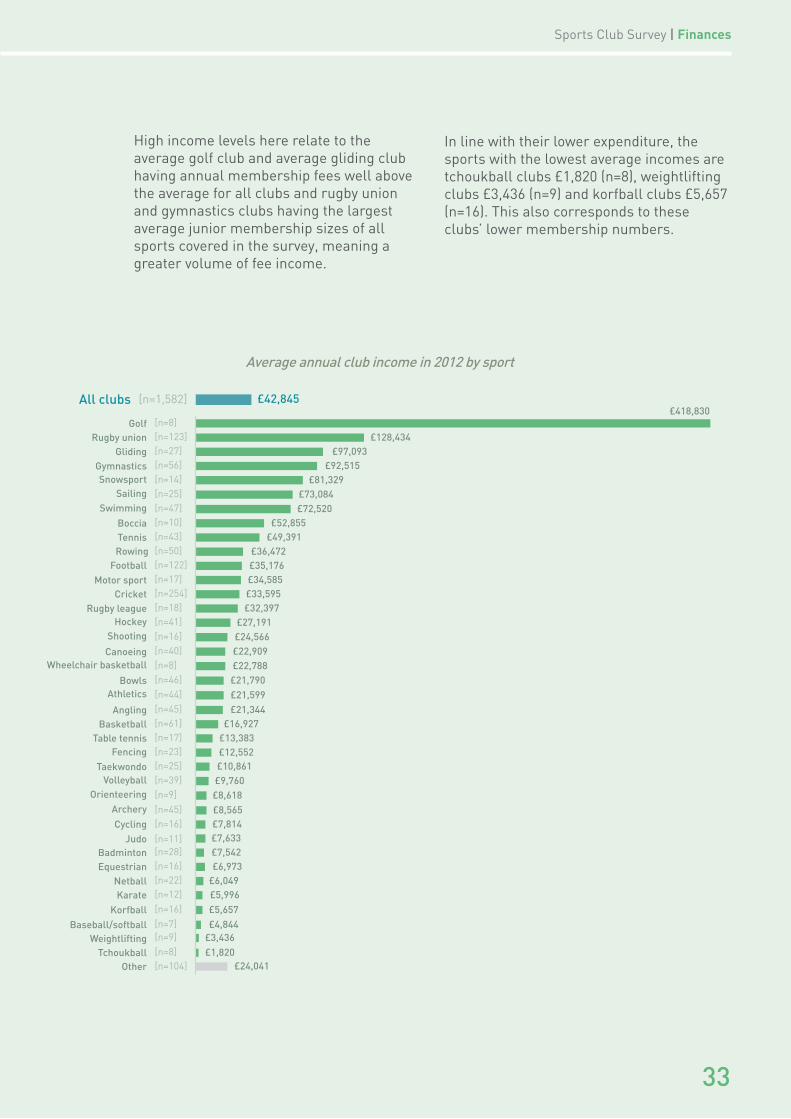
As with expenditure there is a large amount of variation in annual income between clubs of different sports.
Again we see that the clubs with the highest average incomes are golf clubs £418,830 (n=8), rugby union clubs £128,434 (n=123),
gliding clubs £97,093 (n=27) and gymnastics clubs £92,515 (n=56).
These sports all have higher than average annual expenditure, so their income needs to be higher to cover these costs.
32
Sports Club Survey | Finances
High income levels here relate to the average golf club and average gliding club having annual membership fees well above the average for all clubs and rugby union and gymnastics clubs having the largest average junior membership sizes of all sports covered in the survey, meaning a greater volume of fee income.
In line with their lower expenditure, the sports with the lowest average incomes are tchoukball clubs £1,820 (n=8), weightlifting clubs £3,436 (n=9) and korfball clubs £5,657 (n=16). This also corresponds to these clubs’ lower membership numbers.
All clubs £42,845[n=1,582]
Golf£418,830
[n=8]Rugby union £128,434[n=123]
Gliding £97,093[n=27]
Gymnastics £92,515[n=56]Snowsport £81,329[n=14]
Sailing £73,084[n=25]Swimming £72,520[n=47]
Boccia £52,855[n=10]Tennis £49,391[n=43]Rowing £36,472[n=50]
Football £35,176[n=122]
Motor sport £34,585[n=17]Cricket £33,595[n=254]
Rugby league £32,397[n=18]Hockey £27,191[n=41]
Shooting £24,566[n=16]
Canoeing £22,909[n=40]Wheelchair basketball £22,788[n=8]
Bowls £21,790[n=46]Athletics £21,599[n=44]
Angling £21,344[n=45]Basketball £16,927[n=61]
Table tennis £13,383[n=17]Fencing £12,552[n=23]
Taekwondo £10,861[n=25]Volleyball £9,760[n=39]
Orienteering £8,618[n=9]Archery £8,565[n=45]
£7,814[n=16]CyclingJudo £7,633[n=11]
Badminton £7,542[n=28]Equestrian £6,973[n=16]
Netball £6,049[n=22]Karate £5,996[n=12]
Korfball £5,657[n=16]
Baseball/softball £4,844[n=7]Weightlifting £3,436[n=9]
Tchoukball £1,820[n=8]Other £24,041[n=104]
Average annual club income in 2012 by sport
33
CLUBS IN SURPLUS, DEFICIT AND BREAKING EVEN13
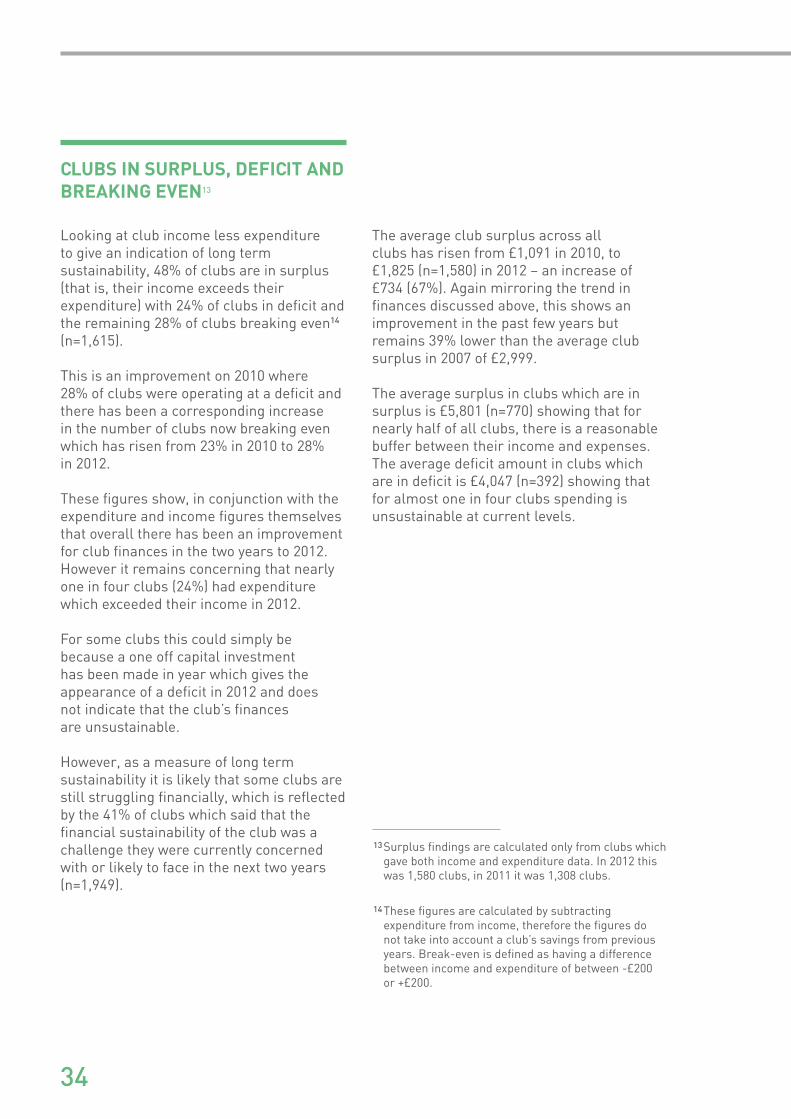
Looking at club income less expenditure to give an indication of long term sustainability, 48% of clubs are in surplus (that is, their income exceeds their expenditure) with 24% of clubs in defcit and the remaining 28% of clubs breaking even14 (n=1,615).
This is an improvement on 2010 where 28% of clubs were operating at a defcit and there has been a corresponding increase in the number of clubs now breaking even which has risen from 23% in 2010 to 28% in 2012.
These fgures show, in conjunction with the expenditure and income fgures themselves that overall there has been an improvement for club fnances in the two years to 2012. However it remains concerning that nearly one in four clubs (24%) had expenditure which exceeded their income in 2012.
For some clubs this could simply be because a one off capital investment has been made in year which gives the appearance of a defcit in 2012 and does not indicate that the club’s fnances are unsustainable.
However, as a measure of long term sustainability it is likely that some clubs are still struggling fnancially, which is reflected by the 41% of clubs which said that the fnancial sustainability of the club was a challenge they were currently concerned with or likely to face in the next two years (n=1,949).
The average club surplus across all clubs has risen from £1,091 in 2010, to £1,825 (n=1,580) in 2012 – an increase of £734 (67%). Again mirroring the trend in fnances discussed above, this shows an improvement in the past few years but remains 39% lower than the average club surplus in 2007 of £2,999.
The average surplus in clubs which are in surplus is £5,801 (n=770) showing that for nearly half of all clubs, there is a reasonable buffer between their income and expenses. The average defcit amount in clubs which are in defcit is £4,047 (n=392) showing that for almost one in four clubs spending is unsustainable at current levels.
13Surplus fndings are calculated only from clubs which gave both income and expenditure data. In 2012 this was 1,580 clubs, in 2011 it was 1,308 clubs.
14These fgures are calculated by subtracting expenditure from income, therefore the fgures do not take into account a club’s savings from previous years. Break-even is defned as having a difference between income and expenditure of between -£200 or +£200.
34

Sports Club Survey | Finances
-12%-13%
-6%-13%
-20%-22%
-30%-12%
-14%-17%
-19%-28%
-31%-7%
-23%-33%
-26%-10%
-25%-36%
-25%-29%
-16%-24%
-21%-33%
-45%-37%
-35%-23%
-38%-18%
-43%-25%
31%-40%
-34%-29%
All clubs 48%-24%[n=1,615]
Tennis 79%[n=43]Golf 75%[n=8]
Shooting 69%[n=16]
Netball 65%[n=23]Gymnastics 63%[n=56]
Table tennis 61%[n=18]Fencing 61%[n=23]Korfball 59%[n=17]
Baseball/softball 57%[n=7]Athletics 57%[n=46]
Cycling 56%[n=16]
Sailing 56%[n=25]Angling 53%[n=45]
Snowsports 53%[n=15]Rowing 50%[n=52]
Bowls 50%[n=46]
Hockey 50%[n=42]Boccia 50%[n=10]
Tchoukball 50%[n=8]Archery 49%[n=45]
Rugby union 49%[n=129]Canoeing 49%[n=41]
Taekwondo 48%[n=25]Motor sports 47%[n=17]
Football 46%[n=125]Wheelchair basketball 44%[n=9]
Swimming 43%[n=47]Gliding 41%[n=27]
40%[n=254]CricketVolleyball 39%[n=39]
Equestrian 38%[n=16]Judo 36%[n=11]
Rugby league 33%[n=21]Weightlifting 33%[n=12]
Karate 31%[n=13]
Orienteering 30%[n=10]Basketball 30%[n=61]
Badminton 29%[n=28]
Percentage of clubs in surplus and deficit by sport (2012)
Sports where the highest proportion of clubs had income exceeding expenditure in 2012, thus creating a surplus in year, are tennis 79% (n=43) and golf 75% (n=8).
Sports with the highest proportion of clubs with expenditure exceeding income in 2012, thus creating a defcit in year, were swimming/aquatics/diving 45% (n=47) and rugby league 43% (n=21).
35
MANAGING INCOME AND EXPENDITURE 15
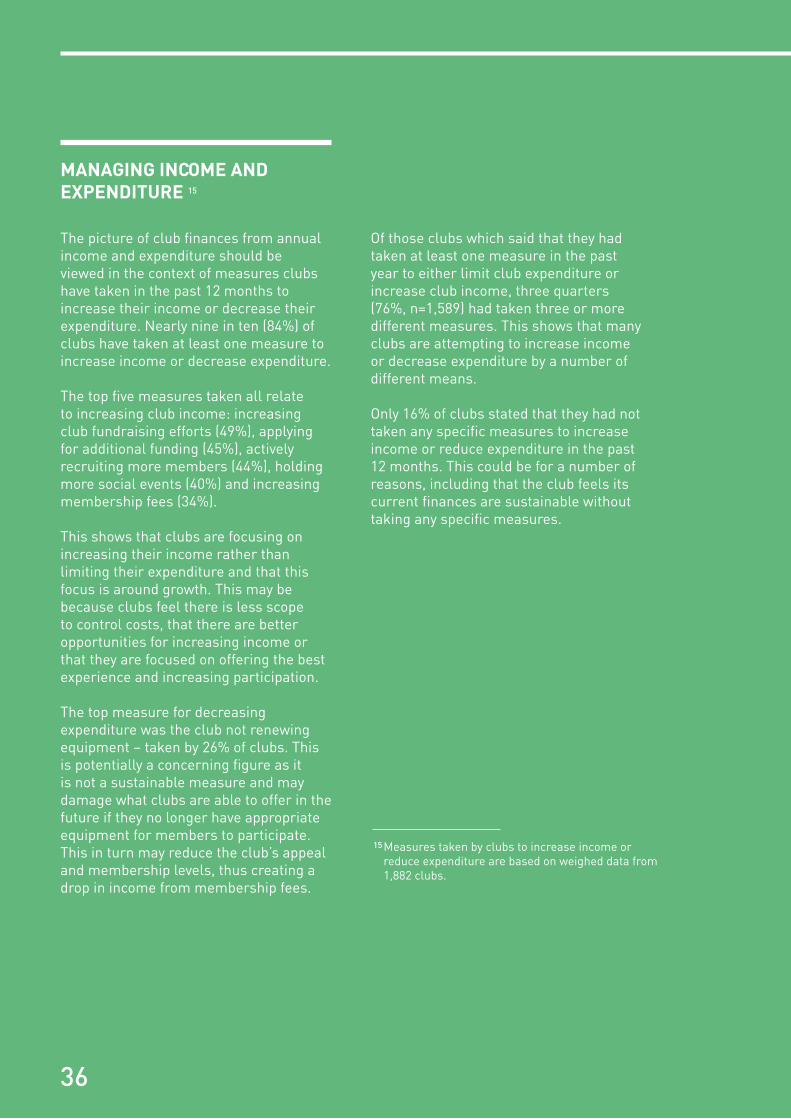
The picture of club fnances from annual income and expenditure should be viewed in the context of measures clubs have taken in the past 12 months to increase their income or decrease their expenditure. Nearly nine in ten (84%) of clubs have taken at least one measure to increase income or decrease expenditure.
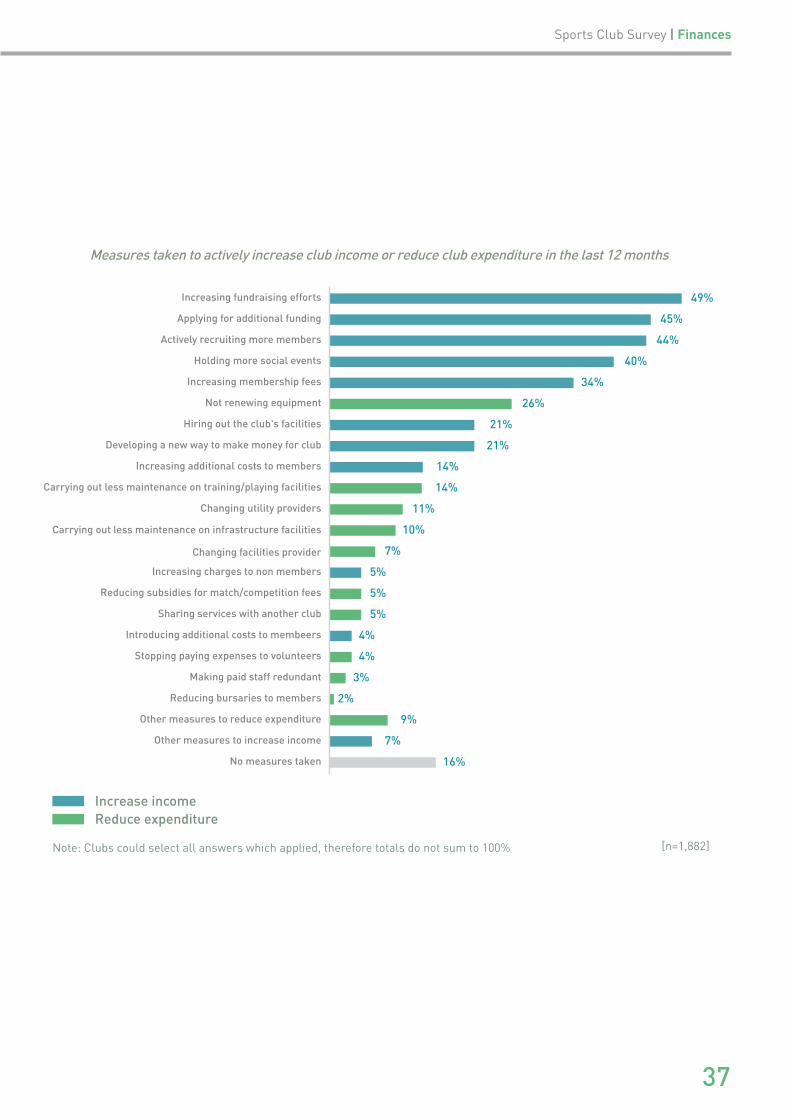
The top fve measures taken all relate to increasing club income: increasing club fundraising efforts (49%), applying for additional funding (45%), actively recruiting more members (44%), holding more social events (40%) and increasing membership fees (34%).
This shows that clubs are focusing on increasing their income rather than limiting their expenditure and that this focus is around growth. This may be because clubs feel there is less scope to control costs, that there are better opportunities for increasing income or that they are focused on offering the best experience and increasing participation.
The top measure for decreasing expenditure was the club not renewing equipment – taken by 26% of clubs. This is potentially a concerning fgure as it is not a sustainable measure and may damage what clubs are able to offer in the future if they no longer have appropriate equipment for members to participate. This in turn may reduce the club’s appeal and membership levels, thus creating a drop in income from membership fees.
Of those clubs which said that they had taken at least one measure in the past year to either limit club expenditure or increase club income, three quarters (76%, n=1,589) had taken three or more different measures. This shows that many clubs are attempting to increase income or decrease expenditure by a number of different means.
Only 16% of clubs stated that they had not taken any specifc measures to increase income or reduce expenditure in the past 12 months. This could be for a number of reasons, including that the club feels its current fnances are sustainable without taking any specifc measures.
15Measures taken by clubs to increase income or reduce expenditure are based on weighed data from 1,882 clubs.
36
Sports Club Survey | Finances
Note: Clubs could select all answers which applied, therefore totals do not sum to 100%
Increasing fundraising efforts 49%
Actively recruiting more members 44%
Holding more social events 40%
Increasing membership fees 34%
Not renewing equipment 26%
Hiring out the club's facilities 21%
Developing a new way to make money for club 21%
Increasing additional costs to members 14%
Carrying out less maintenance on training/playing facilities 14%
Applying for additional funding 45%
Changing utility providers 11%
Changing facilities provider 7%
Increasing charges to non members 5%
Reducing subsidies for match/competition fees 5%
Sharing services with another club 5%
Introducing additional costs to membeers 4%
Stopping paying expenses to volunteers 4%
Making paid staff redundant 3%
Reducing bursaries to members 2%
Other measures to reduce expenditure 9%
Other measures to increase income 7%
No measures taken 16%
Carrying out less maintenance on infrastructure facilities 10%
Measures taken to actively increase club income or reduce club expenditure in the last 12 months
Increase income Reduce expenditure
[n=1,882]
37

MEMBERSHIP FEES 16
Around one third of clubs (34%) said that in the last year they had taken the measure of increasing membership fees in order to increase club income. Despite this, the extent of membership fee growth has been limited over the past fve years. At the average club the annual membership fee for adult participating members in 2013 is £78. This is an increase of £5 (7%) on 2012 when the fee was £73.
For the average club, the participating adult annual membership fee has increased by only £8 (11%) between 2008 and 2013. The annual membership fee for junior members at the average sports club in 2013 is £46, an increase of £2 (5%) on 2012. This sees the junior membership fee returning to similar levels to 2007 when it was £47, having risen to £50 in 2010 and £52 in 201117.
The fluctuation in the junior annual membership fee reflects the fluctuation in the average club’s junior membership numbers and this could show that clubs are reducing their membership fees to attract more junior members.
The membership fee for non-participating adult members at the average club in 2013 is £14 (n=2,008) against £13 in 2012 (n=1,977), showing that there has been little change in social membership fees in the last year.
As in previous Sports Club Surveys the sport where the average club has the highest participating adult membership fee is golf £549 (n=12). This is likely to reflect the associated costs of facilities and the fact that many golf clubs run as commercial businesses.
The next highest fees are found at the average gliding club £317 (n=34), rowing club £191 (n=91), tennis club £155 (n=76) and fencing club £137 (n=27). By comparison orienteering clubs £10 (n=11), boccia clubs £12 (n=13), equestrian/horse riding clubs £15 (n=27) and tchoukball clubs £16 (n=9) on average have the lowest adult participating membership fees.
117In previous Sports Club Surveys, clubs were asked about the fees for junior participants whereas in 2013 the survey asked about junior membership fees. This means the data is not entirely comparable between 2013 and previous years although it is likely to be indicative given that junior memberships are predominantly participating.
16Total level fndings for membership fees in 2013 are based on weighted data from 2,258 clubs for adults and 2,285 clubs for juniors. Total level fndings for membership fees in 2012 are based on weighted data from 2,232 clubs for adults and 2,245 clubs for juniors.
38

Sports Club Survey | Finances
The highest junior membership fees are found at the average swimming club £138 (n=53), fencing club £107 (n=27), rowing club £97 (n=89), golf club £96 (n=12) and basketball club £91 (n=78). By comparison,
the lowest fees for junior members are found at the average orienteering club £3 (n=11), boccia club £3 (n=11), tchoukball club £3 (n=5) and motor sport club £3 (n=19).
All clubs £78[n=2,258]
Golf £549[n=12]Gliding £317[n=34]Rowing £191[n=91]
Tennis £155[n=76]Fencing £137[n=27]Sailing £132[n=41]
Korfball £128[n=28]Hockey £125[n=65]
Volleyball £120[n=49]Squash £109[n=11]
Basketball £99[n=72]
Netball £99[n=32]Swimming £98[n=54]
Wheelchair basketball £96[n=10]Baseball/softball £91[n=9]
Rugby union £87[n=271]
Weightlifting £86[n=11]Archery £76[n=70]
Karate £75[n=15]Taekwondo £73[n=33]
Angling £73[n=66]Shooting £68[n=18]
Badminton £67[n=32]Cricket £62[n=374]
Snowsports £61[n=24]Bowls £61[n=90]
Rugby league £59[n=32]Table tennis £52[n=24]
£47[n=80]GymnasticsCanoeing £46[n=50]Triathlon £46[n=13]Athletics £37[n=60]
Football £34[n=161]Judo £23[n=17]
Cycling £19[n=22]
Motor sport £17[n=22]Tchoukball £16[n=9]
Equestrian £15[n=27]
Orienteering£12[n=13]Boccia
£10[n=11]Other £69[n=140]
Average adult participating membership fee by sport (2013 )
39
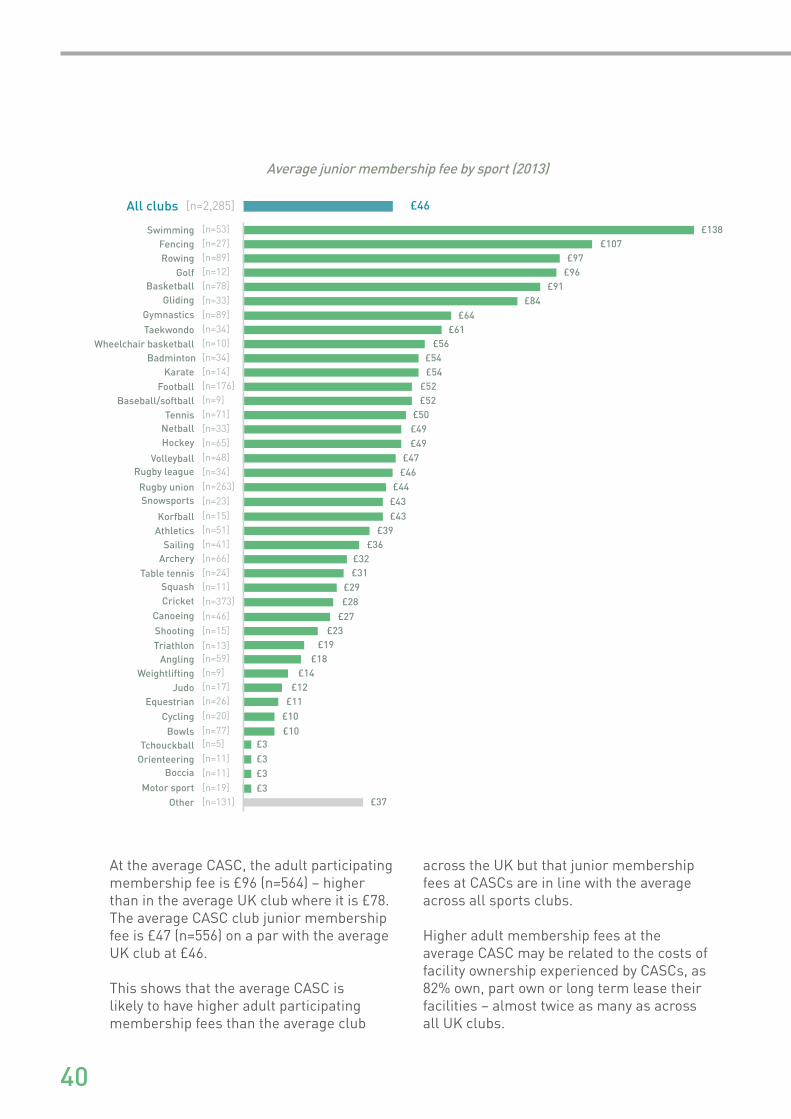
All clubs £46[n=2,285]
Swimming £138[n=53]Fencing £107[n=27]Rowing £97[n=89]
Golf £96[n=12]Basketball £91[n=78]
Gliding £84[n=33]Gymnastics £64[n=89]Taekwondo £61[n=34]
Wheelchair basketball £56[n=10]Badminton £54[n=34]
Karate £54[n=14]
Football £52[n=176]Baseball/softball £52[n=9]
Tennis £50[n=71]Netball £49[n=33]Hockey £49[n=65]
Volleyball £47[n=48]Rugby league £46[n=34]
Rugby union £44[n=263]Snowsports £43[n=23]
Korfball £43[n=15]Athletics £39[n=51]
Sailing £36[n=41]Archery £32[n=66]
Table tennis £31[n=24]Squash £29[n=11]Cricket £28[n=373]
Canoeing £27[n=46]£23[n=15]Shooting
Triathlon £19[n=13]Angling £18[n=59]
Weightlifting £14[n=9]
Judo £12[n=17]Equestrian £11[n=26]
Cycling £10[n=20]
Bowls £10[n=77]Tchouckball £3[n=5]
Orienteering £3[n=11]
Motor sport£3[n=11]Boccia
£3[n=19]Other £37[n=131]
Average junior membership fee by sport (2013)
At the average CASC, the adult participating membership fee is £96 (n=564) – higher than in the average UK club where it is £78. The average CASC club junior membership fee is £47 (n=556) on a par with the average UK club at £46.
This shows that the average CASC is likely to have higher adult participating membership fees than the average club
across the UK but that junior membership fees at CASCs are in line with the average across all sports clubs.
Higher adult membership fees at the average CASC may be related to the costs of facility ownership experienced by CASCs, as 82% own, part own or long term lease their facilities – almost twice as many as across all UK clubs.
40

Membership fees also vary by the facility status of the club. The adult participating membership fee at the average facility owning, part owning or long term leasing club is £110 (n=845), with the average club which hires or short term leases having participating adult fees of £64 (n=920) and a much lower £34 at the average club which uses public space (n=134).
The average club using a combination of facilities has adult participating member fees that lie somewhere in-between, at £53 (n=300). There is less variation in junior membership fees – with the average facility owning, part owning or long term leasing club (n=846) having junior fees of £43 and the average club that hires or short term leases (n=950) with junior fees of £52. Also the average club that uses a combination of facilities (n=296) has junior fees of £46 whilst the average club relying on public space came out a lot lower at £26 (n=134).
This shows that where clubs are able to use public space adult and junior fees are likely to be lower. This is probably because running costs for the location they train inare likely to be much lower when using
ONE THIRD OF CLUBS (34%) SAID THAT IN THE LAST YEAR THEY HAD TAKEN THE MEASURE OF INCREASING MEMBERSHIP FEES IN ORDER TO INCREASE CLUB INCOME
Sports Club Survey | Finances
In support of this, at £82 we see that participating adult member fees are much closer to the average UK club for the average CASC that does not own, part own or long term lease their facility (n=122). With larger memberships and more formalised structures resulting in more volunteers and paid staff, it is likely that beyond facility related costs, CASCs have additional staffng or volunteer related costs to pass on to members through their annual fees.
It is also possible that in order to keep junior fees low and increase junior participation, additional costs are sought through adult participating member fees.
41

18Based on sports where there were more than 20 responses to this question.
public space than for clubs which hire, lease, or own their facilities, with members ultimately not having to bear these additional facility related costs.
Over half (55%) of sports clubs told us that there are additional costs which members paid to participate at their club on a regular basis, while 19% of clubs told us that there are additional costs which members paid occasionally to participate (n=2,487).
The sports where additional costs to participate18 are most common are gliding 91% (n=33), cricket 85% (n=373), hockey 81% (n=66) and motor sports 81% (n=22). The sports with the highest proportion of clubs saying that they never have additional costs for members to participate are angling 55% (n=67), fencing 49% (n=33) and archery 46% (n=78).
For CASC scheme clubs (n=582), 59% told us that there are
additional costs which members pay regularly to participate – this is just above the weighted fgure for all clubs.
Amongst CASCs, 19% of clubs told us that there are additional costs which members paid occasionally – again this is on a par with the weighted fgure across all clubs. This suggests that CASCs aren’t more likely to charge additional costs than the average club.
Clubs with additional costs for members to regularly participate
55%
19%
26%
Members occasionally pay additional costs to participate
No additional costs for members to participate
Members regularly pay additional costs to participate
[n=2,487]
42
Sports Club Survey | Finances
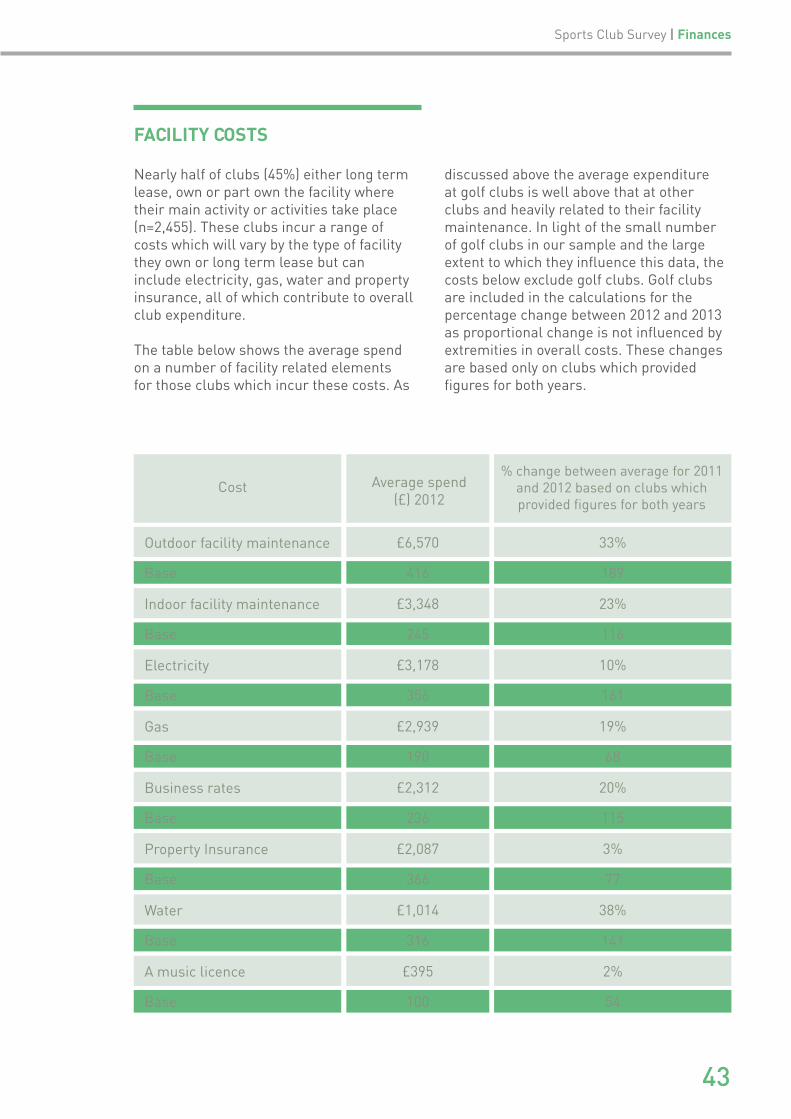
Nearly half of clubs (45%) either long term lease, own or part own the facility where their main activity or activities take place (n=2,455). These clubs incur a range of costs which will vary by the type of facility they own or long term lease but can include electricity, gas, water and property insurance, all of which contribute to overall club expenditure.
The table below shows the average spend on a number of facility related elements for those clubs which incur these costs. As
FACILITY COSTS
discussed above the average expenditure at golf clubs is well above that at other clubs and heavily related to their facility maintenance. In light of the small number of golf clubs in our sample and the large extent to which they influence this data, the costs below exclude golf clubs. Golf clubs are included in the calculations for the percentage change between 2012 and 2013 as proportional change is not influenced by extremities in overall costs. These changes are based only on clubs which provided fgures for both years.
Cost Average spend (£) 2012
% change between average for 2011 and 2012 based on clubs which provided fgures for both years
Outdoor facility maintenance £6,570 33%
Base 416 189
Indoor facility maintenance £3,348 23%
Base 245 116
Electricity £3,178 10%
Base 356 161
Gas £2,939 19%
Base 190 68
Business rates £2,312 20%
Base 236 115
Property Insurance £2,087 3%
Base 366 77
Water £1,014 38%
Base 316 141
A music licence £395 2%
Base 100 54
43
The table also shows the average percentage change experienced for these costs at clubs which provided data for both 2012 and 2011 within each expenditure item.
Between 2011 and 2012, clubs that own, part own, or long term lease their facilities have seen a 38% increase in their water costs with the average club which pays water bills spending £1,014 in 2012. As a proportion of their total expenditure this means that clubs with water bills have seen rises from 1.8% of their total expenditure in 2011 (n=129) to 2.7% in 2012 (n=308).
Over the same time, outdoor facility maintenance has also increased by a third (33%) and at £6,570 represents one of the largest facility outgoings for clubs, closely followed by indoor facility maintenance which cost the average club that undertakes it £3,348 in 2012 and has increased by 23% between 2011 and 2012.
Overall, the average club which pays business rates spent £2,312 on rates in 2012. However, the average spend on business rates is much lower for CASCs at just £1,525 (n=128) reflecting the mandatory 80% rate relief received by these clubs.
The average club which spends on gas spent £2,939 in 2012. On average in 2012 clubs spent 4.5% (n=183) of their expenditure on their gas bill, compared to 5.1% in 2011 (n=63). However, where clubs provided gas expenditure fgures for both 2011 and 2012 the average increase was 19% over the year suggesting that clubs are coming under pressure from increasing energy costs.
The average club which spends on electricity spent £3,178 in 2012. Where clubs provided data for both 2011 and 2012 there was an average increase of 10% (n=161) in cost from 2011 to 2012 demonstrating that electricity costs are also increasing for clubs, albeit not as steeply as gas.
Although the number of clubs which provided fgures for 2011 and 2012 for facility cost expenditures were not large, and therefore the percentage increases between the two years should be treated with caution, with the exception of music licences and property insurance all of the other costs showed on average above inflation increases19.
This suggests that the increasing energy and utility costs experienced elsewhere in the economy are also impacting on the costs of sports clubs. Furthermore, the impact of any upcoming changes to music licensing fees should not be underestimated.
19 Inflation average 3.2% a year between 2011 and 2012 as calculated using the Bank of England inflation calculator: http://www.bankofengland.co.uk/education/Pages/inflation/calculator/flash/default.aspx.
44
Sports Club Survey | Finances
RATE RELIEF
Her Majesty’s Revenue and Customs (HMRC) registered Community Amateur Sports Clubs (CASCs) are entitled to a mandatory 80% relief on their business rates. Local authorities are also able to grant discretionary relief for up to the remaining 20%. In addition, local authorities can grant rate relief of anywhere up to 100% to non-CASC registered sports clubs at their discretion.
Given rising cost pressures on facility owning clubs across the UK such as energy prices, both mandatory and discretionary rate relief are important benefts – helping to support community sports clubs through reducing the costs of owning a facility.
Given the cuts currently faced by local authorities and anecdotal evidence from the sector we asked clubs whether they had experienced a reduction in their discretionary rate relief in the past 12 months or whether they had been given notice that their discretionary rate relief will be partially or entirely withdrawn in the future.
Nearly one in four CASCs (n=65) told us that they had either experienced a reduction in the past year or had been informed that some or all of their rate relief would be withdrawn in the next year. Fifteen per cent of CASCs told us that they used to receive a greater proportion of discretionary rate relief than they currently do, and 9% of CASCs said that they had been given notice that they will receive less in the future.
Across all clubs, 21%20 had either been told that they would have their relief partially or totally withdrawn in the next year (10%) or said that they used to receive a greater proportion 12% (n=135). These fgures show that a minority of clubs are experiencing cuts to an important means of fnancial support.
In keeping with the fndings of the Alliance’s report on discretionary business rate relief which found that only a small proportion of local authorities were reporting changes in policy or budgets for discretionary rate relief in the next year, the results of the Sports Club Survey suggest that cuts to discretionary rate relief are not currently as widespread as feared.
The introduction of the business rate retention scheme from April 2013 may impact on the proportion of clubs receiving these benefts in the future and therefore the 2015 and 2017 Sports Club Surveys will be useful for investigating if this is the case.
20The fgures do not sum up to 100% here as clubs were able to select as many situations as applied to them.
45
HIRING FACILITIES
Half of all clubs (49%) hire a facility – with the average club that hires (n=992) spending £5,224 on doing so in 2012. This amounts to an average of 47% of their expenditure on facility hire (n=758). This represents an increase of £231 (5%) on 2011 when the average club spent £4,993 on hiring (n=936), amounting on average to 47% of their expenditure (n=676).
Proportionally there has been no change in the percentage of expenditure the average club is spending on hiring facilities between 2011 and 2012 and the cost of facility hire remains a substantial part of many sports clubs’ expenditure.
However, the amount spent on facility hire is influenced by not only the cost of that hire, but the volume of hire by the club e.g. the number of sessions or venues hired. When asked about the cost of hiring facilities, 42% of clubs that hire said that their hire costs have increased a little in the past two years and 21% say that their facility hire costs have increased signifcantly in the past two years (n=1,113).
The experience of these 63% of clubs shows the cost pressures that clubs which hire experience and explains some of the rise in average club expenditure. If club incomes are unable to cover increasing expenditure costs it is possible that clubs will be forced to hire facilities less in order to keep costs constant. Ultimately this may lead to needing to turn away new members due to lack of training capacity.
Encouragingly though, nearly one in three clubs (31%) say that their facility hire costs have remained fairly constant in the past two years, against the rising costs experienced elsewhere in the economy.
THERE HAS BEEN NO CHANGE IN THE PERCENTAGE OF EXPENDITURE THE AVERAGE CLUB IS SPENDING ON HIRING FACILITIES BETWEEN 2011 AND 2012
46

Changes in the cost of facility hire over the last two years
26%
42%
31%
2%Decreased
Remained fairly constant
Increased a little
Increased significantly
None of the above 4% [n=1,113]
The impact of rising facility hire costs on members is evident in that across all clubs that hire facilities (n=967), 30% have increased their membership fees in the past year in order to increase club income, but this rises to 42% in clubs where facility hire costs have increased signifcantly in the past two years (n=198) and is as low as 12% in those clubs where facility costs have decreased in the past two years (n=23).
Equally, across all clubs which hire a facility 14% (n=967) say that they have increased additional costs to members in the past year, while this is as high as 24% in clubs where facility costs have increased signifcantly (n=198), and as low as 8% in clubs where facility costs have decreased in the past two years (n=23). This indicates that where clubs experience increases in their facility hire costs they are more likely to increase membership fees or pass costs on to members through other means.
Looking to the future, 47% of clubs (n=1949) told us that increased facility costs were
one of the challenges they are concerned about in the next two years. This increases to 54% of clubs when looking at those which hire (n=1,005) and is lower at 40% in those that own or part own facilities (n=388). This suggests that clubs which hire are slightly more likely to be concerned about increased facility costs than those which own or part own facilities. This could be related to a lack of control over hire costs compared to say switching utility provider to save money if the club owns the facility.
Only 2% of clubs which hire (n=1,113) said that their facility costs had decreased in the past two years. Of these clubs 61% (n=23) told us that they had changed facility provider in the past two years in order to reduce club expenditure, showing that they had actively moved facility provider in order to decrease this expenditure.
However, for many clubs this may not be a possibility due to lack of appropriate and available alternative, cheaper facilities.
47
Sports Club Survey | Finances

SECTION 05
CLUB SET-UP
CLUB SET-UP
Since 2011 there has been an encouraging 20% increase in the number of volunteers at the average sports club with 24 full or part time volunteers in 2013.
Nine of these are qualified coaches compared to one of the two full or part time members of paid staff.
Although nearly three in five clubs (59%) rate the equipment used at their club as good or very good quality, almost one in ten clubs (8%) lack access to appropriate equipment for neither disabled nor non-disabled people to participate fully whilst only one in three (35%) have access to appropriate equipment for both disabled and non-disabled people to participate fully.
VOLUNTEERS ANDPAID STAFF21
The London 2012 Olympic and Paralympic Games saw 70,000 Games Makers volunteering to make the staging of the Games a success, and the Government has also committed to delivering a volunteering legacy from the Games.
Positively then, the average sports club in 2013 has 24 full or part time volunteers, nine of whom are qualifed coaches. The average club also has two full or part time members of paid staff, one of whom is a qualifed coach. Encouragingly, club volunteers have increased by 20% since 201122 when there were 21 volunteers at the average club.
Yet despite this increase in volunteers, almost three in four clubs 73% (n=2,577) reported that no volunteers joined their club directly after the Games in July and August 2012.
Sports Club Survey | Club set-up
21 Total level fndings about number of volunteers are based on weighted data from 2,909 clubs. Total level fndings relating to paid staff are based on weighted data from 2,907 clubs.
22 All comparisons to 2011 refer to the 2011 Sport and Recreation Alliance Sports Club Survey.
THE AVERAGE SPORTS CLUB IN 2013 HAS 24 FULL OR PART TIME VOLUNTEERS, NINE OF WHOM ARE QUALIFIED COACHES
49
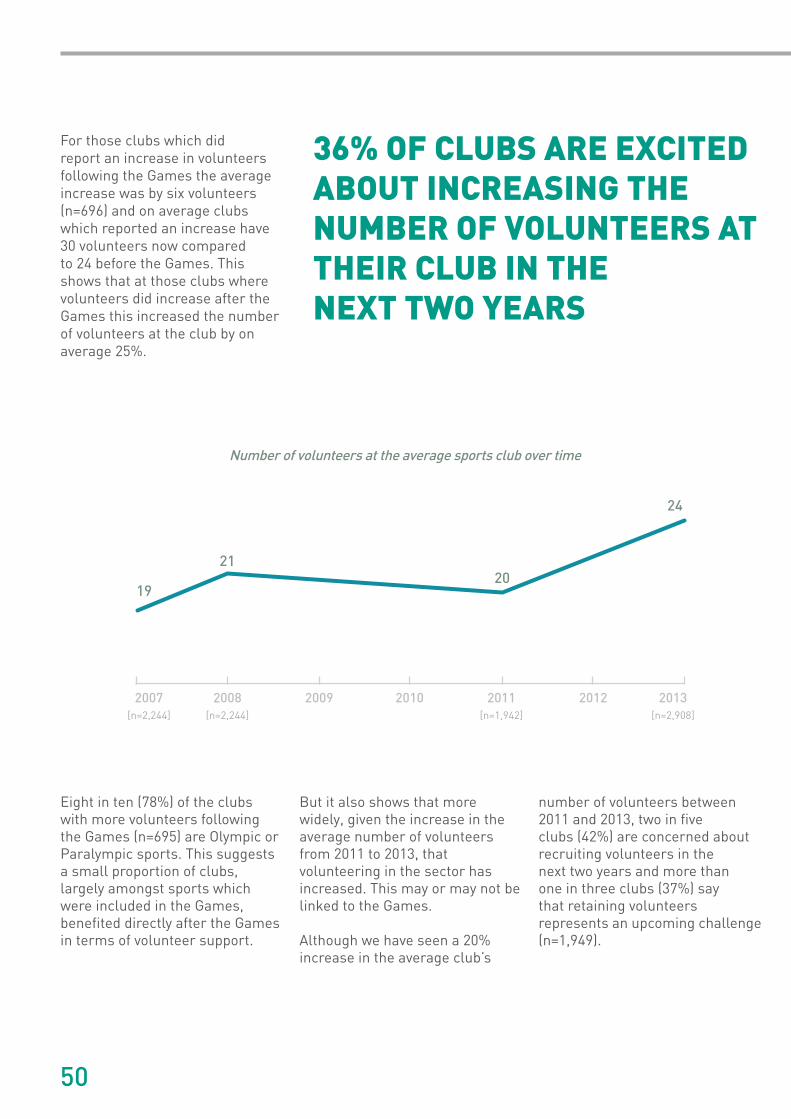
For those clubs which did report an increase in volunteers following the Games the average increase was by six volunteers (n=696) and on average clubs which reported an increase have 30 volunteers now compared to 24 before the Games. This shows that at those clubs where volunteers did increase after the Games this increased the number of volunteers at the club by on average 25%.
Eight in ten (78%) of the clubs with more volunteers following the Games (n=695) are Olympic or Paralympic sports. This suggests a small proportion of clubs, largely amongst sports which were included in the Games, benefted directly after the Games in terms of volunteer support.
But it also shows that more widely, given the increase in the average number of volunteers from 2011 to 2013, that volunteering in the sector has increased. This may or may not be linked to the Games.
Although we have seen a 20% increase in the average club’s
number of volunteers between 2011 and 2013, two in fve clubs (42%) are concerned about recruiting volunteers in the next two years and more than one in three clubs (37%) say that retaining volunteers represents an upcoming challenge (n=1,949).
36% OF CLUBS ARE EXCITED ABOUT INCREASING THE NUMBER OF VOLUNTEERS AT THEIR CLUB IN THE NEXT TWO YEARS
50
19
2007 2008 2009 2010
2120
24
2011 2012 2013[n=2,244] [n=2,244] [n=1,942] [n=2,908]
Number of volunteers at the average sports club over time
Encouragingly, 56% of those who see recruiting volunteers as a challenge (n=807) and 54% of those who see retaining volunteers as a challenge (n=710) also see increasing the number of volunteers at their club as an opportunity, with 36% of clubs (n=1902) excited about increasing the number of volunteers at their club in the next two years.
This shows that while there are concerns about retaining or recruiting volunteers there is also optimism about opportunities to recruit more volunteers in the future. Combined with the growth seen since 2011 this suggests that volunteering in the sector is looking healthier moving forward.
The number of part or full time paid staff at the average club has increased from one in 2011 to two in 2013 (n= 2,907). On average clubs have nine volunteers who are qualifed coaches (n=2,909) and one member of paid staff who is a qualifed coach (n=2,665).
Three in ten clubs (31%) identifed a lack of coaches to meet member demand as a challenge in the next two years and a similar number (30%) said that they were concerned about retaining coaches (n=1,949).
This shows that there is appetite amongst nearly a third of clubs for recruiting and similarly for retaining more qualifed coaches. This could be related to growing membership numbers at the average club, with clubs needing to provide coaching for more members. Future membership growth may therefore be limited without suffcient coaching resource. At the average club there are eight participating members (adult and/or junior) to one paid member of staff or volunteer in 2013 (n=2,856). However this varies by activity with for example, at the upper end, on average 26 participating members to one member of paid staff or volunteer at angling clubs (n=66) and at the lower end, an average of two participating club members to one member of paid staff or volunteer at gliding clubs (n=36).
Here, these sport specifc fgures are likely to reflect the relative level of supervision and/or coaching required by these different activities, and in the case of gliding for example, the higher risk nature of the sport.
Sports Club Survey | Club set-up
VOLUNTEERS AND PAID STAFF BY CLUB TYPE
Whilst the average club specifcally for disabled people (n=68) also has two members of full or part time paid staff, they only have 13 volunteers. However with fewer members, proportionally they have more volunteers or paid staff per participating member, with on average three members to one volunteer/paid member of staff.
The average club running parallel sessions for disabled and non-disabled people (n=215) has considerably more volunteer and paid staff resources with 37 and 6 people in these positions respectively.
51
In contrast to clubs specifcally for disabled people, with higher than average memberships within clubs running parallel sessions there are eight participating members to one volunteer/member of staff.
With 26 volunteers and two paid staff, clubs providing opportunities for disabled people and non-disabled people to take part together (n=1,326) have on average ten participating members to each volunteer or paid employee. Five (n=60) volunteers/staff at the average club specifcally for disabled people have received training to amend or adapt their sport for disabled participants, compared to two (n=2,567) volunteers/paid members of staff whom have received this training across all clubs.
This data could be misleading however as within a club specifcally for disabled people volunteers and staff may be fully trained at delivering their activity appropriately and not need further training to be more inclusive.
Of more note, fewer than one in ten volunteers/employees at clubs which provide opportunities for disabled and non-disabled people to participate together 7% (n=1,165) and clubs that provide parallel sessions for disabled people and non-disabled people 9% (n=192) have received training to amend and adapt their sport to make it more inclusive for disabled people.
This suggests that although these clubs do offer opportunities for disabled participants to participate in their activities, more could be done to ensure staff are able to make any adaptations required to participate fully.
EQUIPMENT23
Almost one in ten (8%) clubs lack access to appropriate equipment for anyone to participate fully in their sport. Only one in three clubs (35%) say that they have access to appropriate equipment for both disabled and non-disabled people to participate although this rises to 84% of clubs specifcally for disabled people (n=31).
More than half of clubs (56%) have access to appropriate equipment just for non-disabled people to participate. This amounts to nine in ten (89%) of all clubs which have access to appropriate equipment for non-disabled participants to take part in their activity, compared to three in ten 32% of all clubs having appropriate equipment for disabled people.
Unsurprisingly clubs specifcally for disabled participants have the fullest equipment provision for disabled participants with an encouraging 94% (n=42) stating that they have appropriate equipment for disabled participants to participate fully in their activity.
23 Total level fndings about equipment availability for disabled participants are based on weighted data from 1,973 clubs. Total level fndings about equipment availability for non-disabled participants are based on weighted data from 1,985 clubs. Findings about the quality of equipment are based on weighed data from 1,912 clubs.
52
One in three clubs 32% (n=1,961) said they would like to receive training and/or support to provide for disabled people to participate if it was offered at minimal cost by the sector – showing that there is an appetite among these clubs for understanding the needs of disabled participants better.
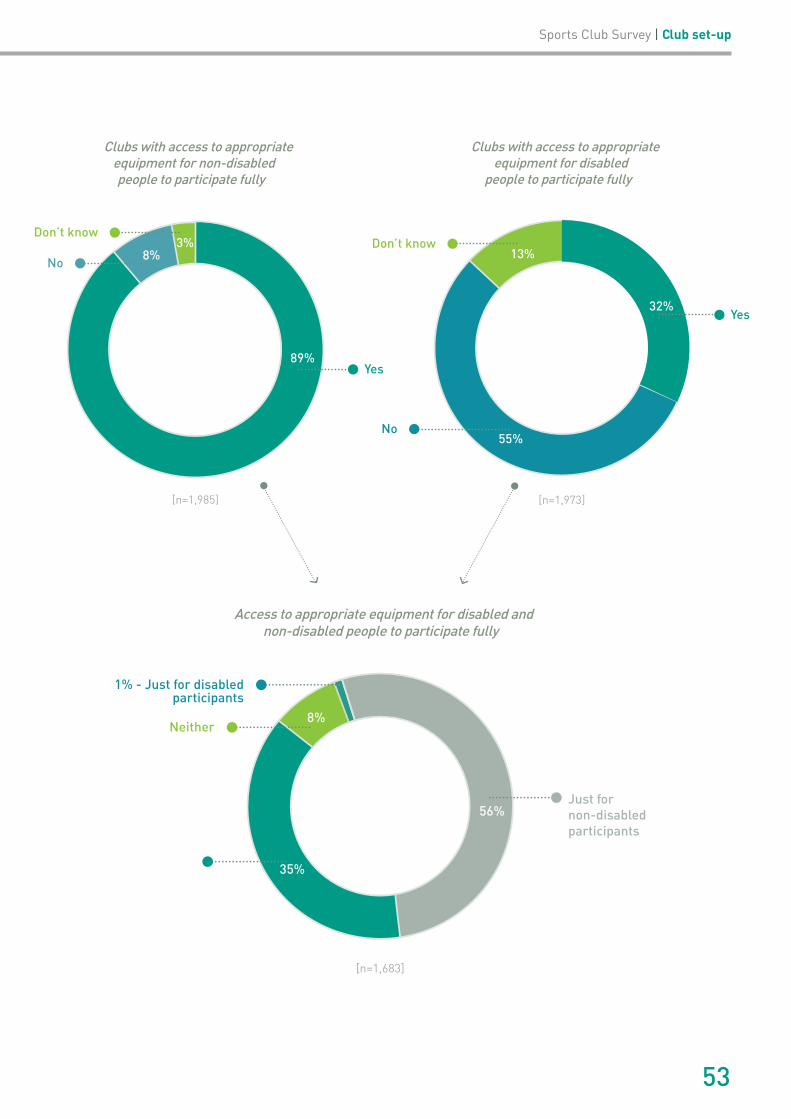
Sports Club Survey | Club set-up
Clubs with access to appropriate equipment for disabled
people to participate fully
Don’t know
No
Yes 32%
55%
13%
[n=1,973]
Clubs with access to appropriate equipment for non-disabled people to participate fully
89%
Don’t know
No
Yes
8%3%
[n=1,985]
Access to appropriate equipment for disabled and non-disabled people to participate fully
[n=1,683]
56%
35%
8%
Just for non-disabled participants
Neither
1% - Just for disabled participants
53
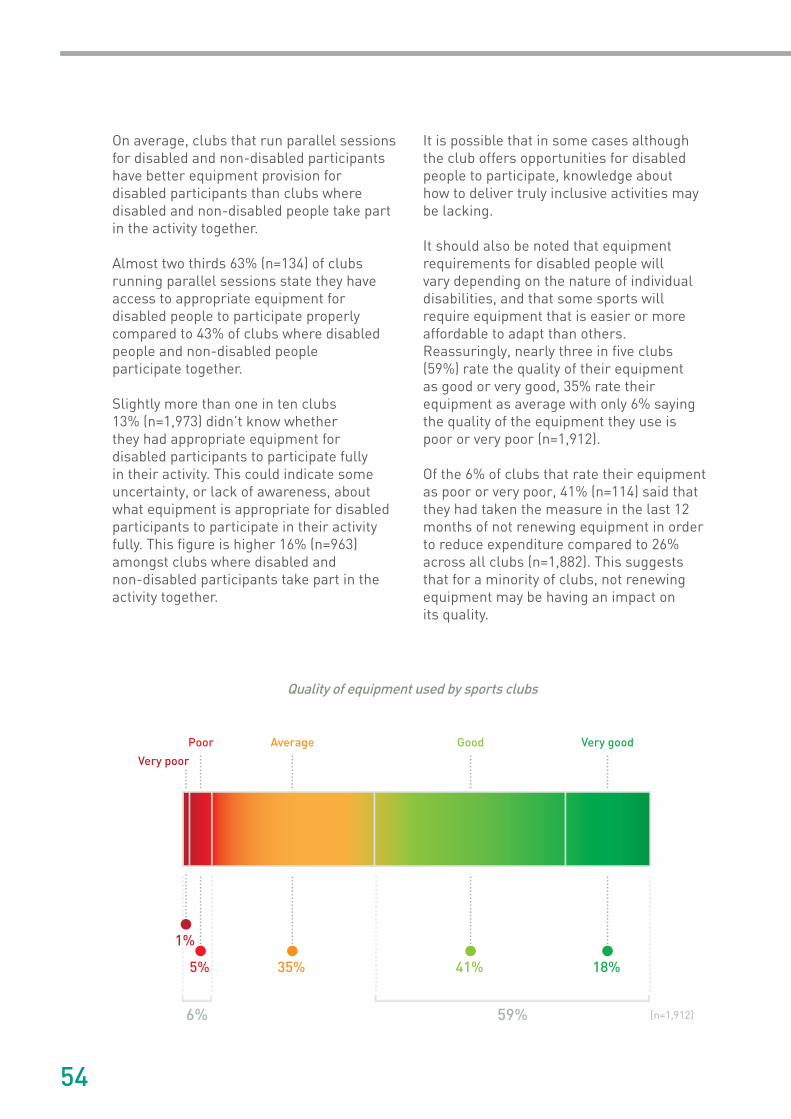
Quality of equipment used by sports clubs
[n=1,912]
1%
Very poor
Poor Average Good Very good
5% 35% 41% 18%
6% 59%
54
On average, clubs that run parallel sessions for disabled and non-disabled participants have better equipment provision for disabled participants than clubs where disabled and non-disabled people take part in the activity together.
Almost two thirds 63% (n=134) of clubs running parallel sessions state they have access to appropriate equipment for disabled people to participate properly compared to 43% of clubs where disabled people and non-disabled people participate together.
Slightly more than one in ten clubs 13% (n=1,973) didn’t know whether they had appropriate equipment for disabled participants to participate fully in their activity. This could indicate some uncertainty, or lack of awareness, about what equipment is appropriate for disabled participants to participate in their activity fully. This fgure is higher 16% (n=963) amongst clubs where disabled and non-disabled participants take part in the activity together.
It is possible that in some cases although the club offers opportunities for disabled people to participate, knowledge about how to deliver truly inclusive activities may be lacking.
It should also be noted that equipment requirements for disabled people will vary depending on the nature of individual disabilities, and that some sports will require equipment that is easier or more affordable to adapt than others. Reassuringly, nearly three in fve clubs (59%) rate the quality of their equipment as good or very good, 35% rate their equipment as average with only 6% saying the quality of the equipment they use is poor or very poor (n=1,912).
Of the 6% of clubs that rate their equipment as poor or very poor, 41% (n=114) said that they had taken the measure in the last 12 months of not renewing equipment in order to reduce expenditure compared to 26% across all clubs (n=1,882). This suggests that for a minority of clubs, not renewing equipment may be having an impact on its quality.
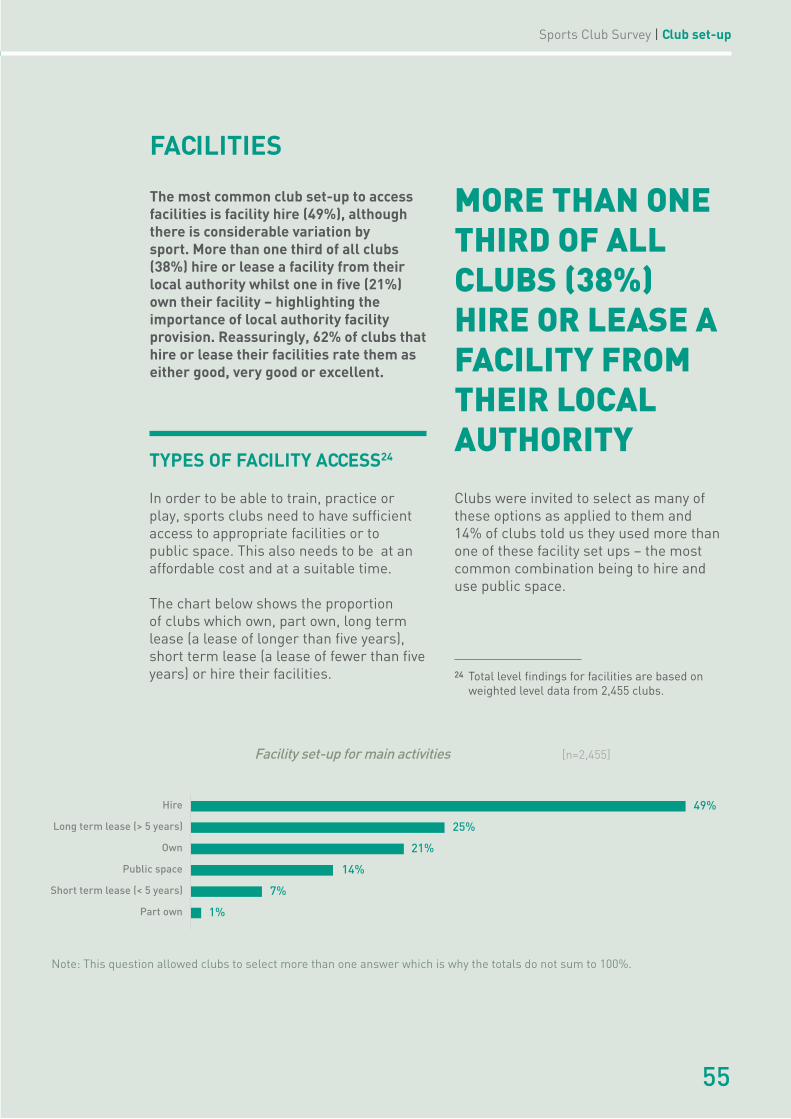
Sports Club Survey | Club set-up
The most common club set-up to access facilities is facility hire (49%), although there is considerable variation by sport. More than one third of all clubs (38%) hire or lease a facility from their local authority whilst one in five (21%) own their facility – highlighting the importance of local authority facility provision. Reassuringly, 62% of clubs that hire or lease their facilities rate them as either good, very good or excellent.
FACILITIES
TYPES OF FACILITY ACCESS24
In order to be able to train, practice or play, sports clubs need to have suffcient access to appropriate facilities or to public space. This also needs to be at an affordable cost and at a suitable time.
The chart below shows the proportion of clubs which own, part own, long term lease (a lease of longer than fve years), short term lease (a lease of fewer than fve years) or hire their facilities.
MORE THAN ONE THIRD OF ALL CLUBS (38%) HIRE OR LEASE A FACILITY FROM THEIR LOCAL AUTHORITY
24 Total level fndings for facilities are based on weighted level data from 2,455 clubs.
55
Clubs were invited to select as many of these options as applied to them and 14% of clubs told us they used more than one of these facility set ups – the most common combination being to hire and use public space.
Note: This question allowed clubs to select more than one answer which is why the totals do not sum to 100%.
Hire 49%
Own 21%
Public space 14%
Short term lease (< 5 years) 7%
Part own 1%
Long term lease (> 5 years) 25%
Facility set-up for main activities [n=2,455]
HIRING AND LEASING
The proportion of clubs which hire a facility in 2013 is 49%. This is a substantial drop on the 2011 fgure of 66% whilst we see fairly constant levels of facility use in other areas. The sports in which clubs are more likely to hire25 are tchoukball 100% (n=10), korfball 100% (n=28), badminton 97% (n=34), judo 95% (n=21), netball 94% (n=36), karate 94% (n=16), wheelchair basketball 92% (n=12), taekwondo 91% (n=34), fencing 91% (n=33), basketball 91% (n=85), swimming/aquatics/diving 91% (n=63) and volleyball 90% (n=49).
Of these sports where hiring is more often the main means of accessing facilities and where there is comparable data in the 2011 Sports Club Survey26, there has been little change in the percentage of clubs hiring from 2011. This suggests that where hiring is the traditional means of accessing facilities, this remains the case.
In 2011, 30% of clubs which owned their facilities also hired a facility (n=408) but this has fallen to 9% in 2013 (n=538), suggesting that where clubs hired and owned a facility they are now more likely just to use the facility which they own as their main facility. This could be for a number of reasons, such as the costs of hiring, availability of facilities to hire or lack of demand from members for using a number of facilities27.
The proportion of clubs that are leasing a facility remains broadly the same as in 2011 with 25% leasing on a long term basis and 7% leasing on a short term basis (31% leasing at least one facility) on a par with the 31% leasing in 2011.
The sports in which clubs are most likely to lease a facility28 on a long term lease are sailing 61% (n=44), tennis 49% (n=76) and cricket 48% (n=373). The sports in which clubs are most likely to lease a facility on a short term lease are angling 39% (n=64), canoeing 24% (n=51) and weightlifting n=23% (n=13). Clubs hire and lease from a variety of providers, the most common of which is the local authority from which half (53%) of clubs which hire or lease their facility do so. Across all clubs, this amounts to more than one third (38%) which are reliant on their local authority as a facility provider.
The other main providers are schools (33%), private operators (21%) and trusts or charities (12%).
Where clubs hire or lease from the local authority the local authority is responsible for maintaining the facility in 68% of cases while in 21% of cases the facility is maintained by the club (n=889). This underlines the important role which local authorities play in providing facilities for many sports clubs and the need for a good relationship between sports clubs and their local authority.
For the 21% of clubs that are responsible for maintaining their facilities, these clubs are likely to be making a valuable contribution to their communities by taking responsibility for facility upkeep.It will be interesting to see whether the proportion of clubs which are responsible for maintaining facilities changes in 2015 and if there are greater cuts to local authority spending.
25 Based on sports with more than ten responses to this question.26 Badminton, netball, basketball, swimming and volleyball.27 Owing to a slight difference in the way the question was asked in 2013 to 2011 some
of this decrease may be attributable to clubs prioritising the place they use the most over others when compared to 2011. In 2013 clubs were asked to select all sets-ups which apply to them, whereas in 2011 clubs had to give a yes or a no answer to each set-up type. However, given that the proportion of clubs leasing or owning remains consistent with 2011 it is likely that the fgures do evidence a decrease in the use of public space and hiring.
28 Based on sports with more than ten responses to this question.
56

Sports Club Survey | Club set-up
Sources of hired or leased facilities [n=1,742]
53%
33%
9%5%
21%
12%
The local authority
A school
A private operator
A trust or charity
Another club
A university
[3%] Other[3%] Church/Parish council
[1%] College
Note: Clubs could select all applicable providers, therefore totals do not sum to 100%.
Responsibility for maintaining local authority premises
68%
21%
11%
The local authority
Our club
A combination of users
[n=889]
57

It is good news that around three in fve clubs (62%) rated the facilities they hire as good, very good or excellent in quality, with only 10% of clubs saying that their facilities are poor, very poor or terrible (n=1,116).
Quality of equipment used by sports clubs
[n=1,116]
Very poorPoor Average Good Very good
TerribleExcellent
1%8% 5%28% 35% 22%
10% 62%
1%
FACILITY OWNERSHIP
Facility ownership has remained at broadly the same level as in 2011 with 21% of clubs owning a facility and 1% part owning (22% owning or part owning at least one facility) compared to 21% owning a facility in 2011. Sports most likely to own a facility are golf clubs 83% (n=12), squash and rackets clubs 82% (n=11), shooting clubs 50% (n=18) and rugby union clubs 49% (n=277).
CASCs are also more likely to own, with 38% owning and 2% part owning a facility (n=578). This is likely to reflect the fact that facility owning clubs may see greater beneft to becoming a CASC because of the 80% mandatory rate relief which CASCs are entitled to.
FACILITY OWNERSHIP HAS REMAINED AT BROADLY THE SAME LEVEL AS IN 2011 WITH 21% OF CLUBS OWNING A FACILITY AND 1% PART OWNING
58
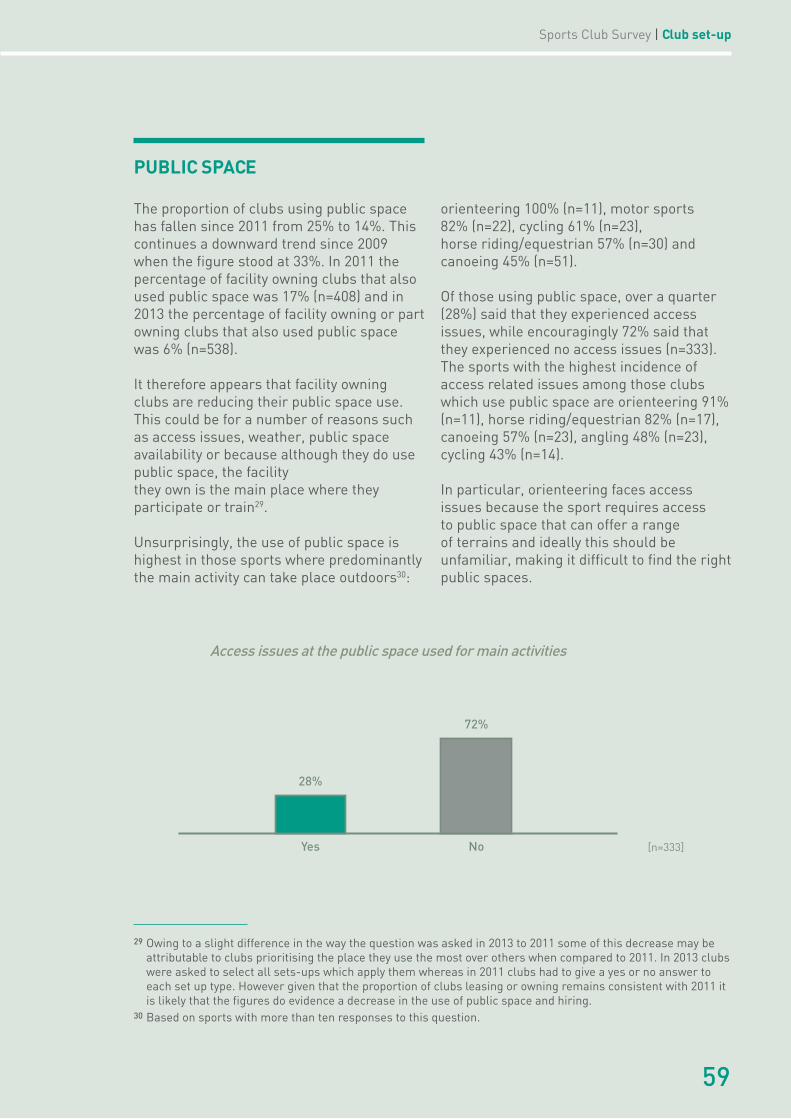
Sports Club Survey | Club set-up
Access issues at the public space used for main activities
[n=333]Yes
28%
No
72%
PUBLIC SPACE
The proportion of clubs using public space has fallen since 2011 from 25% to 14%. This continues a downward trend since 2009 when the fgure stood at 33%. In 2011 the percentage of facility owning clubs that also used public space was 17% (n=408) and in 2013 the percentage of facility owning or part owning clubs that also used public space was 6% (n=538).
It therefore appears that facility owning clubs are reducing their public space use. This could be for a number of reasons such as access issues, weather, public space availability or because although they do use public space, the facility they own is the main place where they participate or train29.
Unsurprisingly, the use of public space is highest in those sports where predominantly the main activity can take place outdoors30:
orienteering 100% (n=11), motor sports 82% (n=22), cycling 61% (n=23), horse riding/equestrian 57% (n=30) and canoeing 45% (n=51).
Of those using public space, over a quarter (28%) said that they experienced access issues, while encouragingly 72% said that they experienced no access issues (n=333). The sports with the highest incidence of access related issues among those clubs which use public space are orienteering 91% (n=11), horse riding/equestrian 82% (n=17), canoeing 57% (n=23), angling 48% (n=23), cycling 43% (n=14).
In particular, orienteering faces access issues because the sport requires access to public space that can offer a range of terrains and ideally this should be unfamiliar, making it diffcult to fnd the right public spaces.
29 Owing to a slight difference in the way the question was asked in 2013 to 2011 some of this decrease may be attributable to clubs prioritising the place they use the most over others when compared to 2011. In 2013 clubs were asked to select all sets-ups which apply them whereas in 2011 clubs had to give a yes or no answer to each set up type. However given that the proportion of clubs leasing or owning remains consistent with 2011 it is likely that the fgures do evidence a decrease in the use of public space and hiring.
30 Based on sports with more than ten responses to this question.
59
AROUND ONE IN THREE CLUBS (33%) HAVE PROVISION FOR DISABLED ACCESS (EG LOWERED KERB, RAMPS OR LIFTS), RISING TO THREE IN FOUR (75%) CLUBS SPECIFICALLY FOR DISABLED PEOPLE
The most frequently commented upon access issue relates to competition for public space from other users such as the general public or those participating in other sporting activities.
Other issues involved physical and/or legal issues around access to waterways or land, the availability of parking, the availability of public facilities, charges for use of the space, and negotiating with public bodies or private landowners over access rights. It is possible that some of these issues are driving the reduction in the use of public space by sports clubs, although further work would be required to establish if this is the case.
However, the fndings show the important balance required to optimise the use of public space for a variety of different users so that use by one group of users does not limit access by others, and furthermore that private land owners should be encouraged to allow access for sporting activities where appropriate.
Clubs specifcally for disabled people are less likely to own a facility than the average across all club types, with 7% owning a facility and 2% part owning (n=49) compared to 21% owning and 1% part owning across all clubs.
However, this is not the case for clubs where disabled and non-disabled people participate together (1,223) – where the percentage of clubs owning facilities (24%) is slightly above the average across all clubs. Clubs specifcally for disabled people (n=49) are also more likely to use public space, with almost one in four (23%) accessing this compared to 14% of all clubs.
Around two in fve clubs across the UK (n=2,279) have doorways which allow wheelchair access (42%) and a similar proportion have access to disabled parking (38%) at the facilities where their activity takes place. This rises to seven in ten (73%) and eight in ten clubs (80%) respectively for clubs specifcally for disabled people (n=42). Only 2% of all clubs said that they had hearing induction loops at the facilities where their activity takes place. Around one in three clubs (33%) have provision for disabled access (eg lowered kerb, ramps or lifts), rising to three in four (75%) clubs specifcally for disabled people (n=42).
These fgures are unlikely to give the full picture because the needs of disabled participants will vary by the specifc disabilities of the participants and the specifc sport in question and clubs may have other access arrangements or options in place.
FACILITIES AND DISABILITY ACCESS
60
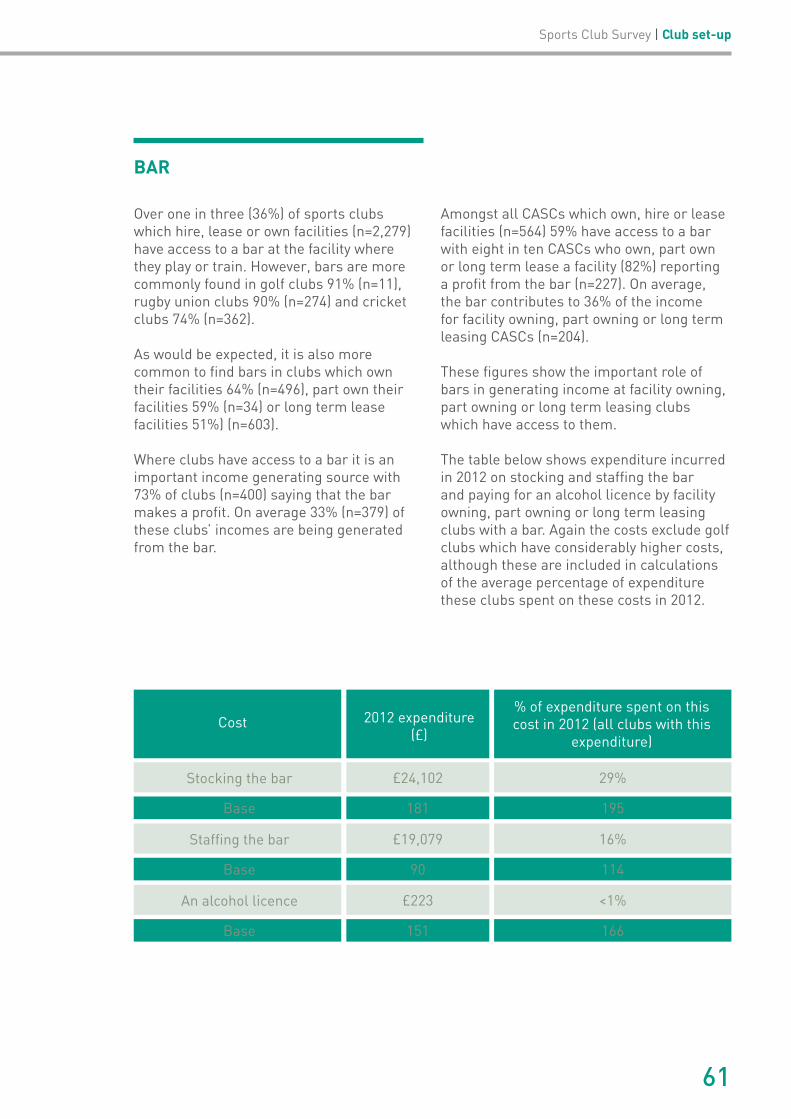
Sports Club Survey | Club set-up
BAR
Over one in three (36%) of sports clubs which hire, lease or own facilities (n=2,279) have access to a bar at the facility where they play or train. However, bars are more commonly found in golf clubs 91% (n=11), rugby union clubs 90% (n=274) and cricket clubs 74% (n=362).
As would be expected, it is also more common to fnd bars in clubs which own their facilities 64% (n=496), part own their facilities 59% (n=34) or long term lease facilities 51%) (n=603).
Where clubs have access to a bar it is an important income generating source with 73% of clubs (n=400) saying that the bar makes a proft. On average 33% (n=379) of these clubs’ incomes are being generated from the bar.
Amongst all CASCs which own, hire or lease facilities (n=564) 59% have access to a bar with eight in ten CASCs who own, part own or long term lease a facility (82%) reporting a proft from the bar (n=227). On average, the bar contributes to 36% of the income for facility owning, part owning or long term leasing CASCs (n=204).
These fgures show the important role of bars in generating income at facility owning, part owning or long term leasing clubs which have access to them.
The table below shows expenditure incurred in 2012 on stocking and staffng the bar and paying for an alcohol licence by facility owning, part owning or long term leasing clubs with a bar. Again the costs exclude golf clubs which have considerably higher costs, although these are included in calculations of the average percentage of expenditure these clubs spent on these costs in 2012.
Cost 2012 expenditure (£)
% of expenditure spent on this cost in 2012 (all clubs with this
expenditure)
Stocking the bar £24,102 29%
Base 181 195
Staffng the bar £19,079 16%
Base 90 114
An alcohol licence £223 <1%
Base 151 166
61

SPORTS CLUBS, LOCAL COMMUNITIES AND SUPPORT
SECTION 06
SPORTS CLUBS, LOCAL COMMUNITIES AND SUPPORT
More than half of the UK’s sports clubs (58%) are working with schools and a similar number (54%) are currently running some sort of programme that engages the wider community.
Almost nine in ten school links (88%) are reported to be successful whilst the community outreach work clubs are undertaking often targets key Government priority areas such as young people and physical health.
For more than half of our clubs, relationships with national governing bodies (NGBs) and county sports partnerships (CSPs) are good or very good (55% and 53% respectively) with more room for improvement with local authorities, where 46% of clubs deem their relationships to be good or very good.
Sports Club Survey | Sports clubs, local communities and support
31 Department for Communities and Local Government (2011), Community Spirit in England: A report on the 2009-10 Citizenship Survey, London: Crown Copyright.
Sports clubs can be found in communities all over the UK and bring people together because of a common passion. In fact, the British public believe that after going to work, school or college together (40%), sharing hobbies and going to sports clubs (29%) is the best way for people from different backgrounds to mix more31.
With 24 volunteers at the average sports club to just two paid members of staff (full or part time), support from the community is vital to ensure clubs thrive and it is therefore no surprise that there are more volunteers in sport than in any other sector. But importantly, sports clubs also give a lot back to their local communities by working with schools and targeting their activities at a wide range of people.
63
32 Total level fndings for school links are based on weighted data from 1,975 clubs, this excludes ten clubs that are already school clubs and 35 clubs that didn’t know.
33 DCMS (2012), Creating A Sporting Habit for Life, A New Youth Sport Strategy.34 Excluding school clubs.
MORE THAN HALF (58%) OF SPORTS CLUBS SAY THEY HAVE ONE OR MORE LINK WITH SCHOOLS IN THEIR LOCAL COMMUNITY
LINKS WITH SCHOOLS32
Summer 2011 saw the end of formal ring fenced funding for School Sport Partnerships, although schools were able to continue with these if they wished and could fnd alternative funding to do so.
In 2012, the Government committed to establishing 6,000 new school-club links by 2017 through NGBs and the roll out of satellite clubs33. More recently in the wake of the Olympic and Paralympic Games, ring fenced funding for school sport has been re-instated, albeit with a different structure.
In March 2013, £150 million of school sport funding was announced for each of the next two years. This ring fenced funding will be distributed directly to primary schools in order to support the delivery of PE and school sport.
The timing of the 2013 survey, in feld between 1 April and 30 June 2013 means that the impact of this new funding will not be reflected in our fndings. However, they demonstrate that links between schools and sports clubs are important for our clubs and that existing relationships are largely positive.
More than half (58%) of sports clubs34 say they have one or more links with schools in their local community, with almost nine in ten (88%) of these links reported to be successful (n=3,980).
For clubs that have school links (n=1,122) the most important factors for making them successful are around ensuring a real partnership – with the ultimate aim that students from the school become members (84%), that the club and school communicate effectively (67%) and that the club is advertised in the school (64%). Other key factors in determining the success of the relationship are around development – such as the opportunity for clubs to identify talent (55%) and for club coaches and offcials to assist with PE lessons or school competitions (55%).
But there are other benefts too, with comments from clubs indicating that they have managed to boost awareness of, and opportunities to participate in, their sport amongst local children by bringing it into schools. Others have demonstrated how running school sessions allows them to integrate more into the community.
64
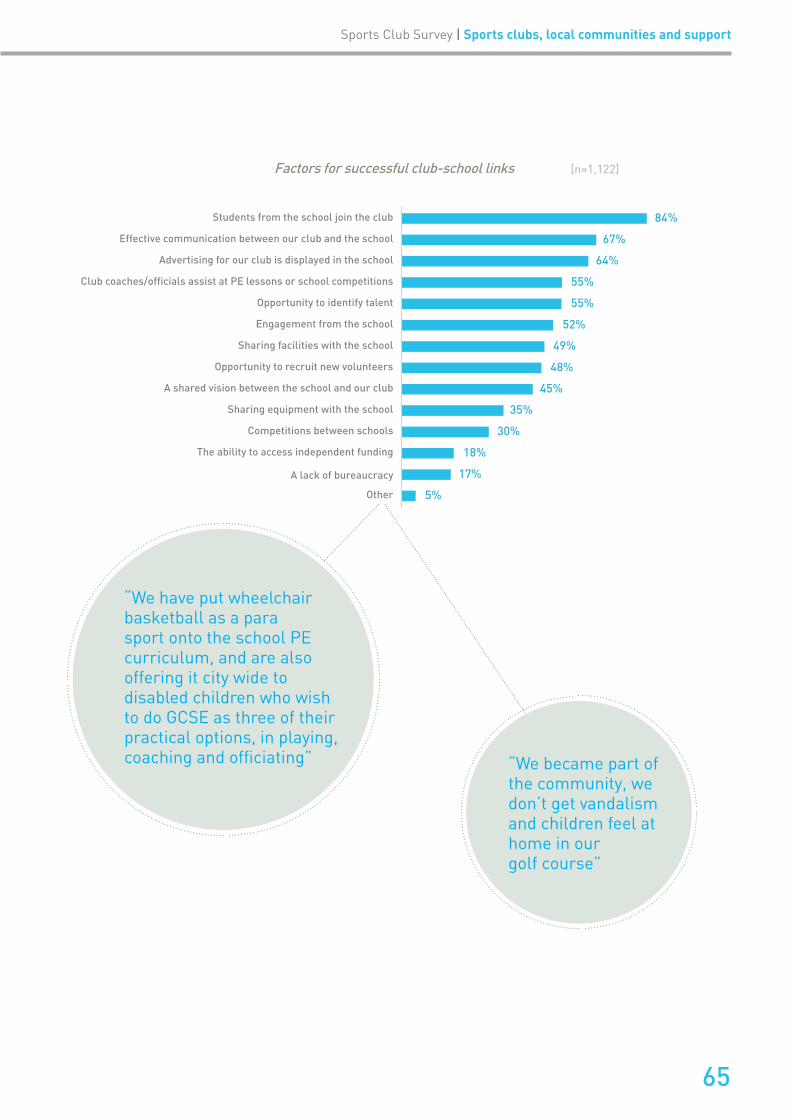
Sports Club Survey | Sports clubs, local communities and support
Students from the school join the club 84%
Advertising for our club is displayed in the school 64%
Club coaches/officials assist at PE lessons or school competitions 55%
Opportunity to identify talent 55%
Engagement from the school 52%
Sharing facilities with the school 49%
Opportunity to recruit new volunteers 48%
A shared vision between the school and our club 45%
Sharing equipment with the school 35%
Effective communication between our club and the school 67%
Competitions between schools 30%
A lack of bureaucracy 17%
Other 5%
The ability to access independent funding 18%
Factors for successful club-school links [n=1,122]
“We have put wheelchair basketball as a para sport onto the school PE curriculum, and are also offering it city wide to disabled children who wish to do GCSE as three of their practical options, in playing, coaching and offciating” “We became part of
the community, we don’t get vandalism and children feel at home in our golf course”
65
35 Total level fndings for community projects are based on weighted data from 1,614 clubs excluding 164 clubs that didn’t know.
OUR FINDINGS SHOW THAT FOR THE MAJORITY OF SPORTS CLUBS, SCHOOL LINKS ARE IMPORTANT FOR RECRUITING MEMBERS AND DEVELOPING THE PHYSICAL SKILLS OF YOUNG PEOPLE
Where clubs do have links with schools, they are far more likely to have these with a number of schools – almost three in four clubs (72%) with school links (n=1,140) have them with more than one school.
This suggests that where clubs have several school links, they are confdent in the approach they are adopting and the outcomes this will have.
Our fndings show that for the majority of sports clubs, school links are important for recruiting members and developing the physical skills of young people. This reaffrms the importance of developing links between schools and clubs embodied in the Government’s satellite club strategy.
Competitive sport is high on the Government’s agenda yet only three in ten (30%) sports clubs working with schools (n=1,122) believe that competition between schools is necessary for them to have good links with schools.
This suggests there may be some disconnect between Governmentpriorities for school sport and the
role that clubs play. It is important that the positive school-club links we have seen evidence of in our survey are protected, and fostered under any new Government strategy for school sport. It’s also important that the opportunities for both clubs and schools under the new satellite club strategy are maximised.
COMMUNITY PROJECTS35
As reported in the Game of Life (Sport and Recreation Alliance, 2012), the wider benefts of sport and physical activity are far reaching – boosting not just physical and mental health but also providing opportunities to engage young people at risk from antisocial behaviour,enhance social cohesion and boost educational attainment.
Although there are many charities and projects which exist to deliver sport with these particular aims, sports clubs can also ensure that their activity meets a wider audience or specifc goals. The motivations
for this may be varied – in some cases good funding is available if club activities are addressing certain problems, but equally sports clubs are typically integrated into the community and for many it is in the nature of what they do to contribute something back.
Positively, we found that more than half (54%) of sports clubs are currently running some sort of programme that engages the wider community, be this aimed specifcally at young people or people who have suffered from domestic violence. In line with the Government’s key long term
66

Sports Club Survey | Sports clubs, local communities and support
Is your club currently running any outreach work orsessions/programmes that are part of wider community engagement?
[n=1,614]
Yes 54%
We aren’t currently 46%
Young people 76%
People from areas of social deprivation 30%
Disabled people 24%
Reducing anti-social behaviour 24%
Women only 23%
Improving mental health 18%
Reducing crime 14%
Black and minority ethnic groups (BME) 14%
The elderly 11%
Improving physical health 54%
Other (please tell us the aim in the box below) 6%
Men only 6%
Sections of the community targeted by sports clubs [n=874]
objectives, two in fve sports clubs (42%) are conducting work aimed at young people and three in ten (30%) are running programmes aimed at improving physical health. Amongst those which are delivering community projects (n=874), this accounts for three quarters (76%) and half (54%) of all projects respectively.
It is possible that there has been some overstatement in response to this question. Although the question was asking specifcally about outreach work
or sessions/programmes as part of wider community engagement aimed at specifc groups, some clubs may feel that they are targeting the wider community simply by running their normal sessions.
Additionally, although this question was phrased as neutrally as possible some clubs may have wanted to say they were carrying out outreach work due to the perceived social value of this. However, we believe the level of overstatement to be relatively minor here.
67

The focus of these community projects demonstrates that sports clubs are playing a vital role in working with groups that will beneft society and align with Government priorities. The main areas clubs are working in across the board are also those that are important for the Government to address, important for social cohesion and able to be improved by sport.
What’s more, six in ten clubs (60%) running single projects in the community (n=476) are entirely self-funding them, with only 9% entirely self-funded by an external organisation(s) and 23% partly funded externally36. Within clubs delivering multiple projects 58% of the projects (n=1,354 projects) are funded entirely by the club compared to just 12%
funded completely by one or more external organisations and 27% partly funded externally.
The extent to which sports clubs are entirely, or part funding their wider community engagement demonstrates both fnancial and time commitments by community sports clubs in targeting priority areas for the Government.
36 Nine per cent of clubs running one project didn’t know how they were being funded.
37 2,909 clubs were asked about their affliation to relevant NGBs. Total level fndings about the quality of NGB relationships are based on 2,122 NGB relationships from 1,783 clubs. Findings about the quality of CSP relationships are based on 829 clubs which have links with their CSP. Findings about the quality of local authority relationships are based on 1,667 clubs. When asked about having a named contact at their local authority, 2,002 clubs provided data. 349 clubs (17%) responded to this question with don’t know. It’s likely that the person completing the questionnaire in this instance genuinely does not know the answer but that someone else in their club may have a contact. Therefore to avoid skewing the results the data has been rebased to exclude those which said don’t know to give a base of 1,653 clubs. Similarly, 965 clubs responded to the question about a named contact at their CSP, 154 (16%) of which replied with don’t know. Findings to this question are therefore drawn from re-based data of 811 clubs.
CSP, LOCAL AUTHORITY AND NGB SUPPORT37
In order to play an important role in their communities, sports clubs often require a certain degree of support. Individual national governing bodies (NGBs) exist for most sports and provide them with guidance, information, training and services – predominantly with a view to supporting them to increase their membership numbers and ultimately grow participation in the sport.
Although many NGBs also tend to operate at a regional or local level, county sports partnerships are the key local level resource for sports clubs, particularly in those sports with smaller NGBs. Another important potential contact for sports clubs is the local authority. In particular, clubs which hire their facilities are more likely to be in touch with their local authority as half of all clubs that hire (52%) do so from this source. For other clubs local authorities can also be a source of funding, signposting and information, as well as potential generators of red tape.
Although the Sports Club Survey was widely promoted whilst in feld [see Appendix A – Methodology for more details], due to heavy promotion from NGBs to their members, our sample over-represents affliated clubs, with some clubs having affliation to more than one NGB.
68
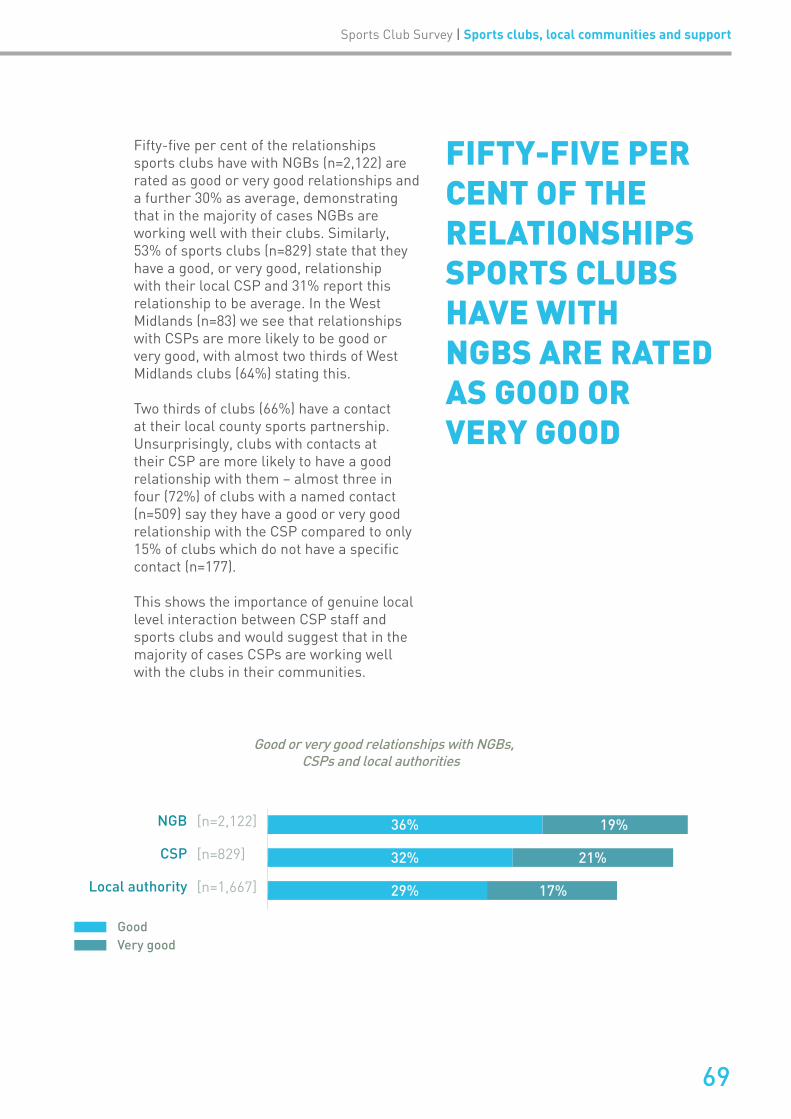
Sports Club Survey | Sports clubs, local communities and support
NGB [n=2,122]
CSP [n=829]
Local authority
36%
32%
29%
19%
21%
17%[n=1,667]
Good or very good relationships with NGBs, CSPs and local authorities
Good Very good
FIFTY-FIVE PER CENT OF THE RELATIONSHIPS SPORTS CLUBS HAVE WITH NGBS ARE RATED AS GOOD OR VERY GOOD
Fifty-fve per cent of the relationships sports clubs have with NGBs (n=2,122) are rated as good or very good relationships and a further 30% as average, demonstrating that in the majority of cases NGBs are working well with their clubs. Similarly, 53% of sports clubs (n=829) state that they have a good, or very good, relationship with their local CSP and 31% report this relationship to be average. In the West Midlands (n=83) we see that relationships with CSPs are more likely to be good or very good, with almost two thirds of West Midlands clubs (64%) stating this.
Two thirds of clubs (66%) have a contact at their local county sports partnership. Unsurprisingly, clubs with contacts at their CSP are more likely to have a good relationship with them – almost three in four (72%) of clubs with a named contact (n=509) say they have a good or very good relationship with the CSP compared to only 15% of clubs which do not have a specifc contact (n=177).
This shows the importance of genuine local level interaction between CSP staff and sports clubs and would suggest that in the majority of cases CSPs are working well with the clubs in their communities.
69

Relationships with local authorities are a little more open to room for improvement, with just under half (46%) of clubs saying they have a good or very good relationship with their local authority and 34% stating that it’s average. Interestingly, amongst clubs which hire a facility from their local authority (n=745) they are slightly more positive about the relationship with 49% of these clubs stating the relationship is good or very good and 38% believing it to be average.
This may be because these clubs have closer interactions with their local authorities by virtue of hiring from them or that the provision of facilities helps to foster a good relationship.
Although it is one of the biggest benefts a local authority can give to a facility owning sports club, the granting of discretionary rate relief appears not to be influencing perceptions around the quality of the relationship, with facility owning clubs which receive no discretionary rate relief more frequently citing the relationship as good or very good.
Fewer clubs (47%) have named contacts at local authorities compared to CSPs and again we see the importance of interpersonal relationships for creating quality connections – seven in ten clubs (70%) which have contacts at their local authority rate their relationship with the authority as good or very
good compared to just two in ten clubs (22%) without a contact. This would suggest that there are plenty of local authorities which could begin to build personal links with more sports clubs and that this is likely to foster better relationships.
Clubs located outside of England appear to be more likely to have good or very good relationships with their local authority, with 65% of clubs in Northern Ireland (n=64) and 54% of clubs in Scotland (n=33) and Wales (n=37) reporting good or very good relationships, although some caution should be used given the small base sizes, particularly compared with other regions.
RELATIONSHIPS WITH LOCAL AUTHORITIES ARE A LITTLE MORE OPEN TO ROOM FOR IMPROVEMENT
70
Northern Ireland 38% 27%[n=144]
Good or very good relationships with local authorities by region/nation
All clubs [n=1,667] 29% 17%
Wales [n=169] 24% 30%
Scotland [n=252] 30% 24%
North East [n=188] 28% 24%East Anglia [n=118] 31% 20%
East Midlands [n=131] 34% 12%
London [n=150] 26% 18%
West Midlands [n=204] 29% 14%
North West [n=83] 25% 17%
South East [n=37] 27% 14%
South West [n=33] 27% 13%
North [n=64] 23% 14%
Good Very good
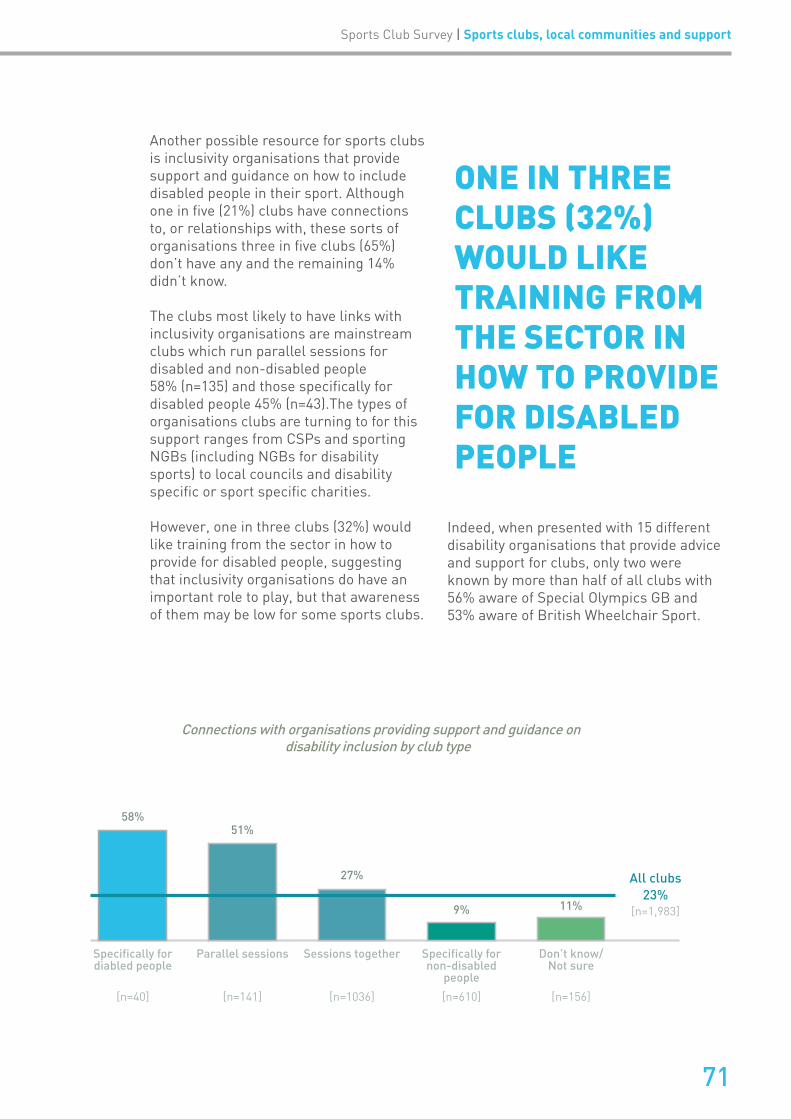
Sports Club Survey | Sports clubs, local communities and support
Connections with organisations providing support and guidance on disability inclusion by club type
All clubs
[n=1,983]
Specifically for diabled people
58%
Parallel sessions
51%
Sessions together
27%
Specifically for non-disabled
people
9%
Don’t know/Not sure
11%
[n=40] [n=141] [n=1036] [n=610] [n=156]
23%
Another possible resource for sports clubs is inclusivity organisations that provide support and guidance on how to include disabled people in their sport. Although one in fve (21%) clubs have connections to, or relationships with, these sorts of organisations three in fve clubs (65%) don’t have any and the remaining 14% didn’t know.
The clubs most likely to have links with inclusivity organisations are mainstream clubs which run parallel sessions for disabled and non-disabled people 58% (n=135) and those specifcally for disabled people 45% (n=43).The types of organisations clubs are turning to for this support ranges from CSPs and sporting NGBs (including NGBs for disability sports) to local councils and disability specifc or sport specifc charities.
However, one in three clubs (32%) would like training from the sector in how to provide for disabled people, suggesting that inclusivity organisations do have an important role to play, but that awareness of them may be low for some sports clubs.
ONE IN THREE CLUBS (32%) WOULD LIKE TRAINING FROM THE SECTOR IN HOW TO PROVIDE FOR DISABLED PEOPLE
Indeed, when presented with 15 different disability organisations that provide advice and support for clubs, only two were known by more than half of all clubs with 56% aware of Special Olympics GB and 53% aware of British Wheelchair Sport.
71

SECTION 07
LOOKING FORWARD
LOOKING FORWARD
Finances continue to be a concern for clubs, with 52% worried about accessing funding in the next two years and 58% asking for training and support in applying for funding.
In light of growing memberships, clubs are concerned about being able to provide for members and accommodate new ones. Improving and affording facilities remains high on the agenda and there are concerns around coaching numbers and resource capacity to accept new members.
Despite concerns around increasing facility costs and a lack of coaches, around half of our sports clubs are optimistic about being able to improve their facilities (54%) and train or develop their coaches, staff or volunteers (49%) in the next two years.
SUPPORT AND TRAINING38
With increasing adult memberships, volunteers and fnances, the 2013 Sports Club Survey fndings have shown a more positive picture for sports clubs than in recent years, and clubs are largely optimistic about the future.
However, they are also still in real need of support in key areas, although needs vary depending on the club – perhaps because of their facility set-up, the specifc sport, or local circumstances. We are therefore seeing a range of different concerns and priorities for the future amongst clubs.
Clubs were asked to rank the top three ways that the Government could support them. When we combine these scores we see a varied picture with around one in ten clubs looking for the Government to make it easier to apply for Government funding (12%), to encourage young people to be more involved with sport and recreation (11%), to make it more affordable to build a new facility or improve an existing one (11%), to make it more affordable to hire existing sport and recreation facilities (10%) and to take action to reduce the running costs of clubs, such as local rates and utility bills (9%).
Sports Club Survey | Looking forward
73
38Total level fndings for Government support are based on weighted data from 1,939 clubs.
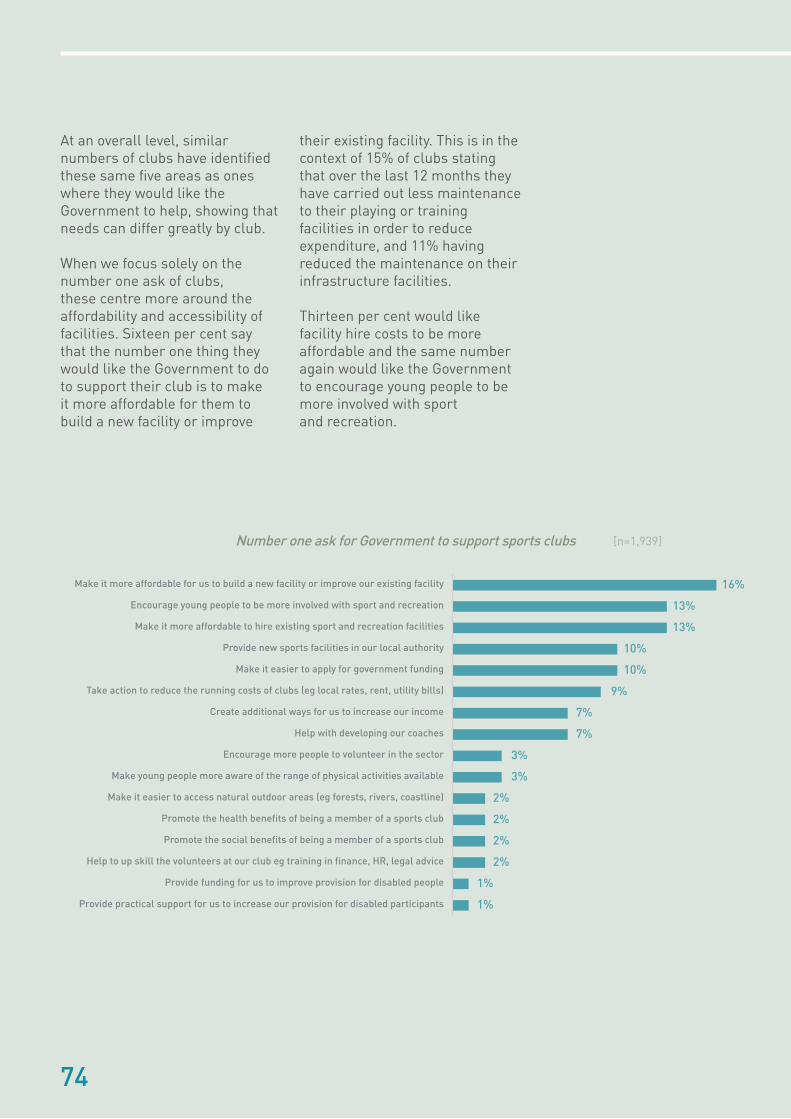
74
At an overall level, similar numbers of clubs have identifed these same fve areas as ones where they would like the Government to help, showing that needs can differ greatly by club.
When we focus solely on the number one ask of clubs, these centre more around the affordability and accessibility of facilities. Sixteen per cent say that the number one thing they would like the Government to do to support their club is to make it more affordable for them to build a new facility or improve
their existing facility. This is in the context of 15% of clubs stating that over the last 12 months they have carried out less maintenance to their playing or training facilities in order to reduce expenditure, and 11% having reduced the maintenance on their infrastructure facilities.
Thirteen per cent would like facility hire costs to be more affordable and the same number again would like the Government to encourage young people to be more involved with sport and recreation.
Make it more affordable for us to build a new facility or improve our existing facility 16%
Make it more affordable to hire existing sport and recreation facilities 13%
Provide new sports facilities in our local authority 10%
Make it easier to apply for government funding 10%
Take action to reduce the running costs of clubs (eg local rates, rent, utility bills) 9%
Create additional ways for us to increase our income 7%
Help with developing our coaches 7%
Encourage more people to volunteer in the sector 3%
Make young people more aware of the range of physical activities available 3%
Encourage young people to be more involved with sport and recreation 13%
Make it easier to access natural outdoor areas (eg forests, rivers, coastline) 2%
Promote the social benefits of being a member of a sports club 2%
Help to up skill the volunteers at our club eg training in finance, HR, legal advice 2%
Provide funding for us to improve provision for disabled people 1%
Provide practical support for us to increase our provision for disabled participants 1%
Promote the health benefits of being a member of a sports club 2%
Number one ask for Government to support sports clubs [n=1,939]
74

Sports Club Survey | Looking forward
These fndings also accord with those elsewhere in the survey as three in fve (63%) clubs which hire have reported an increase in their facility hire costs and at an overall level, junior memberships are declining.
One in ten clubs (10%) say that providing new facilities in their local authority is the most important thing the Government could do for them. In particular, clubs which would like new facilities in their local authority were based in Cornwall Council (n=43), Birmingham City Council (n=24), Sheffeld City Council (n=21), Durham County Council (n=16) and Belfast City Council (n=15), Devon County Council (n=15) and Huntingdonshire District Council (n=20).
One in ten clubs (10%) again say their top ask of Government is for it to be easier to apply for Government funding. If offered at minimal cost from within the sport and recreation sector, the number one area that sports clubs would like training and support in is completing funding applications (58%).
This suggests that it needs to be easier for clubs to apply for funding. Often those
UPCOMING CHALLENGES39
The landscape remains challenging for sports clubs in the next two years. Clubs are most likely to identify four (11%), fve (10%) or six challenges (11%) facing their club either now, or in the next two years and again we see that clubs are expecting to face a wide variety of challenges to similar extents.
Around half of UK clubs are concerned about accessing funding (52%), recruiting new members (51%), needing to improve or extend their facilities (49%), generating suffcient income (48%) and increasing facility costs (47%).
That is not to say clubs haven’t been proactively trying to plan for the future, with 49% of clubs stating that in the last year they have increased their fundraising efforts and 45% reporting that they have applied for more funding in the last 12 months in order to try and increase club income.
In addition, 44% of clubs report that they have been actively seeking to recruit new members for the same purpose. These fndings suggest that although the overall picture is more positive for sports clubs, this has not come easily for many clubs and there are still struggles ahead.
applying for it will be volunteers already contributing a signifcant amount of their time to running the club and delivering their activity, not necessarily with a large amount of knowledge relating to funding applications or fnances. Additional areas that clubs would like training and support in are recruiting club members (55%), recruiting volunteers (46%) and marketing (45%).
39Total level fndings for upcoming challenges are based on weighted data from 1,949 clubs.
44% OF CLUBS REPORT THAT THEY HAVE BEEN ACTIVELY SEEKING TO RECRUIT NEW MEMBERS
75
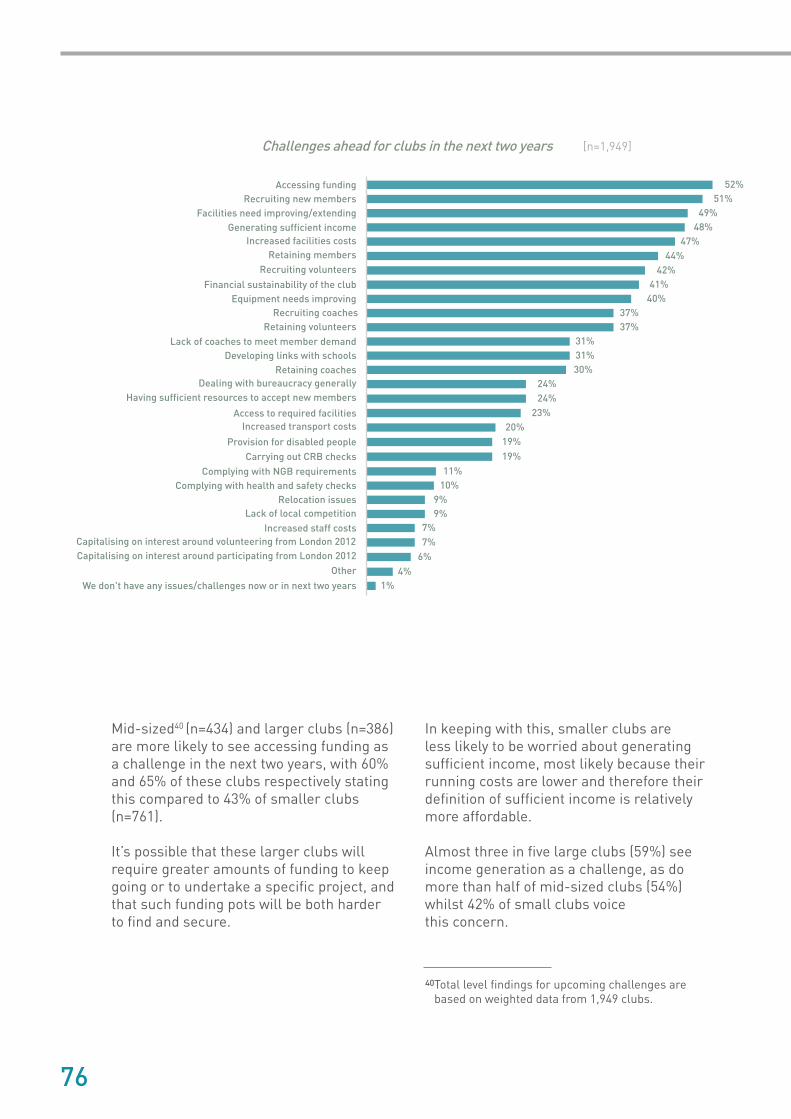
76
Accessing funding 52%Recruiting new members 51%
Facilities need improving/extending 49%Generating sufficient income 48%
Increased facilities costs 47%Retaining members 44%
Recruiting volunteers 42%Financial sustainability of the club 41%
Equipment needs improving 40%Recruiting coaches 37%
Retaining volunteers 37%Lack of coaches to meet member demand 31%
Developing links with schools 31%Retaining coaches 30%
Dealing with bureaucracy generally 24%Having sufficient resources to accept new members 24%
Access to required facilities 23%Increased transport costs 20%
Provision for disabled people 19%Carrying out CRB checks 19%
Complying with NGB requirements 11%Complying with health and safety checks 10%
Relocation issues 9%Lack of local competition 9%
Increased staff costs 7%Capitalising on interest around volunteering from London 2012 7%Capitalising on interest around participating from London 2012 6%
Other 4%1%We don't have any issues/challenges now or in next two years
Challenges ahead for clubs in the next two years [n=1,949]
Mid-sized40 (n=434) and larger clubs (n=386) are more likely to see accessing funding as a challenge in the next two years, with 60% and 65% of these clubs respectively stating this compared to 43% of smaller clubs (n=761).
It’s possible that these larger clubs will require greater amounts of funding to keep going or to undertake a specifc project, and that such funding pots will be both harder to fnd and secure.
In keeping with this, smaller clubs are less likely to be worried about generating suffcient income, most likely because their running costs are lower and therefore their defnition of suffcient income is relatively more affordable.
Almost three in fve large clubs (59%) see income generation as a challenge, as do more than half of mid-sized clubs (54%) whilst 42% of small clubs voice this concern.
40Total level fndings for upcoming challenges are based on weighted data from 1,949 clubs.

77
Sports Club Survey | Looking forward
Clubs that run parallel sessions for disabled people and non-disabled people are more likely to be worried about generating suffcient income in the next two years. Three in fve (60%) of these clubs identifed this as a problem compared to just under half (48%) of all clubs.
Financial sustainability similarly represents a cause of concern in more of the larger clubs, with almost one in two large (48%) and mid-sized (47%) clubs seeing this as a challenge compared to 37% of small clubs.
Previous years have seen clubs mostly concerned about simply staying afloat and continuing to exist, with top challenges focusing on recruiting and retaining members and generating suffcient income. These areas remain primary concerns for clubs, but alongside them, the next two years hold challenges for clubs in relation to their facilities – either in the shape of
needing to improve or extend them (49%), or rising associated costs (47%).
However, clubs specifcally for disabled people (n=33) are much less concerned about the need to improve or extend their facilities, with only 14% citing this as an upcoming challenge. This is compared to half (49%) of all clubs and two thirds (65%) of clubs which provide specifc sessions for disabled people alongside sessions for non-disabled people (n=129).
Unsurprisingly, clubs which own or long term lease their facilities (n=648), or use a combination of owned/hired/public space (n=290) are more concerned with improving or extending their facilities, with 59% and 58% identifying this as an upcoming challenge. This is compared to 39% of clubs which only hire, short term lease their facilities or use public space (n=1,011).
ALMOST THREE IN FIVE LARGE CLUBS (59%) SEE INCOME GENERATION AS A CHALLENGE, AS DO MORE THAN HALF OF MID-SIZED CLUBS (54%)

Club size by income Facility status Club type
Smal
l (<£
10k)
Mid
-siz
ed (£
10k-
£30k
)
Larg
e (>
£30k
)
No
finan
cial
dat
a
Do
not o
wn
a fa
cilit
y (h
ire,
leas
e,
and/
or u
se p
ublic
spa
ce)
Ow
n or
long
term
leas
e a
faci
lity
Acc
ess
to a
com
bina
tion
of f
acili
ties
Clu
bs s
peci
fical
ly fo
r no
n-di
sabl
ed
peop
le
Clu
bs s
peci
fical
ly fo
r di
sabl
ed
peop
le
Clu
bs th
at p
rovi
de o
ppor
tuni
ties
to
take
par
t tog
ethe
r
Clu
bs th
at p
rovi
de p
aral
lel s
essi
ons
Don
’t k
now
/Not
sur
e
761
ALL
CLU
BS
CHALLENGES
BASE
Accessing funding
Recruiting new members
Facilities need improving/extending
Generating sufficient income
Increased facility costs
Retaining members
Recruiting volunteers
Financial sustainability of the club
Equipment needs improving
Recruiting coaches
Retaining volunteers
Lack of coaches to meet member demand
Developing links with schools
Retaining coaches
Dealing with bureaucracy generally
Having sufficient resources to accept new members
Access to required facilities
Increased transport costs
Provision for disabled people
Carrying out CRB checks
Complying with NGB requirements
Complying with health and safety checks
Relocation issues
Lack of local competition
Increased staff costs
Capitalising on interest around volunteering from London 2012 Capitalising on interest around participating from London 2012
Other
We don’t have any issues/challenges now or in next two years
1949
52%
51%
49%
48%
47%
44%
42%
41%
40%
37%
37%
31%
31%
30%
24%
24%
23%
20%
19%
19%
11%
10%
9%
9%
7%
7%
6%
4%
1%
434 386 368 1011 648 290 681 33 965 129 141
43%
55%
37%
42%
45%
43%
38%
37%
41%
33%
32%
28%
28%
27%
19%
21%
25%
20%
16%
18%
10%
6%
8%
11%
3%
5%
6%
3%
2%
60%
51%
60%
54%
55%
42%
48%
47%
44%
45%
41%
37%
38%
34%
21%
30%
30%
20%
22%
19%
11%
7%
10%
8%
3%
6%
5%
2%
1%
65%
46%
64%
59%
48%
49%
45%
48%
42%
38%
44%
31%
33%
33%
39%
25%
15%
18%
26%
21%
13%
22%
9%
3%
19%
10%
5%
8%
0%
49%
49%
44%
44%
39%
43%
41%
35%
32%
37%
36%
28%
25%
29%
22%
22%
20%
19%
17%
18%
8%
12%
8%
10%
9%
7%
8%
2%
2%
48%
49%
39%
43%
52%
43%
38%
38%
39%
36%
35%
31%
29%
29%
22%
27%
29%
18%
18%
16%
10%
7%
12%
10%
5%
5%
7%
2%
3%
56%
56%
59%
55%
39%
49%
46%
47%
41%
33%
41%
27%
33%
26%
30%
20%
10%
19%
23%
17%
10%
15%
5%
7%
12%
10%
7%
1%
5%
60%
47%
58%
50%
48%
37%
50%
41%
39%
52%
37%
39%
31%
44%
20%
22%
34%
25%
19%
29%
12%
11%
7%
6%
5%
6%
4%
0%
3%
50%
52%
47%
47%
52%
47%
47%
41%
38%
40%
41%
26%
29%
29%
20%
20%
26%
18%
12%
19%
10%
9%
11%
7%
5%
4%
4%
2%
2%
49%
56%
14%
44%
46%
26%
28%
34%
36%
29%
31%
21%
20%
26%
22%
20%
13%
46%
15%
18%
12%
8%
11%
26%
6%
0%
10%
-
5%
54%
49%
49%
48%
43%
43%
39%
40%
41%
38%
35%
35%
33%
33%
27%
27%
23%
19%
24%
18%
10%
12%
9%
9%
8%
8%
8%
1%
4%
57%
43%
65%
60%
54%
35%
57%
55%
49%
36%
43%
38%
26%
34%
30%
30%
26%
30%
29%
31%
22%
10%
2%
10%
12%
18%
7%
2%
6%
44%
65%
48%
43%
38%
51%
31%
34%
34%
21%
28%
20%
24%
17%
20%
13%
14%
18%
15%
11%
7%
7%
5%
10%
10%
1%
4%
1%
4%
78

As we would also expect, increased facility costs pose a greater threat to clubs which don’t own their facilities (52%, n=1,011), as they are less in control of these than a facility owning club that might for example, be able to swap utility providers to help reduce facility related costs.
A third (34%) of clubs which use a combination of facilities are worried about having access to the facilities they require in the next two years. It’s possible that some of these clubs use multiple facilities because the access they have to one isn’t suffcient.
Three in ten (29%) clubs which hire, short term lease or access public space are also worried about having access to the facilities they require in the next two years. Here it is more likely that concerns are borne from not being able to book facility space as and when needed, or wider outdoor access issues.
Reflective of their more formalised structure, concerns around increased staff costs come predominantly from larger clubs, one in fve (19%) of which believe this to be an upcoming challenge compared to 3% of small and mid-sized clubs. A much greater proportion of large clubs (22%) are concerned about complying with health and safety checks. This is compared to only 6% and 7% respectively of small and mid-size clubs.
These larger clubs are also twice as likely to be worried about dealing with bureaucracy – no doubt because they encounter more of it (39% of large clubs compared to 19% of small clubs). These concerns for larger clubs suggest that there is a danger that over-regulation and red tape present unnecessary challenges as sports clubs grow. The Government should be mindful that if they want more people to be active, they should incentivise sports clubs to grow and become more independent, rather than punishing growth through over-regulation.
Alongside the 21% increase in adult participating membership levels at the average club since 2011, fewer clubs believe recruiting new members will be a challenge in the next two years. This does not however account for the longer term trend we have seen in decreasing junior membership levels, suggesting clubs may feel positive about the 8% increase in junior membership levels seen in the last year. Whilst this was the main challenge identifed in 2011 by almost two in three
Sports Club Survey | Looking forward
79
A THIRD (34%) OF CLUBS THAT USE A COMBINATION OF FACILITIES ARE WORRIED ABOUT HAVING ACCESS TO THE FACILITIES THEY REQUIRE IN THE NEXT TWO YEARS
clubs 64% (n=1,942), it is now the second most cited challenge by one in two clubs (51%). This still represents an issue for half of all clubs, however, and is more likely to be a challenge for clubs specifcally for disabled people 56% (n=33) and more so for smaller clubs (55%) than it is for larger clubs (46%).
Even though the recruitment of new members is less of an immediate concern for clubs, accommodating existing and new members may still be. Three in ten clubs (31%) believe they may not have enough coaches to meet member demand in the coming two years and one in four (24%) believe that they will be challenged by insuffcient resources to accept new members. This suggests that for around three in ten clubs, current or increasing participation levels may be diffcult to sustain without appropriate support and resource.
Rowing clubs (n=76) in particular are conscious that they may not be able to support more members with almost three quarters (72%) concerned about a lack of coaches to meet member demand, and 65% stating they are worried about having suffcient resources to accept new members. Other sports worried about suffciently accommodating new members are archery (n=53) where 59% of clubs see this as an upcoming challenge, and canoeing (n=46), weightlifting (n=12) and wheelchair basketball (n=12) – half (50%) of which have expressed this worry.
In addition to rowing, the sports that are most concerned about a lack of coaches to meet member demand are canoeing 72% (n=46), gymnastics 61% (n=79), athletics 54% (n=57), cycling 50% (n=20) and table tennis 50% (n=20). It is somewhat surprising that all of these sports were featured in the Olympic or Paralympic Games.
In the wider context of increasing membership numbers – which clubs do not necessarily feel are linked to the Games – this may suggest that for those clubs where new participants have been attracted, resource, particularly in the form of coaches, is limited.
One in fve clubs (19%) see providing for disabled people as an upcoming challenge, with larger clubs (26%) more likely to be concerned about this. The clubs most worried about providing for disabled people are those which run parallel sessions for disabled and non-disabled people (29%) and those which provide opportunities where disabled and non-disabled people take part in the activity together (24%).
Almost half (46%) of clubs specifcally for disabled people (n=33) are worried about increasing transport costs in the next two years, compared to just one in fve (20%) of all clubs. More than one in four of clubs specifcally for disabled people (26%) are worried about a lack of local competition, compared to just one in ten (9%) of all clubs.
80
Sports Club Survey | Looking forward
Smaller clubs are also worried about a lack of local competitions – this is almost four times more likely to be an upcoming challenge for small clubs (11%) than it is for mid-sized and large clubs (3%). Clubs specifcally for disabled people are also less concerned with retaining members (a challenge for 26% of clubs specifcally for disabled people compared to 44% of all clubs) and recruiting volunteers (a challenge for 28% of clubs specifcally for disabled people compared to 42% of all clubs).
Alongside the smaller membership numbers that we know clubs specifcally for disabled people have, their concerns suggest that these clubs are well set up to deliver their activities – with the majority
having good facilities, a core membership base and volunteer support. What these clubs are worried about relate more to how they can operate in the wider sporting environment, with increasing transport costs causing concern as well as a lack of local competition for their members to engage in.
Four per cent of clubs told us that they faced other challenges beyond those listed. These included concerns around poor weather preventing participation, issues with the way in which elite funding for disabled participants is distributed, and diffculties transferring knowledge and enthusiasm to new volunteers or distributing workloads amongst them.
“THE CURRENT FUNDING MODEL FOR ELITE SPORT PREVENTS DISABLED ATHLETES FROM SMALL CLUBS LIKE OURS TO BREAK THROUGH... IN THE LONG RUN THIS WILL KILL THE TYPE OF WORK THAT WE DO, BECAUSE OUR ATHLETES CANNOT AFFORD TO COMPETE AT THE LEVEL THAT THEY NEED AND STAY IN THE SPORT”- ATHLETICS CLUB
81

”CRICKET IS A SEASONAL SPORT – LAST YEAR’S WEATHER WOULD HAVE HAD A BIGGER IMPACT ON THE GAME THAN THE OLYMPICS. THIS YEAR’S COLD WINTER EQUALLY MEANT MANY JUNIOR FOOTBALL/RUGBY GAMES CLASH WITH SPORTING CALENDARS. IF KIDS CAN’T PLAY THEY WILL LOSE INTEREST”- CRICKET CLUB
82
Clubs are most likely to be optimistic about two (16%), three (17%) or four (15%) opportunities when thinking about now and the next two years, although one in ten clubs (9%) aren’t able to identify any upcoming opportunities. Smaller clubs (n=747) are less likely to be optimistic about the future with 13% of these reporting no identifable opportunities for the coming two years compared to 3% of larger clubs (n=374).
Despite concerns around increasing facility costs and a lack of coaches, around half of our sports clubs are optimistic about being able to improve their facilities (54%) and train or develop their coaches, staff or volunteers (49%) in the next two years. As would be expected, clubs which own or long term lease their facilities are more optimistic about upcoming opportunities to improve their facilities with seven in ten (71%) of these clubs stating this (n=780).
Larger clubs (n=374) are also more likely to be optimistic about improving their facilities with three quarters (75%) reporting this to be the case. In terms of coach training and development, eight in ten (79%) gymnastics clubs are excited about this opportunity (n=79), as are around seven in ten swimming clubs 74% (n=49), korfball clubs 72% (n =25), rugby league clubs 70% (n=27) and canoeing clubs 70% (n=46).
UPCOMING OPPORTUNITIES41
41Total level fndings for upcoming opportunities are based on weighted data from 1,902 clubs.
82

Sports Club Survey | Looking forward
Improving our facilities 54%Training and developing our coaches/staff/volunteers 49%
Securing grants for voluntary organisations 41%Developing existing links with local schools 36%
Increasing the number of volunteers 36%Establishing new links with local schools 36%
Promoting competitions and events 32%Formulating a development plan 26%
Increasing the number of disabled people who are members 21%Freedom within the sport (less red tape) 20%
Establishing links with universities 11%Capitalising on interest around volunteering from London 2012 8%
Other opportunity 4%No identifiable opportunities 9%
Opportunities for clubs in the next two years [n=1,902]
More than one in three clubs (36%) also say that they are looking forward to developing their existing links with schools (36%) and the same amount are looking forward to establishing new school links.
Given that more than half of clubs (58%) already have links with schools and the majority of these links (88%) are reported to be successful, this optimism around links with schools in the coming years is extremely encouraging. This suggests that existing good relationships will hopefully be set to continue and new ones will be forged.
This may help tackle the overall declining trend in junior memberships and importantly ensure young people are
encouraged to be active from an early age. In addition, one in ten clubs (11%) are looking forward to building links with universities, further reinforcing the role of sports clubs in the wider community.
One in fve clubs (21%) say that they see increasing the number of disabled people who are members as an opportunity in the next two years. Unsurprisingly, this is considerably higher amongst clubs specifcally for disabled people, where three in four (74%) see this as an opportunity (n=37). This is the same for clubs which run parallel sessions for disabled and non-disabled participants of which 55% of see this as an opportunity in the near future (n=126).
Sports that are the most enthusiastic about increasing numbers of disabled members are boccia, with 85% of clubs stating this (n=13), 58% of wheelchair basketball clubs (n=12), 42% of karate clubs (n=12) and 40% of archery clubs (n=52).
Clubs specifcally for disabled people are also more optimistic about promoting competitions and events, with two in fve (41%) stating this as an upcoming opportunity compared to one in three (32%) of all clubs. This is in contrast to the 26% of clubs specifcally for disabled people who are concerned about a lack of local competition in the coming years.
83

Club size by income Facility status Club type
84
Smal
l (<£
10k)
Mid
-siz
ed (£
10k-
£30k
)
Larg
e (>
£30k
)
No
finan
cial
dat
a
Do
not o
wn
a fa
cilit
y (h
ire,
leas
e,
and/
or u
se p
ublic
spa
ce)
Ow
n or
long
term
leas
e a
faci
lity
Acc
ess
to a
com
bina
tion
of f
acili
ties
Clu
bs s
peci
fical
ly fo
r no
n-di
sabl
ed
peop
le
Clu
bs s
peci
fical
ly fo
r di
sabl
ed
peop
le
Clu
bs th
at p
rovi
de o
ppor
tuni
ties
to
take
par
t tog
ethe
r
Clu
bs th
at p
rovi
de p
aral
lel s
essi
ons
Don
’t k
now
/Not
sur
e
747
ALL
CLU
BS
OPPORTUNITIES
BASE
Improving our facilities
Securing grants for voluntary organisations
Developing existing links with local schools
Increasing the number of volunteers
Establishing new links with local schools
Promoting competitions and events
Formulating a development plan
Freedom within the sport (less red tape)
Establishing links with universities
Other opportunity
No identifiable opportunities
Capitalising on interest around volunteering from London 2012
1902
54%
49%
41%
36%
36%
36%
32%
26%
21%
20%
11%
8%
4%
9%
429 374 353 988 636 279 665 37 945 126 129
43%
48%
37%
31%
31%
35%
31%
24%
18%
20%
12%
9%
4%
13%
57%
52%
48%
42%
42%
36%
26%
25%
23%
19%
11%
7%
3%
7%
75%
49%
47%
44%
41%
41%
33%
30%
25%
21%
9%
8%
4%
3%
50%
49%
35%
31%
32%
33%
39%
28%
23%
22%
11%
9%
2%
12%
21%
26%
21%
18%
17%
18%
17%
14%
10%
10%
6%
4%
2%
6%
23%
15%
13%
13%
13%
12%
10%
7%
8%
6%
3%
3%
1%
3%
9%
8%
7%
6%
6%
6%
5%
5%
4%
3%
1%
1%
1%
1%
52%
45%
37%
30%
35%
34%
22%
23%
7%
18%
7%
5%
3%
12%
14%
33%
46%
21%
24%
30%
41%
12%
74%
6%
13%
1%
3%
7%
55%
52%
43%
39%
36%
37%
38%
28%
27%
22%
12%
10%
4%
8%
60%
58%
49%
59%
51%
50%
42%
26%
55%
29%
21%
13%
7%
3%
55%
45%
35%
31%
28%
28%
31%
32%
8%
14%
15%
6%
5%
12%
Increasing the number of disabled people who are members
Training and developing our coaches/staff/volunteers
Clubs that provide parallel sessions for both disabled and non-disabled participants (n=126) are on the whole more optimistic than the average UK club. Three in fve (58%) are looking forward to developing existing links with local schools, compared to just over one in three (36%) of all clubs. A similar number (58%) of these clubs identifed training and developing their staff/coaches/volunteers as an opportunity, compared to one in two (49%) of all clubs.
The larger memberships at clubs which run specifc sessions for their participants combined with their perceptions of upcoming opportunities suggest that these clubs are larger and more stable. They may therefore be better placed to deliver a core offer to both disabled and non-disabled participants whilst growing their club and skills base.

Sports Club Survey | Looking forward
85
Although 36% of clubs are hopeful about increasing the number of their volunteers, fewer than one in ten clubs (8%) say that capitalising on interest around volunteering from the London 2012 Olympic and Paralympic Games represents an opportunity for them. Amongst clubs specifcally for disabled people (n=37), only
0.6% believe this to be the case. This is also in the wider context of three quarters of all UK clubs (73%) reporting that no new volunteers joined their club directly after the Games. All in all, this suggests that a lasting volunteer legacy from the Games may be unlikely, particularly for sports that didn’t take part in the Games and in disability clubs.
The sports that are clearly more optimistic about gaining new volunteers that have been inspired by the Games are all Olympic or Paralympic sports with 42% of wheelchair basketball clubs excited about this (n=12), 33% of table tennis clubs (n=21), 26% of fencing clubs (n=27), 22% of volleyball clubs (n=41), 21% of cycling clubs (n=19) and 20% of rowing clubs (n=75).
Mid-sized (n=322) and large clubs (n=245) are more likely to say that increasing their volunteer numbers is an upcoming opportunity with 42% and 41% respectively looking forward to this. This may be related to a greater need for volunteers and the desire to use a wide range of volunteer resource given their size.
Four per cent of clubs stated that they had other opportunities on the horizon than those listed. These included the possibility of capitalising on future major events such as the Glasgow 2014 Commonwealth Games, Sochi 2014 Winter Olympics or the 2015 Rugby World Cup as well as elite or competitive success and using new facilities to increase club sustainability.
“SEEING SOME OF OUR COMPETITORS REACH AND ACQUIT THEMSELVES WELL IN THE BRITISH CHAMPIONSHIPS GO ON TO BECOME INTERNATIONALS”- GYMNASTICS CLUB
APPENDIX
APPENDIX A - METHODOLOGY
Sports Club Survey | Appendix
THE SURVEY
The Sport and Recreation Alliance has conducted the Sports Club Survey biennially since 2007.
The 2013 Sports Club Survey was an online questionnaire available for any sports club in the UK to complete between 1 April and 30 June 2013. It took between 20 and 40 minutes to complete.
National governing bodies which are members of the Alliance were invited to include up to fve sport specifc questions which they asked their clubs as well as 24 general questions.
The survey covered:
SURVEY PROMOTION
The survey was widely promoted by the Alliance and through Alliance members via direct e-mails, newsletters, websites and social media.
All of the County Sports Partnerships and the sport representative bodies for Wales, Scotland and Northern Ireland were asked to promote the survey. Entry into a number of prize draws and a free energy audit were offered as incentives to encourage clubs to complete the survey.
club organisation and activity or activitiesstaff and volunteersmembersfacilitiesfnancesrelationships in the sport sectorclub development, challenges and opportunitiessport specifc questions.
87
APPENDIX B - SAMPLE AND CLUB TYPES
SURVEY SAMPLE AND WEIGHTING
After quality checking and removing duplicates 2,910 responses were received. These have been weighted to reflect the estimated profle of 151,000 sports clubs in the United Kingdom in order to make the results representative and to ensure consistency with previous Sports Club Surveys.
The weighted total is 2,909. As in previous years, the weights were calculated using the number of affliated clubs to different national governing bodies. All of the total level results are calculated using weighted data. Community Amateur Sports Club scheme (CASC) and sport specifc data is unweighted.
Not all clubs answered all questions. Base sizes for total level fndings are included as footnotes at the beginning of each section. Further breakdowns of base sizes, where applicable, are included in the text as (n=). Base sizes should be referred to when examining data.
Sport specifc data is unweighted and provided generally where the number of responses from that sport exceed ten. Exceptions to this are when the base size is known to be more than 10% of the sports clubs within this sport, despite being lower than ten.
This highlights that caution should be exercised when looking at sport specifc data as a seemingly small sample may proportionally represent a large number of clubs within a sport, such as in baseball/softball, whilst a seemingly high sample fgure can represent a very small proportion of clubs within that sport, for example, football.
The survey was completed by more than 100 different types of sport. The table below indicates sports where at least two responses were achieved.
AS IN PREVIOUS YEARS, THE WEIGHTS WERE CALCULATED USING THE NUMBER OF AFFILIATED CLUBS TO DIFFERENT NATIONAL GOVERNING BODIES
88

Main sport Sample
Cricket 427
Main sport Sample
Gliding 37
Rugby Union 361
Netball 37
Football 225
Korfball 33
Gymnastics 125
Motor sports 31
Rowing 115
Table tennis 29
Tennis 100
Cycling 28
Basketball 99
Snowsports (skiing and snowboarding) 27
Bowls 98
Judo 26
Archery 88
Shooting 20
Athletics (includes running) 79
Weightlifting 18
Hockey 79
Karate 17
Angling 73
Golf 15
Swimming (includes aquaticsand diving)
72
Tchoukball 15
Canoeing 63
Boccia 15
Sailing (includes windsurfng) 56
Triathlon 14
Volleyball 52
Wheelchair basketball 14
Horse riding/equestrian 47
Rugby League 41
Taekwondo 40
Fencing 39
Badminton 39
Orienteering 12
Sports Club Survey | Appendix
89

Main sport Sample
BMX 8
Main sport Sample
American football 3
Cheerleading 7
Goalball 3
Wrestling 7
Lacrosse 3
Surf life saving 6
Life saving 3
Mountain biking 6
Handball 2
Roller sports 6
Kurling 2
Sub aqua 6
Aikido 5
Boxing 5
Kickboxing 5
Martial arts 5
Hurling/camogie 5
Other air sports (exc. Gliding) 5
Ju jitso 4
Mountaineering/climbing 2
Wakeboarding/waterskiing 2
Wheelchair football 2
Kayaking 2
Disc Golf 2
Model boats 2
Greenlaning 2
Other 51
Baseball/softball 11
Squash and rackets 12
Gaelic football 10
Multi-sport (unable to choose main activity)
10
90
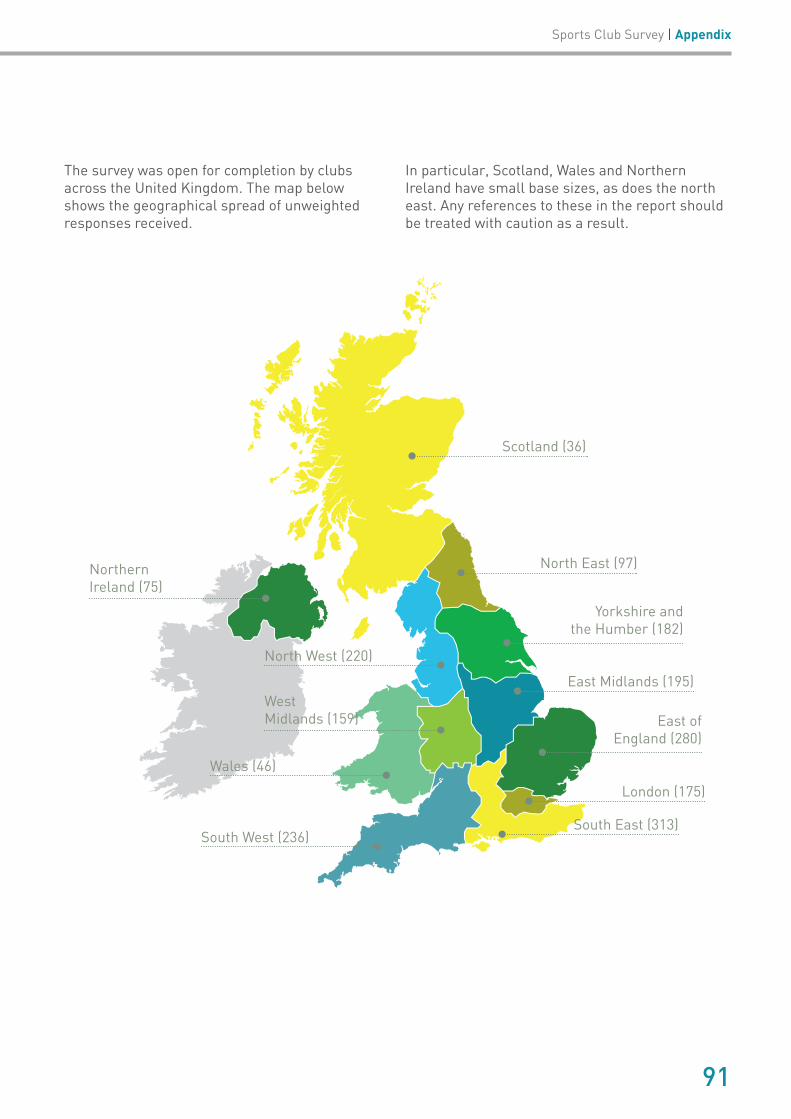
Sports Club Survey | Appendix
The survey was open for completion by clubs across the United Kingdom. The map below shows the geographical spread of unweighted responses received.
In particular, Scotland, Wales and Northern Ireland have small base sizes, as does the north east. Any references to these in the report should be treated with caution as a result.
Scotland (36)
North East (97)
Yorkshire andthe Humber (182)
East Midlands (195)
South East (313)
London (175)
East ofEngland (280)
NorthernIreland (75)
South West (236)
Wales (46)
WestMidlands (159)
North West (220)
91
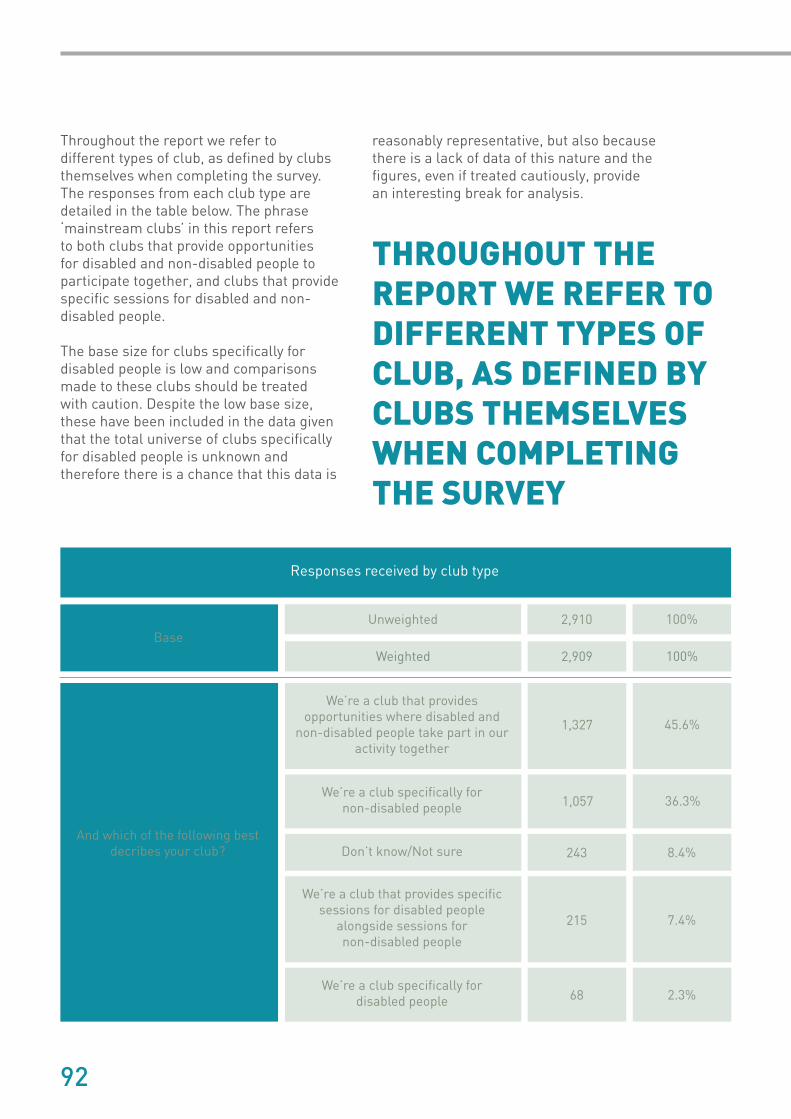
Responses received by club type
BaseUnweighted 100%2,910
Weighted 100%2,909
We’re a club that provides opportunities where disabled and
non-disabled people take part in our activity together
We’re a club specifcally for non-disabled people
Don’t know/Not sure
We’re a club that provides specifc sessions for disabled people
alongside sessions for non-disabled people
We’re a club specifcally for disabled people
45.6%1,327
36.3%1,057
8.4%243
7.4%215
2.3%68
And which of the following best decribes your club?
Throughout the report we refer to different types of club, as defned by clubs themselves when completing the survey. The responses from each club type are detailed in the table below. The phrase ‘mainstream clubs’ in this report refers to both clubs that provide opportunities for disabled and non-disabled people to participate together, and clubs that provide specifc sessions for disabled and non-disabled people.
The base size for clubs specifcally for disabled people is low and comparisons made to these clubs should be treated with caution. Despite the low base size, these have been included in the data given that the total universe of clubs specifcally for disabled people is unknown and therefore there is a chance that this data is
THROUGHOUT THE REPORT WE REFER TO DIFFERENT TYPES OF CLUB, AS DEFINED BY CLUBS THEMSELVES WHEN COMPLETING THE SURVEY
reasonably representative, but also because there is a lack of data of this nature and the fgures, even if treated cautiously, provide an interesting break for analysis.
92

Number of responses
Registered CASC 683
Percentage of sample
23%
Registered charity 279 10%
Clubmark accredited 1,200 41%
Sports Club Survey | Appendix
The following table shows the total number of unweighted responses by CASC, charity and Clubmark accredited clubs. Given that particular sports are more predominant within the CASC scheme and our data is weighted we refer to CASCs as unweighted in order to not distort the data artifcially.
In addition, CASCs are over-represented in our sample, which represents 10% of the total number of CASCs out there, we are therefore able to use this unweighted data confdently.
Some data is explored with regard to club size as determined by income. These defnitions have been used in keeping with earlier Sports Club Surveys. They are based on the income fgures given for the latest fnancial year by clubs. Small clubs are defned as those with an income of less than £10,000.
Mid-sized clubs are those with an income of between £10,000 and £30,000 and large clubs are those with an income of more than £30,000. Clubs which haven’t provided this information are excluded from this breakdown for the purpose of analysis and reporting, although this data is included for completedness.
*Please note that while clubs can be Clubmark accredited and a CASC or a charity, clubs cannot be a CASC and a charity.
COMPARISONS WITH EARLIER SPORTS CLUB SURVEYS
On the whole, the 2013 Sports Club Survey gathered data for the current year (2013) and this time last year (2012). This is with the exception of income and expenditure fgures, including calculations relating to clubs in surplus, defcit or breaking even. For income and expenditure fgures, the fnancial years asked about in the survey are the club’s last full fnancial year and the one before this. These are assumed to be 2012 and 2011 respectively either as calendar years or fnancial years.
93

Where clubs provided a date for their last fnancial year end, for eight out of ten clubs this included expenditure in 2012 suggesting that in the majority of instances this assumption is appropriate. Therefore, consistent to the approach taken in the 2009 and 2011 Sports Club Surveys we have treated the data provided as relating to 2012 and 2011 respectively.
Where fnancial fgures are compared with previous years, they do not account for inflation. With the exception of club income and expenditure fgures, data for 2009 is not held. The 2009 Sports Club Survey provides data for the two full years prior (2008 and 2007).
This approach changed in the 2011 survey which with the exception of club income and expenditure fgures referred to the current year and the one prior, providing 2011 and 2010 data. The same approach has been adopted in the 2013 survey, providing 2013 and 2012 data.
The introduction of new questions in 2013 means that in some instances comparisons with earlier club surveys are not possible.
In terms of how questions have been asked, junior membership fees have been recorded differently in the 2013 survey. In 2011, the question referred specifcally to junior participating members while in 2013 the question related to all junior members. Therefore, the fgures are not directly comparable although comparisons have been made across time with junior membership fees.
THE INTRODUCTION OF NEW QUESTIONS IN 2013 MEANS THAT IN SOME INSTANCES COMPARISONS WITH EARLIER CLUB SURVEYS ARE NOT POSSIBLE
94
Sports Club Survey | Appendix
LIMITATIONS
PROPORTIONAL TO THE TOTAL NUMBER OF CLUBS WITHIN A PARTICULAR SPORT, THE SURVEY RECEIVED LOW NUMBERS OF RESPONSES FOR SOME SPORTS
There is no census information on the total number of sports clubs in the UK, nor the total number of clubs in existence for each sport. Therefore the weights calculated to make the data more representative are necessarily based on the best estimates available.
Because one of the main ways in which the survey was promoted was through national governing bodies the results over-represent the situation of clubs which are affliated to a national governing body.
Proportional to the total number of clubs within a particular sport, the survey received low numbers of responses for some sports. Base sizes should be referred to when working with the individual sport results.
The form of the survey as an online questionnaire means that the research is reliant on one person to complete the survey on behalf of their club. This means that the views expressed are likely to reflect those of the individual completing the survey and may not be representative of the views of the club as a whole.
Although the survey was promoted across the UK, the vast majority of responses have been received from English clubs (92%, see fgure 1.1 above) and therefore the views of English clubs are overrepresented in the survey.
Larger and/or more formal clubs are likely to be over-represented in the survey as a result of the method of sampling through national governing bodies as these clubs may be likely to be more engaged with their national governing bodies.
95

WWW.SPORTANDRECREATION.ORG.UK
4TH FLOOR
BURWOOD HOUSE
14-16 CAXTON STREET
LONDON SW1H 0QT
T 020 7976 3900
F 020 7976 3901
@SPORTRECTWEETS