Embed Size (px)
Citation preview
April 2016
SPORT TOURISMA State of the Industry Report
in collaboration with

SPORT TOURISM A State of the Industry Report
KEY FINDINGS
Estimated visitor spending associated with sports events was $9.45b in 2015
VISITOR SPENDING IS ON THE RISE
Estimated visitor spending associated with sportsevents was $9.45b in 2015 (2014 - $8.96b; 2013 -$8.7b; 2012 - $8.3b). This is an indicator of the strength of sport tourism industry with growth occurring the past three years.
“STAY TO PLAY” IS DECREASING
Organizations requiring “stay to play” declined between 2014 and 2015. In 2015, 60% of members required “stay to play”, dropping 4% from one year ago.
FACILITY IMPROVEMENTS
Sport venues are being constructed and renovated in large numbers in the United States. Forty percent of respondents indicated they had new facility construction and development in their locale while 75% had area facilities that were renovated.
PRIORITIES ARE SHIFTING
The priorities for Sport Tourism organizations have shifted within the past year. Visitor Spending remains ranked #1 (30%), but this represents a 30% drop from 2014 rankings (60%).
SPORT TOURISM A State of the Industry Report
1
GENERAL INFORMATION
27% of NASC members operated on a budget of $100,000 or less in 2015.
PRIORITIES
The priorities of organizations have changed sincelast year’s survey. Visitor Spending remained the#1 priority; however, NASC member organizationsreported more variance in priorities in 2015 ascompared to 2014. In 2014, Visitor Spendingranked #1 by an overwhelming 60%. This year,Visitor Spending was #1 (30%) and Health andFitness and Sports Philanthropy were tied at #2(19%). Despite its #1 ranking by 30% of therespondents, Visitor Spending was also voted theleast important priority by 40% of the respondentsin 2016. This may indicate growing interest inother beneficial impacts of sport tourism.
GENERAL INFORMATION
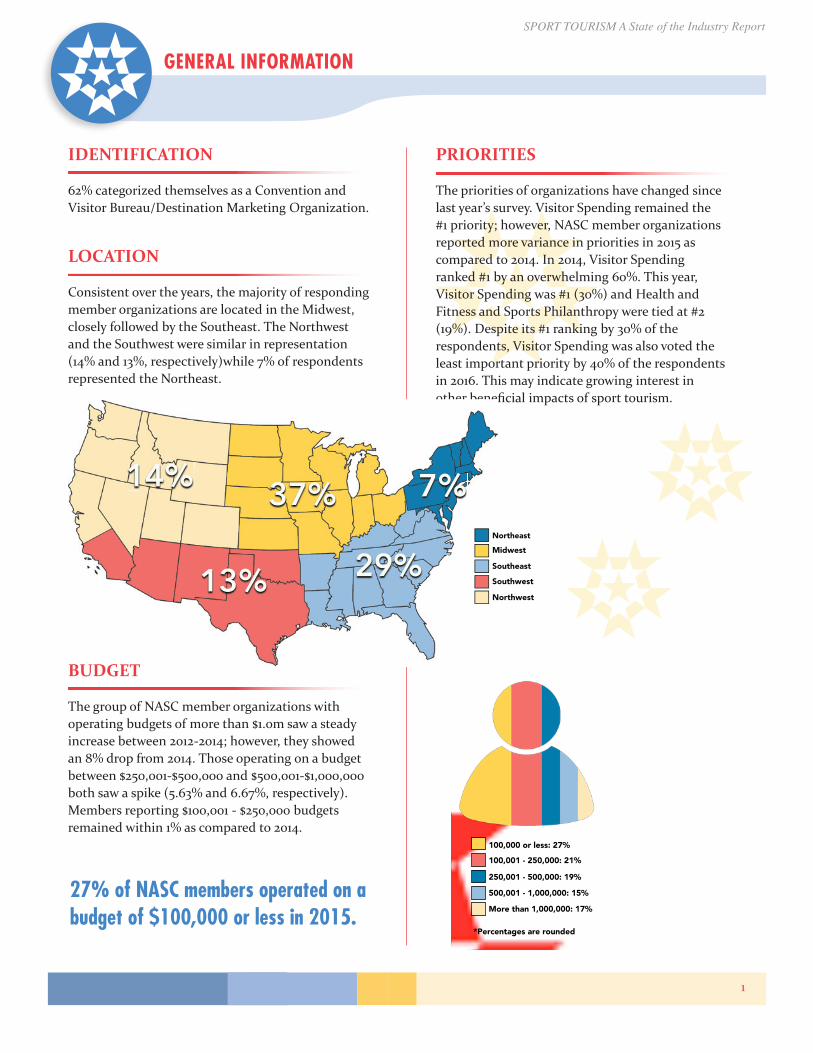
100,001 - 250,000: 21%
100,000 or less: 27%
250,001 - 500,000: 19%
More than 1,000,000: 17%
500,001 - 1,000,000: 15%
BUDGETThe group of NASC member organizations with operating budgets of more than $1.0m saw a steady increase between 2012-2014; however, they showed an 8% drop from 2014. Those operating on a budget between $250,001-$500,000 and $500,001-$1,000,000 both saw a spike (5.63% and 6.67%, respectively). Members reporting $100,001 - $250,000 budgets remained within 1% as compared to 2014.
27% of NASC members operated on a budget of $100,000 or less in 2015.
PRIORITIESThe priorities of organizations have changed since last year’s survey. Visitor Spending remained the #1 priority; however, NASC member organizations reported more variance in priorities in 2015 as compared to 2014. In 2014, Visitor Spending ranked #1 by an overwhelming 60%. This year, Visitor Spending was #1 (30%) and Health and Fitness and Sports Philanthropy were tied at #2 (19%). Despite its #1 ranking by 30% of the respondents, Visitor Spending was also voted the least important priority by 40% of the respondents in 2016. This may indicate growing interest in other beneficial impacts of sports tourism.
*Percentages are rounded
5
IDENTIFICATION
62% categorized themselves as a Convention and Visitor Bureau/Destination Marketing Organization.
LOCATION
Consistent over the years, the majority of responding member organizations are located in the Midwest, closely followed by the Southeast. The Northwestand the Southwest were similar in representation (14% and 13%, respectively)while 7% of respondents represented the Northeast.
BUDGET
The group of NASC member organizations withoperating budgets of more than $1.0m saw a steadyincrease between 2012-2014; however, they showedan 8% drop from 2014. Those operating on a budgetbetween $250,001-$500,000 and $500,001-$1,000,000both saw a spike (5.63% and 6.67%, respectively). Members reporting $100,001 - $250,000 budgets remained within 1% as compared to 2014.
Northeast
Midwest
Southeast
Southwest
Northwest
7%
29%13%
14% 37%
SPORT TOURISM A State of the Industry Report
2
VISITOR SPENDING
SPENDING
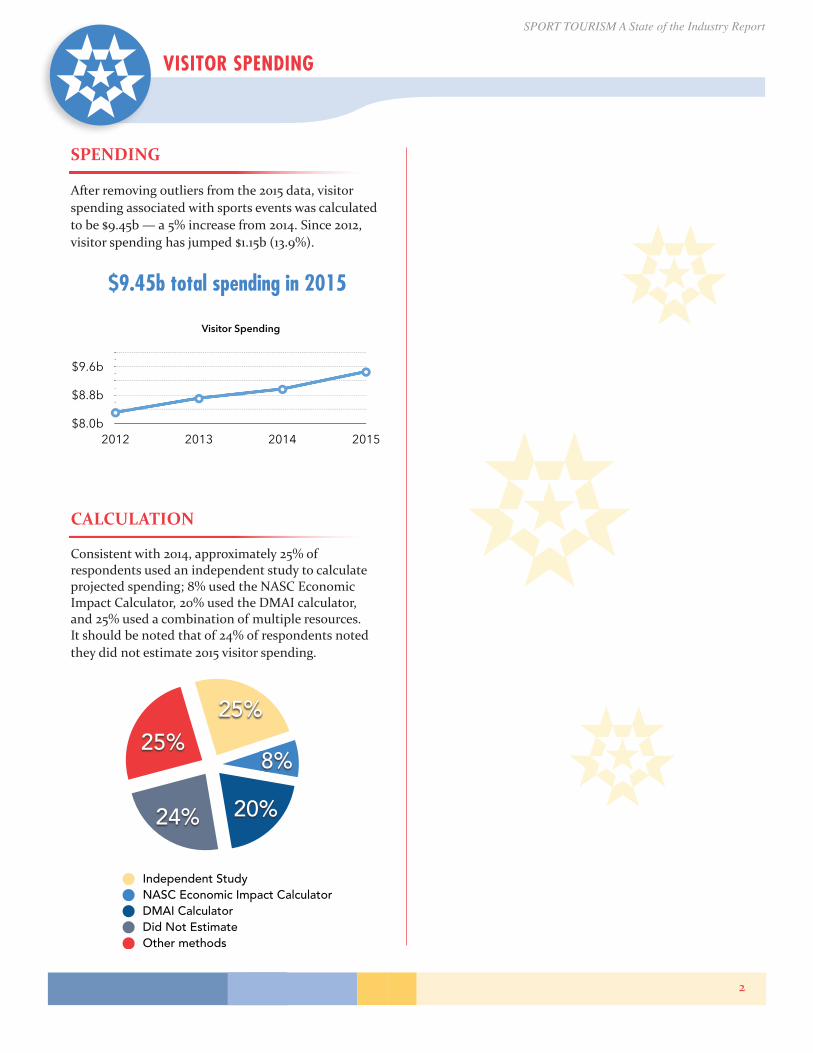
After removing outliers from the 2015 data, visitor spending associated with sports events was calculated to be $9.45b — a 5% increase from 2014. Since 2012, visitor spending has jumped $1.15b (13.9%).
CALCULATION
Consistent with 2014, approximately 25% of respondents used an independent study to calculate projected spending; 8% used the NASC Economic Impact Calculator, 20% used the DMAI calculator, and 25% used a combination of multiple resources. It should be noted that of 24% of respondents noted they did not estimate 2015 visitor spending.
$9.45b total spending in 2015
Visitor Spending
$8.0b
$8.8b
$9.6b
2012 2013 2014 2015
25%
24% 20%
8%
25%
SPORT TOURISM A State of the Industry Report
3
PERSONNEL
BOARD OF DIRECTORS
Personnel is an integral part to the success of an organization. Of the respondents in 2015, 81% of groups have a Board of Directors and 19% do not. From 2014 to 2015, there was an increase in the average size of Board of Directors from 15 to 23 members. This is a reverse trend from previous data indicating Board were becoming smaller. Survey participants reported Boards ranging from 7 to 120 members. Of those with Boards, 15% required a financial contribution; a 7%increase from 2014.
STAFFING
In 2015, organizations were highly dependent on a combination of full-time staff, part-time time staff, and interns. Respondents reported an average of 7full-time sports staff members and 4 part-time staff sports staff members. With respect to interns, organizations averaged 2 interns to compliment the fulltime and part-time staff. Organizations rarely relied on temporary staff except for their work alongside volunteers for event production. Most importantly, 100% of respondents rely on volunteers, with an average of 740 volunteers assisting organizations throughout the year.
89% of members have aBoard of Directors
100% of members reliedon volunteers
SPORT TOURISM A State of the Industry Report
4
BID FEES
Seventy-three percent of respondents paid bid fees in 2015, which is a slight increase from 69% in 2014. Of those that paid bid fees, 34% saw an increase in the price of fees another 55% reported no change as compared to 2014.
PUBLIC FUNDING
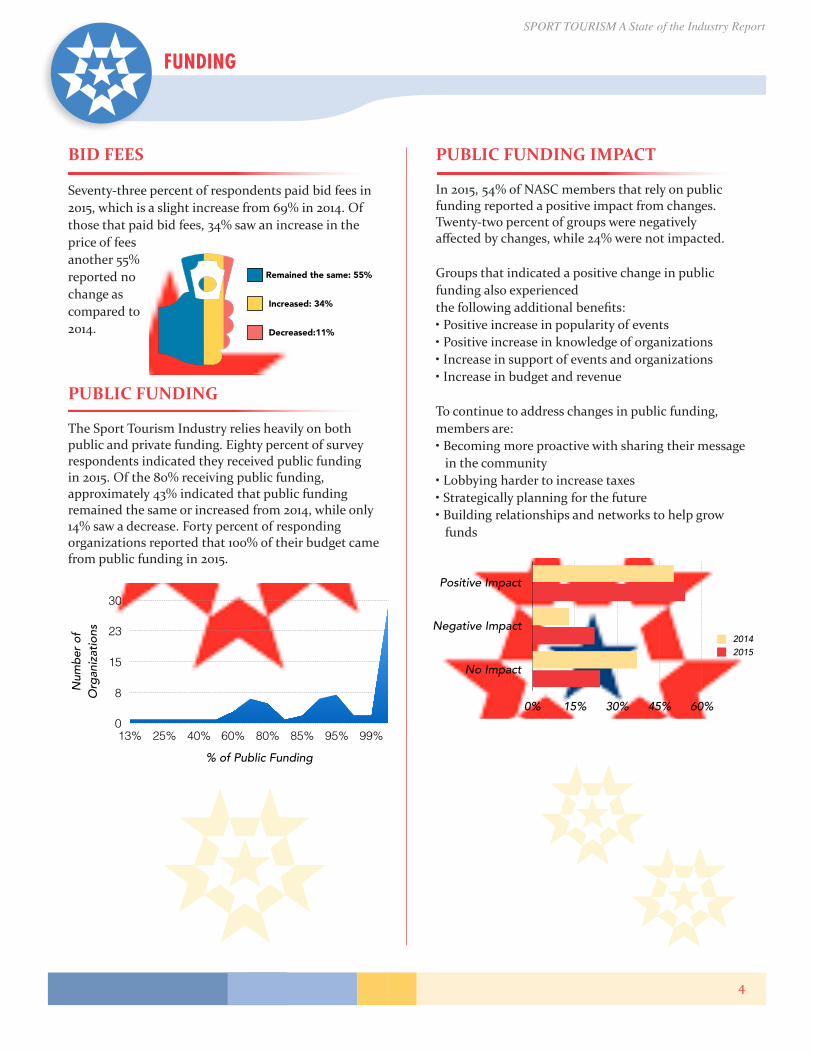
The Sport Tourism Industry relies heavily on both public and private funding. Eighty percent of survey respondents indicated they received public fundingin 2015. Of the 80% receiving public funding, approximately 43% indicated that public funding remained the same or increased from 2014, while only14% saw a decrease. Forty percent of responding organizations reported that 100% of their budget came from public funding in 2015.
FUNDING
PUBLIC FUNDING IMPACT
In 2015, 54% of NASC members that rely on public funding reported a positive impact from changes. Twenty-two percent of groups were negativelyaffected by changes, while 24% were not impacted.
Groups that indicated a positive change in public funding also experiencedthe following additional benefits:• Positive increase in popularity of events• Positive increase in knowledge of organizations• Increase in support of events and organizations• Increase in budget and revenue
To continue to address changes in public funding, members are:• Becoming more proactive with sharing their message
in the community• Lobbying harder to increase taxes• Strategically planning for the future• Building relationships and networks to help grow
funds
9
FUNDING
BID FEESSeventy-three percent of respondents paid bid fees in 2015, which is a slight increase from 69% in 2014. Of those that paid bid fees, 34% saw an increase in the price of fees another 55% reported no change as compared to 2014.
Remained the same: 55%
Increased: 34%
Decreased:11%
PUBLIC FUNDINGThe Sports Tourism Industry relies heavily on both public and private funding. Eighty percent of survey respondents indicated they received public funding in 2015. Of the 80% receiving public funding, approximately 43% indicated that public funding remained the same or increased from 2014, while only 14% saw a decrease.
Forty percent of responding organizations reported that 100% of their budget came from public funding in 2015.
Num
ber
of
Org
aniz
atio
ns
0
8
15
23
30
% of Public Funding
13% 25% 40% 60% 80% 85% 95% 99%
10
PUBLIC FUNDING IMPACTIn 2015, 54% of NASC members that rely on public funding reported a positive impact from changes. Twenty-two percent of groups were negatively affected by changes, while 24% were not impacted.
Positive Impact
Negative Impact
No Impact
0% 15% 30% 45% 60%
20142015
Groups that indicated a positive change in public funding also experienced the following additional benefits: • Positive increase in popularity of events • Positive increase in knowledge of organizations • Increase in support of events and organizations • Increase in budget and revenue
To continue to address changes in public funding, members are: • Becoming more proactive with sharing their message in the community • Lobbying harder to increase taxes • Strategically planning for the future • Building relationships and networks to help grow funds
FUNDING
SPORT TOURISM A State of the Industry Report
5
MARKETING
SECURING SPONSORSHIPS
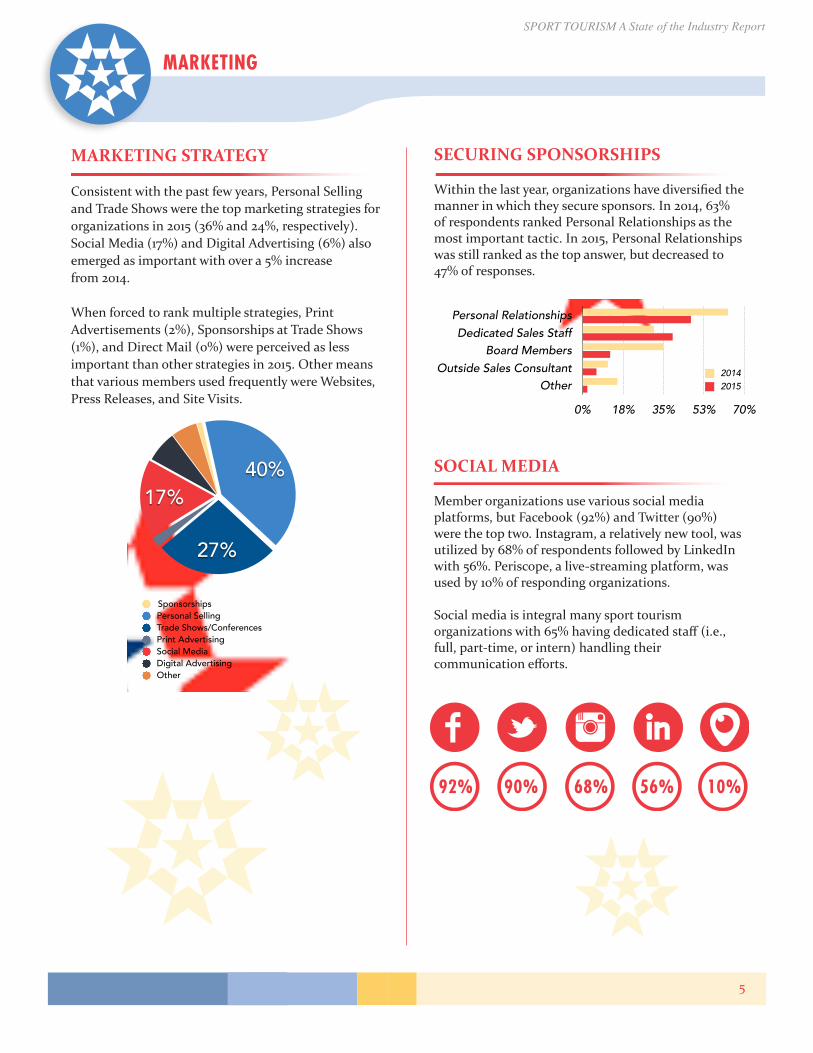
Within the last year, organizations have diversified the manner in which they secure sponsors. In 2014, 63% of respondents ranked Personal Relationships as the most important tactic. In 2015, Personal Relationships was still ranked as the top answer, but decreased to 47% of responses.
SOCIAL MEDIA
Member organizations use various social media platforms, but Facebook (92%) and Twitter (90%) were the top two. Instagram, a relatively new tool, was utilized by 68% of respondents followed by LinkedIn with 56%. Periscope, a live-streaming platform, was used by 10% of responding organizations.
Social media is integral many sport tourism organizations with 65% having dedicated staff (i.e., full, part-time, or intern) handling their communication efforts.
11
MARKETING
MARKETING STRATEGYConsistent with the past few years, Personal Selling and Trade Shows were the top market ing s t rategies for organizations in 2015 (36% and 24%, respectively). Social Media (17%) and Digital Advertising (6%) also emerged as important with over a 5% increase from 2014.
When forced to rank multiple strategies, Print Advertisements (2%), Sponsorships at Trade Shows (1%), and Direct Mail (0%) were perceived as less important than other strategies in 2015. Other means that various members used frequently were Websites, Press Releases, and Site Visits.
SECURING SPONSORSHIPSWithin the last year, organizations have diversified the manner in which they secure sponsors. In 2014, 63% of respondents ranked Personal Relationships as the most important tactic. In 2015, Personal Relationships was still ranked as the top answer, but decreased to 47% of responses.
Personal RelationshipsDedicated Sales Staff
Board MembersOutside Sales Consultant
Other
0% 18% 35% 53% 70%
20142015
17%
27%
40%
Sponsorships Personal SellingTrade Shows/ConferencesPrint AdvertisingSocial MediaDigital AdvertisingOther
MARKETING STRATEGY
Consistent with the past few years, Personal Selling and Trade Shows were the top marketing strategies fororganizations in 2015 (36% and 24%, respectively). Social Media (17%) and Digital Advertising (6%) also emerged as important with over a 5% increase from 2014.
When forced to rank multiple strategies, Print Advertisements (2%), Sponsorships at Trade Shows (1%), and Direct Mail (0%) were perceived as less important than other strategies in 2015. Other means that various members used frequently were Websites, Press Releases, and Site Visits.
92% 90% 68% 56% 10%
SPORT TOURISM A State of the Industry Report
6
FACILITIES
IMPROVEMENTS
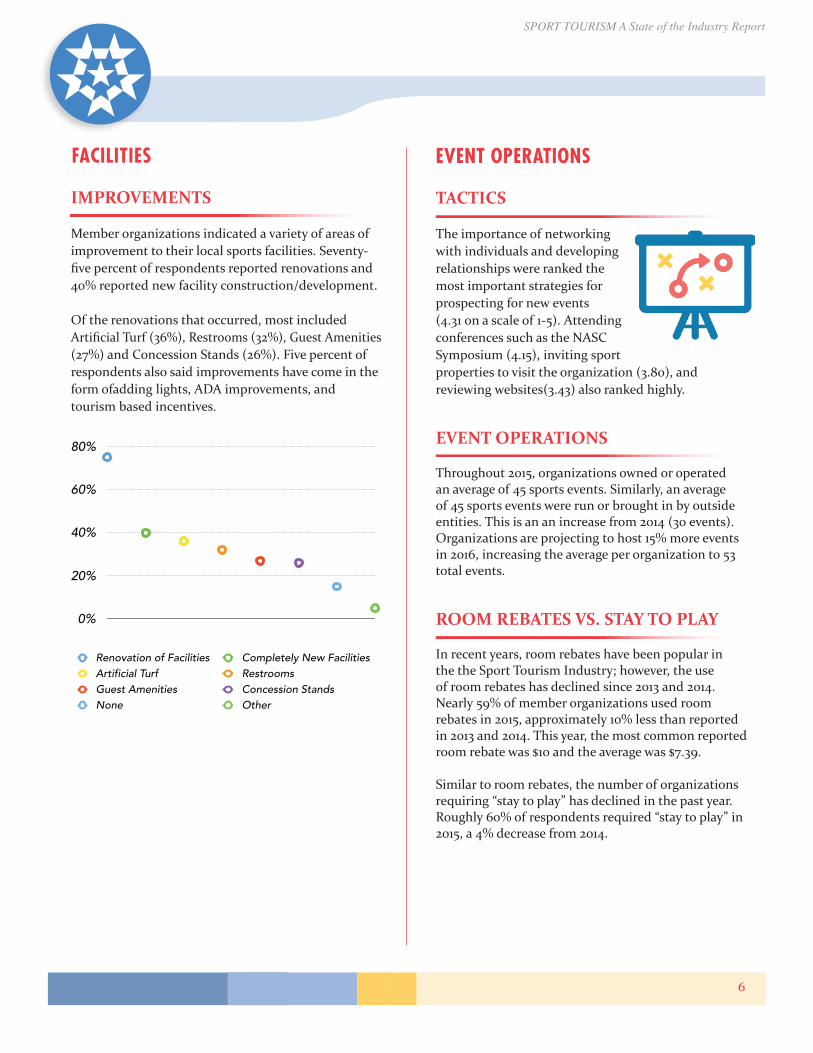
Member organizations indicated a variety of areas of improvement to their local sports facilities. Seventy-five percent of respondents reported renovations and 40% reported new facility construction/development.
Of the renovations that occurred, most included Artificial Turf (36%), Restrooms (32%), Guest Amenities (27%) and Concession Stands (26%). Five percent of respondents also said improvements have come in the form ofadding lights, ADA improvements, and tourism based incentives.
0%
20%
40%
60%
80%
Renovation of Facilities Completely New FacilitiesArtificial Turf RestroomsGuest Amenities Concession StandsNone Other
TACTICS
The importance of networking with individuals and developing relationships were ranked the most important strategies for prospecting for new events (4.31 on a scale of 1-5). Attending conferences such as the NASC Symposium (4.15), inviting sport properties to visit the organization (3.80), and reviewing websites(3.43) also ranked highly.
EVENT OPERATIONS
Throughout 2015, organizations owned or operated an average of 45 sports events. Similarly, an average of 45 sports events were run or brought in by outside entities. This is an an increase from 2014 (30 events). Organizations are projecting to host 15% more events in 2016, increasing the average per organization to 53 total events.
ROOM REBATES VS. STAY TO PLAY
In recent years, room rebates have been popular inthe the Sport Tourism Industry; however, the useof room rebates has declined since 2013 and 2014.Nearly 59% of member organizations used roomrebates in 2015, approximately 10% less than reported in 2013 and 2014. This year, the most common reported room rebate was $10 and the average was $7.39.
Similar to room rebates, the number of organizations requiring “stay to play” has declined in the past year. Roughly 60% of respondents required “stay to play” in 2015, a 4% decrease from 2014.
EVENT OPERATIONS
SPORT TOURISM A State of the Industry Report
7
SURVEY OBJECTIVE
A research team from Ohio University Sports Administration worked with the National Association of Sports Commissions (NASC) to create the 2015 State of the Industry Report. The research team was tasked with creating and distributing a survey, collecting and analyzing the gathered data, and identifying current trends within the Sport Tourism Industry.
When forced to rank multiple strategies, Print Advertisements (2%), Sponsorships at Trade Shows (1%), and Direct Mail (0%) were perceived as less important than other strategies in 2015. Other means that various members used frequently were Websites, Press Releases, and Site Visits.
SURVEY COORDINATION
Together, the NASC and Ohio University research team reviewed and edited the 2014 survey. Once edited by both parties, the final 2015 survey wascreated and distributed.
SURVEY DISTRIBUTION
The survey was created using Qualtrics research system and distributed via e-mail to all NASC members. It was e-mailedby an NASC employee in December 2015 and closed during February 2016. All information was submitted anonymously and the Ohio University research team had no contact with NASC members.
In order to increase survey participation, the NASC offered the chance to win a Fitbit to one respondent chosen at random.
METHODOLOGY
DATA ANALYSIS
The Ohio University research team exported the data into Microsoft Excel and then sorted and organized the information for analysis. The researchers cleaned the data, removed outlier data, and used descriptive analysis to provide actionable results to NASC members.

National Association of Sports Commissions9916 Carver Rd., Suite 100Cincinnati, OH 45242