Embed Size (px)
Citation preview

Acta Astronautica 63 (2008) 1350–1359www.elsevier.com/locate/actaastro
Sporadic structures in equatorial ionosphere as revealed from GPSoccultation data
O.I. Yakovleva, J. Wickertb, A.G. Pavelyeva,∗, S.S. Matyugova, V.A. Anufrieva
aInstitute of Radio Engineering and Electronics, Russian Academy of Sciences, Russian FederationbGeoForschungsZentrum Potsdam (GFZ — Potsdam), Germany
Received 28 March 2008; accepted 30 May 2008Available online 9 July 2008
Abstract
A method for monitoring of sporadic formations in the lower ionosphere by use of the amplitude and phase variations ofdecimeter radio waves in the occultation trans-ionospheric link GPS satellite — LEO CHAMP satellite is described. Typicalvariations of the amplitude and phase of the occultation signal, caused by layered formations in the lower ionosphere, areconsidered. Parameters of sporadic structures measured during period of especially strong solar flashes from October 25 tillNovember 9, 2003, are described. Results of statistical analysis of the occurrence frequency of sporadic layers, their altitudedistribution, and thickness are presented. The electron density distribution in the lower ionosphere in the equatorial zone isestimated.© 2008 Elsevier Ltd. All rights reserved.
Keywords: Satellite; Monitoring; Ionosphere; Radio occultation
1. Introduction
Sporadic formations ES are thin layered structures inthe E-layer of the ionosphere with heightened values ofthe electron density relative to an average background.Sporadic formations ES usually have sharp changes inthe vertical gradient of the electron density. Knowledgeof characteristics of sporadic ES formations is impor-tant for studying the solar-terrestrial interconnectionsand atmospheric dynamics. The Earth-based methodswere used previously for studying the structure of thelower ionosphere: vertical and oblique radio-sounding,investigation of UHF radio waves propagation effects,and occasional measurements by use of geophysical
∗ Corresponding author. Fax: +7 495 702 95 72.E-mail address: [email protected] (A.G. Pavelyev).
0094-5765/$ - see front matter © 2008 Elsevier Ltd. All rights reserved.doi:10.1016/j.actaastro.2008.05.023
rockets [1,2]. As a result a great volume of data aboutES structures has been obtained in the Northern Hemi-sphere’s moderate latitudes, and minor volume of datais relevant to the equatorial areas. Radio occultationin the satellite–satellite [3,4] communication links is aperspective method for global monitoring of ES lay-ers. The first experiments, which have been carriedout in the decimeter wave band in the communicationlinks the MIR station — geostationary satellites andnavigating satellites GPS — satellite Microlab-1 (mis-sion GPS/MET), have shown that the radio occultationmethod allows one to determine the altitude profiles ofelectron density in the lower ionosphere with resolutionsufficiently adequate for studying thin layered structures[5,6]. The further researches were provided by use ofcommunication links GPS–CHAMP. During missionsGPS/MET and CHAMP a great volume of radio occul-tation data has been obtained. These data now are used
O.I. Yakovlev et al. / Acta Astronautica 63 (2008) 1350–1359 1351
for investigation of characteristics of the lower iono-sphere. Application of various techniques for analysisof radio occultation data allowed investigating sporadiclayers morphology, studying the wave phenomena andturbulence in the lower ionosphere [7–14].
Determination of the ionospheric parameters is dif-ficult below 120 km altitudes because of low electrondensity and smallness of the phase and amplitudechanges of decimeter waves. It is essential that duringradio occultation the line of sight passes through theupper part of the ionosphere where the electron densityis high and, therefore, this part can contribute apprecia-ble variations in the RO signal. Instability of the upperionosphere imposes restrictions on the possibility ofmonitoring of the lower ionosphere. For this reason it isnecessary to find out what characteristics of the lowerionosphere and under what conditions can be definedby radio occultation measurements. For this purposewe analyze the features of changes in the amplitudeand phase of radio waves caused by ES structures inthe equatorial ionosphere and we substantiate a simplemethod of determination of the height, thickness, andother characteristics of sporadic layers. To achieve thisaim we used results of 684 radio occultation eventsin the equatorial ionosphere, relevant to period fromOctober 25 till November 9, 2003. This period is char-acterized by the record-breaking series of intensive solarflashes alternating with quiet solar conditions. The ra-dio occultation events in which measurements began atthe altitude of the line of sight about 120 km have beenselected for analysis. The local time in the investigatedareas was close to noon or midnight. From October25 till November 9, 2003 381 event of measurementsfrom ∼ 12 o’clock till ∼ 14.5 o’clock and 303 eventsfrom ∼ 0 o’clock till 2.5 o’clock of local time satisfythese conditions. The purpose of this paper consists instudying the changes in the amplitude and phase of ROsignal during sounding of ES structures, developmentof a new technique for revealing of such structures,and determination of the characteristic parametersof sporadic formations in the equatorial area within±30◦ latitude.
2. Features in changes in the amplitude and phaseof radio waves
Results of measurements of the amplitude and phaseof coherent signals emitted by navigating satellites GPSat frequencies f1 = 1.575 GHz and f2 = 1.228 GHzand received on board satellite CHAMP were used forthe determination of the ionospheric ES structures pa-rameters. The scheme of radio occultation experiment
О
DC
HCK
D2C2
D1C1GA
Hg
a
B
Fig. 1. Geometry of RO measurements.
is shown in Fig. 1. GPS satellite is located at point Gat the altitude Hg = 20 200 km, the satellite CHAMPis moving along the circular orbit C1C2 with heightHc = 470 km, the shaded circle corresponds to terres-trial surface, point O is the center of the Earth. It ispossible to consider the radio ray path GC as a straightline because at GPS frequencies f1 and f2 the refrac-tion effect in the ionosphere is small. The minimumheight H of the line of sight GC over the terrestrialsurface is reached at point D, where H = DK (Fig. 1).When the satellite CHAMP moves to the Earthlimb the height of the line of sight decreases and atH = D1K ≈ 120.130 km the registration of the am-plitude and phase of RO signals begins with samplingfrequency 50 Hz. The speed of change of the minimumheight of the line of sight dH/dt is in average approx-imately equal to 2.2 km s−1; therefore, during the timeinterval 40–50 s the altitude of point D changes fromH1 = D1K = 130 km to H2 = D2K = 40 km and thesatellite occupies position C2 (Fig. 1). Usually duringone RO event approximately 2 × 10³ measurementsof the amplitude E at frequency f1 and the phaseexcesses �1 and �2 at frequencies f1, f2 caused bythe influence of the plasma environment on the lineGC have been provided. For brevity, we will name thephase path excess as the phase. The refraction effectsin the lower ionosphere are small and, as a conse-quence, the average level of the RO signal amplitudechanges slightly. The amplitude variations relative tothe average level have different intensities, frequencies,and origin. High-frequency fluctuations of the ampli-tude are caused by the receiver noise and small-scaleirregularities of the electron density. The influences oflarge-scale irregularities and layered structures of theionosphere lead to low-frequency amplitude variations.The phases �1 and �2 change because of the differentconditions in the ionosphere by 10 times. These vari-ations are caused owing to the regular contribution ofthe total electron content (TEC) along the line of sight

1352 O.I. Yakovlev et al. / Acta Astronautica 63 (2008) 1350–1359
GC and the change in the length of the ray line whenthe altitude H is diminishing. Besides the big regularchange, the phases �1 and �2 fluctuate because of theinfluence of noise and small-scale irregularities andhave the low-frequency variations caused by ES struc-tures. The influence of ES structures is masked inthe amplitude data by fluctuations of different nature.Besides the influence of ES structure, the phase dataas opposed to the amplitude data are the subject ofcomplicated great regular effects. Partial compensa-tion of interfering regular effect can be reached byapplication of various ways of processing both the am-plitude and phase data. Regular change in the phases�1 and �2 because of the increase in the distanceGC is excluded by use of difference of the phaseexcesses:
�0 = �2 − �1 = f 21 f 2
2
40.4(f 21 − f 2
2 )
∫ G
C
N(h) dl
= 9.496 × 10¹⁶I , (1)
where �1 and �2 are the phase path excesses (m), f1 andf2 are the signal frequencies (Hz), N(h) is the verticalprofile of the electron density (electrons/m3), dl is theinfinitesimal element of ray path GC (m), I is the totalelectron content along the radio link GC (electrons/m2).It follows from Eq. (1), that �0 is proportional to theTEC I.
TTEC I depends on regular change and variationscaused by ionospheric instability. It is possible topresent the altitude dependence I (H) as the sum oftwo components: I =I0(H)+I1(H, t). The componentI0(H) defines the contribution of the lower ionosphere,and I1(H, t) characterizes the interfering influence ofthe upper part of the ionosphere. Function I1(H, t) hasa wide spectrum: fast fluctuations are caused by small-scale heterogeneity of the ionospheric plasma and slowvariations — by spatial and time variability of the up-per ionosphere. We have analyzed the slow variationsI1(H, t) since they impose restrictions on the possi-bility of determination of the altitude dependence ofthe electron density in the lower ionosphere. For thispurpose we used the standard model of the ionosphereIRI-2001 [15] and results of our measurements of I (H)
in the H = 60.120 km altitude interval. The analysis,provided by the use of the IRI-2001 model with thegeographical and time parameters corresponding toreal measurements, has shown that in the afternoonI ≈ 380 TECU (1 TECU = 1016 electrons/m2) on av-erage, at the H =130 km altitude. The regular variationI is about 55 TECU when the altitude H changes from
130 to 60 km. As it follows from experimental data, thechange in the TEC I varies from 60 to 90 TECU whenthe altitude H diminishes from 130 to 60 km, and thelower ionosphere contribution I0 in the altitude interval90–110 km is equal to 13–15 TECU, i.e. about 3–4% ofthe TEC on the line GC. Small values of the observableeffects force one to use different techniques of detectionof sporadic structures parameters.
Examples of the amplitude E (left panel) and phaseincrement �� (right panel) variations at frequency f1are shown in Fig. 2. These examples correspond to ra-dio occultation of typical layered structures in the lowerionosphere. The amplitude E of the RO signal is nor-malized to its level in free space where E = 1, and thephase increments �� have been obtained by excludingthe regular trend in the registered phase �1. Similar-ity of the variations caused by thin layered structuresin the altitude profile of the electron density is obvi-ously visible in the dependence of the amplitude andthe smoothed phase on height H.
During radio occultation of the Es formations onecan observe three characteristic types of variations inthe amplitude and the smoothed phase of the radiowaves corresponding to features in the altitude dis-tribution of the electron density. For the first type ofvariations a smooth change in the amplitude andphase of radio waves of a kind “maximum–minimum–maximum” is characteristic when the height of the lineof sight diminishes. The second type is characterizedby frequent, almost periodic, scintillations of the am-plitude and smoothed phase. As it appears, this typemay correspond to parceling of Es layer into morethin layers. Also a wave structure can be a cause ofquasi-periodical changes in the amplitude and phase.The third type is characterized by the occurrence ofintensive fluctuations of the amplitude and phase inthe narrow altitude interval �h = 2.3 km. Sometimesthe strong increase in fluctuations exists simultane-ously in two close altitude intervals: 92–94 km and99–112 km, that obviously indicates strong local turbu-lence of plasma at these heights. In some cases growthof intensity of the amplitude fluctuations is observedin the limited altitude interval. This growth is not ac-companied, however, by appreciable changes in thesmoothed phase. We connect the first and second typesof variations of the amplitude and phase with influ-ence of obviously expressed — “intensive” — sporadicstructures. The amplitude and phase variations of thesetypes are observed in 34% cases of detection of spo-radic layers influence. The variations of the third typecaused by poorly expressed Es structures with raisedturbulence of environment are observed in 66% cases.

O.I. Yakovlev et al. / Acta Astronautica 63 (2008) 1350–1359 1353
88
0.8
1
1.2
1.4
E 0.6
0.8
1
1.2
1.4
0.6
0.8
1
1.2
1.4
0.4
0.6
0.8
1
1.2
1
2
3
4
1
2
3
4
0
2
-2
2
-2
0
2
0
-2
2
0
-2
H, km
Δ�, c
m
112
110
108
106
104
102
1009896949290 88
H, km
112
110
108
106
104
102
1009896949290
Fig. 2. Variations of the amplitude E (left panel) and smoothed phase �� (right panel) as functions of the ray perigee height H. Curves1–4 correspond to the following conditions of measurements: curve 1 — 2003-10-26, UT — 7.14 h, LT — 13.9 h, Lat. — 19.42◦S, Lon. —100.8◦E; curve 2 — 2003-10-25, UT — 7.31 h, LT — 1.89 h, Lat. — 30.74◦N, Lon. — 278.7◦E; curve 3 — 2003-11-05, UT — 4.17 h, LT— 11.78 h, Lat. — 2.3◦S, Lon. — 114.02◦E; curve 4 — 2003-10-27, UT — 13.13 h, LT — 0.61 h, Lat. — 12.98◦N, Lon. — 172.17◦E.
3. Two methods or determination of Es structuresparameters
We applied two different methods for processing ofexperimental data depending on the degree of expres-siveness of Es structures. It is possible to apply an Abelintegral transform to the phase or amplitude data for de-termination of characteristics of “intensive” layers. Theuse of the Abel transform yields good result if intensiveEs layers satisfy the condition of spherical symmetry.We will address to Fig. 1 where dotted circle AB has ra-dius r1 =a+H1 (H1 ≈ 130 km — the minimum heightof the line of sight at the moment of the beginning ofmeasurements), and circle C1C2 has radius Rc=a+Hc.When satellite CHAMP moves the height H decreasesand there is a change in TEC along the line GC. Wehave presented this change by two components: I0(H)
— the TEC along the length AB located in the lower
ionosphere, and I1(H, t) — the TEC along the lengthsCA and BG in the upper ionosphere. The TEC alongthe ray link GC can be described via the following ex-pression:
I (H, t) =∫ B
A
N dl +[∫ A
C
N dl +∫ G
B
N dl
]
= I0 + I1. (2)
Limits of integration in Eq. (2) are defined by the endsof line of sight GC, and the sum of the terms in thesquare brackets is equal to I1. We will assume that dur-ing the time of sounding, approximately equal to 20 s,the ionosphere is spherically symmetric, ionosphericconditions do not change, and ionospheric refraction issmall. In this case the line of sight GC can be consideredas a straight line and variations of the TEC are causedonly by the change in the height H. Eq. (2) then can be

1354 O.I. Yakovlev et al. / Acta Astronautica 63 (2008) 1350–1359
written in the form
I (H) = 2∫ r1
ro
N(r)r dr√r2 − r2
o
+[
2∫ Rc
r1
N(r)r dr√r2 − r2
o
+∫ Rg
Rc
N(r)r dr√r2 − r2
o
]. (3)
where ro = a + H , r is the integration variable, Rc andRg are accordingly the radii of the CHAMP and GPSorbits. Value I (H) in ratio (3) is known from measure-ments. The first component in the right side of Eq. (3)depends only on the electron density in the lower iono-sphere. The components in the square brackets describethe contribution of the upper ionosphere. This contri-bution is equal to I1. After transferring of componentsin the square brackets into the left side of formula (3),we will obtain the integral equation for the unknownaltitude profile N(r) in lower ionosphere
I (H) − I1(H) = 2∫ r1
ro
N(r)r dr√r2 − r2
o
. (4)
Eq. (4) can be solved by use of an Abel integral trans-form. For solution to Eq. (4) it is necessary to knowthe dependence I1(H), relevant to the contribution ofthe upper ionosphere. We found dependence I1, settingthe altitude profile N(h) at h�H1 from the ionosphereIRI-2001 model for known geographical coordinates ofpoint D, date and time of measurements. The equality tozero of values N(h) and dN/dh at heights below 80 kmwas a criterion of correctness of restoration. The sug-gested way for restoration of the altitude profile N(h)
in lower ionosphere introduces the maximum error inthe determination of N(h) at the altitude, where mea-surements are initiated. This error is caused mainly bymistakes in the altitude dependence I1(H). Our analy-sis shows that deflections from spherical symmetry ofthe ionosphere introduce the main contribution to thiserror. For this reason it is not always possible to restorethe altitude profile of the electron density in the lowerionosphere despite obviously expressed influence of ESstructures on the amplitude and phase of occultationsignal.
A method or analysis of the primary amplitude andphase data at frequency f1 is effective for determina-tion of parameters of ES formations for which it is notpossible to restore the altitude profiles of the electrondensity, and also in the case of weak layers. It is known,that the amplitude of RO signal is most sensitive to vari-ations of the vertical gradient of the electron density ina vicinity of point D — the perigee of the line of sight,and phase is sensitive to variations of the total electron
content along the ray GC (Fig. 1) [3]. Existence of lin-ear connection between the amplitude variations of oc-cultation signal and the second derivative of phase hasbeen shown in works [16,17]. This connection essen-tially facilitates determination of parameters of layeredstructures and raises its reliability.
Process in the analysis of primary radio occultationdata consisted of the following. The measured ampli-tude E of RO signal at frequency f1 was normalizedto its level in free space. Observable variations of thenormalized amplitude have low-frequency and high-frequency components. The low-frequency componentis caused by changes in the altitude profile of the elec-tron density N(h) in the vicinity of ray perigee D, andhigh-frequency fluctuations correspond to recevier’snoise and small-scale irregularities of the ionosphere.As shown in [11], the root-mean-square fluctuationsof the amplitude of RO signal because of influence ofnoise and small-scale ionosphere irregularities reached1.5–2% during the considered period of time. Theroot-mean-square fluctuations of the phase on the timeinterval nearby 10 s were ∼ 5 mm. Hence, the influ-ence of sporadic layers can be reliably revealed, if itexceeds ∼ 5% in the amplitude and ∼ 5 mm in thesignal phase. As follows from experimental data whenthe height of the line of sight is diminishing from 120to 70 km there is a considerable change in the phaseabout tens of centimeters while the variations relevantto the influence of sporadic structures were about unitsof centimeters. Procedure of data filtration for exclud-ing the regular change has been applied to detect thephase variations caused by weak ES structures. Thetemporal dependence �1(t) of the RO signal phase atfrequency f1, received with sampling frequency 50 Hz,has been smoothed by a sliding average method that isequivalent to application of the low-frequency filter. Asa result the temporal dependence �10(t), characterizingthe smoothed changes in the phase, has been obtained.Then the difference �(t)=�1(t)−�10(t) has been cal-culated, which corresponds to the phase variations rel-ative to the average trend. Such procedure of the phasedata processing allows one — depending on the choseninterval of smoothing — to allocate the primary influ-ence of the ionospheric structures with different verticalscales. Our analysis has shown that for correspondencebetween the phase and amplitude data, the smoothingon 51 samples, equivalent to the time averaging ∼ 1 s, isoptimal. This corresponds to averaging of the phase dataon the vertical scale ∼ 2 km. Such method of regulartrends exception allows one to detect the weak sporadicformations and to determine their altitude, thickness andintensity.
O.I. Yakovlev et al. / Acta Astronautica 63 (2008) 1350–1359 1355
For more authentic determination of the ESstructures parameters we made comparison of theexperimental and theoretical dependences E(H) and�1(H). For modeling various altitude profiles of theelectron density N(h) have been used and dependencesE(H) and �1(H) were calculated. The phase path ex-cess can be modeled most simply. Previously existenceof two types of sporadic formations was revealed: lay-ers with a local maximum of the electron density N
and areas with sharp change of the vertical gradientdN/dh [1,2]. It is supposed, that thin sporadic layershave sharp boundary, and these layers are imposed onan average background, and there is no any consider-able decrease in electron density on both sides of alayer [1]. For the description of layers of such type thenext model is applicable
N = Nm
[1 −
(h − hm
d
)2]
,
N = 0 for h�hm + d and h�hm − d , (5)
where Nm is the additional to the background electrondensity in the layer’s maximum, hm is the height ofmaximum, and d is the semi-thickness of the layer.Calculations of theoretical dependence of the phasepath excess on the minimal altitude of the line of sightwere carried out with step on height ∼ 40 m, whichcorresponds to sampling frequency 50 Hz. The sameprocedure of smoothing by the sliding average methodas used for the analysis of experimental data was ap-plied to the theoretical dependence �1(h). As well as inthe experimental data shown in Fig. 2, in the theoreticaldependence �(h) one can see alternation of maximum,minimum, and maximum when the altitude of line ofsight decreases. For the quantitative characterization ofthe intensity of a sporadic layer we have entered thesize ��, defined as the difference between the maxi-mum and minimum values of the smoothed phase. Thesize �� linearly depends on the electron density Nm inthe layer’s maximum. Dependence of the size �� on thelayer’s semi-thickness d is more complex. Our analysishas shown that the maximum �� is reached at smooth-ing of phase data on vertical scale, comparable with theFresnel’s zone size. We have noticed that for a layer withthe electron density lowered relative to a background,the altitude dependence of phase variations �(h) re-verses: minimum–maximum–minimum are observedwhen the altitude of line of sight decreases. The anal-ysis has showed that at sounding of a transition layer,i.e. a layer with a sharp change in the vertical gradientof the electron density, the phase variation has a localmaximum or minimum depending on the gradient sign.
Comparison of experimental data with results ofthe theoretical calculations indicates a possibility ordetermination of the height, thickness and intensity ofES structures. For determination of these parameters wehave suggested their preliminary classification based onthe amplitude and phase variations and have detectedthree types of sporadic structures. Layered structures ofthe first type have perfectly expressed boundaries. Theheight of boundaries and thickness of a layer are clearlydefined. Example of the influence on the amplitudeand phase of RO signal of the layers of the first type isshown in Fig. 2 (curves 1 and 4). The influence of thesecond type structures with obviously expressed upperboundary for which the height of the lower boundaryand thickness can be only roughly determined, may beobserved as quasi-periodical variations of the ampli-tude and phase (curve 3 in Fig. 2). The influence ofthe third type of the ES formations on the amplitudeand phase of RO signal is demonstrated by curves 2 inFig. 2. The upper boundary and the thickness of a layercan be well determined for such structures. However,it is difficult to estimate location of the lower bound-ary because of strong fluctuations. Layers of the firsttype can be observed at altitudes close to each other(curves 1 in Fig. 2) and simultaneously with layers ofthe second (curves 3) and the third (curves 2) types. Itis not always possible to find distinction between ESstructures of the second and third types. The quantityof sporadic layers in probed areas and their type canchange, but the characteristic features of the amplitudeand the smoothed phase variations — alternation ofmaxima and minima — remain in different events ofmeasurements.
4. Parameters of sporadic formations in equatorialarea
The described procedure of the experimental dataanalysis allows one to determine the ES structures pa-rameters by use of their different influence on the am-plitude and phase of RO signal. The basic characteris-tic of sporadic structures is the probability of their ob-servation which we define as the ratio of the ES lay-ers detections number to the general number of ROionospheric events (expressed in percentage) for thefixed interval of time. We have accepted the time from12 o’clock till 14.5 o’clock and from 0 o’clock till2.5 o’clock local time as the fixed intervals, that cor-respond to the day- and night-time. We have classifiedthe observed ES structures as high and low depend-ing on their altitudes. For boundary between the highand low layers we accepted the altitude of 100 km. In

1356 O.I. Yakovlev et al. / Acta Astronautica 63 (2008) 1350–1359
Fig. 3 the plots characterizing the probability of spo-radic formations observation per day (panel 1) and night(panel 2) time during period October 25 till November9, 2003 are shown. Values of the introduced probability
25october november
0102030405060708090
%
0102030405060
%
090807060504030201313029282726
Fig. 3. Observation probability of ES layers in the ionosphere duringthe considered period: day (1) and night (2).
0
80
90
100
110
h, k
m
1 2 3
20
98
100
102
104
106
108
110
h, k
m
4 5
10N*10-4, cm-3N*10-4, cm-3
40302010 3020504030
Fig. 4. Altitude profiles of the electron density of sporadic layers at heights of 92–94 km (left panel) and 98–109 km (right panel). Curves1–3, 5, 6 correspond to following conditions of the measurements: curve 1 — 2003-10-29, UT — 02.85 h, LT — 12.35 h, Lat. — 11.3◦S,Lon. — 142.59◦E; curve 2 — 2003-11-02, UT — 02.31 h, LT — 11.88 h, Lat. — 9.2◦S, Lon. — 143.56◦E; curve 3 — 2003-11-04, UT —02.09 h, LT — 13.15 h, Lat. — 15.9◦S, Lon. — 165.9◦E; curve 5 — 2003-10-26, UT — 14.76 h, LT — 12.47 h, Lat. — 7.67◦S, Lon. —325.57◦E; curve 6 — 2003-10-25, UT — 23.29 h, LT — 12.45 h, Lat. — 8.08◦N, Lon. — 197.5◦E.
are obtained from results of 15–20 events per day ofRO sounding of the ionosphere. Points define the prob-ability of detection of all ES structures independentlyon their height, and squares give probability of observa-tion of ES structures at altitudes below 100 km. For theanalyzed period of observations the average probabilityof detection of sporadic structures during midday timewas equal to 74% with obviously expressed tendencyto reduction from October 25th till November 9th. Thiscoincides with character of changes in flush activity ofthe Sun during this period. Average value of probabil-ity of detection of ES layers in the midnight ionospherewas equal to 38%, i.e. approximately twice as less, thanin the day ionosphere.
In the case of intensive sporadic layers, satisfyingto condition of spherical symmetry, it is possible torestore the altitude profile of the electron density N(h).Examples of the restored altitude profiles of the electrondensity are shown in Fig. 4. In Fig. 4 (left panel) curves2 and 3 are displaced along the abscissa axes relativeto curve 1 by 10 and 20 units, correspondingly. In thealtitude profiles of the electron density demonstratedin the left panel of Fig. 4 one can see weak Es-layerslocated at altitudes ∼ 93 km, and the profiles in the rightpanel show the intensive structures. Small variationsnotable in the curves in Fig. 4 characterize the statisticalerror of measurements.
Location of the upper boundary of a sporadic layeris defined on the first maximum of the amplitude orphase, observed during diminishing of the height. In

O.I. Yakovlev et al. / Acta Astronautica 63 (2008) 1350–1359 1357
90h, km
0
5%
90h, km
0
5
10
%
12011511010510095
12011511010510095
Fig. 5. Histograms of distributions of the ionospheric ES layers top:day (1) and night (2).
Fig. 2 location of this maximum is indicated by thearrows directed downwards. The height of maximum inthe electron density is close to location of minimum ofthe phase and amplitude, noted by the arrows directedupwards. The lower boundary of layer corresponds tothe altitude where the amplitude of RO signal reachesan average level equal to unity.
Histograms of distribution of the upper boundary ofsporadic layers in day (panel 1) and in night (panel 2)are shown in Fig. 5. Data for the day ionosphere are ob-tained from analysis of 259 RO events, and for the nightone from 124 RO events. In the day ionosphere the lay-ers at altitudes below 100 km prevail. In the 91–99 kmaltitude interval are located ∼ 48% of layers, and at107–118 km heights — ∼ 33%. In the night ionospherethe upper boundary of sporadic layers is located mainlyabove 100 km. In the 91–99 km altitude interval arelocated ∼ 37% of such events, and in the 100–108 kminterval — ∼ 60% of events. In Fig. 6 the histograms ofdistribution of the thickness �h of the sporadic layersin the day (1) and night (2) ionosphere are demon-strated. Data for the day ionosphere are obtained fromanalysis of 200 observed layered structures. In thenight ionosphere the thickness is defined for 101 layers.The thickness of 144 ES layers observed in the
0Δh, km
0
10
20
30
%
-1Δh, km
0
10
20
30
%
987654321
9876543210
Fig. 6. Histograms of distributions of the ionospheric layers thick-ness: day (1) and night (2).
afternoon in the 90–120 km altitude interval, is changedfrom 1 to 3 km. In the night ionosphere increase thethickness of layers is small. The percentage of “thick”layers with �h ≈ 9 km in the day and night ionosphereis less than 1%. It is possible, that the “thick” layersconsist of the several thin, poorly expressed layers.
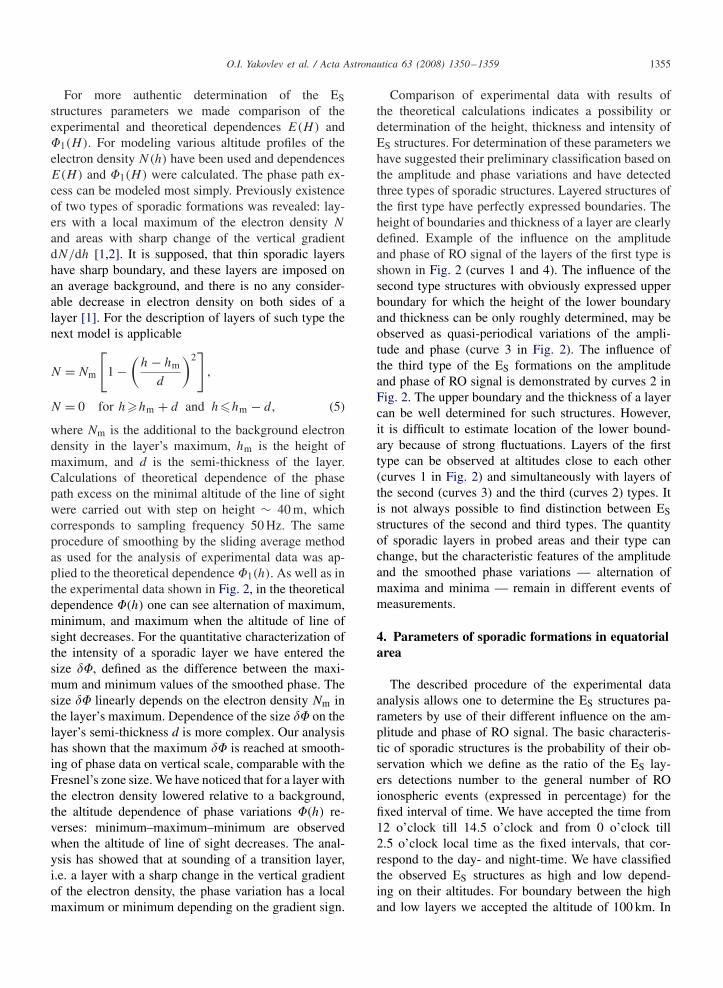
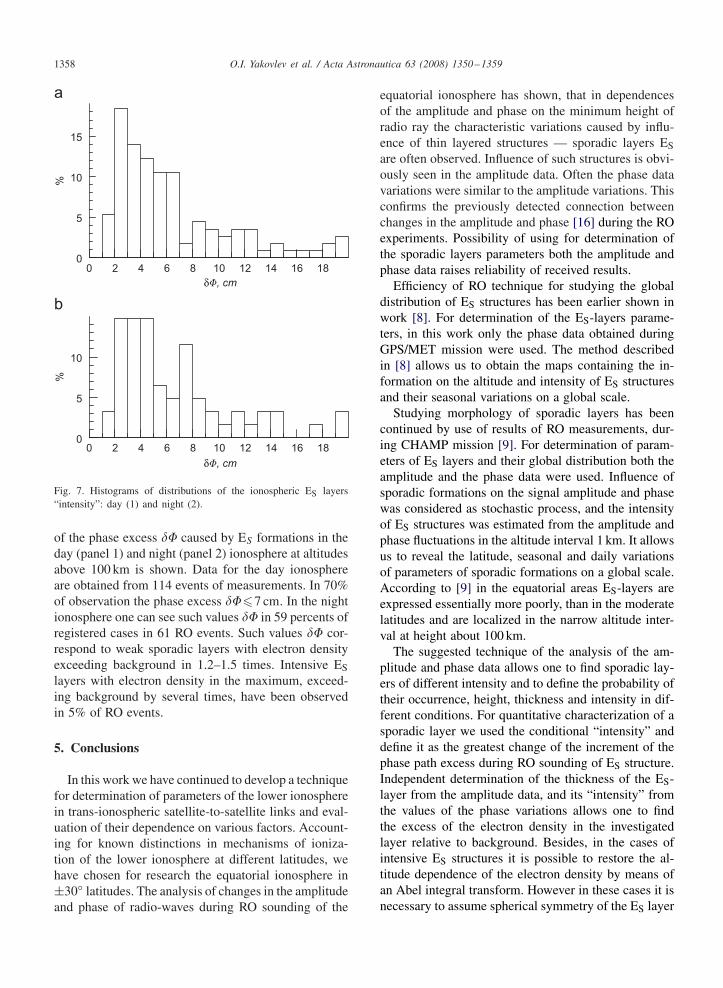
To characterize the intensity of ES layer, we usedthe phase variations data ��, examples of which areshown in Fig. 2, right panel. The typical layer withthe heighten values of electron density leads to occur-rence in the dependence ��(H) a maximum, then aminimum and, at last, the second maximum when theheight of the line of sight diminishing. Such characterof variations in the smoothed phase ��(H) reflects thechanges in the altitude profile N(h). For the quantitativecharacteristic of the intensity of sporadic layer we haveentered the conditional size �� equal to the differenceof the magnitudes of the smoothed phase in the maxi-mum and minimum noted in Fig. 2 by downwards andupwards arrows. In Fig. 7 the histogram of distribution
1358 O.I. Yakovlev et al. / Acta Astronautica 63 (2008) 1350–1359
0
5
10
15
%
00
5
10
%
δ�, cm
δ�, cm
18161412108642
0 18161412108642
Fig. 7. Histograms of distributions of the ionospheric ES layers“intensity”: day (1) and night (2).
of the phase excess �� caused by ES formations in theday (panel 1) and night (panel 2) ionosphere at altitudesabove 100 km is shown. Data for the day ionosphereare obtained from 114 events of measurements. In 70%of observation the phase excess ���7 cm. In the nightionosphere one can see such values �� in 59 percents ofregistered cases in 61 RO events. Such values �� cor-respond to weak sporadic layers with electron densityexceeding background in 1.2–1.5 times. Intensive ESlayers with electron density in the maximum, exceed-ing background by several times, have been observedin 5% of RO events.
5. Conclusions
In this work we have continued to develop a techniquefor determination of parameters of the lower ionospherein trans-ionospheric satellite-to-satellite links and eval-uation of their dependence on various factors. Account-ing for known distinctions in mechanisms of ioniza-tion of the lower ionosphere at different latitudes, wehave chosen for research the equatorial ionosphere in±30◦ latitudes. The analysis of changes in the amplitudeand phase of radio-waves during RO sounding of the
equatorial ionosphere has shown, that in dependencesof the amplitude and phase on the minimum height ofradio ray the characteristic variations caused by influ-ence of thin layered structures — sporadic layers ESare often observed. Influence of such structures is obvi-ously seen in the amplitude data. Often the phase datavariations were similar to the amplitude variations. Thisconfirms the previously detected connection betweenchanges in the amplitude and phase [16] during the ROexperiments. Possibility of using for determination ofthe sporadic layers parameters both the amplitude andphase data raises reliability of received results.
Efficiency of RO technique for studying the globaldistribution of ES structures has been earlier shown inwork [8]. For determination of the ES-layers parame-ters, in this work only the phase data obtained duringGPS/MET mission were used. The method describedin [8] allows us to obtain the maps containing the in-formation on the altitude and intensity of ES structuresand their seasonal variations on a global scale.
Studying morphology of sporadic layers has beencontinued by use of results of RO measurements, dur-ing CHAMP mission [9]. For determination of param-eters of ES layers and their global distribution both theamplitude and the phase data were used. Influence ofsporadic formations on the signal amplitude and phasewas considered as stochastic process, and the intensityof ES structures was estimated from the amplitude andphase fluctuations in the altitude interval 1 km. It allowsus to reveal the latitude, seasonal and daily variationsof parameters of sporadic formations on a global scale.According to [9] in the equatorial areas ES-layers areexpressed essentially more poorly, than in the moderatelatitudes and are localized in the narrow altitude inter-val at height about 100 km.
The suggested technique of the analysis of the am-plitude and phase data allows one to find sporadic lay-ers of different intensity and to define the probability oftheir occurrence, height, thickness and intensity in dif-ferent conditions. For quantitative characterization of asporadic layer we used the conditional “intensity” anddefine it as the greatest change of the increment of thephase path excess during RO sounding of ES structure.Independent determination of the thickness of the ES-layer from the amplitude data, and its “intensity” fromthe values of the phase variations allows one to findthe excess of the electron density in the investigatedlayer relative to background. Besides, in the cases ofintensive ES structures it is possible to restore the al-titude dependence of the electron density by means ofan Abel integral transform. However in these cases it isnecessary to assume spherical symmetry of the ES layer

O.I. Yakovlev et al. / Acta Astronautica 63 (2008) 1350–1359 1359
and to use model of the altitude dependence of the elec-tron density above the initial level of the measurements.Despite possible in these cases regular restoration er-ror in the altitude profile of the electron density, theincrement of the electron density in the sporadic layerrelative to background is determined with the relativeerror less than 30%. Sporadic layers with the thicknessof 1–3 km located at the altitude about 97 km prevailedduring the considered observation period in the mid-day equatorial ionosphere. In the midnight time alongwith low layers at height about 95 km there are alsothicker, “friable” layers with the average height about104–105 km. Separation of observations events into themidday and midnight, will allow one to reveal the Sunrole in formation of ES. Comparison of results of de-termination of the ES layers parameters with variationsof various characteristics of solar activity: X-ray andultra-violet radiation, of electron and proton flux, reg-istered along the near-Earth orbit, allowed us to findonly the tendency of increase of the observation prob-ability of sporadic layers in the day ionosphere duringstrong flashes of X-ray radiation. The height, thicknessand electron density in the layer maximum do not showobvious connection with solar events. This testifies thatinfluence of the Sun on formation of sporadic layersin the equatorial areas is not prevailing in comparisonwith such mechanisms as wind shift or meteoric ioniza-tion. In [1] it is noticed, that in the equatorial areas thesmaller observation probability of sporadic Es layers ischaracteristic. Our analysis shows, that in the equato-rial areas the Es structures exist practically so often, aswell as in moderate latitudes, but their intensity is sig-nificantly lesser. Therefore the RO method is more sen-sitive to poorly expressed Es layers, than the traditionalground-based remote sensing technique.
Acknowledgments
We are grateful to the Center of Geophysical Stud-ies, Potsdam, for presented CHAMP experimental dataon radio occultation. This work was jointly supportedby the Russian Foundation for Basic Research, projectNo. 06-02-17071-a, and programs of Russian Academyof Sciences No. 16, No. OFN-16.
References
[1] B.N. Gershman, Y.A. Ignatev, G.H. Kamenetskaya, Formationsmechanisms of ionospheric sporadic layer Es on differentlatitudes, Nauka, Moscow, 1976, p. 108 (in Russian).
[2] J.D. Mathews, Sporadic E: current views and recent progress,Journal of Atmospheric and Solar Terrestrial Physics 60 (1998)413–435.
[3] O.I. Yakovlev, Space Radio Science, Taylor and Francis,London, 2003 p. 307.
[4] W.S. Schreiner, S.V. Sokolovskiy, C. Rocken, D.C. Hunt,Analysis and validation of GPS/MET radio occultation data inthe ionosphere, Radio Science 34 (1999) 949–966.
[5] G.A. Hajj, L.J. Romans, Ionospheric electron density profilesobtained with the Global Positioning System: results from theGPS/MET experiment, Radio Science 33 (1998) 175–192.
[6] A.I. Kucheryavenkov, O.I. Yakovlev, I.L. Kucheryavenkova,L.N. Samoznaev, Ionospheric variations of radio wavefrequency and amplitude in occulted experiment on satellite-to-satellite link, Journal of Communication Technology andElectronics 43 (1998) 945–953.
[7] K. Igarashi, A. Pavelyev, J. Wickert, K. Hocke, D. Pavelyev,Application of radio holographic method for observation ofaltitude variations of the electron density in mesosphere/lowerthermosphere using GPS/MET radio occultation data, Journalof Atmospheric and Solar Terrestrial Physics 64 (2002)959–969.
[8] K. Hocke, K. Igarashi, M. Nakamura, P. Wilkinson, J. Wu,A. Pavelyev, J. Wickert, Global sounding of sporadic Elayers by the GPS/MET radio occultation experiment, Journalof Atmospheric and Solar Terrestrial Physics 63 (2001)1973–1980.
[9] D.L. Wu, C.O. Ao, G.A. Hajj, M. de la Torre Juarez,A.J. Mannucci, Sporadic E morphology from GPS-CHAMPradio occultation, Journal of Geophysical Research 110(A01066) (2005) 1–18.
[10] A. Pavelyev, T. Tsuda, K. Igarashi, et al., Wave structures inthe electron density profile in the ionospheric D- and E-layersobserved by radio holography analysis of the GPS/MET radiooccultation data, Journal of Atmospheric and Solar TerrestrialPhysics 65 (2003) 59–70.
[11] J. Wickert, O.I. Yakovlev, A.G. Pavelyev, et al., Ionosphericfluctuations of decimetric radio waves along satellite-to-satellitepaths, Journal of Communication Technology and Electronics49 (2004) 1109–1116.
[12] J. Wickert, A.G. Pavelyev, Y.A. Liou, T. Schmidt,Ch. Reigber, K. Igarashi, A.A. Pavelyev, S. Matyugov,Amplitude scintillations in GPS signals as a possible indicatorof ionospheric structures, Geophysical Research Letters 31 (24)(2004) 1–4 L24801.
[13] O.I. Yakovlev, J. Wickert, S.S. Matjugov, V.A. Anufriev,Radiowave fluctuations in the polar ionosphere on the satellite-to-satellite paths under high solar activity, Radiophysics andQuantum Electronics 49 (2006) 167–174.
[14] Y.A. Liou, A.G. Pavelyev, J. Wickert, et al., Application ofGPS radio occultation method for observation of the internalwaves in the atmosphere, Journal of Geophysical Research 111(D06104) (2006) 1–14.
[15] 〈http://solar.sec.nooa.gov/weekly〉.[16] Y.A. Liou, A.G. Pavelyev, S.F. Liu, A.A. Pavelyev, N. Yen,
C. Y Huang, C.J. Fong, FORMOSAT-3/COSMIC GPS radio-occultation mission: preliminary results, IEEE Transactions onGeoscience and Remote Sensing 45 (2007) 3813–3826.
[17] A.G. Pavelyev, Y.A. Liou, J. Wickert, T. Schmidt, A.A.Pavelyev, S.F. Liu, Effects of the ionosphere and solar activityon radio occultation signals: application to CHAllengingMinisatellite Payload satellite observations, Journal ofGeophysical Research 112 (A06326) (2007) 1–14.