Embed Size (px)
Citation preview

SpokespersonYing-Ying Chang, Senior Executive Vice President
Tel: +886-2-25317230 Email: [email protected]
Deputy Spokesperson Mei-Chi Liang, Senior Executive Vice President
Tel: +886-2-25237256 Email: [email protected]
Auditor of Financial Report PricewaterhouseCoopers, Taiwan
27F, 333, Keelung Rd., Sec. 1, Taipei 11012, Taiwan Tel: +886-2-27296666
Website: www.pwc.com/tw
Contents
1 Message to Shareholders Operation Results of 2014 Business Plan of 2015 Long-Term Development Strategies Major Regulatory Changes and Influences Credit Rating
4 Bank Profile
Historical Overview
5 Corporate Governance Report Organization Chart Directors, Supervisors & Top Management Execution of Corporate Governance
12 Capital Overview
Capital & Shares Other Fund-Raising Activities Capital Allocation Plan
14 Overview of Business Operations
Business Activities Taiwanese Banking Industry & Market Overview Human Resources Profile Social Responsibility
17 Financial Information
Condensed Consolidated Balance Sheets Condensed Consolidated Statements of Comprehensive Income Major Financial Analysis
19 Report of Independent Accountants
Consolidated Financial Statements Notes to Consolidated Financial Statements Stand-alone Financial Statements
106 Service Network Head Office Domestic Branches Overseas Branches & Representative Offices Subsidiaries
1 Annual Report 2014
1
Message to Shareholders
The world economy proceeded on modest growth trajectory in 2014, as emerging economies’ deceleration hindered global recovery momentum. With regard to Taiwan, while export performance was hence constrained, expanding private consumption and capital expenditure, coupled with buoyant tourist arrival, elevated Taiwan’s economic growth rate to the highest in three years. Under more favorable domestic circumstances, Mega ICBC presented stellar financial performance in 2014. With corporate banking growing steadily, consumer finance burgeoning, and offshore banking expanding solidly, pretax income of the bank reached a new altitude, exceeding NT30 billion.
By virtue of clientele’s support and staffs’ unrelenting efforts, Mega ICBC has retained the pre-eminent position in domestic banking industry for years. Apart from being affirmed by Executive Yuan at home for outperformance regarding offshore banking, the bank has been awarded “the Best Bank in Taiwan” by FinanceAsia, and won the honor of “Best Banking Award Taiwan 2014” from Global Financial Market Review.
To capitalize on our expertise in international banking to the full extent, and enhance geographic diversity, we have spared no effort to expand global presence, with a focus on China and Asia Pacific region. In line with gradual opening of cross-strait financial services, Ningbo Branch, following Suzhou Branch and Wujiang Sub-Branch, is projected to commence operation in May 2015. In addition, by means of forming strategic alliance with leading Chinese banks, RMB related business volume, as well as the asset pool, have shown substantial growth.
Looking ahead, as global financial landscape is undergoing a far-reaching transformation, Asia Pacific market has been ever more important. With well-entrenched regional franchise, we shall make every endeavor to fulfill the vision of being a top notch Asian regional bank, while keeping meticulous attention to capricious world economic and financial development.
Operation Results of 2014
I. Global & Domestic Economic Dynamics
1. Economic Growth
In 2014, most developed countries presented accelerated economic recovery, while emerging countries, afflicted by country specific fragilities, political turmoil, or financial market volatility, grew by the lowest rate in five years. The world economy consequently failed to grow beyond post-crisis mediocrity. To look forward in 2015, advanced countries, especially the U.S., are expected to drive recovery momentum. On the contrary, China’s growth is projected to slow down, oil or commodity exporting countries’ outlook undermined by weak commodity prices. According to International Monetary Fund, the world economy is forecasted to pick up at meager pace of 3.5%, slightly higher than the previous year’s 3.4%. Nevertheless, under the expectation of Fed liftoff and US dollar’s appreciation, highly-indebted countries, or those over relying on external financing, face the threats of capital withdrawal and creditability erosion, which casts a shadow on brightening global prospect.
As for Taiwan, with improving domestic demand, and widening goods and service trade surplus, the real GDP growth rate accelerated to 3.74%, though still below pre-financial crisis average. In 2015, private consumption, as well as capital expenditure is expected to expand continuously. On the other hand, sluggish global economy, combined with china’s supply chain localization, hinder export growth, whereas lower oil price will drag down import value, hence support trade surplus. In general, The Directorate-General of Budget, Accounting and Statistics (DGBAS) forecasts that GDP growth rate will pick up 3.28%. Nonetheless, cautions are warranted for changes in major economies’ monetary policy, ongoing decelerating growth and supply chain localization in China.
2. Financial Market
In 2014, the average overnight call-loan rate was 0.387%, barely changed from the previous year’s 0.386%. With regard to NT dollar exchange rate, the divergent monetary policy between the U.S. and other major countries including Japan and European Union, along with the drop in commodity price, resulted in Asian currencies’ depreciation against US dollar. Affected by this confluence, the average exchange rate of NT dollar for 2014 was NT$30.38 to one US dollar, depreciated by 2.5% compared to NT$29.65 for 2013.
2
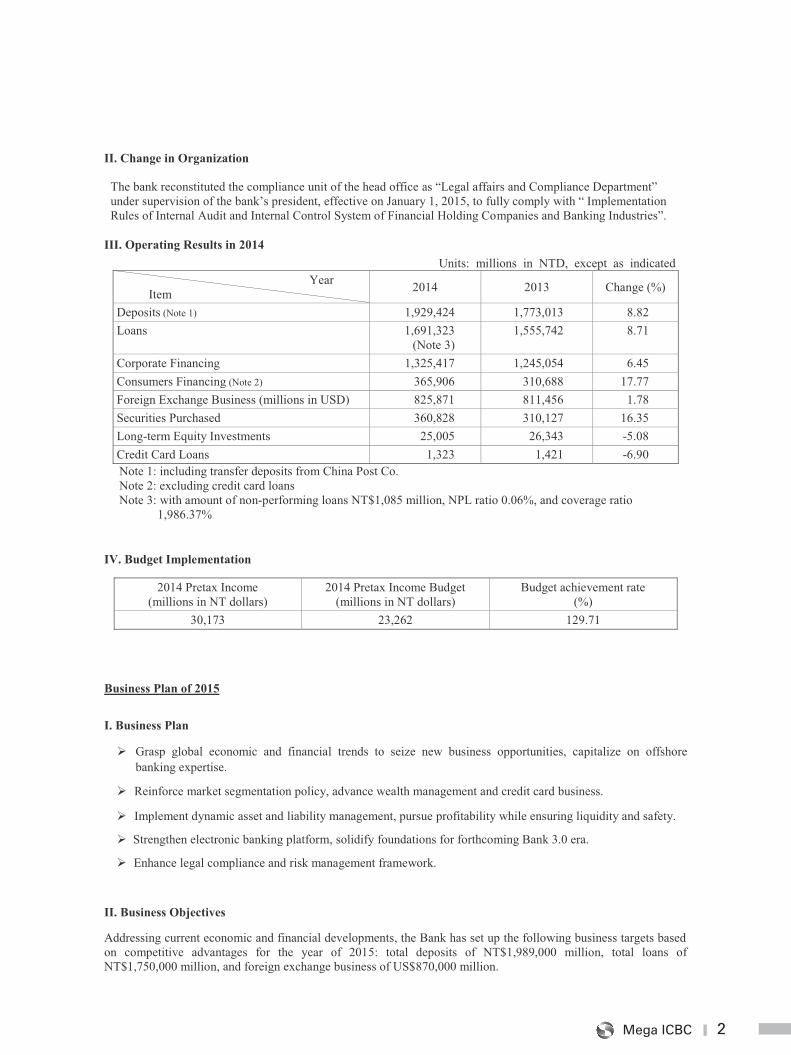
II. Change in Organization The bank reconstituted the compliance unit of the head office as “Legal affairs and Compliance Department”
under supervision of the bank’s president, effective on January 1, 2015, to fully comply with “ Implementation Rules of Internal Audit and Internal Control System of Financial Holding Companies and Banking Industries”.
III. Operating Results in 2014
Units: millions in NTD, except as indicated Year
Item 2014 2013 Change (%)
Deposits (Note 1) 1,929,424 1,773,013 8.82 Loans 1,691,323
(Note 3) 1,555,742
8.71
Corporate Financing 1,325,417 1,245,054 6.45 Consumers Financing (Note 2) 365,906 310,688 17.77 Foreign Exchange Business (millions in USD) 825,871 811,456 1.78 Securities Purchased 360,828 310,127 16.35 Long-term Equity Investments 25,005 26,343 -5.08 Credit Card Loans 1,323 1,421 -6.90 Note 1: including transfer deposits from China Post Co. Note 2: excluding credit card loans Note 3: with amount of non-performing loans NT$1,085 million, NPL ratio 0.06%, and coverage ratio
1,986.37%
IV. Budget Implementation
2014 Pretax Income (millions in NT dollars)
2014 Pretax Income Budget (millions in NT dollars)
Budget achievement rate (%)
30,173 23,262 129.71
Business Plan of 2015
I. Business Plan
� Grasp global economic and financial trends to seize new business opportunities, capitalize on offshore banking expertise.
� Reinforce market segmentation policy, advance wealth management and credit card business.
� Implement dynamic asset and liability management, pursue profitability while ensuring liquidity and safety.
� Strengthen electronic banking platform, solidify foundations for forthcoming Bank 3.0 era.
� Enhance legal compliance and risk management framework.
II. Business Objectives
Addressing current economic and financial developments, the Bank has set up the following business targets based on competitive advantages for the year of 2015: total deposits of NT$1,989,000 million, total loans of NT$1,750,000 million, and foreign exchange business of US$870,000 million.
2Mega ICBC
2
II. Change in Organization The bank reconstituted the compliance unit of the head office as “Legal affairs and Compliance Department”
under supervision of the bank’s president, effective on January 1, 2015, to fully comply with “ Implementation Rules of Internal Audit and Internal Control System of Financial Holding Companies and Banking Industries”.
III. Operating Results in 2014
Units: millions in NTD, except as indicated Year
Item 2014 2013 Change (%)
Deposits (Note 1) 1,929,424 1,773,013 8.82 Loans 1,691,323
(Note 3) 1,555,742
8.71
Corporate Financing 1,325,417 1,245,054 6.45 Consumers Financing (Note 2) 365,906 310,688 17.77 Foreign Exchange Business (millions in USD) 825,871 811,456 1.78 Securities Purchased 360,828 310,127 16.35 Long-term Equity Investments 25,005 26,343 -5.08 Credit Card Loans 1,323 1,421 -6.90 Note 1: including transfer deposits from China Post Co. Note 2: excluding credit card loans Note 3: with amount of non-performing loans NT$1,085 million, NPL ratio 0.06%, and coverage ratio
1,986.37%
IV. Budget Implementation
2014 Pretax Income (millions in NT dollars)
2014 Pretax Income Budget (millions in NT dollars)
Budget achievement rate (%)
30,173 23,262 129.71
Business Plan of 2015
I. Business Plan
� Grasp global economic and financial trends to seize new business opportunities, capitalize on offshore banking expertise.
� Reinforce market segmentation policy, advance wealth management and credit card business.
� Implement dynamic asset and liability management, pursue profitability while ensuring liquidity and safety.
� Strengthen electronic banking platform, solidify foundations for forthcoming Bank 3.0 era.
� Enhance legal compliance and risk management framework.
II. Business Objectives
Addressing current economic and financial developments, the Bank has set up the following business targets based on competitive advantages for the year of 2015: total deposits of NT$1,989,000 million, total loans of NT$1,750,000 million, and foreign exchange business of US$870,000 million.
3 Annual Report 2014
3
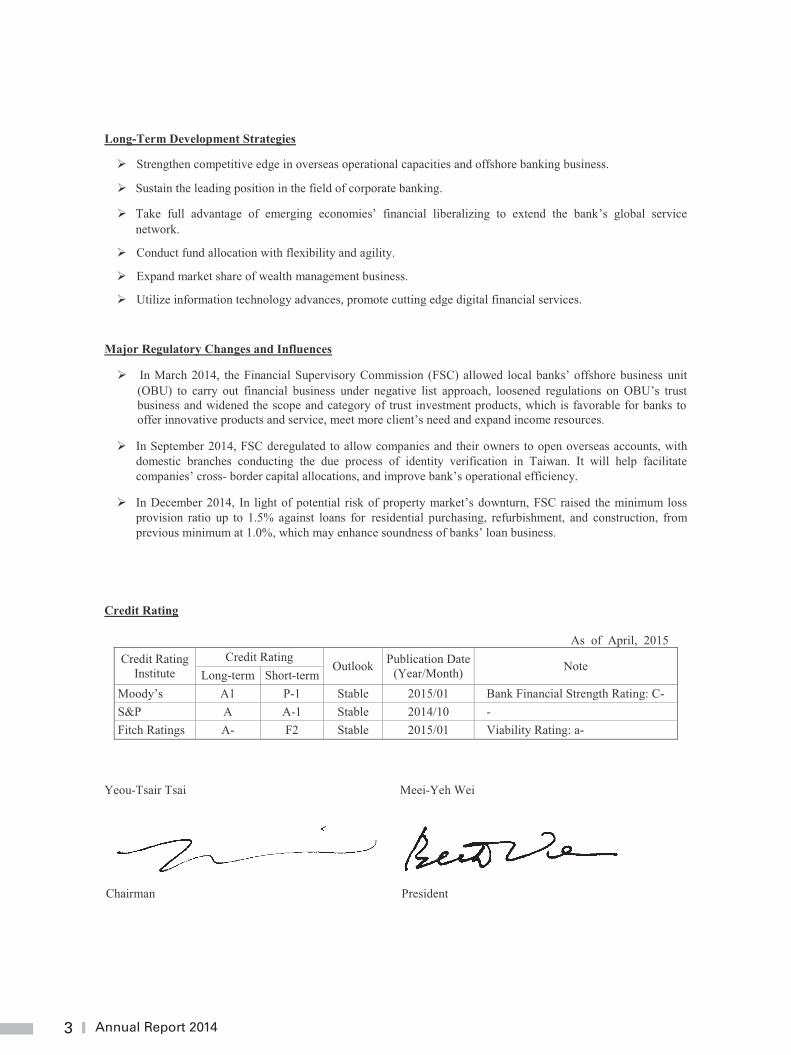
Long-Term Development Strategies
� Strengthen competitive edge in overseas operational capacities and offshore banking business.
� Sustain the leading position in the field of corporate banking.
� Take full advantage of emerging economies’ financial liberalizing to extend the bank’s global service network.
� Conduct fund allocation with flexibility and agility.
� Expand market share of wealth management business.
� Utilize information technology advances, promote cutting edge digital financial services.
Major Regulatory Changes and Influences
� In March 2014, the Financial Supervisory Commission (FSC) allowed local banks’ offshore business unit (OBU) to carry out financial business under negative list approach, loosened regulations on OBU’s trust business and widened the scope and category of trust investment products, which is favorable for banks to offer innovative products and service, meet more client’s need and expand income resources.
� In September 2014, FSC deregulated to allow companies and their owners to open overseas accounts, with domestic branches conducting the due process of identity verification in Taiwan. It will help facilitate companies’ cross- border capital allocations, and improve bank’s operational efficiency.
� In December 2014, In light of potential risk of property market’s downturn, FSC raised the minimum loss provision ratio up to 1.5% against loans for residential purchasing, refurbishment, and construction, from previous minimum at 1.0%, which may enhance soundness of banks’ loan business.
Credit Rating
As of April, 2015 Credit Rating
Institute Credit Rating
Outlook Publication Date (Year/Month) Note
Long-term Short-term Moody’s A1 P-1 Stable 2015/01 Bank Financial Strength Rating: C- S&P A A-1 Stable 2014/10 - Fitch Ratings A- F2 Stable 2015/01 Viability Rating: a-
Yeou-Tsair Tsai Meei-Yeh Wei
Chairman President
4Mega ICBC
4
Bank Profile
Historical Overview
Mega International Commercial Bank Co., Ltd. (Mega ICBC) has come into being as a result of the merger of The International Commercial Bank of China and Chiao Tung Bank, effective on August 21, 2006. Both banks have been proud of their longtime histories of outstanding track records in our country.
In 1971, The Bank of China was privatized to become The International Commercial Bank of China Co., Ltd. (ICBC), whose origin dates back to the Ta Ching Bank and its predecessor, the Hupu Bank (the bank under the finance arm of the imperial court in the Ching Dynasty). The Bank of China had been entrusted with the mission to serve as an agent of the Treasury and a note-issuing bank before the establishment of the Central Bank of China in 1928. The Bank of China was designated as a licensed specialized bank for international trade and foreign exchange thereafter. Taking advantage of its specialization in foreign exchange, worldwide network of outlets and correspondence banks, superb bank assets, and excellent business performance, ICBC has become a top-notch bank in the Republic of China.
Set up five years before the founding of the Republic of China, Chiao Tung Bank Co., Ltd. (CTB) had also been delegated to act as an agent of the government coffer and a note-issuing bank in concert with the Bank of China at the outset of the Republic. Transforming from a licensed bank for industries in 1928, an industrial bank in 1975, and a development bank in 1979, CTB turned from a state-controlled bank into a privately–owned one in 1999. It has engaged in loan extensions for medium- and long-term development, innovation and guidance investment (equity investment), and venture capital ever since. For years, CTB has made significant contributions to the improvement of industrial structure and the promotion of the upgrading of industry by assisting in the development of strategic and vital industries in line with the economic policy and the economic development plan of the government.
CTB and International Securities Company formed the CTB Financial Holding Company in 2002. Late on, Chung Hsing Bills Finance Corporation and Barits International Securities Company came under the financial umbrella. On December 31, 2002, Chung Kuo Insurance Company and ICBC joined forces with the Company to form a conglomerate named Mega Financial Holding Company.
With a view to enlarging the business scale and increasing the market share, ICBC and CTB formally merged into one bank under the name of Mega International Commercial Bank Co., Ltd. on August 21, 2006. By the end of 2014, the Bank has 107 branches at home, and 21 branches, 2 sub-branch, and 3 representative offices abroad. Together with the network are wholly-owned bank subsidiaries in Thailand and Canada, along with their branches, bringing the number of overseas outposts to 36 in total. It has manpower 5,430 and an aggregate paid-in capital of NT$77 billion.
5 Annual Report 2014
5
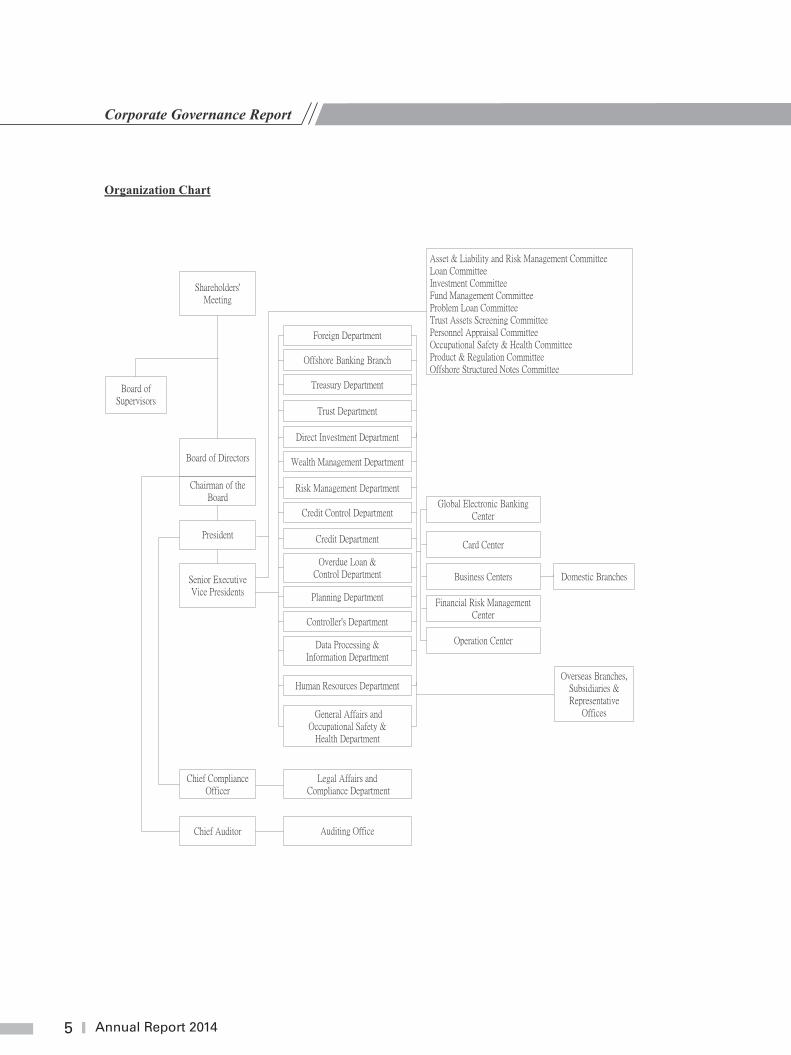
Corporate Governance Report
Organization Chart
6Mega ICBC
6
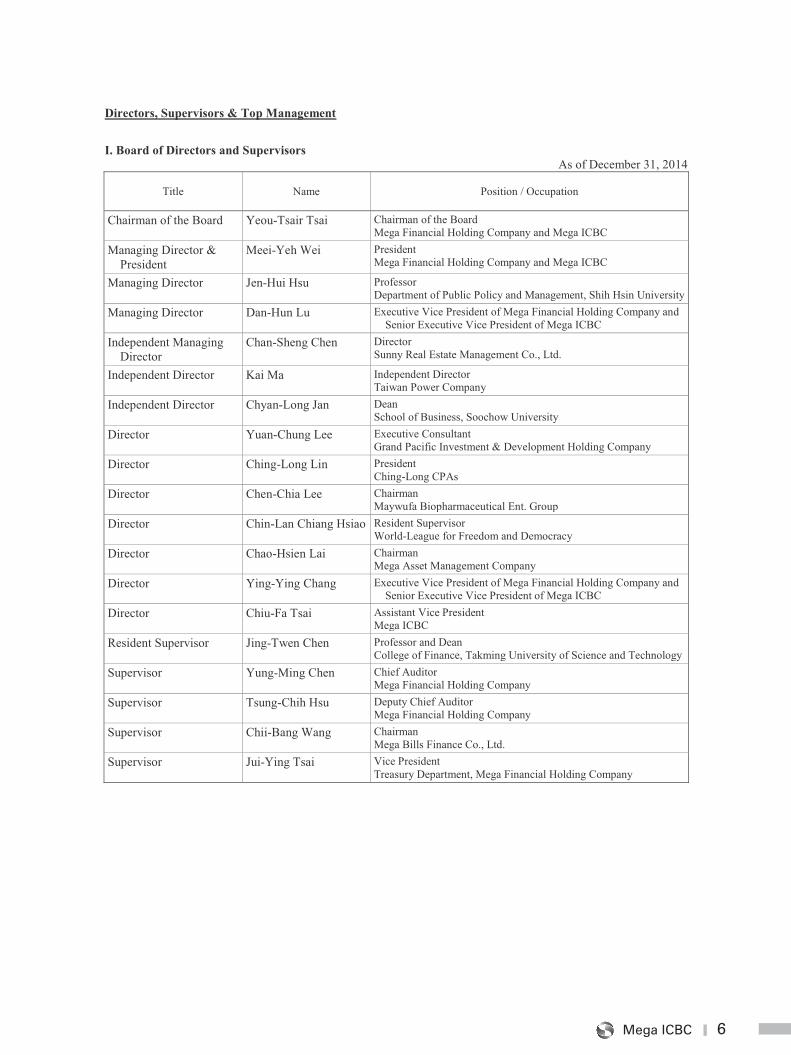
Directors, Supervisors & Top Management
I. Board of Directors and Supervisors
As of December 31, 2014
Title Name Position / Occupation
Chairman of the Board Yeou-Tsair Tsai Chairman of the Board Mega Financial Holding Company and Mega ICBC
Managing Director & President
Meei-Yeh Wei President Mega Financial Holding Company and Mega ICBC
Managing Director Jen-Hui Hsu Professor Department of Public Policy and Management, Shih Hsin University
Managing Director Dan-Hun Lu Executive Vice President of Mega Financial Holding Company and Senior Executive Vice President of Mega ICBC
Independent Managing Director
Chan-Sheng Chen Director Sunny Real Estate Management Co., Ltd.
Independent Director Kai Ma Independent Director Taiwan Power Company
Independent Director Chyan-Long Jan Dean School of Business, Soochow University
Director Yuan-Chung Lee Executive Consultant Grand Pacific Investment & Development Holding Company
Director Ching-Long Lin President Ching-Long CPAs
Director Chen-Chia Lee Chairman Maywufa Biopharmaceutical Ent. Group
Director Chin-Lan Chiang Hsiao Resident Supervisor World-League for Freedom and Democracy
Director Chao-Hsien Lai Chairman Mega Asset Management Company
Director Ying-Ying Chang Executive Vice President of Mega Financial Holding Company and Senior Executive Vice President of Mega ICBC
Director Chiu-Fa Tsai Assistant Vice President Mega ICBC
Resident Supervisor Jing-Twen Chen Professor and Dean College of Finance, Takming University of Science and Technology
Supervisor Yung-Ming Chen Chief Auditor Mega Financial Holding Company
Supervisor Tsung-Chih Hsu Deputy Chief Auditor Mega Financial Holding Company
Supervisor Chii-Bang Wang Chairman Mega Bills Finance Co., Ltd.
Supervisor Jui-Ying Tsai Vice President Treasury Department, Mega Financial Holding Company
7 Annual Report 2014
7
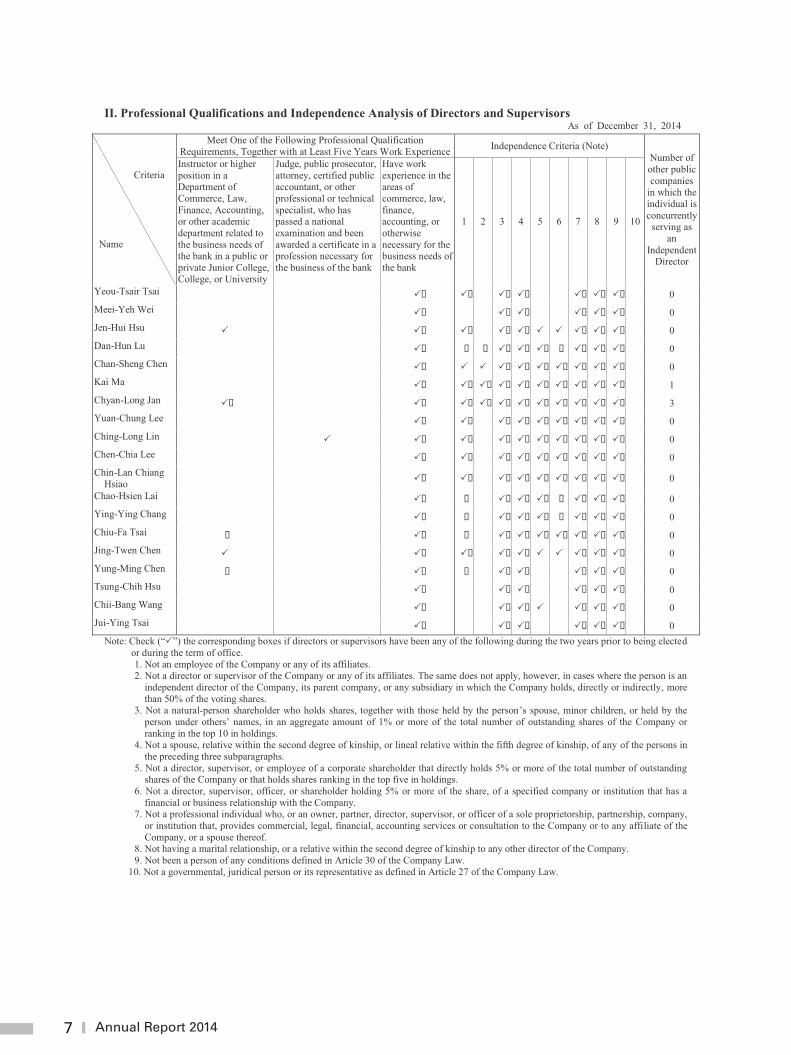
II. Professional Qualifications and Independence Analysis of Directors and Supervisors As of December 31, 2014
Criteria
Name
Meet One of the Following Professional Qualification Requirements, Together with at Least Five Years Work Experience Independence Criteria (Note)
Number of other public companies
in which the individual is concurrently
serving as an
Independent Director
Instructor or higher position in a Department of Commerce, Law, Finance, Accounting, or other academic department related to the business needs of the bank in a public or private Junior College, College, or University
Judge, public prosecutor, attorney, certified public accountant, or other professional or technical specialist, who has passed a national examination and been awarded a certificate in a profession necessary for the business of the bank
Have work experience in the areas of commerce, law, finance, accounting, or otherwise necessary for the business needs of the bank
1 2 3 4 5 6 7 8 9 10
Yeou-Tsair Tsai �� �� ���� ������ 0 Meei-Yeh Wei �� ���� ������ 0 Jen-Hui Hsu � �� �� ����� � ������ 0 Dan-Hun Lu �� � � ������ � ������ 0 Chan-Sheng Chen �� � � �������������� 0 Kai Ma �� ������������������ 1 Chyan-Long Jan �� �� ������������������ 3 Yuan-Chung Lee �� �� �������������� 0 Ching-Long Lin � �� �� �������������� 0 Chen-Chia Lee �� �� �������������� 0 Chin-Lan Chiang
Hsiao �� �� �������������� 0
Chao-Hsien Lai �� � ������ � ������ 0 Ying-Ying Chang �� � ������ � ������ 0 Chiu-Fa Tsai � �� � �������������� 0 Jing-Twen Chen � �� �� ����� � ������ 0 Yung-Ming Chen � �� � ���� ������ 0 Tsung-Chih Hsu �� ���� ������ 0 Chii-Bang Wang �� ����� ������ 0 Jui-Ying Tsai �� ���� ������ 0
Note: Check (“�”) the corresponding boxes if directors or supervisors have been any of the following during the two years prior to being elected or during the term of office. 1. Not an employee of the Company or any of its affiliates. 2. Not a director or supervisor of the Company or any of its affiliates. The same does not apply, however, in cases where the person is an
independent director of the Company, its parent company, or any subsidiary in which the Company holds, directly or indirectly, more than 50% of the voting shares.
3. Not a natural-person shareholder who holds shares, together with those held by the person’s spouse, minor children, or held by the person under others’ names, in an aggregate amount of 1% or more of the total number of outstanding shares of the Company or ranking in the top 10 in holdings.
4. Not a spouse, relative within the second degree of kinship, or lineal relative within the fifth degree of kinship, of any of the persons in the preceding three subparagraphs.
5. Not a director, supervisor, or employee of a corporate shareholder that directly holds 5% or more of the total number of outstanding shares of the Company or that holds shares ranking in the top five in holdings.
6. Not a director, supervisor, officer, or shareholder holding 5% or more of the share, of a specified company or institution that has a financial or business relationship with the Company.
7. Not a professional individual who, or an owner, partner, director, supervisor, or officer of a sole proprietorship, partnership, company, or institution that, provides commercial, legal, financial, accounting services or consultation to the Company or to any affiliate of the Company, or a spouse thereof.
8. Not having a marital relationship, or a relative within the second degree of kinship to any other director of the Company. 9. Not been a person of any conditions defined in Article 30 of the Company Law.
10. Not a governmental, juridical person or its representative as defined in Article 27 of the Company Law.
8Mega ICBC
8
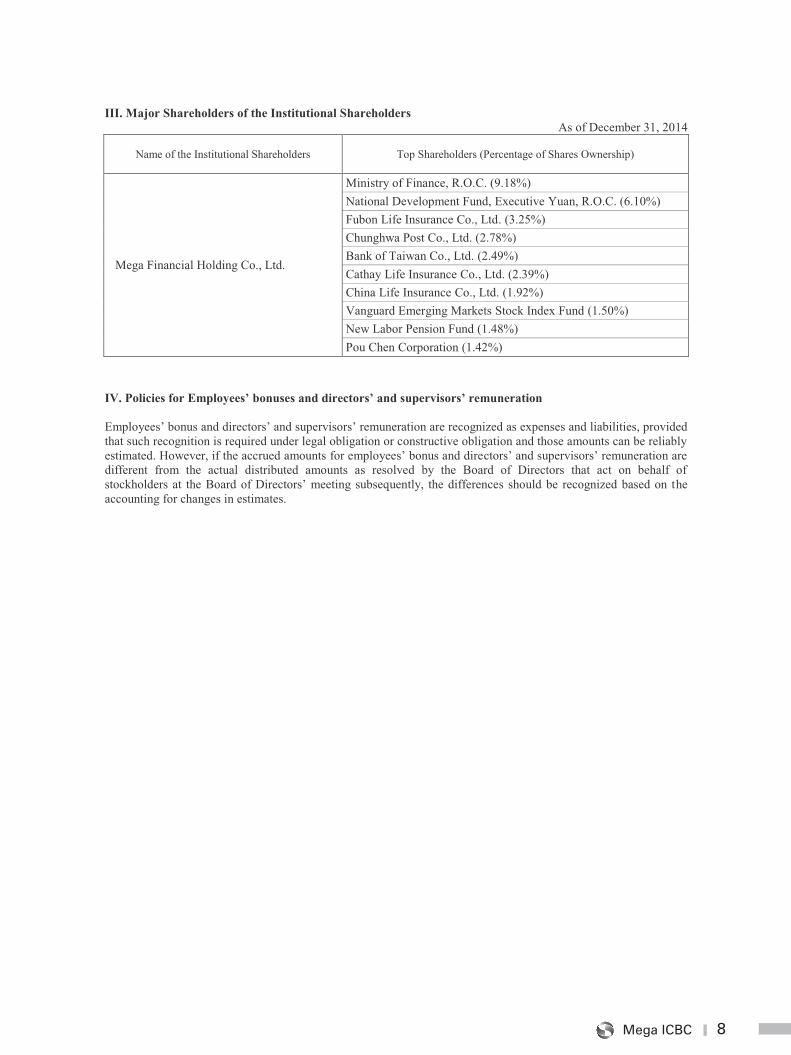
III. Major Shareholders of the Institutional Shareholders As of December 31, 2014
Name of the Institutional Shareholders Top Shareholders (Percentage of Shares Ownership)
Mega Financial Holding Co., Ltd.
Ministry of Finance, R.O.C. (9.18%) National Development Fund, Executive Yuan, R.O.C. (6.10%) Fubon Life Insurance Co., Ltd. (3.25%) Chunghwa Post Co., Ltd. (2.78%) Bank of Taiwan Co., Ltd. (2.49%) Cathay Life Insurance Co., Ltd. (2.39%) China Life Insurance Co., Ltd. (1.92%) Vanguard Emerging Markets Stock Index Fund (1.50%) New Labor Pension Fund (1.48%) Pou Chen Corporation (1.42%)
IV. Policies for Employees’ bonuses and directors’ and supervisors’ remuneration Employees’ bonus and directors’ and supervisors’ remuneration are recognized as expenses and liabilities, provided that such recognition is required under legal obligation or constructive obligation and those amounts can be reliably estimated. However, if the accrued amounts for employees’ bonus and directors’ and supervisors’ remuneration are different from the actual distributed amounts as resolved by the Board of Directors that act on behalf of stockholders at the Board of Directors’ meeting subsequently, the differences should be recognized based on the accounting for changes in estimates.
9 Annual Report 2014
9
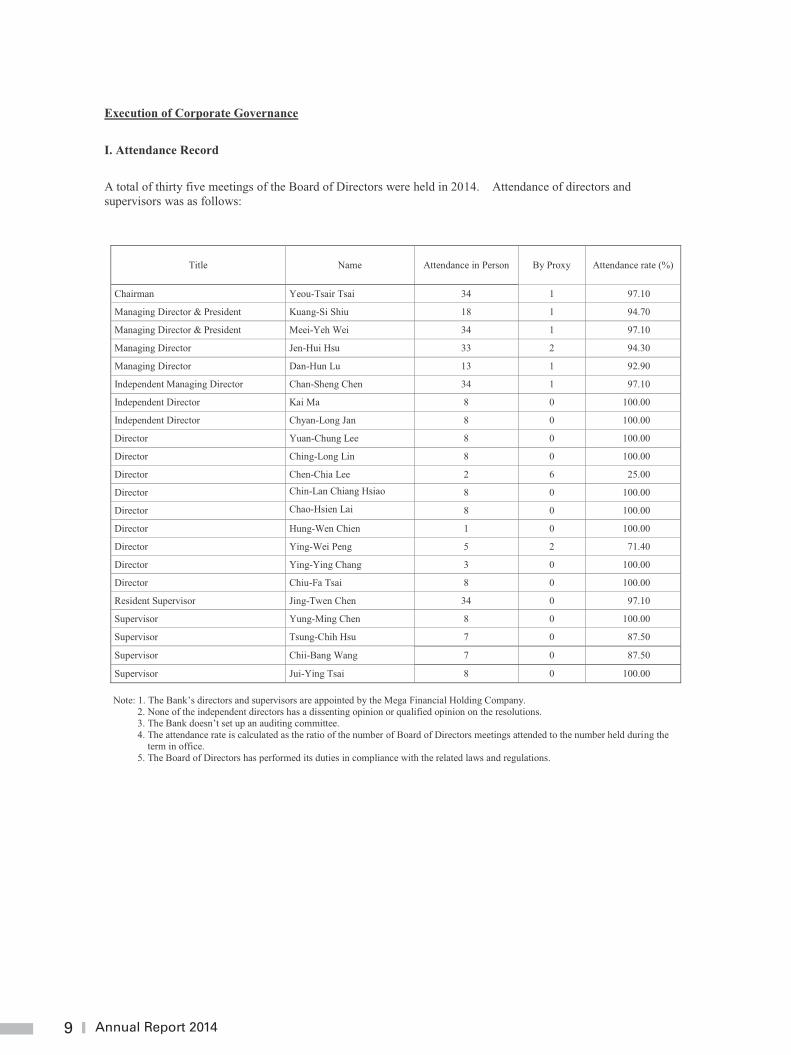
Execution of Corporate Governance
I. Attendance Record
A total of thirty five meetings of the Board of Directors were held in 2014. Attendance of directors and supervisors was as follows:
Title Name Attendance in Person By Proxy Attendance rate (%)
Chairman Yeou-Tsair Tsai 34 1 97.10
Managing Director & President Kuang-Si Shiu 18 1 94.70
Managing Director & President Meei-Yeh Wei 34 1 97.10
Managing Director Jen-Hui Hsu 33 2 94.30
Managing Director Dan-Hun Lu 13 1 92.90
Independent Managing Director Chan-Sheng Chen 34 1 97.10
Independent Director Kai Ma 8 0 100.00
Independent Director Chyan-Long Jan 8 0 100.00
Director Yuan-Chung Lee 8 0 100.00
Director Ching-Long Lin 8 0 100.00
Director Chen-Chia Lee 2 6 25.00
Director Chin-Lan Chiang Hsiao 8 0 100.00
Director Chao-Hsien Lai 8 0 100.00
Director Hung-Wen Chien 1 0 100.00
Director Ying-Wei Peng 5 2 71.40
Director Ying-Ying Chang 3 0 100.00
Director Chiu-Fa Tsai 8 0 100.00
Resident Supervisor Jing-Twen Chen 34 0 97.10
Supervisor Yung-Ming Chen 8 0 100.00
Supervisor Tsung-Chih Hsu 7 0 87.50
Supervisor Chii-Bang Wang 7 0 87.50
Supervisor Jui-Ying Tsai 8 0 100.00
Note: 1. The Bank’s directors and supervisors are appointed by the Mega Financial Holding Company. 2. None of the independent directors has a dissenting opinion or qualified opinion on the resolutions. 3. The Bank doesn’t set up an auditing committee. 4. The attendance rate is calculated as the ratio of the number of Board of Directors meetings attended to the number held during the
term in office. 5. The Board of Directors has performed its duties in compliance with the related laws and regulations.
10Mega ICBC
10
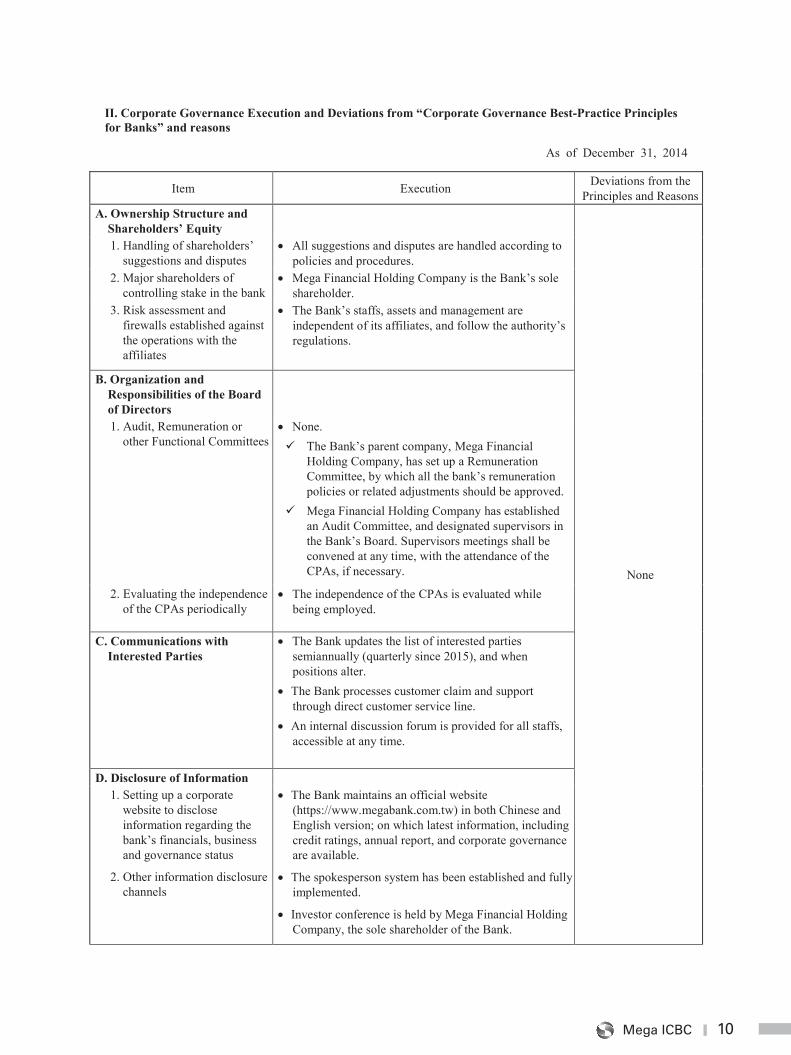
II. Corporate Governance Execution and Deviations from “Corporate Governance Best-Practice Principles for Banks” and reasons
As of December 31, 2014
Item Execution Deviations from the Principles and Reasons
A. Ownership Structure and Shareholders’ Equity
None
1. Handling of shareholders’ suggestions and disputes
All suggestions and disputes are handled according to policies and procedures.
2. Major shareholders of controlling stake in the bank
Mega Financial Holding Company is the Bank’s sole shareholder.
3. Risk assessment and firewalls established against the operations with the affiliates
The Bank’s staffs, assets and management are independent of its affiliates, and follow the authority’s regulations.
B. Organization and Responsibilities of the Board of Directors
1. Audit, Remuneration or other Functional Committees
None. The Bank’s parent company, Mega Financial
Holding Company, has set up a Remuneration Committee, by which all the bank’s remuneration policies or related adjustments should be approved.
Mega Financial Holding Company has established an Audit Committee, and designated supervisors in the Bank’s Board. Supervisors meetings shall be convened at any time, with the attendance of the CPAs, if necessary.
2. Evaluating the independence of the CPAs periodically
The independence of the CPAs is evaluated while being employed.
C. Communications with Interested Parties
The Bank updates the list of interested parties semiannually (quarterly since 2015), and when positions alter.
The Bank processes customer claim and support through direct customer service line.
An internal discussion forum is provided for all staffs, accessible at any time.
D. Disclosure of Information 1. Setting up a corporate
website to disclose information regarding the bank’s financials, business and governance status
2. Other information disclosure channels
The Bank maintains an official website (https://www.megabank.com.tw) in both Chinese and English version; on which latest information, including credit ratings, annual report, and corporate governance are available.
The spokesperson system has been established and fully implemented.
Investor conference is held by Mega Financial Holding Company, the sole shareholder of the Bank.
11 Annual Report 2014
11
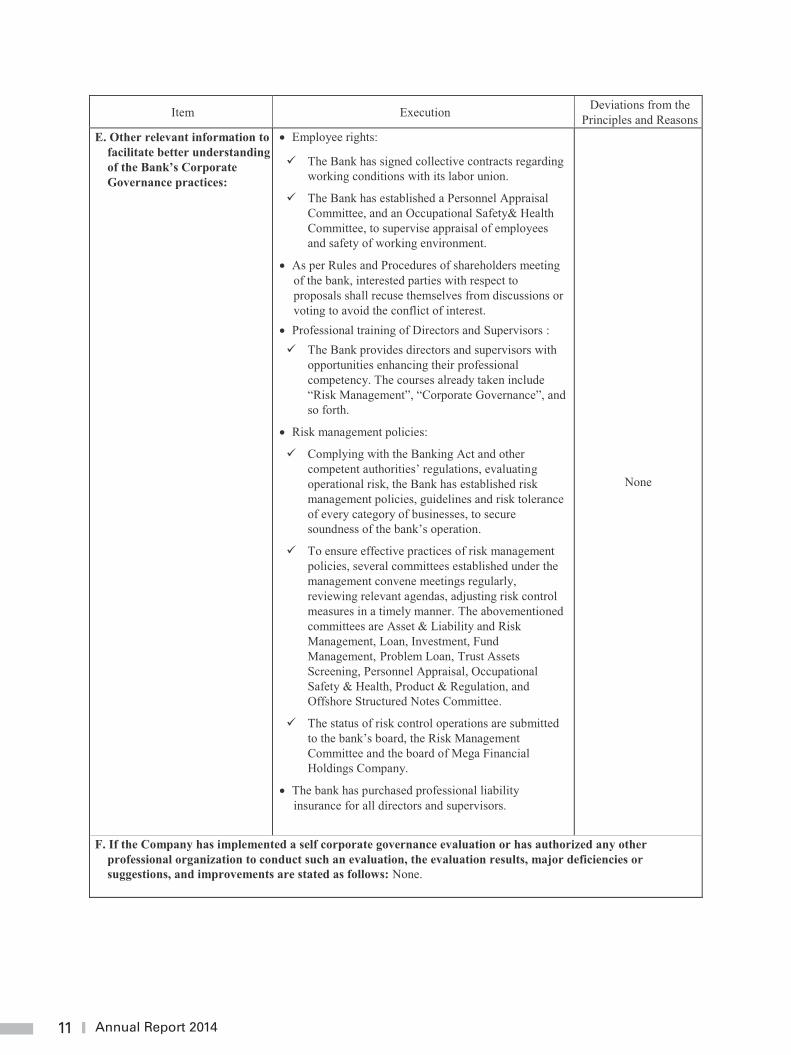
Item Execution Deviations from the Principles and Reasons
E. Other relevant information to facilitate better understanding of the Bank’s Corporate Governance practices:
� Employee rights:
� The Bank has signed collective contracts regarding working conditions with its labor union.
� The Bank has established a Personnel Appraisal Committee, and an Occupational Safety& Health Committee, to supervise appraisal of employees and safety of working environment.
� As per Rules and Procedures of shareholders meeting of the bank, interested parties with respect to proposals shall recuse themselves from discussions or voting to avoid the conflict of interest.
� Professional training of Directors and Supervisors : � The Bank provides directors and supervisors with
opportunities enhancing their professional competency. The courses already taken include “Risk Management”, “Corporate Governance”, and so forth.
� Risk management policies:
� Complying with the Banking Act and other competent authorities’ regulations, evaluating operational risk, the Bank has established risk management policies, guidelines and risk tolerance of every category of businesses, to secure soundness of the bank’s operation.
� To ensure effective practices of risk management policies, several committees established under the management convene meetings regularly, reviewing relevant agendas, adjusting risk control measures in a timely manner. The abovementioned committees are Asset & Liability and Risk Management, Loan, Investment, Fund Management, Problem Loan, Trust Assets Screening, Personnel Appraisal, Occupational Safety & Health, Product & Regulation, and Offshore Structured Notes Committee.
� The status of risk control operations are submitted to the bank’s board, the Risk Management Committee and the board of Mega Financial Holdings Company.
� The bank has purchased professional liability insurance for all directors and supervisors.
None
F. If the Company has implemented a self corporate governance evaluation or has authorized any other professional organization to conduct such an evaluation, the evaluation results, major deficiencies or suggestions, and improvements are stated as follows: None.
12Mega ICBC
12
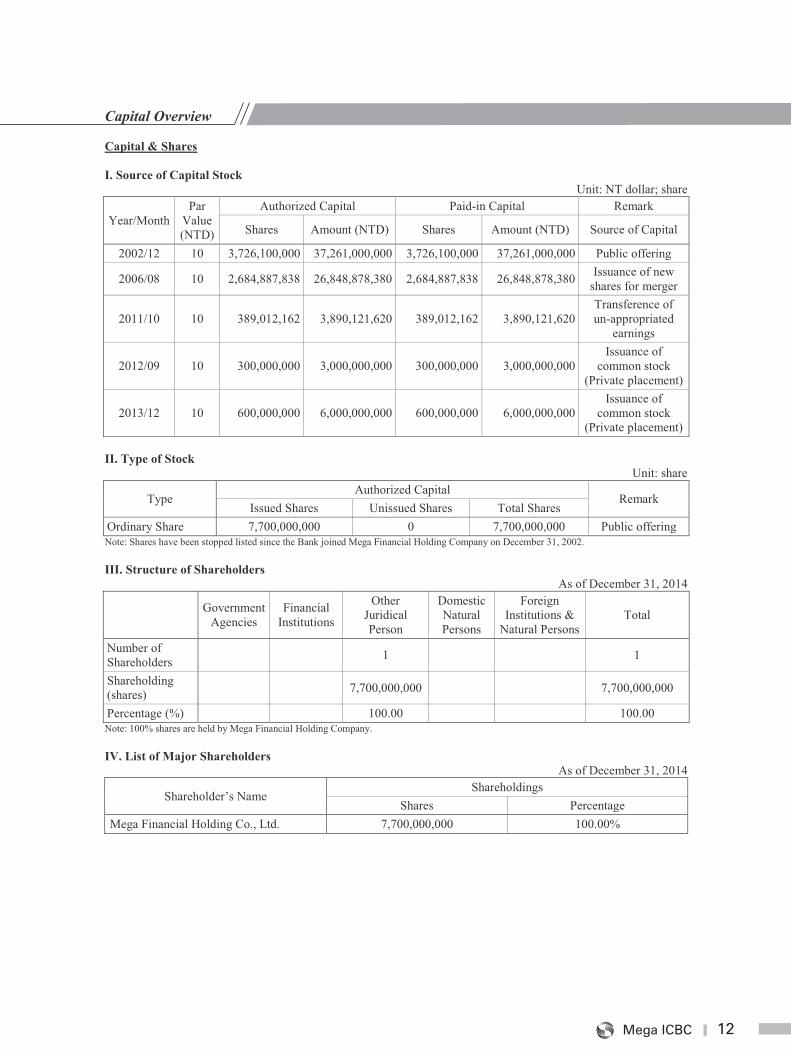
Capital Overview Capital & Shares I. Source of Capital Stock
Unit: NT dollar; share
Year/Month Par
Value (NTD)
Authorized Capital Paid-in Capital Remark
Shares Amount (NTD) Shares Amount (NTD) Source of Capital
2002/12 10 3,726,100,000 37,261,000,000 3,726,100,000 37,261,000,000 Public offering
2006/08 10 2,684,887,838 26,848,878,380 2,684,887,838 26,848,878,380 Issuance of new shares for merger
2011/10 10 389,012,162 3,890,121,620 389,012,162 3,890,121,620 Transference of un-appropriated
earnings
2012/09 10 300,000,000 3,000,000,000 300,000,000 3,000,000,000 Issuance of
common stock (Private placement)
2013/12 10 600,000,000 6,000,000,000 600,000,000 6,000,000,000 Issuance of
common stock (Private placement)
II. Type of Stock
Unit: share
Type Authorized Capital
Remark Issued Shares Unissued Shares Total Shares
Ordinary Share 7,700,000,000 0 7,700,000,000 Public offering Note: Shares have been stopped listed since the Bank joined Mega Financial Holding Company on December 31, 2002. III. Structure of Shareholders
As of December 31, 2014
Government Agencies
Financial Institutions
Other Juridical Person
Domestic Natural Persons
Foreign Institutions &
Natural Persons Total
Number of Shareholders 1 1
Shareholding (shares) 7,700,000,000 7,700,000,000
Percentage (%) 100.00 100.00 Note: 100% shares are held by Mega Financial Holding Company. IV. List of Major Shareholders
As of December 31, 2014
Shareholder’s Name Shareholdings
Shares Percentage Mega Financial Holding Co., Ltd. 7,700,000,000 100.00%
13 Annual Report 2014
13
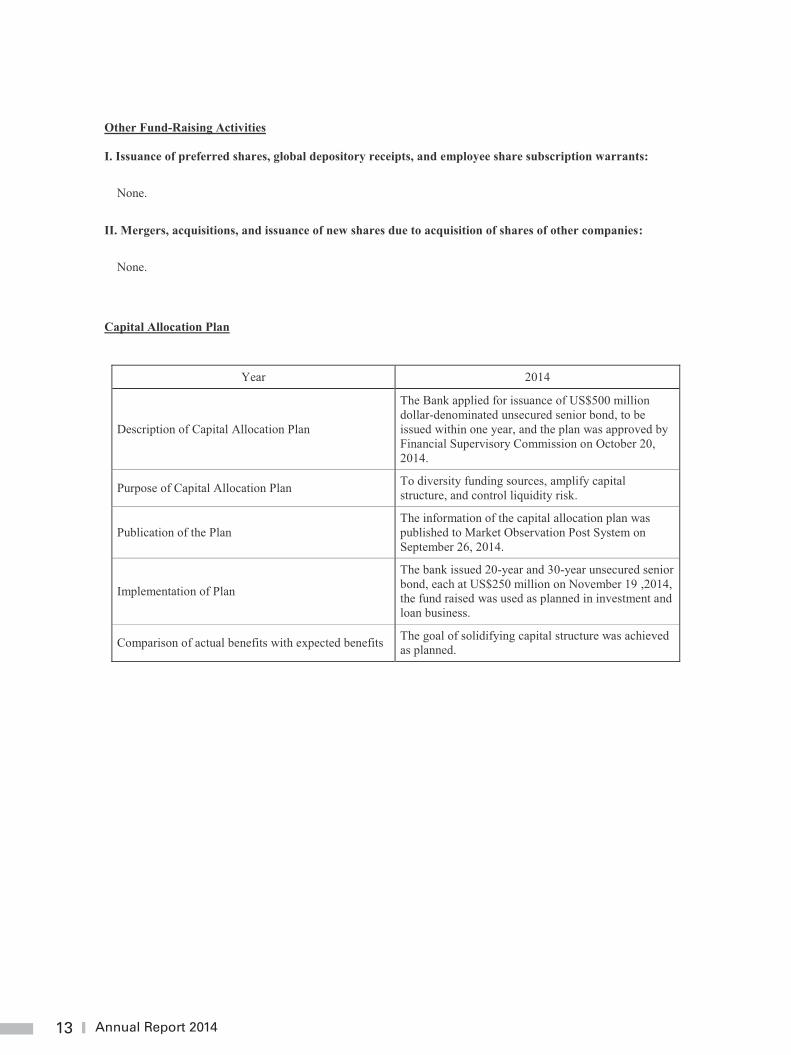
Other Fund-Raising Activities I. Issuance of preferred shares, global depository receipts, and employee share subscription warrants:
None.
II. Mergers, acquisitions, and issuance of new shares due to acquisition of shares of other companies:
None.
Capital Allocation Plan
Year 2014
Description of Capital Allocation Plan
The Bank applied for issuance of US$500 million dollar-denominated unsecured senior bond, to be issued within one year, and the plan was approved by Financial Supervisory Commission on October 20, 2014.
Purpose of Capital Allocation Plan To diversity funding sources, amplify capital structure, and control liquidity risk.
Publication of the Plan The information of the capital allocation plan was published to Market Observation Post System on September 26, 2014.
Implementation of Plan
The bank issued 20-year and 30-year unsecured senior bond, each at US$250 million on November 19 ,2014, the fund raised was used as planned in investment and loan business.
Comparison of actual benefits with expected benefits The goal of solidifying capital structure was achieved as planned.
14Mega ICBC
14
Overview of Business Operations Business Activities
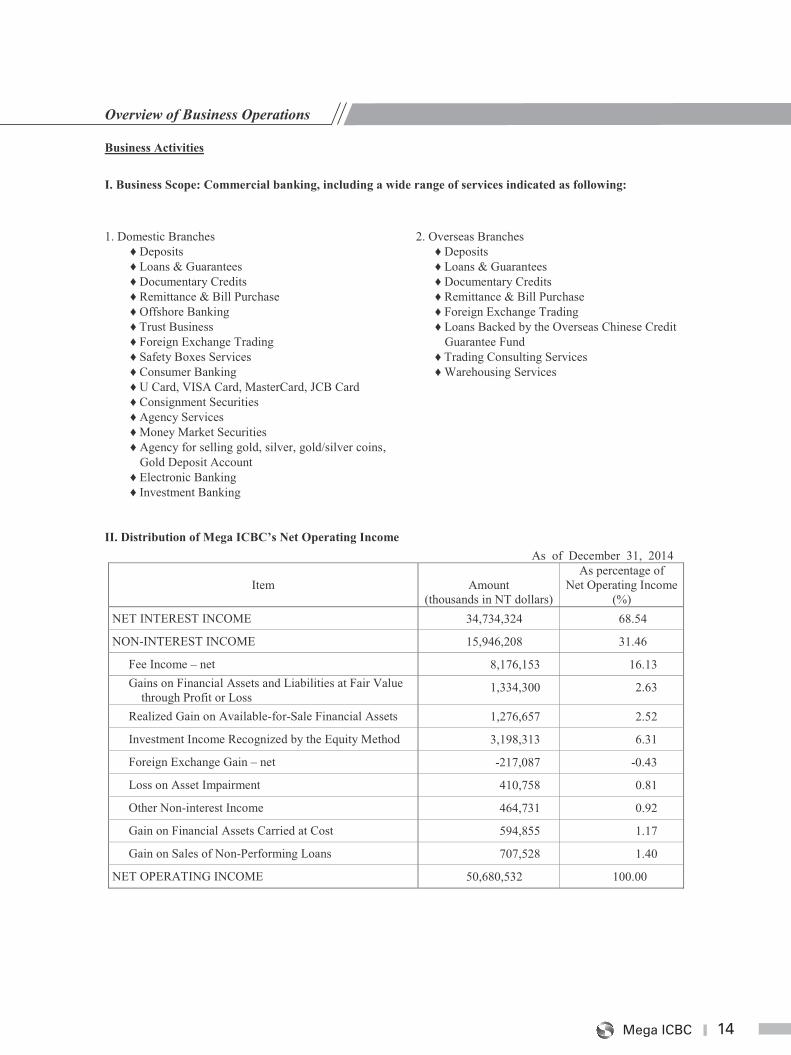
I. Business Scope: Commercial banking, including a wide range of services indicated as following:
1. Domestic Branches ♦ Deposits ♦ Loans & Guarantees ♦ Documentary Credits ♦ Remittance & Bill Purchase ♦ Offshore Banking ♦ Trust Business ♦ Foreign Exchange Trading ♦ Safety Boxes Services ♦ Consumer Banking ♦ U Card, VISA Card, MasterCard, JCB Card ♦ Consignment Securities ♦ Agency Services ♦ Money Market Securities ♦ Agency for selling gold, silver, gold/silver coins,
Gold Deposit Account ♦ Electronic Banking ♦ Investment Banking
2. Overseas Branches ♦ Deposits ♦ Loans & Guarantees ♦ Documentary Credits ♦ Remittance & Bill Purchase ♦ Foreign Exchange Trading ♦ Loans Backed by the Overseas Chinese Credit
Guarantee Fund ♦ Trading Consulting Services ♦ Warehousing Services
II. Distribution of Mega ICBC’s Net Operating Income As of December 31, 2014
Item Amount (thousands in NT dollars)
As percentage of Net Operating Income
(%) NET INTEREST INCOME 34,734,324 68.54
NON-INTEREST INCOME 15,946,208 31.46
Fee Income – net 8,176,153 16.13 Gains on Financial Assets and Liabilities at Fair Value
through Profit or Loss 1,334,300 2.63
Realized Gain on Available-for-Sale Financial Assets 1,276,657 2.52
Investment Income Recognized by the Equity Method 3,198,313 6.31
Foreign Exchange Gain – net -217,087 -0.43
Loss on Asset Impairment 410,758 0.81
Other Non-interest Income 464,731 0.92
Gain on Financial Assets Carried at Cost 594,855 1.17
Gain on Sales of Non-Performing Loans 707,528 1.40
NET OPERATING INCOME 50,680,532 100.00
15 Annual Report 2014
15
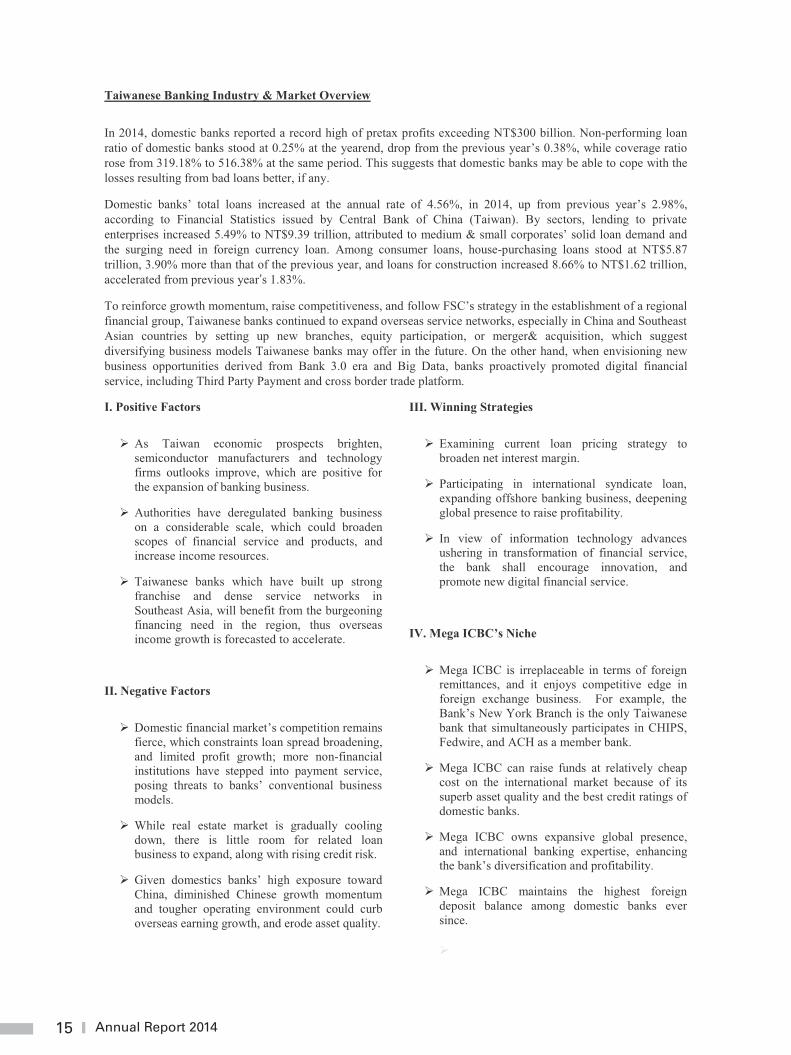
Taiwanese Banking Industry & Market Overview
In 2014, domestic banks reported a record high of pretax profits exceeding NT$300 billion. Non-performing loan ratio of domestic banks stood at 0.25% at the yearend, drop from the previous year’s 0.38%, while coverage ratio rose from 319.18% to 516.38% at the same period. This suggests that domestic banks may be able to cope with the losses resulting from bad loans better, if any.
Domestic banks’ total loans increased at the annual rate of 4.56%, in 2014, up from previous year’s 2.98%, according to Financial Statistics issued by Central Bank of China (Taiwan). By sectors, lending to private enterprises increased 5.49% to NT$9.39 trillion, attributed to medium & small corporates’ solid loan demand and the surging need in foreign currency loan. Among consumer loans, house-purchasing loans stood at NT$5.87 trillion, 3.90% more than that of the previous year, and loans for construction increased 8.66% to NT$1.62 trillion, accelerated from previous year’s 1.83%.
To reinforce growth momentum, raise competitiveness, and follow FSC’s strategy in the establishment of a regional financial group, Taiwanese banks continued to expand overseas service networks, especially in China and Southeast Asian countries by setting up new branches, equity participation, or merger& acquisition, which suggest diversifying business models Taiwanese banks may offer in the future. On the other hand, when envisioning new business opportunities derived from Bank 3.0 era and Big Data, banks proactively promoted digital financial service, including Third Party Payment and cross border trade platform.
I. Positive Factors
� As Taiwan economic prospects brighten, semiconductor manufacturers and technology firms outlooks improve, which are positive for the expansion of banking business.
� Authorities have deregulated banking business on a considerable scale, which could broaden scopes of financial service and products, and increase income resources.
� Taiwanese banks which have built up strong franchise and dense service networks in Southeast Asia, will benefit from the burgeoning financing need in the region, thus overseas income growth is forecasted to accelerate.
II. Negative Factors
� Domestic financial market’s competition remains fierce, which constraints loan spread broadening, and limited profit growth; more non-financial institutions have stepped into payment service, posing threats to banks’ conventional business models.
� While real estate market is gradually cooling down, there is little room for related loan business to expand, along with rising credit risk.
� Given domestics banks’ high exposure toward China, diminished Chinese growth momentum and tougher operating environment could curb overseas earning growth, and erode asset quality.
III. Winning Strategies
� Examining current loan pricing strategy to broaden net interest margin.
� Participating in international syndicate loan, expanding offshore banking business, deepening global presence to raise profitability.
� In view of information technology advances ushering in transformation of financial service, the bank shall encourage innovation, and promote new digital financial service.
IV. Mega ICBC’s Niche
� Mega ICBC is irreplaceable in terms of foreign remittances, and it enjoys competitive edge in foreign exchange business. For example, the Bank’s New York Branch is the only Taiwanese bank that simultaneously participates in CHIPS, Fedwire, and ACH as a member bank.
� Mega ICBC can raise funds at relatively cheap cost on the international market because of its superb asset quality and the best credit ratings of domestic banks.
� Mega ICBC owns expansive global presence, and international banking expertise, enhancing the bank’s diversification and profitability.
� Mega ICBC maintains the highest foreign deposit balance among domestic banks ever since.
�
16
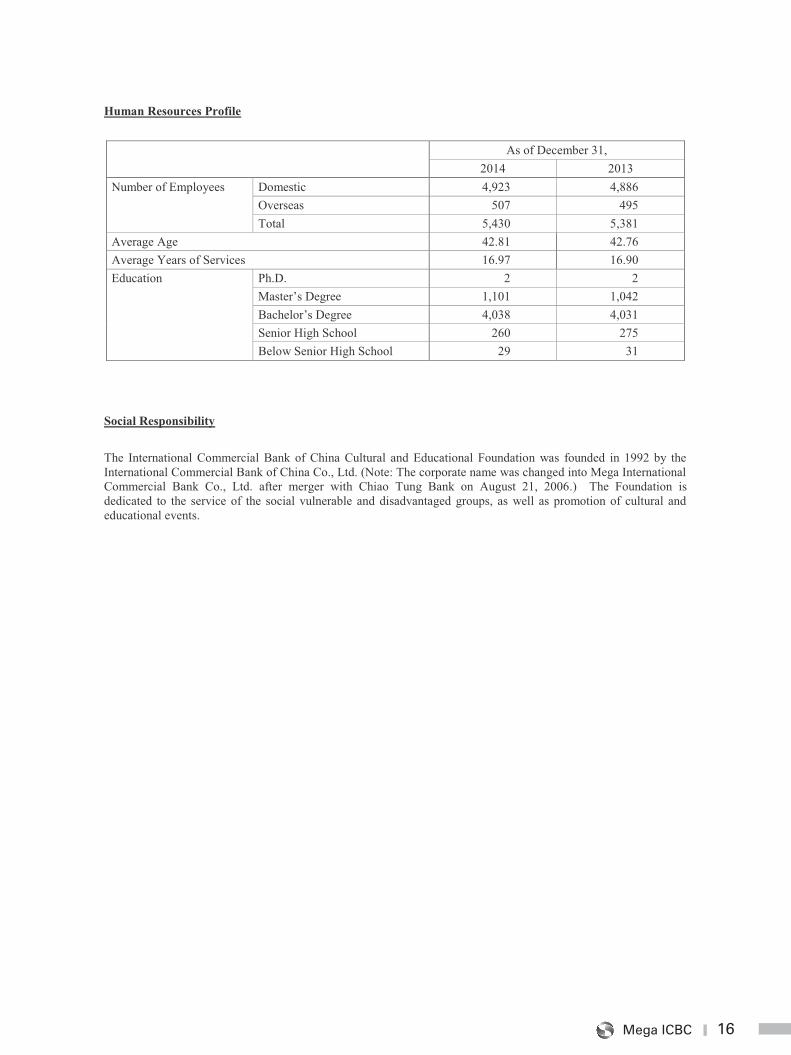
Human Resources Profile
As of December 31, 2014 2013
Number of Employees Domestic 4,923 4,886 Overseas 507 495 Total 5,430 5,381
Average Age 42.81 42.76 Average Years of Services 16.97 16.90 Education Ph.D. 2 2
Master’s Degree 1,101 1,042 Bachelor’s Degree 4,038 4,031 Senior High School 260 275 Below Senior High School 29 31
Social Responsibility
The International Commercial Bank of China Cultural and Educational Foundation was founded in 1992 by the International Commercial Bank of China Co., Ltd. (Note: The corporate name was changed into Mega International Commercial Bank Co., Ltd. after merger with Chiao Tung Bank on August 21, 2006.) The Foundation is dedicated to the service of the social vulnerable and disadvantaged groups, as well as promotion of cultural and educational events.
16Mega ICBC
16
Human Resources Profile
As of December 31, 2014 2013
Number of Employees Domestic 4,923 4,886 Overseas 507 495 Total 5,430 5,381
Average Age 42.81 42.76 Average Years of Services 16.97 16.90 Education Ph.D. 2 2
Master’s Degree 1,101 1,042 Bachelor’s Degree 4,038 4,031 Senior High School 260 275 Below Senior High School 29 31
Social Responsibility
The International Commercial Bank of China Cultural and Educational Foundation was founded in 1992 by the International Commercial Bank of China Co., Ltd. (Note: The corporate name was changed into Mega International Commercial Bank Co., Ltd. after merger with Chiao Tung Bank on August 21, 2006.) The Foundation is dedicated to the service of the social vulnerable and disadvantaged groups, as well as promotion of cultural and educational events.
17 Annual Report 2014
17
Financial Information
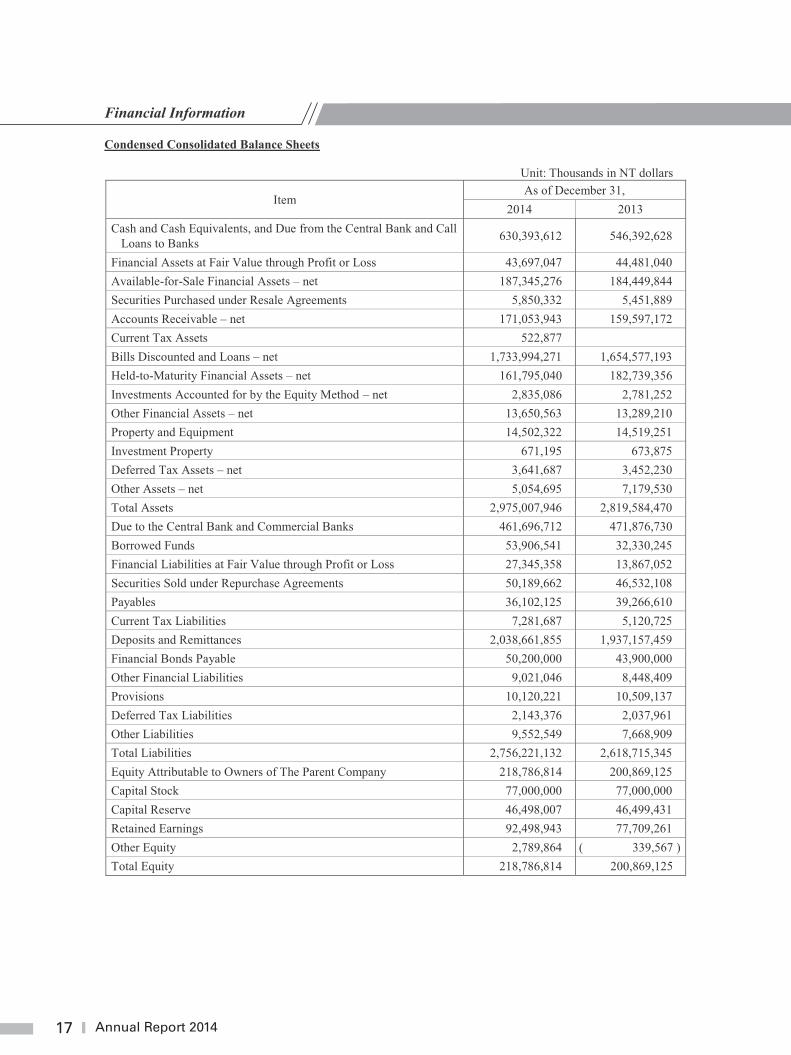
Condensed Consolidated Balance Sheets
Unit: Thousands in NT dollars
Item As of December 31,
2014 2013 Cash and Cash Equivalents, and Due from the Central Bank and Call
Loans to Banks 630,393,612 546,392,628
Financial Assets at Fair Value through Profit or Loss 43,697,047 44,481,040 Available-for-Sale Financial Assets – net 187,345,276 184,449,844 Securities Purchased under Resale Agreements 5,850,332 5,451,889 Accounts Receivable – net 171,053,943 159,597,172 Current Tax Assets 522,877 Bills Discounted and Loans – net 1,733,994,271 1,654,577,193 Held-to-Maturity Financial Assets – net 161,795,040 182,739,356 Investments Accounted for by the Equity Method – net 2,835,086 2,781,252 Other Financial Assets – net 13,650,563 13,289,210 Property and Equipment 14,502,322 14,519,251 Investment Property 671,195 673,875 Deferred Tax Assets – net 3,641,687 3,452,230 Other Assets – net 5,054,695 7,179,530 Total Assets 2,975,007,946 2,819,584,470 Due to the Central Bank and Commercial Banks 461,696,712 471,876,730 Borrowed Funds 53,906,541 32,330,245 Financial Liabilities at Fair Value through Profit or Loss 27,345,358 13,867,052 Securities Sold under Repurchase Agreements 50,189,662 46,532,108 Payables 36,102,125 39,266,610 Current Tax Liabilities 7,281,687 5,120,725 Deposits and Remittances 2,038,661,855 1,937,157,459 Financial Bonds Payable 50,200,000 43,900,000 Other Financial Liabilities 9,021,046 8,448,409 Provisions 10,120,221 10,509,137 Deferred Tax Liabilities 2,143,376 2,037,961 Other Liabilities 9,552,549 7,668,909 Total Liabilities 2,756,221,132 2,618,715,345 Equity Attributable to Owners of The Parent Company 218,786,814 200,869,125 Capital Stock 77,000,000 77,000,000 Capital Reserve 46,498,007 46,499,431 Retained Earnings 92,498,943 77,709,261 Other Equity 2,789,864 ( 339,567 ) Total Equity 218,786,814 200,869,125
18Mega ICBC
18
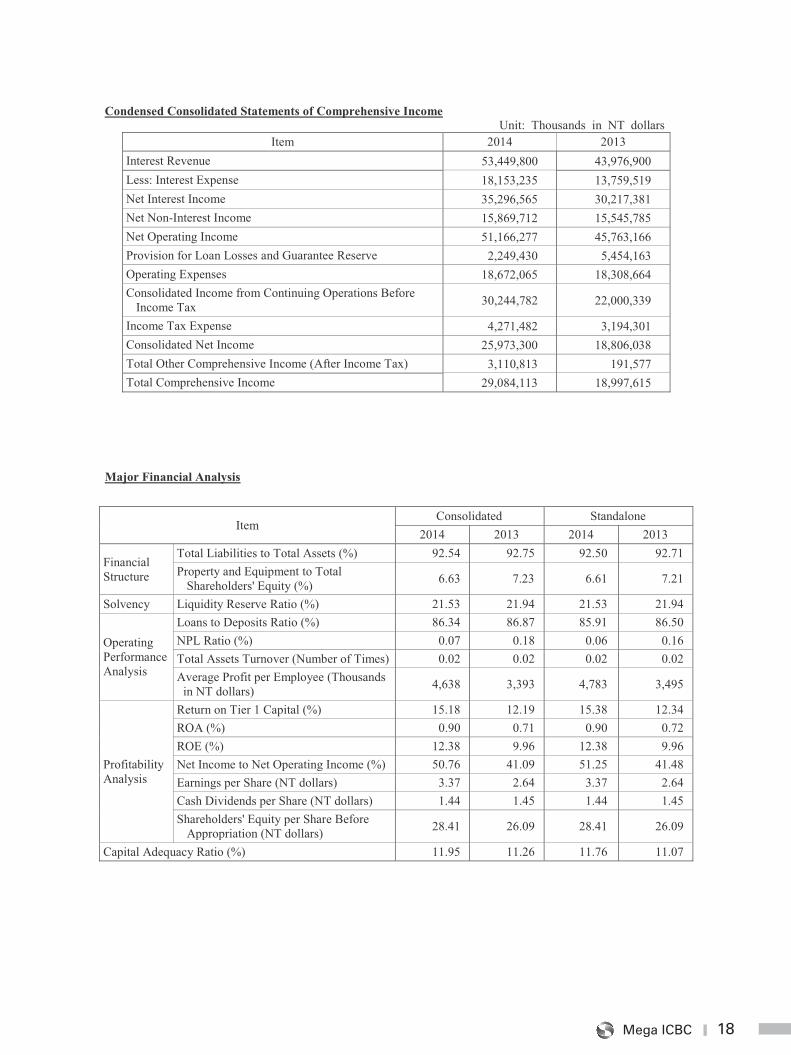
Condensed Consolidated Statements of Comprehensive Income Unit: Thousands in NT dollars
Item 2014 2013 Interest Revenue 53,449,800 43,976,900 Less: Interest Expense 18,153,235 13,759,519 Net Interest Income 35,296,565 30,217,381 Net Non-Interest Income 15,869,712 15,545,785 Net Operating Income 51,166,277 45,763,166 Provision for Loan Losses and Guarantee Reserve 2,249,430 5,454,163 Operating Expenses 18,672,065 18,308,664 Consolidated Income from Continuing Operations Before
Income Tax 30,244,782 22,000,339
Income Tax Expense 4,271,482 3,194,301 Consolidated Net Income 25,973,300 18,806,038 Total Other Comprehensive Income (After Income Tax) 3,110,813 191,577 Total Comprehensive Income 29,084,113 18,997,615
Major Financial Analysis
Item Consolidated Standalone
2014 2013 2014 2013
Financial Structure
Total Liabilities to Total Assets (%) 92.54 92.75 92.50 92.71 Property and Equipment to Total
Shareholders' Equity (%) 6.63 7.23 6.61 7.21
Solvency Liquidity Reserve Ratio (%) 21.53 21.94 21.53 21.94
Operating Performance Analysis
Loans to Deposits Ratio (%) 86.34 86.87 85.91 86.50 NPL Ratio (%) 0.07 0.18 0.06 0.16 Total Assets Turnover (Number of Times) 0.02 0.02 0.02 0.02 Average Profit per Employee (Thousands in NT dollars) 4,638 3,393 4,783 3,495
Profitability Analysis
Return on Tier 1 Capital (%) 15.18 12.19 15.38 12.34 ROA (%) 0.90 0.71 0.90 0.72 ROE (%) 12.38 9.96 12.38 9.96 Net Income to Net Operating Income (%) 50.76 41.09 51.25 41.48 Earnings per Share (NT dollars) 3.37 2.64 3.37 2.64 Cash Dividends per Share (NT dollars) 1.44 1.45 1.44 1.45 Shareholders' Equity per Share Before
Appropriation (NT dollars) 28.41 26.09 28.41 26.09
Capital Adequacy Ratio (%) 11.95 11.26 11.76 11.07
19 Annual Report 2014
19
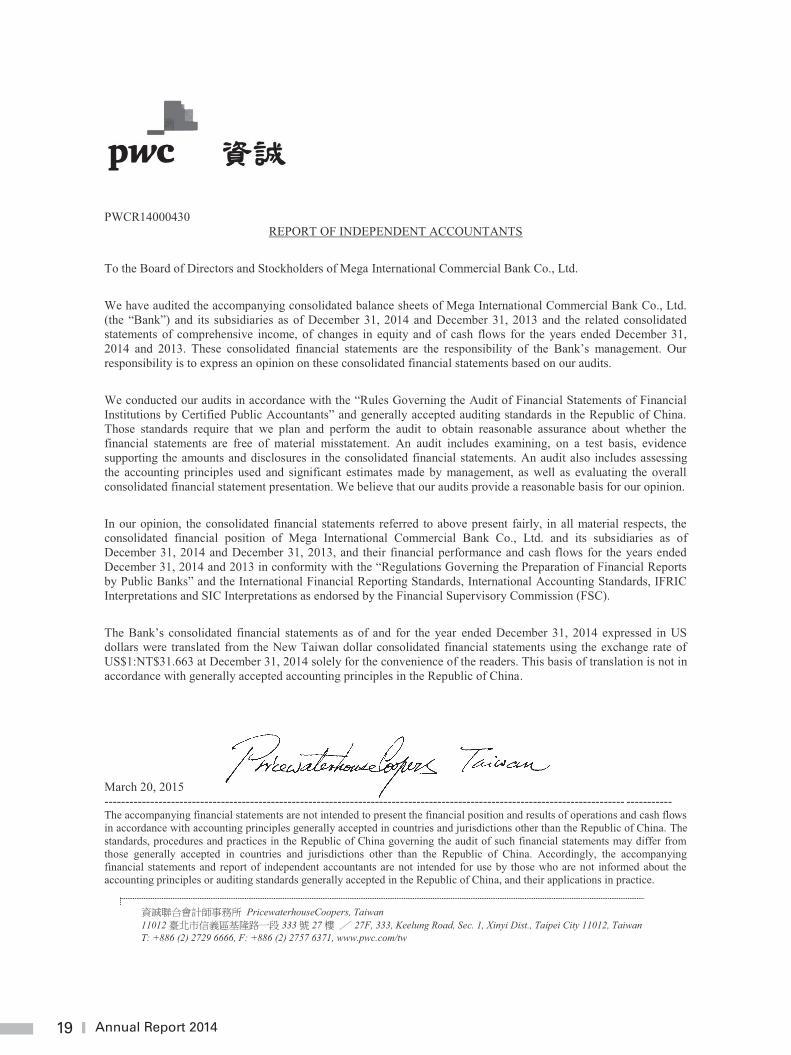
PWCR14000430
REPORT OF INDEPENDENT ACCOUNTANTS
To the Board of Directors and Stockholders of Mega International Commercial Bank Co., Ltd.
We have audited the accompanying consolidated balance sheets of Mega International Commercial Bank Co., Ltd. (the “Bank”) and its subsidiaries as of December 31, 2014 and December 31, 2013 and the related consolidated statements of comprehensive income, of changes in equity and of cash flows for the years ended December 31, 2014 and 2013. These consolidated financial statements are the responsibility of the Bank’s management. Our responsibility is to express an opinion on these consolidated financial statements based on our audits.
We conducted our audits in accordance with the “Rules Governing the Audit of Financial Statements of Financial Institutions by Certified Public Accountants” and generally accepted auditing standards in the Republic of China. Those standards require that we plan and perform the audit to obtain reasonable assurance about whether the financial statements are free of material misstatement. An audit includes examining, on a test basis, evidence supporting the amounts and disclosures in the consolidated financial statements. An audit also includes assessing the accounting principles used and significant estimates made by management, as well as evaluating the overall consolidated financial statement presentation. We believe that our audits provide a reasonable basis for our opinion.
In our opinion, the consolidated financial statements referred to above present fairly, in all material respects, the consolidated financial position of Mega International Commercial Bank Co., Ltd. and its subsidiaries as of December 31, 2014 and December 31, 2013, and their financial performance and cash flows for the years ended December 31, 2014 and 2013 in conformity with the “Regulations Governing the Preparation of Financial Reports by Public Banks” and the International Financial Reporting Standards, International Accounting Standards, IFRIC Interpretations and SIC Interpretations as endorsed by the Financial Supervisory Commission (FSC).
The Bank’s consolidated financial statements as of and for the year ended December 31, 2014 expressed in US dollars were translated from the New Taiwan dollar consolidated financial statements using the exchange rate of US$1:NT$31.663 at December 31, 2014 solely for the convenience of the readers. This basis of translation is not in accordance with generally accepted accounting principles in the Republic of China.
March 20, 2015 ----------------------------------------------------------------------------------------------------------------------------- ----------- The accompanying financial statements are not intended to present the financial position and results of operations and cash flows in accordance with accounting principles generally accepted in countries and jurisdictions other than the Republic of China. The standards, procedures and practices in the Republic of China governing the audit of such financial statements may differ from those generally accepted in countries and jurisdictions other than the Republic of China. Accordingly, the accompanying financial statements and report of independent accountants are not intended for use by those who are not informed about the accounting principles or auditing standards generally accepted in the Republic of China, and their applications in practice.
PricewaterhouseCoopers, Taiwan 11012 333 27 27F, 333, Keelung Road, Sec. 1, Xinyi Dist., Taipei City 11012, Taiwan T: +886 (2) 2729 6666, F: +886 (2) 2757 6371, www.pwc.com/tw
20Mega ICBC
20
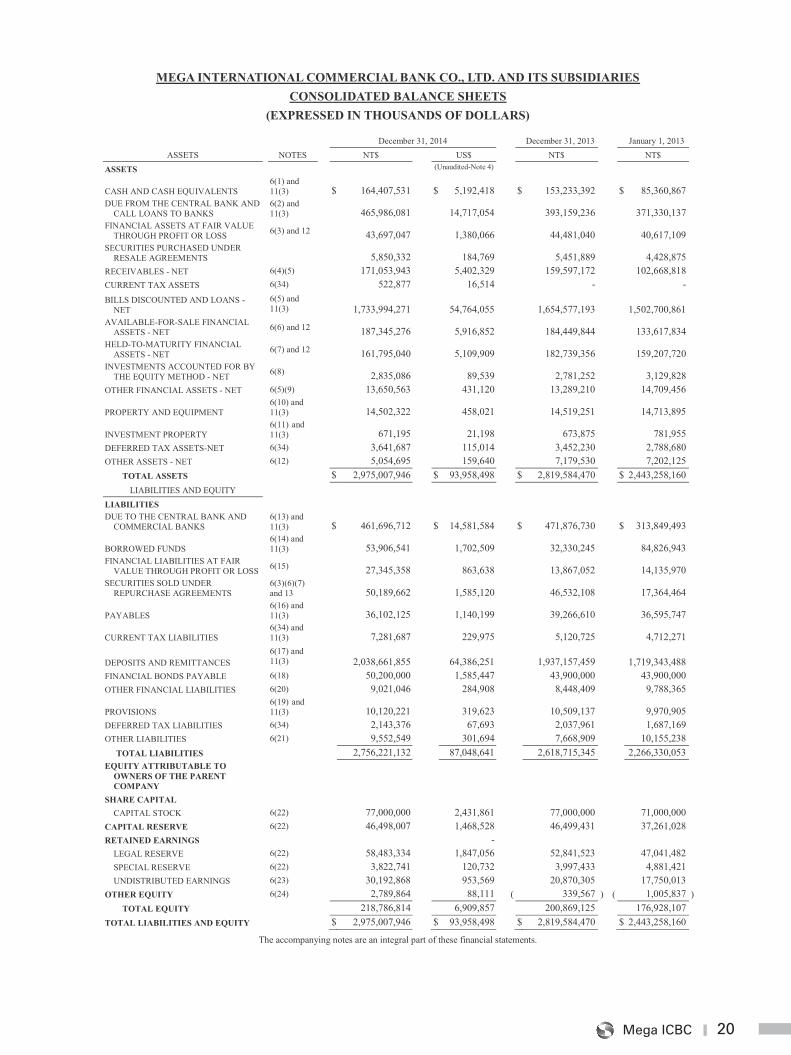
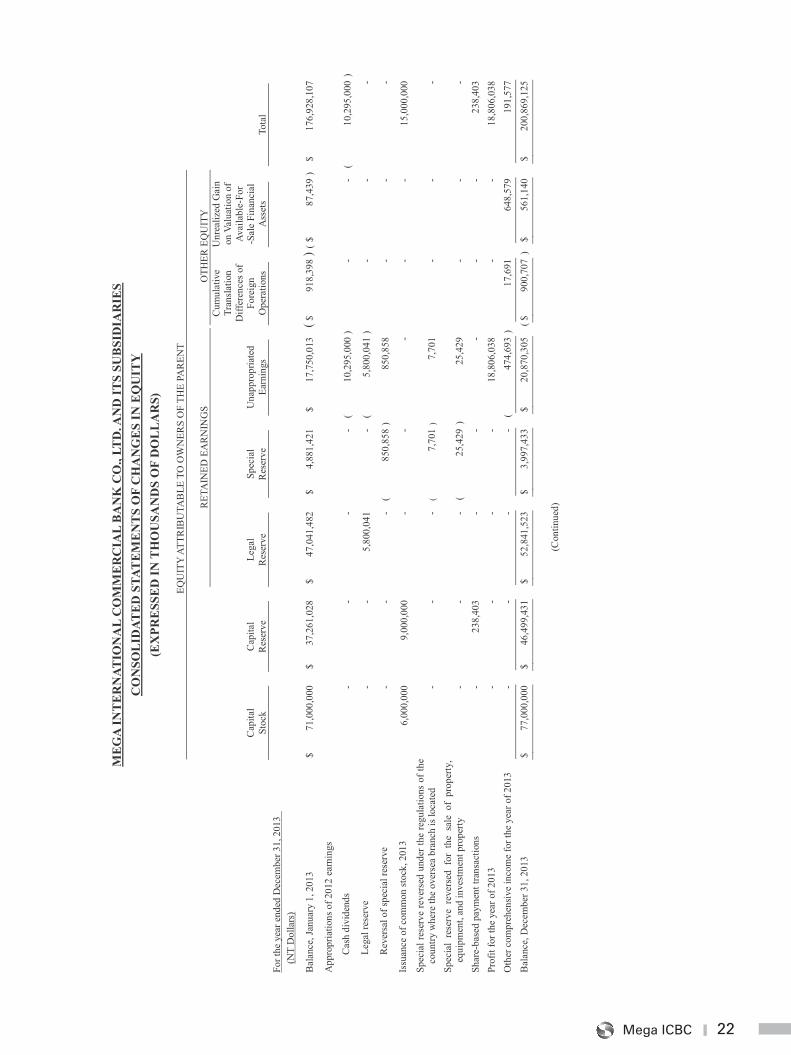
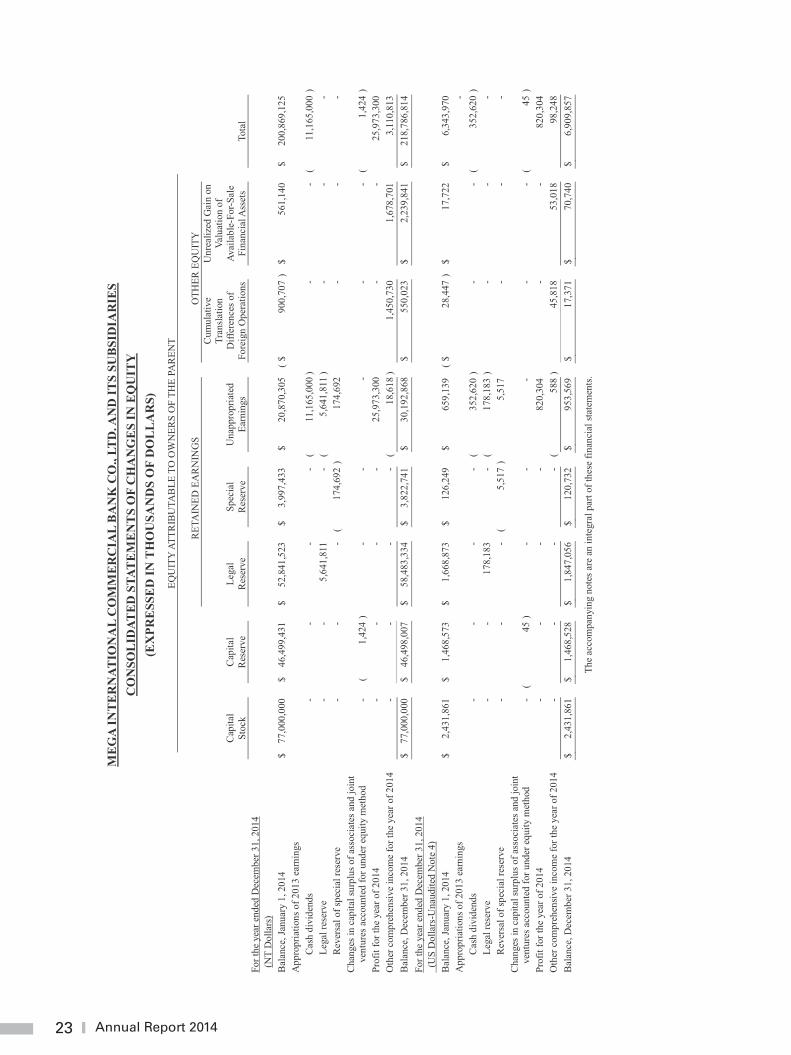
MEGA INTERNATIONAL COMMERCIAL BANK CO., LTD. AND ITS SUBSIDIARIES CONSOLIDATED BALANCE SHEETS
(EXPRESSED IN THOUSANDS OF DOLLARS)
December 31, 2014 December 31, 2013 January 1, 2013 ASSETS NOTES NT$ US$ NT$ NT$
ASSETS (Unaudited-Note 4)
CASH AND CASH EQUIVALENTS 6(1) and 11(3) $ 164,407,531 $ 5,192,418 $ 153,233,392 $ 85,360,867
DUE FROM THE CENTRAL BANK AND CALL LOANS TO BANKS
6(2) and 11(3) 465,986,081 14,717,054 393,159,236 371,330,137
FINANCIAL ASSETS AT FAIR VALUE THROUGH PROFIT OR LOSS 6(3) and 12 43,697,047 1,380,066 44,481,040 40,617,109
SECURITIES PURCHASED UNDER RESALE AGREEMENTS 5,850,332 184,769 5,451,889 4,428,875
RECEIVABLES - NET 6(4)(5) 171,053,943 5,402,329 159,597,172 102,668,818 CURRENT TAX ASSETS 6(34) 522,877 16,514 - - BILLS DISCOUNTED AND LOANS -
NET 6(5) and 11(3) 1,733,994,271 54,764,055 1,654,577,193
1,502,700,861
AVAILABLE-FOR-SALE FINANCIAL ASSETS - NET 6(6) and 12 187,345,276 5,916,852 184,449,844 133,617,834
HELD-TO-MATURITY FINANCIAL ASSETS - NET 6(7) and 12 161,795,040 5,109,909 182,739,356 159,207,720
INVESTMENTS ACCOUNTED FOR BY THE EQUITY METHOD - NET 6(8) 2,835,086 89,539 2,781,252 3,129,828
OTHER FINANCIAL ASSETS - NET 6(5)(9) 13,650,563 431,120 13,289,210 14,709,456
PROPERTY AND EQUIPMENT 6(10) and 11(3) 14,502,322 458,021 14,519,251 14,713,895
INVESTMENT PROPERTY 6(11) and 11(3) 671,195 21,198 673,875 781,955
DEFERRED TAX ASSETS-NET 6(34) 3,641,687 115,014 3,452,230 2,788,680 OTHER ASSETS - NET 6(12) 5,054,695 159,640 7,179,530 7,202,125
TOTAL ASSETS $ 2,975,007,946 $ 93,958,498 $ 2,819,584,470 $ 2,443,258,160 LIABILITIES AND EQUITY
LIABILITIES DUE TO THE CENTRAL BANK AND
COMMERCIAL BANKS 6(13) and 11(3) $ 461,696,712 $ 14,581,584 $ 471,876,730 $ 313,849,493
BORROWED FUNDS 6(14) and 11(3) 53,906,541 1,702,509 32,330,245 84,826,943
FINANCIAL LIABILITIES AT FAIR VALUE THROUGH PROFIT OR LOSS 6(15) 27,345,358 863,638 13,867,052 14,135,970
SECURITIES SOLD UNDER REPURCHASE AGREEMENTS
6(3)(6)(7) and 13 50,189,662 1,585,120 46,532,108 17,364,464
PAYABLES 6(16) and 11(3) 36,102,125 1,140,199 39,266,610 36,595,747
CURRENT TAX LIABILITIES 6(34) and 11(3) 7,281,687 229,975 5,120,725 4,712,271
DEPOSITS AND REMITTANCES 6(17) and 11(3) 2,038,661,855 64,386,251 1,937,157,459
1,719,343,488
FINANCIAL BONDS PAYABLE 6(18) 50,200,000 1,585,447 43,900,000 43,900,000 OTHER FINANCIAL LIABILITIES 6(20) 9,021,046 284,908 8,448,409 9,788,365
PROVISIONS 6(19) and 11(3) 10,120,221 319,623 10,509,137 9,970,905
DEFERRED TAX LIABILITIES 6(34) 2,143,376 67,693 2,037,961 1,687,169 OTHER LIABILITIES 6(21) 9,552,549 301,694 7,668,909 10,155,238
TOTAL LIABILITIES 2,756,221,132 87,048,641 2,618,715,345 2,266,330,053 EQUITY ATTRIBUTABLE TO
OWNERS OF THE PARENT COMPANY
SHARE CAPITAL CAPITAL STOCK 6(22) 77,000,000 2,431,861 77,000,000 71,000,000
CAPITAL RESERVE 6(22) 46,498,007 1,468,528 46,499,431 37,261,028 RETAINED EARNINGS -
LEGAL RESERVE 6(22) 58,483,334 1,847,056 52,841,523 47,041,482 SPECIAL RESERVE 6(22) 3,822,741 120,732 3,997,433 4,881,421 UNDISTRIBUTED EARNINGS 6(23) 30,192,868 953,569 20,870,305 17,750,013
OTHER EQUITY 6(24) 2,789,864 88,111 ( 339,567 ) ( 1,005,837 ) TOTAL EQUITY 218,786,814 6,909,857 200,869,125 176,928,107
TOTAL LIABILITIES AND EQUITY $ 2,975,007,946 $ 93,958,498 $ 2,819,584,470 $ 2,443,258,160
The accompanying notes are an integral part of these financial statements.
21 Annual Report 2014
21
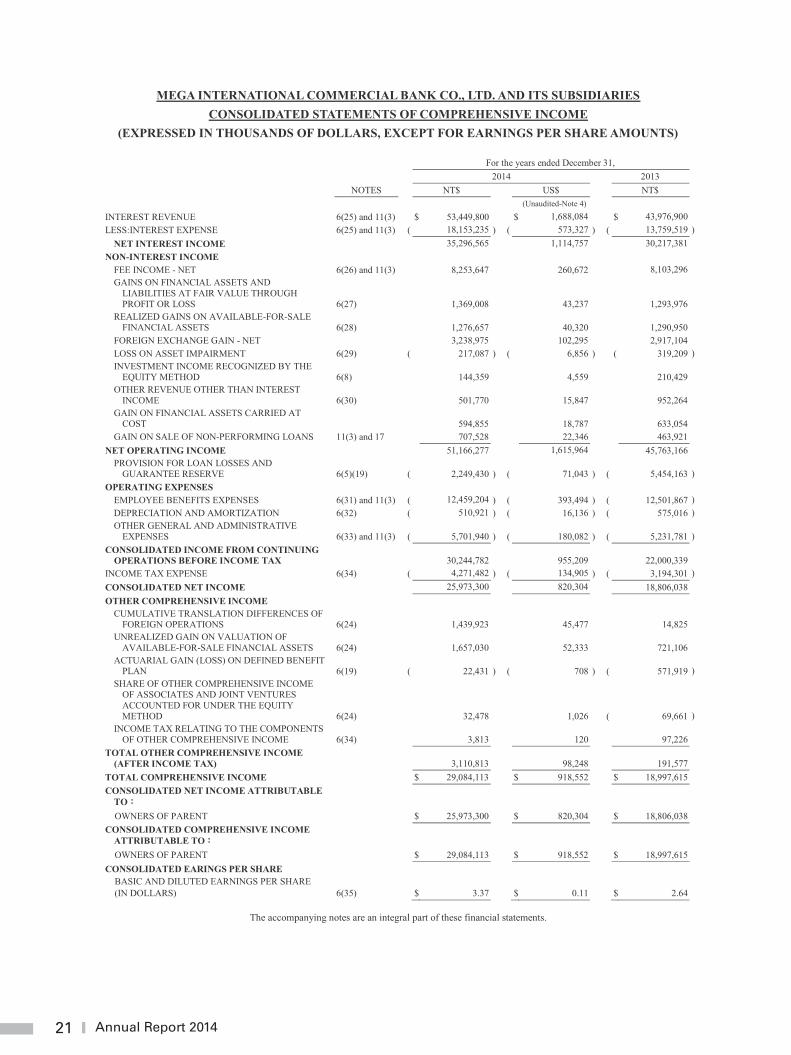
MEGA INTERNATIONAL COMMERCIAL BANK CO., LTD. AND ITS SUBSIDIARIES CONSOLIDATED STATEMENTS OF COMPREHENSIVE INCOME
(EXPRESSED IN THOUSANDS OF DOLLARS, EXCEPT FOR EARNINGS PER SHARE AMOUNTS)
For the years ended December 31, 2014 2013 NOTES NT$ US$ NT$ (Unaudited-Note 4) INTEREST REVENUE 6(25) and 11(3) $ 53,449,800 $ 1,688,084 $ 43,976,900 LESS:INTEREST EXPENSE 6(25) and 11(3) ( 18,153,235 ) ( 573,327 ) ( 13,759,519 )
NET INTEREST INCOME 35,296,565 1,114,757 30,217,381 NON-INTEREST INCOME
FEE INCOME - NET 6(26) and 11(3) 8,253,647 260,672 8,103,296 GAINS ON FINANCIAL ASSETS AND
LIABILITIES AT FAIR VALUE THROUGH PROFIT OR LOSS 6(27) 1,369,008 43,237 1,293,976
REALIZED GAINS ON AVAILABLE-FOR-SALE FINANCIAL ASSETS 6(28) 1,276,657 40,320 1,290,950
FOREIGN EXCHANGE GAIN - NET 3,238,975 102,295 2,917,104 LOSS ON ASSET IMPAIRMENT 6(29) ( 217,087 ) ( 6,856 ) ( 319,209 ) INVESTMENT INCOME RECOGNIZED BY THE
EQUITY METHOD 6(8) 144,359 4,559 210,429 OTHER REVENUE OTHER THAN INTEREST
INCOME 6(30) 501,770 15,847 952,264 GAIN ON FINANCIAL ASSETS CARRIED AT
COST 594,855 18,787 633,054 GAIN ON SALE OF NON-PERFORMING LOANS 11(3) and 17 707,528 22,346 463,921
NET OPERATING INCOME 51,166,277 1,615,964 45,763,166 PROVISION FOR LOAN LOSSES AND
GUARANTEE RESERVE 6(5)(19) ( 2,249,430 ) ( 71,043 ) ( 5,454,163 ) OPERATING EXPENSES
EMPLOYEE BENEFITS EXPENSES 6(31) and 11(3) ( 12,459,204 ) ( 393,494 ) ( 12,501,867 ) DEPRECIATION AND AMORTIZATION 6(32) ( 510,921 ) ( 16,136 ) ( 575,016 ) OTHER GENERAL AND ADMINISTRATIVE
EXPENSES 6(33) and 11(3) ( 5,701,940 ) ( 180,082 ) ( 5,231,781 ) CONSOLIDATED INCOME FROM CONTINUING
OPERATIONS BEFORE INCOME TAX 30,244,782 955,209 22,000,339 INCOME TAX EXPENSE 6(34) ( 4,271,482 ) ( 134,905 ) ( 3,194,301 ) CONSOLIDATED NET INCOME 25,973,300 820,304 18,806,038 OTHER COMPREHENSIVE INCOME
CUMULATIVE TRANSLATION DIFFERENCES OF FOREIGN OPERATIONS 6(24) 1,439,923 45,477 14,825
UNREALIZED GAIN ON VALUATION OF AVAILABLE-FOR-SALE FINANCIAL ASSETS 6(24) 1,657,030 52,333 721,106
ACTUARIAL GAIN (LOSS) ON DEFINED BENEFIT PLAN 6(19) ( 22,431 ) ( 708 ) ( 571,919 )
SHARE OF OTHER COMPREHENSIVE INCOME OF ASSOCIATES AND JOINT VENTURES ACCOUNTED FOR UNDER THE EQUITY METHOD 6(24) 32,478 1,026 ( 69,661 )
INCOME TAX RELATING TO THE COMPONENTS OF OTHER COMPREHENSIVE INCOME 6(34) 3,813 120 97,226
TOTAL OTHER COMPREHENSIVE INCOME (AFTER INCOME TAX) 3,110,813 98,248 191,577
TOTAL COMPREHENSIVE INCOME $ 29,084,113 $ 918,552 $ 18,997,615 CONSOLIDATED NET INCOME ATTRIBUTABLE
TO OWNERS OF PARENT $ 25,973,300 $ 820,304 $ 18,806,038
CONSOLIDATED COMPREHENSIVE INCOME ATTRIBUTABLE TO OWNERS OF PARENT $ 29,084,113 $ 918,552 $ 18,997,615
CONSOLIDATED EARINGS PER SHARE BASIC AND DILUTED EARNINGS PER SHARE (IN DOLLARS) 6(35) $ 3.37 $ 0.11 $ 2.64
The accompanying notes are an integral part of these financial statements.
22Mega ICBC
21
MEGA INTERNATIONAL COMMERCIAL BANK CO., LTD. AND ITS SUBSIDIARIES CONSOLIDATED STATEMENTS OF COMPREHENSIVE INCOME
(EXPRESSED IN THOUSANDS OF DOLLARS, EXCEPT FOR EARNINGS PER SHARE AMOUNTS)
For the years ended December 31, 2014 2013 NOTES NT$ US$ NT$ (Unaudited-Note 4) INTEREST REVENUE 6(25) and 11(3) $ 53,449,800 $ 1,688,084 $ 43,976,900 LESS:INTEREST EXPENSE 6(25) and 11(3) ( 18,153,235 ) ( 573,327 ) ( 13,759,519 )
NET INTEREST INCOME 35,296,565 1,114,757 30,217,381 NON-INTEREST INCOME
FEE INCOME - NET 6(26) and 11(3) 8,253,647 260,672 8,103,296 GAINS ON FINANCIAL ASSETS AND
LIABILITIES AT FAIR VALUE THROUGH PROFIT OR LOSS 6(27) 1,369,008 43,237 1,293,976
REALIZED GAINS ON AVAILABLE-FOR-SALE FINANCIAL ASSETS 6(28) 1,276,657 40,320 1,290,950
FOREIGN EXCHANGE GAIN - NET 3,238,975 102,295 2,917,104 LOSS ON ASSET IMPAIRMENT 6(29) ( 217,087 ) ( 6,856 ) ( 319,209 ) INVESTMENT INCOME RECOGNIZED BY THE
EQUITY METHOD 6(8) 144,359 4,559 210,429 OTHER REVENUE OTHER THAN INTEREST
INCOME 6(30) 501,770 15,847 952,264 GAIN ON FINANCIAL ASSETS CARRIED AT
COST 594,855 18,787 633,054 GAIN ON SALE OF NON-PERFORMING LOANS 11(3) and 17 707,528 22,346 463,921
NET OPERATING INCOME 51,166,277 1,615,964 45,763,166 PROVISION FOR LOAN LOSSES AND
GUARANTEE RESERVE 6(5)(19) ( 2,249,430 ) ( 71,043 ) ( 5,454,163 ) OPERATING EXPENSES
EMPLOYEE BENEFITS EXPENSES 6(31) and 11(3) ( 12,459,204 ) ( 393,494 ) ( 12,501,867 ) DEPRECIATION AND AMORTIZATION 6(32) ( 510,921 ) ( 16,136 ) ( 575,016 ) OTHER GENERAL AND ADMINISTRATIVE
EXPENSES 6(33) and 11(3) ( 5,701,940 ) ( 180,082 ) ( 5,231,781 ) CONSOLIDATED INCOME FROM CONTINUING
OPERATIONS BEFORE INCOME TAX 30,244,782 955,209 22,000,339 INCOME TAX EXPENSE 6(34) ( 4,271,482 ) ( 134,905 ) ( 3,194,301 ) CONSOLIDATED NET INCOME 25,973,300 820,304 18,806,038 OTHER COMPREHENSIVE INCOME
CUMULATIVE TRANSLATION DIFFERENCES OF FOREIGN OPERATIONS 6(24) 1,439,923 45,477 14,825
UNREALIZED GAIN ON VALUATION OF AVAILABLE-FOR-SALE FINANCIAL ASSETS 6(24) 1,657,030 52,333 721,106
ACTUARIAL GAIN (LOSS) ON DEFINED BENEFIT PLAN 6(19) ( 22,431 ) ( 708 ) ( 571,919 )
SHARE OF OTHER COMPREHENSIVE INCOME OF ASSOCIATES AND JOINT VENTURES ACCOUNTED FOR UNDER THE EQUITY METHOD 6(24) 32,478 1,026 ( 69,661 )
INCOME TAX RELATING TO THE COMPONENTS OF OTHER COMPREHENSIVE INCOME 6(34) 3,813 120 97,226
TOTAL OTHER COMPREHENSIVE INCOME (AFTER INCOME TAX) 3,110,813 98,248 191,577
TOTAL COMPREHENSIVE INCOME $ 29,084,113 $ 918,552 $ 18,997,615 CONSOLIDATED NET INCOME ATTRIBUTABLE
TO OWNERS OF PARENT $ 25,973,300 $ 820,304 $ 18,806,038
CONSOLIDATED COMPREHENSIVE INCOME ATTRIBUTABLE TO OWNERS OF PARENT $ 29,084,113 $ 918,552 $ 18,997,615
CONSOLIDATED EARINGS PER SHARE BASIC AND DILUTED EARNINGS PER SHARE (IN DOLLARS) 6(35) $ 3.37 $ 0.11 $ 2.64
The accompanying notes are an integral part of these financial statements.
22
ME
GA
INT
ER
NAT
ION
AL
CO
MM
ER
CIA
L B
AN
K C
O.,
LTD
. AN
D IT
S SU
BSI
DIA
RIE
S C
ON
SOL
IDAT
ED
STA
TE
ME
NT
S O
F C
HA
NG
ES
IN E
QU
ITY
(E
XPR
ESS
ED
IN T
HO
USA
ND
S O
F D
OL
LA
RS)
EQ
UIT
Y A
TTR
IBU
TAB
LE T
O O
WN
ERS
OF
THE
PAR
ENT
RET
AIN
ED E
AR
NIN
GS
O
THER
EQ
UIT
Y
C
apita
l St
ock
Cap
ital
Res
erve
Le
gal
Res
erve
Sp
ecia
l R
eser
ve
Una
ppro
pria
ted
Earn
ings
Cum
ulat
ive
Tran
slat
ion
Diff
eren
ces o
f Fo
reig
n O
pera
tions
Unr
ealiz
ed G
ain
on V
alua
tion
of
Avai
labl
e-Fo
r -S
ale
Fina
ncia
l A
sset
s
To
tal
Fo
r the
yea
r end
ed D
ecem
ber 3
1, 2
013
(N
T D
olla
rs)
Bal
ance
, Jan
uary
1, 2
013
$ 71
,000
,000
$
3
7,26
1,02
8
$ 47
,041
,482
$
4
,881
,421
$
17
,750
,013
( $
91
8,39
8 ) (
$ 87
,439
) $
1
76,9
28,1
07
App
ropr
iatio
ns o
f 201
2 ea
rnin
gs
Cas
h di
vide
nds
-
-
-
-
(
10,2
95,0
00 )
-
- (
10
,295
,000
)
Lega
l res
erve
-
-
5,80
0,04
1
-
(
5,
800,
041
)
-
-
-
Rev
ersa
l of s
peci
al re
serv
e
-
-
- (
85
0,85
8 )
8
50,8
58
-
-
-
Issu
ance
of c
omm
on st
ock,
201
3
6,0
00,0
00
9
,000
,000
-
-
-
-
-
1
5,00
0,00
0
Spec
ial r
eser
ve re
vers
ed u
nder
the
regu
latio
ns o
f the
co
untry
whe
re th
e ov
erse
a br
anch
is lo
cate
d
-
-
- (
7,70
1 )
7,70
1
-
-
-
Sp
ecia
l re
serv
e re
vers
ed f
or t
he s
ale
of p
rope
rty,
equi
pmen
t, an
d in
vest
men
t pro
perty
-
-
-
(
25
,429
)
25,
429
-
-
-
Shar
e-ba
sed
paym
ent t
rans
actio
ns
-
23
8,40
3
-
-
-
-
-
23
8,40
3
Prof
it fo
r the
yea
r of 2
013
-
-
-
-
18,
806,
038
-
-
1
8,80
6,03
8
Oth
er c
ompr
ehen
sive
inco
me
for t
he y
ear o
f 201
3
-
-
-
-
(
47
4,69
3 )
17,6
91
6
48,5
79
1
91,5
77
Bal
ance
, Dec
embe
r 31,
201
3 $
77,0
00,0
00
$
4
6,49
9,43
1
$
52,8
41,5
23
$
3,
997,
433
$
20
,870
,305
(
$
900,
707
) $
5
61,1
40
$
20
0,86
9,12
5
(C
ontin
ued)
23 Annual Report 2014
23
ME
GA
INT
ER
NAT
ION
AL
CO
MM
ER
CIA
L B
AN
K C
O.,
LTD
. AN
D IT
S SU
BSI
DIA
RIE
S C
ON
SOL
IDAT
ED
STA
TE
ME
NT
S O
F C
HA
NG
ES
IN E
QU
ITY
(E
XPR
ESS
ED
IN T
HO
USA
ND
S O
F D
OL
LA
RS)
EQU
ITY
ATT
RIB
UTA
BLE
TO
OW
NER
S O
F TH
E PA
REN
T
RET
AIN
ED E
AR
NIN
GS
O
THER
EQ
UIT
Y
C
apita
l St
ock
Cap
ital
Res
erve
Le
gal
Res
erve
Sp
ecia
l R
eser
ve
Una
ppro
pria
ted
Earn
ings
Cum
ulat
ive
Tran
slat
ion
Diff
eren
ces o
f Fo
reig
n O
pera
tions
U
nrea
lized
Gai
n on
Va
luat
ion
of
Avai
labl
e-Fo
r-Sal
e Fi
nanc
ial A
sset
s
To
tal
Fo
r the
yea
r end
ed D
ecem
ber 3
1, 2
014
(NT
Dol
lars
)
Bal
ance
, Jan
uary
1, 2
014
$ 77
,000
,000
$
46
,499
,431
$
52
,841
,523
$
3
,997
,433
$
2
0,87
0,30
5 (
$
900,
707
) $
56
1,14
0
$
200
,869
,125
A
ppro
pria
tions
of 2
013
earn
ings
Cas
h di
vide
nds
-
-
-
-
(
11
,165
,000
)
-
-
(
11,1
65,0
00 )
Lega
l res
erve
-
-
5,64
1,81
1
-
(
5,64
1,81
1 )
-
-
-
Rev
ersa
l of s
peci
al re
serv
e
-
-
- (
17
4,69
2 )
174
,692
-
-
-
C
hang
es in
cap
ital s
urpl
us o
f ass
ocia
tes a
nd jo
int
vent
ures
acc
ount
ed fo
r und
er e
quity
met
hod
-
(
1,
424
)
-
-
-
-
-
(
1,42
4 )
Prof
it fo
r the
yea
r of 2
014
-
-
-
-
2
5,97
3,30
0
-
-
25,
973,
300
O
ther
com
preh
ensiv
e in
com
e fo
r the
yea
r of 2
014
-
-
-
-
(
18
,618
)
1
,450
,730
1
,678
,701
3
,110
,813
B
alan
ce, D
ecem
ber 3
1, 2
014
$ 77
,000
,000
$
46
,498
,007
$
58
,483
,334
$
3,
822,
741
$
30
,192
,868
$
5
50,0
23
$
2,2
39,8
41
$
218
,786
,814
Fo
r the
yea
r end
ed D
ecem
ber 3
1, 2
014
(U
S D
olla
rs-U
naud
ited
Not
e 4)
Bal
ance
, Jan
uary
1, 2
014
$ 2,
431,
861
$
1
,468
,573
$
1,
668,
873
$
1
26,2
49
$
659,
139
( $
28
,447
) $
17
,722
$
6
,343
,970
A
ppro
pria
tions
of 2
013
earn
ings
-
C
ash
divi
dend
s
-
-
-
-
(
352,
620
)
-
-
(
352,
620
) Le
gal r
eser
ve
-
-
17
8,18
3
-
(
178,
183
)
-
-
-
R
ever
sal o
f spe
cial
rese
rve
-
-
-
(
5,51
7 )
5,5
17
-
-
-
Cha
nges
in c
apita
l sur
plus
of a
ssoc
iate
s and
join
t ve
ntur
es a
ccou
nted
for u
nder
equ
ity m
etho
d
- (
45
)
-
-
-
-
- (
45
)
Prof
it fo
r the
yea
r of 2
014
-
-
-
-
820,
304
-
-
8
20,3
04
Oth
er c
ompr
ehen
sive
inco
me
for t
he y
ear o
f 201
4
-
-
-
-
(
588
)
4
5,81
8
53,
018
9
8,24
8
Bal
ance
, Dec
embe
r 31,
201
4 $
2,43
1,86
1
$
1,4
68,5
28
$
1,84
7,05
6
$
120,
732
$
953,
569
$
17
,371
$
7
0,74
0
$
6,
909,
857
The
acco
mpa
nyin
g no
tes a
re a
n in
tegr
al p
art o
f the
se fi
nanc
ial s
tate
men
ts.
24Mega ICBC
2013NT$ US$ NT$
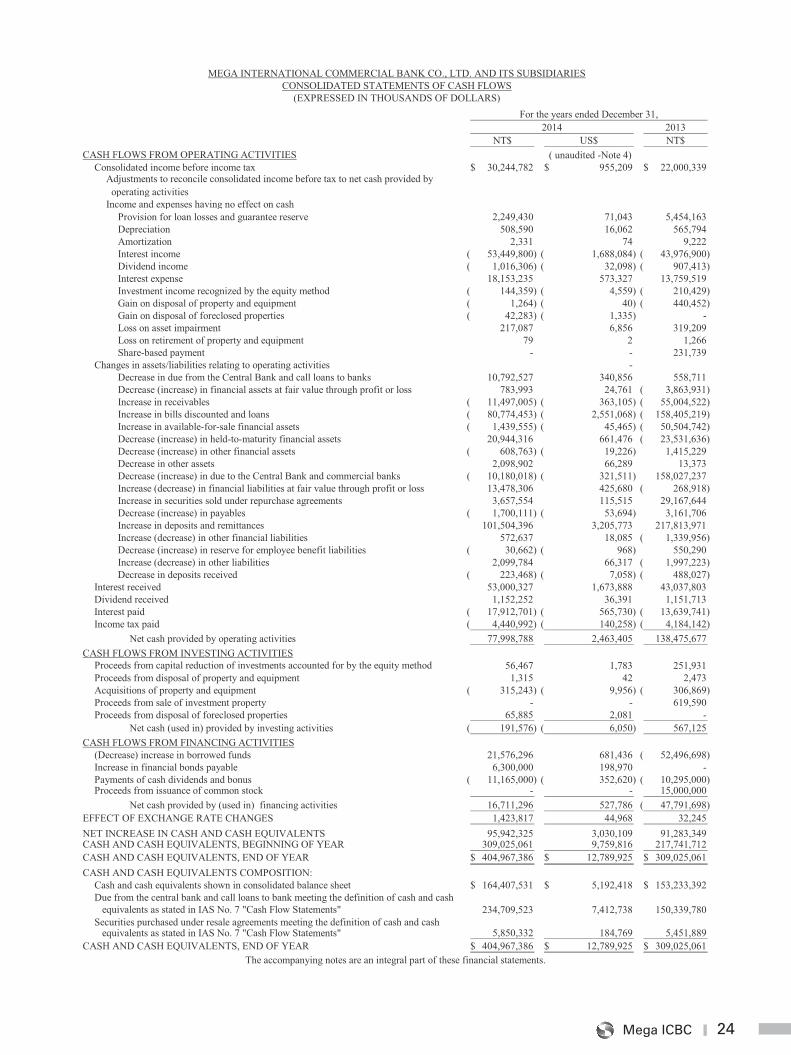
CASH FLOWS FROM OPERATING ACTIVITIES ( unaudited -Note 4)Consolidated income before income tax 30,244,782$ 955,209$ 22,000,339$
Adjustments to reconcile consolidated income before tax to net cash provided by operating activitiesIncome and expenses having no effect on cash
Provision for loan losses and guarantee reserve 2,249,430 71,043 5,454,163 Depreciation 508,590 16,062 565,794 Amortization 2,331 74 9,222 Interest income 53,449,800)( 1,688,084)( 43,976,900)( Dividend income 1,016,306)( 32,098)( 907,413)( Interest expense 18,153,235 573,327 13,759,519 Investment income recognized by the equity method 144,359)( 4,559)( 210,429)( Gain on disposal of property and equipment 1,264)( 40)( 440,452)( Gain on disposal of foreclosed properties 42,283)( 1,335)( - Loss on asset impairment 217,087 6,856 319,209 Loss on retirement of property and equipment 79 2 1,266 Share-based payment - - 231,739
Changes in assets/liabilities relating to operating activities - Decrease in due from the Central Bank and call loans to banks 10,792,527 340,856 558,711 Decrease (increase) in financial assets at fair value through profit or loss 783,993 24,761 3,863,931)( Increase in receivables 11,497,005)( 363,105)( 55,004,522)( Increase in bills discounted and loans 80,774,453)( 2,551,068)( 158,405,219)( Increase in available-for-sale financial assets 1,439,555)( 45,465)( 50,504,742)( Decrease (increase) in held-to-maturity financial assets 20,944,316 661,476 23,531,636)( Decrease (increase) in other financial assets 608,763)( 19,226)( 1,415,229 Decrease in other assets 2,098,902 66,289 13,373 Decrease (increase) in due to the Central Bank and commercial banks 10,180,018)( 321,511)( 158,027,237 Increase (decrease) in financial liabilities at fair value through profit or loss 13,478,306 425,680 268,918)( Increase in securities sold under repurchase agreements 3,657,554 115,515 29,167,644 Decrease (increase) in payables 1,700,111)( 53,694)( 3,161,706 Increase in deposits and remittances 101,504,396 3,205,773 217,813,971 Increase (decrease) in other financial liabilities 572,637 18,085 1,339,956)( Decrease (increase) in reserve for employee benefit liabilities 30,662)( 968)( 550,290 Increase (decrease) in other liabilities 2,099,784 66,317 1,997,223)( Decrease in deposits received 223,468)( 7,058)( 488,027)(
Interest received 53,000,327 1,673,888 43,037,803 Dividend received 1,152,252 36,391 1,151,713 Interest paid 17,912,701)( 565,730)( 13,639,741)( Income tax paid 4,440,992)( 140,258)( 4,184,142)(
Net cash provided by operating activities 77,998,788 2,463,405 138,475,677 CASH FLOWS FROM INVESTING ACTIVITIES
Proceeds from capital reduction of investments accounted for by the equity method 56,467 1,783 251,931 Proceeds from disposal of property and equipment 1,315 42 2,473 Acquisitions of property and equipment 315,243)( 9,956)( 306,869)( Proceeds from sale of investment property - - 619,590 Proceeds from disposal of foreclosed properties 65,885 2,081 -
Net cash (used in) provided by investing activities 191,576)( 6,050)( 567,125 CASH FLOWS FROM FINANCING ACTIVITIES
(Decrease) increase in borrowed funds 21,576,296 681,436 52,496,698)( Increase in financial bonds payable 6,300,000 198,970 - Payments of cash dividends and bonus 11,165,000)( 352,620)( 10,295,000)( Proceeds from issuance of common stock - - 15,000,000
Net cash provided by (used in) financing activities 16,711,296 527,786 47,791,698)( EFFECT OF EXCHANGE RATE CHANGES 1,423,817 44,968 32,245 NET INCREASE IN CASH AND CASH EQUIVALENTS 95,942,325 3,030,109 91,283,349 CASH AND CASH EQUIVALENTS, BEGINNING OF YEAR 309,025,061 9,759,816 217,741,712 CASH AND CASH EQUIVALENTS, END OF YEAR 404,967,386$ 12,789,925$ 309,025,061$ CASH AND CASH EQUIVALENTS COMPOSITION:
Cash and cash equivalents shown in consolidated balance sheet 164,407,531$ 5,192,418$ 153,233,392$ Due from the central bank and call loans to bank meeting the definition of cash and cash equivalents as stated in IAS No. 7 "Cash Flow Statements" 234,709,523 7,412,738 150,339,780 Securities purchased under resale agreements meeting the definition of cash and cash equivalents as stated in IAS No. 7 "Cash Flow Statements" 5,850,332 184,769 5,451,889
CASH AND CASH EQUIVALENTS, END OF YEAR 404,967,386$ 12,789,925$ 309,025,061$ The accompanying notes are an integral part of these financial statements.
2014For the years ended December 31,
MEGA INTERNATIONAL COMMERCIAL BANK CO., LTD. AND ITS SUBSIDIARIESCONSOLIDATED STATEMENTS OF CASH FLOWS
(EXPRESSED IN THOUSANDS OF DOLLARS)
25 Annual Report 2014
25
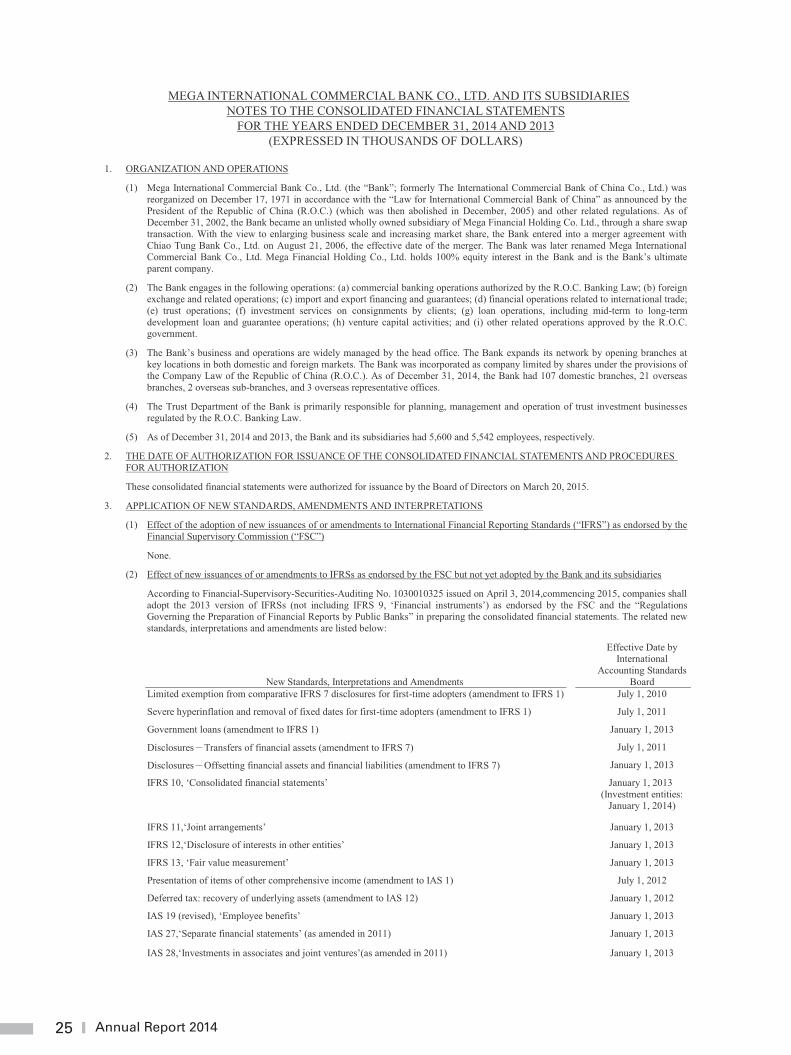
MEGA INTERNATIONAL COMMERCIAL BANK CO., LTD. AND ITS SUBSIDIARIES NOTES TO THE CONSOLIDATED FINANCIAL STATEMENTS
FOR THE YEARS ENDED DECEMBER 31, 2014 AND 2013 (EXPRESSED IN THOUSANDS OF DOLLARS)
1. ORGANIZATION AND OPERATIONS
(1) Mega International Commercial Bank Co., Ltd. (the “Bank”; formerly The International Commercial Bank of China Co., Ltd.) was reorganized on December 17, 1971 in accordance with the “Law for International Commercial Bank of China” as announced by the President of the Republic of China (R.O.C.) (which was then abolished in December, 2005) and other related regulations. As of December 31, 2002, the Bank became an unlisted wholly owned subsidiary of Mega Financial Holding Co. Ltd., through a share swap transaction. With the view to enlarging business scale and increasing market share, the Bank entered into a merger agreement with Chiao Tung Bank Co., Ltd. on August 21, 2006, the effective date of the merger. The Bank was later renamed Mega International Commercial Bank Co., Ltd. Mega Financial Holding Co., Ltd. holds 100% equity interest in the Bank and is the Bank’s ultimate parent company.
(2) The Bank engages in the following operations: (a) commercial banking operations authorized by the R.O.C. Banking Law; (b) foreign exchange and related operations; (c) import and export financing and guarantees; (d) financial operations related to international trade; (e) trust operations; (f) investment services on consignments by clients; (g) loan operations, including mid-term to long-term development loan and guarantee operations; (h) venture capital activities; and (i) other related operations approved by the R.O.C. government.
(3) The Bank’s business and operations are widely managed by the head office. The Bank expands its network by opening branches at key locations in both domestic and foreign markets. The Bank was incorporated as company limited by shares under the provisions of the Company Law of the Republic of China (R.O.C.). As of December 31, 2014, the Bank had 107 domestic branches, 21 overseas branches, 2 overseas sub-branches, and 3 overseas representative offices.
(4) The Trust Department of the Bank is primarily responsible for planning, management and operation of trust investment businesses regulated by the R.O.C. Banking Law.
(5) As of December 31, 2014 and 2013, the Bank and its subsidiaries had 5,600 and 5,542 employees, respectively.
2. THE DATE OF AUTHORIZATION FOR ISSUANCE OF THE CONSOLIDATED FINANCIAL STATEMENTS AND PROCEDURES FOR AUTHORIZATION
These consolidated financial statements were authorized for issuance by the Board of Directors on March 20, 2015.
3. APPLICATION OF NEW STANDARDS, AMENDMENTS AND INTERPRETATIONS
(1) Effect of the adoption of new issuances of or amendments to International Financial Reporting Standards (“IFRS”) as endorsed by the Financial Supervisory Commission (“FSC”)
None.
(2) Effect of new issuances of or amendments to IFRSs as endorsed by the FSC but not yet adopted by the Bank and its subsidiaries
According to Financial-Supervisory-Securities-Auditing No. 1030010325 issued on April 3, 2014,commencing 2015, companies shall adopt the 2013 version of IFRSs (not including IFRS 9, ‘Financial instruments’) as endorsed by the FSC and the “Regulations Governing the Preparation of Financial Reports by Public Banks” in preparing the consolidated financial statements. The related new standards, interpretations and amendments are listed below:
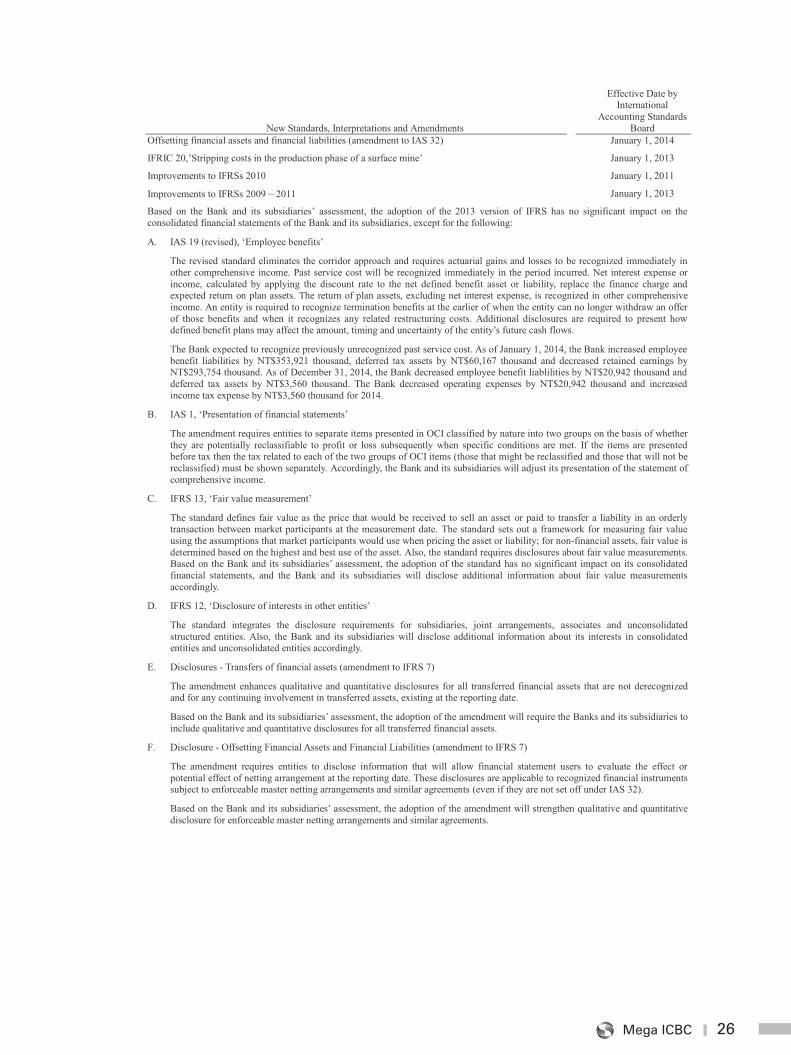
New Standards, Interpretations and Amendments
Effective Date by International
Accounting Standards Board
Limited exemption from comparative IFRS 7 disclosures for first-time adopters (amendment to IFRS 1) July 1, 2010
Severe hyperinflation and removal of fixed dates for first-time adopters (amendment to IFRS 1) July 1, 2011
Government loans (amendment to IFRS 1) January 1, 2013
Disclosures Transfers of financial assets (amendment to IFRS 7) July 1, 2011
Disclosures Offsetting financial assets and financial liabilities (amendment to IFRS 7) January 1, 2013
IFRS 10, ‘Consolidated financial statements’ January 1, 2013 (Investment entities:
January 1, 2014)
IFRS 11,‘Joint arrangements’ January 1, 2013
IFRS 12,‘Disclosure of interests in other entities’ January 1, 2013
IFRS 13, ‘Fair value measurement’ January 1, 2013
Presentation of items of other comprehensive income (amendment to IAS 1) July 1, 2012
Deferred tax: recovery of underlying assets (amendment to IAS 12) January 1, 2012
IAS 19 (revised), ‘Employee benefits’ January 1, 2013
IAS 27,‘Separate financial statements’ (as amended in 2011) January 1, 2013
IAS 28,‘Investments in associates and joint ventures’(as amended in 2011) January 1, 2013
26Mega ICBC
26
New Standards, Interpretations and Amendments
Effective Date by International
Accounting Standards Board
Offsetting financial assets and financial liabilities (amendment to IAS 32) January 1, 2014
IFRIC 20,’Stripping costs in the production phase of a surface mine’ January 1, 2013
Improvements to IFRSs 2010 January 1, 2011
Improvements to IFRSs 2009 2011 January 1, 2013
Based on the Bank and its subsidiaries’ assessment, the adoption of the 2013 version of IFRS has no significant impact on the consolidated financial statements of the Bank and its subsidiaries, except for the following:
A. IAS 19 (revised), ‘Employee benefits’
The revised standard eliminates the corridor approach and requires actuarial gains and losses to be recognized immediately in other comprehensive income. Past service cost will be recognized immediately in the period incurred. Net interest expense or income, calculated by applying the discount rate to the net defined benefit asset or liability, replace the finance charge and expected return on plan assets. The return of plan assets, excluding net interest expense, is recognized in other comprehensive income. An entity is required to recognize termination benefits at the earlier of when the entity can no longer withdraw an offer of those benefits and when it recognizes any related restructuring costs. Additional disclosures are required to present how defined benefit plans may affect the amount, timing and uncertainty of the entity’s future cash flows.
The Bank expected to recognize previously unrecognized past service cost. As of January 1, 2014, the Bank increased employee benefit liabilities by NT$353,921 thousand, deferred tax assets by NT$60,167 thousand and decreased retained earnings by NT$293,754 thousand. As of December 31, 2014, the Bank decreased employee benefit liablilities by NT$20,942 thousand and deferred tax assets by NT$3,560 thousand. The Bank decreased operating expenses by NT$20,942 thousand and increased income tax expense by NT$3,560 thousand for 2014.
B. IAS 1, ‘Presentation of financial statements’
The amendment requires entities to separate items presented in OCI classified by nature into two groups on the basis of whether they are potentially reclassifiable to profit or loss subsequently when specific conditions are met. If the items are presented before tax then the tax related to each of the two groups of OCI items (those that might be reclassified and those that will not be reclassified) must be shown separately. Accordingly, the Bank and its subsidiaries will adjust its presentation of the statement of comprehensive income.
C. IFRS 13, ‘Fair value measurement’
The standard defines fair value as the price that would be received to sell an asset or paid to transfer a liability in an orderly transaction between market participants at the measurement date. The standard sets out a framework for measuring fair value using the assumptions that market participants would use when pricing the asset or liability; for non-financial assets, fair value is determined based on the highest and best use of the asset. Also, the standard requires disclosures about fair value measurements. Based on the Bank and its subsidiaries’ assessment, the adoption of the standard has no significant impact on its consolidated financial statements, and the Bank and its subsidiaries will disclose additional information about fair value measurements accordingly.
D. IFRS 12, ‘Disclosure of interests in other entities’
The standard integrates the disclosure requirements for subsidiaries, joint arrangements, associates and unconsolidated structured entities. Also, the Bank and its subsidiaries will disclose additional information about its interests in consolidated entities and unconsolidated entities accordingly.
E. Disclosures - Transfers of financial assets (amendment to IFRS 7)
The amendment enhances qualitative and quantitative disclosures for all transferred financial assets that are not derecognized and for any continuing involvement in transferred assets, existing at the reporting date.
Based on the Bank and its subsidiaries’ assessment, the adoption of the amendment will require the Banks and its subsidiaries to include qualitative and quantitative disclosures for all transferred financial assets.
F. Disclosure - Offsetting Financial Assets and Financial Liabilities (amendment to IFRS 7)
The amendment requires entities to disclose information that will allow financial statement users to evaluate the effect or potential effect of netting arrangement at the reporting date. These disclosures are applicable to recognized financial instruments subject to enforceable master netting arrangements and similar agreements (even if they are not set off under IAS 32).
Based on the Bank and its subsidiaries’ assessment, the adoption of the amendment will strengthen qualitative and quantitative disclosure for enforceable master netting arrangements and similar agreements.
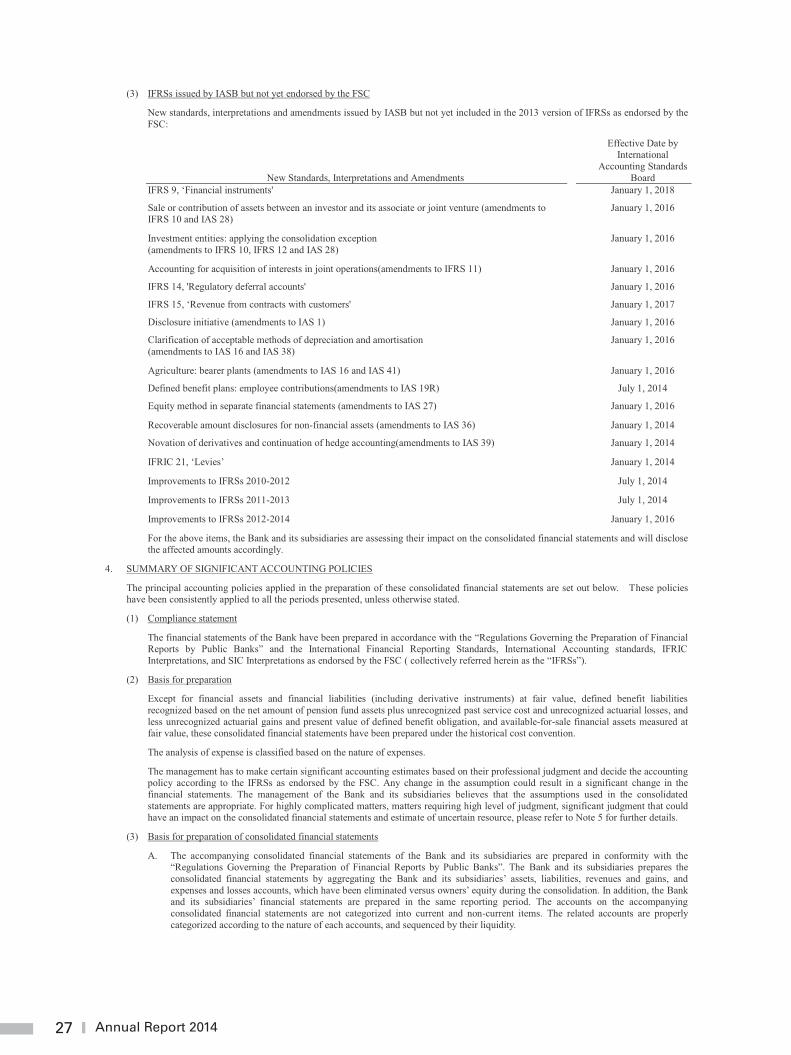
27 Annual Report 2014
27
(3) IFRSs issued by IASB but not yet endorsed by the FSC
New standards, interpretations and amendments issued by IASB but not yet included in the 2013 version of IFRSs as endorsed by the FSC:
New Standards, Interpretations and Amendments
Effective Date by International
Accounting Standards Board
IFRS 9, ‘Financial instruments' January 1, 2018
Sale or contribution of assets between an investor and its associate or joint venture (amendments to IFRS 10 and IAS 28)
January 1, 2016
Investment entities: applying the consolidation exception (amendments to IFRS 10, IFRS 12 and IAS 28)
January 1, 2016
Accounting for acquisition of interests in joint operations(amendments to IFRS 11) January 1, 2016
IFRS 14, 'Regulatory deferral accounts' January 1, 2016
IFRS 15, ‘Revenue from contracts with customers' January 1, 2017
Disclosure initiative (amendments to IAS 1) January 1, 2016
Clarification of acceptable methods of depreciation and amortisation (amendments to IAS 16 and IAS 38)
January 1, 2016
Agriculture: bearer plants (amendments to IAS 16 and IAS 41) January 1, 2016
Defined benefit plans: employee contributions(amendments to IAS 19R) July 1, 2014
Equity method in separate financial statements (amendments to IAS 27) January 1, 2016
Recoverable amount disclosures for non-financial assets (amendments to IAS 36) January 1, 2014
Novation of derivatives and continuation of hedge accounting(amendments to IAS 39) January 1, 2014
IFRIC 21, ‘Levies’ January 1, 2014
Improvements to IFRSs 2010-2012 July 1, 2014
Improvements to IFRSs 2011-2013 July 1, 2014
Improvements to IFRSs 2012-2014 January 1, 2016
For the above items, the Bank and its subsidiaries are assessing their impact on the consolidated financial statements and will disclose the affected amounts accordingly.
4. SUMMARY OF SIGNIFICANT ACCOUNTING POLICIES
The principal accounting policies applied in the preparation of these consolidated financial statements are set out below. These policies have been consistently applied to all the periods presented, unless otherwise stated.
(1) Compliance statement
The financial statements of the Bank have been prepared in accordance with the “Regulations Governing the Preparation of Financial Reports by Public Banks” and the International Financial Reporting Standards, International Accounting standards, IFRIC Interpretations, and SIC Interpretations as endorsed by the FSC ( collectively referred herein as the “IFRSs”).
(2) Basis for preparation
Except for financial assets and financial liabilities (including derivative instruments) at fair value, defined benefit liabilities recognized based on the net amount of pension fund assets plus unrecognized past service cost and unrecognized actuarial losses, and less unrecognized actuarial gains and present value of defined benefit obligation, and available-for-sale financial assets measured at fair value, these consolidated financial statements have been prepared under the historical cost convention.
The analysis of expense is classified based on the nature of expenses.
The management has to make certain significant accounting estimates based on their professional judgment and decide the accounting policy according to the IFRSs as endorsed by the FSC. Any change in the assumption could result in a significant change in the financial statements. The management of the Bank and its subsidiaries believes that the assumptions used in the consolidated statements are appropriate. For highly complicated matters, matters requiring high level of judgment, significant judgment that could have an impact on the consolidated financial statements and estimate of uncertain resource, please refer to Note 5 for further details.
(3) Basis for preparation of consolidated financial statements
A. The accompanying consolidated financial statements of the Bank and its subsidiaries are prepared in conformity with the “Regulations Governing the Preparation of Financial Reports by Public Banks”. The Bank and its subsidiaries prepares the consolidated financial statements by aggregating the Bank and its subsidiaries’ assets, liabilities, revenues and gains, and expenses and losses accounts, which have been eliminated versus owners’ equity during the consolidation. In addition, the Bank and its subsidiaries’ financial statements are prepared in the same reporting period. The accounts on the accompanying consolidated financial statements are not categorized into current and non-current items. The related accounts are properly categorized according to the nature of each accounts, and sequenced by their liquidity.
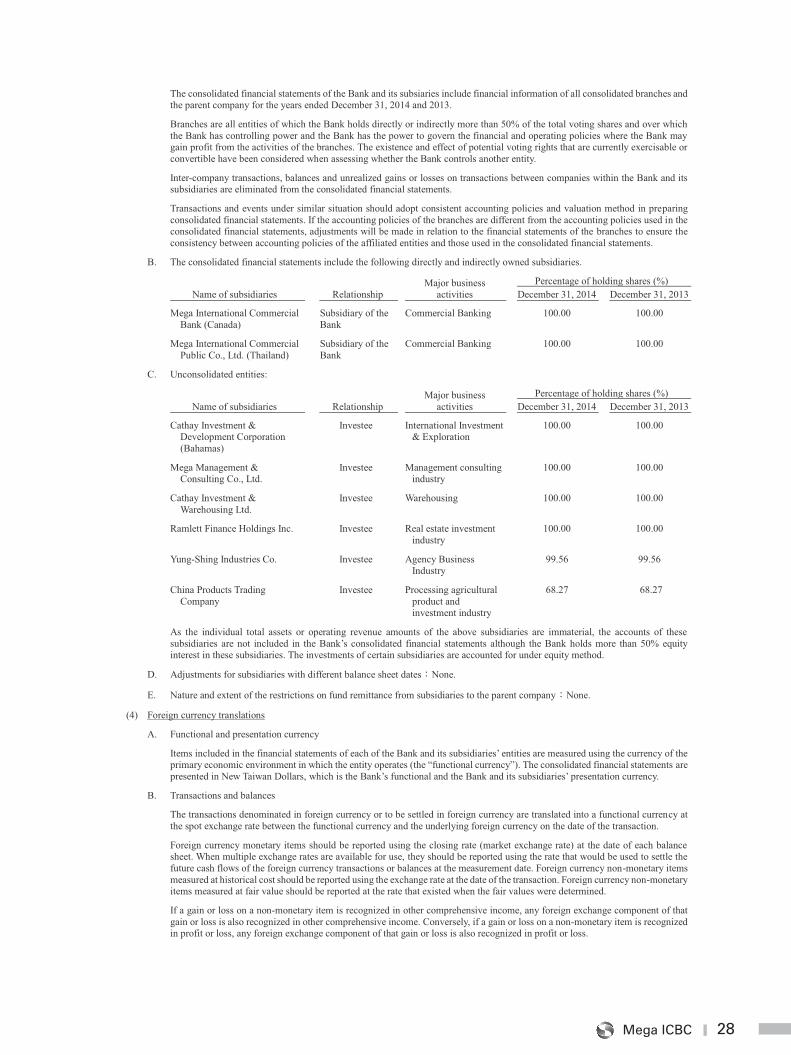
28Mega ICBC
27
(3) IFRSs issued by IASB but not yet endorsed by the FSC
New standards, interpretations and amendments issued by IASB but not yet included in the 2013 version of IFRSs as endorsed by the FSC:
New Standards, Interpretations and Amendments
Effective Date by International
Accounting Standards Board
IFRS 9, ‘Financial instruments' January 1, 2018
Sale or contribution of assets between an investor and its associate or joint venture (amendments to IFRS 10 and IAS 28)
January 1, 2016
Investment entities: applying the consolidation exception (amendments to IFRS 10, IFRS 12 and IAS 28)
January 1, 2016
Accounting for acquisition of interests in joint operations(amendments to IFRS 11) January 1, 2016
IFRS 14, 'Regulatory deferral accounts' January 1, 2016
IFRS 15, ‘Revenue from contracts with customers' January 1, 2017
Disclosure initiative (amendments to IAS 1) January 1, 2016
Clarification of acceptable methods of depreciation and amortisation (amendments to IAS 16 and IAS 38)
January 1, 2016
Agriculture: bearer plants (amendments to IAS 16 and IAS 41) January 1, 2016
Defined benefit plans: employee contributions(amendments to IAS 19R) July 1, 2014
Equity method in separate financial statements (amendments to IAS 27) January 1, 2016
Recoverable amount disclosures for non-financial assets (amendments to IAS 36) January 1, 2014
Novation of derivatives and continuation of hedge accounting(amendments to IAS 39) January 1, 2014
IFRIC 21, ‘Levies’ January 1, 2014
Improvements to IFRSs 2010-2012 July 1, 2014
Improvements to IFRSs 2011-2013 July 1, 2014
Improvements to IFRSs 2012-2014 January 1, 2016
For the above items, the Bank and its subsidiaries are assessing their impact on the consolidated financial statements and will disclose the affected amounts accordingly.
4. SUMMARY OF SIGNIFICANT ACCOUNTING POLICIES
The principal accounting policies applied in the preparation of these consolidated financial statements are set out below. These policies have been consistently applied to all the periods presented, unless otherwise stated.
(1) Compliance statement
The financial statements of the Bank have been prepared in accordance with the “Regulations Governing the Preparation of Financial Reports by Public Banks” and the International Financial Reporting Standards, International Accounting standards, IFRIC Interpretations, and SIC Interpretations as endorsed by the FSC ( collectively referred herein as the “IFRSs”).
(2) Basis for preparation
Except for financial assets and financial liabilities (including derivative instruments) at fair value, defined benefit liabilities recognized based on the net amount of pension fund assets plus unrecognized past service cost and unrecognized actuarial losses, and less unrecognized actuarial gains and present value of defined benefit obligation, and available-for-sale financial assets measured at fair value, these consolidated financial statements have been prepared under the historical cost convention.
The analysis of expense is classified based on the nature of expenses.
The management has to make certain significant accounting estimates based on their professional judgment and decide the accounting policy according to the IFRSs as endorsed by the FSC. Any change in the assumption could result in a significant change in the financial statements. The management of the Bank and its subsidiaries believes that the assumptions used in the consolidated statements are appropriate. For highly complicated matters, matters requiring high level of judgment, significant judgment that could have an impact on the consolidated financial statements and estimate of uncertain resource, please refer to Note 5 for further details.
(3) Basis for preparation of consolidated financial statements
A. The accompanying consolidated financial statements of the Bank and its subsidiaries are prepared in conformity with the “Regulations Governing the Preparation of Financial Reports by Public Banks”. The Bank and its subsidiaries prepares the consolidated financial statements by aggregating the Bank and its subsidiaries’ assets, liabilities, revenues and gains, and expenses and losses accounts, which have been eliminated versus owners’ equity during the consolidation. In addition, the Bank and its subsidiaries’ financial statements are prepared in the same reporting period. The accounts on the accompanying consolidated financial statements are not categorized into current and non-current items. The related accounts are properly categorized according to the nature of each accounts, and sequenced by their liquidity.
28
The consolidated financial statements of the Bank and its subsiaries include financial information of all consolidated branches and the parent company for the years ended December 31, 2014 and 2013.
Branches are all entities of which the Bank holds directly or indirectly more than 50% of the total voting shares and over which the Bank has controlling power and the Bank has the power to govern the financial and operating policies where the Bank may gain profit from the activities of the branches. The existence and effect of potential voting rights that are currently exercisable or convertible have been considered when assessing whether the Bank controls another entity.
Inter-company transactions, balances and unrealized gains or losses on transactions between companies within the Bank and its subsidiaries are eliminated from the consolidated financial statements.
Transactions and events under similar situation should adopt consistent accounting policies and valuation method in preparing consolidated financial statements. If the accounting policies of the branches are different from the accounting policies used in the consolidated financial statements, adjustments will be made in relation to the financial statements of the branches to ensure the consistency between accounting policies of the affiliated entities and those used in the consolidated financial statements.
B. The consolidated financial statements include the following directly and indirectly owned subsidiaries.
Name of subsidiaries
Relationship Major business
activities Percentage of holding shares (%)
December 31, 2014 December 31, 2013
Mega International Commercial Bank (Canada)
Subsidiary of the Bank
Commercial Banking 100.00 100.00
Mega International Commercial Public Co., Ltd. (Thailand)
Subsidiary of the Bank
Commercial Banking 100.00 100.00
C. Unconsolidated entities:
Name of subsidiaries
Relationship Major business
activities Percentage of holding shares (%)
December 31, 2014 December 31, 2013
Cathay Investment & Development Corporation (Bahamas)
Investee International Investment & Exploration
100.00 100.00
Mega Management & Consulting Co., Ltd.
Investee Management consulting industry
100.00 100.00
Cathay Investment & Warehousing Ltd.
Investee Warehousing 100.00 100.00
Ramlett Finance Holdings Inc. Investee Real estate investment industry
100.00 100.00
Yung-Shing Industries Co. Investee Agency Business Industry
99.56 99.56
China Products Trading Company
Investee Processing agricultural product and investment industry
68.27 68.27
As the individual total assets or operating revenue amounts of the above subsidiaries are immaterial, the accounts of these subsidiaries are not included in the Bank’s consolidated financial statements although the Bank holds more than 50% equity interest in these subsidiaries. The investments of certain subsidiaries are accounted for under equity method.
D. Adjustments for subsidiaries with different balance sheet dates None.
E. Nature and extent of the restrictions on fund remittance from subsidiaries to the parent company None.
(4) Foreign currency translations
A. Functional and presentation currency
Items included in the financial statements of each of the Bank and its subsidiaries’ entities are measured using the currency of the primary economic environment in which the entity operates (the “functional currency”). The consolidated financial statements are presented in New Taiwan Dollars, which is the Bank’s functional and the Bank and its subsidiaries’ presentation currency.
B. Transactions and balances
The transactions denominated in foreign currency or to be settled in foreign currency are translated into a functional currency at the spot exchange rate between the functional currency and the underlying foreign currency on the date of the transaction.
Foreign currency monetary items should be reported using the closing rate (market exchange rate) at the date of each balance sheet. When multiple exchange rates are available for use, they should be reported using the rate that would be used to settle the future cash flows of the foreign currency transactions or balances at the measurement date. Foreign currency non-monetary items measured at historical cost should be reported using the exchange rate at the date of the transaction. Foreign currency non-monetary items measured at fair value should be reported at the rate that existed when the fair values were determined.
If a gain or loss on a non-monetary item is recognized in other comprehensive income, any foreign exchange component of that gain or loss is also recognized in other comprehensive income. Conversely, if a gain or loss on a non-monetary item is recognized in profit or loss, any foreign exchange component of that gain or loss is also recognized in profit or loss.
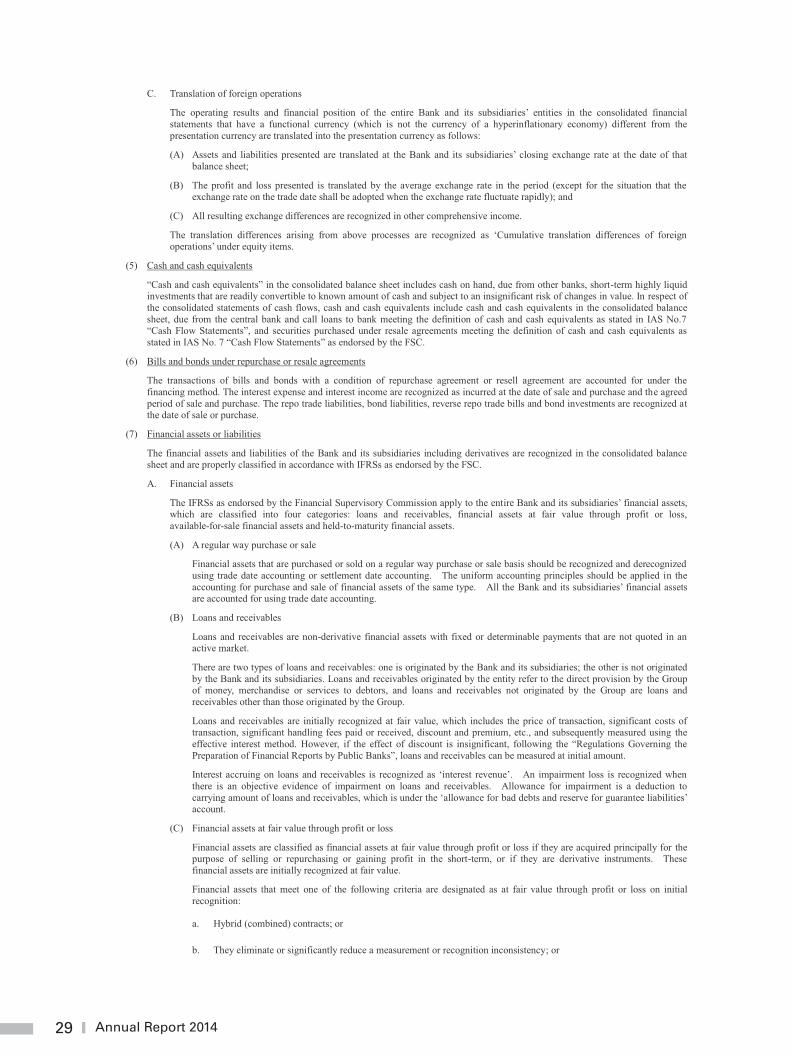
29 Annual Report 2014
29
C. Translation of foreign operations
The operating results and financial position of the entire Bank and its subsidiaries’ entities in the consolidated financial statements that have a functional currency (which is not the currency of a hyperinflationary economy) different from the presentation currency are translated into the presentation currency as follows:
(A) Assets and liabilities presented are translated at the Bank and its subsidiaries’ closing exchange rate at the date of that balance sheet;
(B) The profit and loss presented is translated by the average exchange rate in the period (except for the situation that the exchange rate on the trade date shall be adopted when the exchange rate fluctuate rapidly); and
(C) All resulting exchange differences are recognized in other comprehensive income.
The translation differences arising from above processes are recognized as ‘Cumulative translation differences of foreign operations’ under equity items.
(5) Cash and cash equivalents
“Cash and cash equivalents” in the consolidated balance sheet includes cash on hand, due from other banks, short-term highly liquid investments that are readily convertible to known amount of cash and subject to an insignificant risk of changes in value. In respect of the consolidated statements of cash flows, cash and cash equivalents include cash and cash equivalents in the consolidated balance sheet, due from the central bank and call loans to bank meeting the definition of cash and cash equivalents as stated in IAS No.7 “Cash Flow Statements”, and securities purchased under resale agreements meeting the definition of cash and cash equivalents as stated in IAS No. 7 “Cash Flow Statements” as endorsed by the FSC.
(6) Bills and bonds under repurchase or resale agreements
The transactions of bills and bonds with a condition of repurchase agreement or resell agreement are accounted for under the financing method. The interest expense and interest income are recognized as incurred at the date of sale and purchase and the agreed period of sale and purchase. The repo trade liabilities, bond liabilities, reverse repo trade bills and bond investments are recognized at the date of sale or purchase.
(7) Financial assets or liabilities
The financial assets and liabilities of the Bank and its subsidiaries including derivatives are recognized in the consolidated balance sheet and are properly classified in accordance with IFRSs as endorsed by the FSC.
A. Financial assets
The IFRSs as endorsed by the Financial Supervisory Commission apply to the entire Bank and its subsidiaries’ financial assets, which are classified into four categories: loans and receivables, financial assets at fair value through profit or loss, available-for-sale financial assets and held-to-maturity financial assets.
(A) A regular way purchase or sale
Financial assets that are purchased or sold on a regular way purchase or sale basis should be recognized and derecognized using trade date accounting or settlement date accounting. The uniform accounting principles should be applied in the accounting for purchase and sale of financial assets of the same type. All the Bank and its subsidiaries’ financial assets are accounted for using trade date accounting.
(B) Loans and receivables
Loans and receivables are non-derivative financial assets with fixed or determinable payments that are not quoted in an active market.
There are two types of loans and receivables: one is originated by the Bank and its subsidiaries; the other is not originated by the Bank and its subsidiaries. Loans and receivables originated by the entity refer to the direct provision by the Group of money, merchandise or services to debtors, and loans and receivables not originated by the Group are loans and receivables other than those originated by the Group.
Loans and receivables are initially recognized at fair value, which includes the price of transaction, significant costs of transaction, significant handling fees paid or received, discount and premium, etc., and subsequently measured using the effective interest method. However, if the effect of discount is insignificant, following the “Regulations Governing the Preparation of Financial Reports by Public Banks”, loans and receivables can be measured at initial amount.
Interest accruing on loans and receivables is recognized as ‘interest revenue’. An impairment loss is recognized when there is an objective evidence of impairment on loans and receivables. Allowance for impairment is a deduction to carrying amount of loans and receivables, which is under the ‘allowance for bad debts and reserve for guarantee liabilities’ account.
(C) Financial assets at fair value through profit or loss
Financial assets are classified as financial assets at fair value through profit or loss if they are acquired principally for the purpose of selling or repurchasing or gaining profit in the short-term, or if they are derivative instruments. These financial assets are initially recognized at fair value.
Financial assets that meet one of the following criteria are designated as at fair value through profit or loss on initial recognition:
a. Hybrid (combined) contracts; or
b. They eliminate or significantly reduce a measurement or recognition inconsistency; or
30Mega ICBC
30
c. They are managed and their performance is evaluated on a fair value basis, in accordance with a documented risk management or investment strategy.
Any changes in fair value of financial assets at fair value through profit or loss and financial assets designated as at fair value through profit or loss on initial recognition are recognized under the ‘gain/loss on financial assets and liabilities at fair value through profit or loss’ account in the consolidated statement of comprehensive income.
(D) Held-to-maturity financial assets
Held-to-maturity financial assets are non-derivative financial assets with fixed or determinable payments and fixed maturity date that the Bank and its subsidiaries have the positive intention and ability to hold to maturity other than those that meet the definition of loans and receivables, designated as available-for-sale financial assets and those that are designated as at fair value through profit or loss on initial recognition by subsidiaries.
Interest accruing on held-to-maturity financial assets is recognized as ‘interest revenue’. An impairment loss is recognized when there is an objective evidence of impairment on financial assets. Impairment loss is a deduction to carrying amount of financial assets, which is recognized under the ‘impairment loss on financial assets’ account.
(E) Available-for-sale financial assets
Available-for-sale financial assets are non-derivatives that are not classified in held-to-maturity financial assets, financial assets at fair value through profit or loss and loans and receivables. Financial assets and liabilities that are attributed to equity and debt investments on initial recognition are assessed at fair value. Transaction costs which are attributable to the acquisition should be capitalized.
Available-for-sale financial assets are measured at fair value with changes in fair value recognized in other comprehensive income. When the financial asset is no longer recognized, the cumulative unrealized gain or loss that was previously recognized in other comprehensive income is recognized in profit or loss.
An impairment loss is recognized when there is an objective evidence of impairment. If financial assets have not been derecognized, accumulated impairment loss related to the financial assets that was previously recognized in other comprehensive income shall be reclassified to profit or loss. Impairment loss of an investment in an equity instrument recognized in profit or loss shall not be reversed through profit or loss. Any subsequent increases in fair value of an investment in an equity instrument are recognized in other comprehensive income. If the impairment loss of bond investments decreases with objective evidence indicating that an impairment loss has been incurred after the impairment is recognized, the impairment amount is reversed and recognized in current profit and loss.
Equity instruments with no quoted price in an active market are initially recognized at fair value plus acquisition or issuance cost. The fair value can be reasonably estimated when the following criteria are met at the balance sheet date: (a) the variability in the range of reasonable fair value estimate is not significant for that equity instrument; or (b) probabilities of the various estimates within the range can be reasonably assessed and used in estimating fair value.
(F) Other financial assets
Other financial assets include investments in debt instruments without active market, overdue receivables not from lending, bill of exchange negotiated and financial assets measured at cost.
a. Debt investments with no active market
Investments in debt instruments without active market are initially recognized at fair value on the trade date plus transaction costs of acquisition or issuance. Disposal gain or loss is recognized when such investments are derecognized. Bond investments without active market are measured at amortized cost using the effective interest method.
b. Financial assets carried at cost
Investments in equity instruments that do not have a quoted market price in an active market and whose fair value cannot be reliably measured or derivatives that are linked to and must be settled by delivery of such unquoted equity instruments are presented in ‘financial assets measured at cost’.
B. Financial liabilities
Financial liabilities held by the Bank and its subsidiaries comprise financial liabilities at fair value through profit or loss (including financial liabilities designated as at fair value through profit or loss on initial recognition) and financial liabilities measured at amortized cost.
(A) Financial liabilities at fair value through profit or loss
This category includes financial liabilities held for trading or financial liabilities designated as at fair value through profit or loss on initial recognition.
A financial liability shall be classified as held for trading, if it is incurred principally for the purpose of repurchasing it in the near term; or on initial recognition, is part of a portfolio of identified financial instruments that are managed together and for which there is evidence of a recent actual pattern of short-term profit-taking. A derivative is also classified as held for trading, except for a derivative that is a financial guarantee contract or a designated and effective hedging instrument. Financial liability held for trading also includes the obligations of delivery of financial assets borrowed by the seller. Above financial liability is shown as “financial liability at fair value through profit or loss” in the consolidated balance sheet.
31 Annual Report 2014
31
At initial recognition, it is not revocable if a debt instrument is designated at fair value through profit and loss. When the fair value method is adopted, the main contract and the embedded derivative need not be recognized respectively.
Any changes in fair value of financial liabilities at fair value through profit or loss and financial liabilities designated as at fair value through profit or loss on initial recognition are recognized under the ‘gain/loss on financial assets and liabilities at fair value through profit or loss’ account in the consolidated statement of comprehensive income.
(B) Financial liabilities measured at amortized cost
All other financial liabilities that are not classified as financial liabilities at fair value through profit or loss are classified as financial liabilities measured at amortized cost.
C. Determination of fair value
Fair value and level information of financial instruments are provided in Note 7.
D. Derecognition of financial instruments
The Bank and its subsidiaries derecognizes a financial asset when one of the following conditions is met:
(A) The contractual rights to receive cash flows from the financial asset expires.
(B) The contractual rights to receive cash flows from the financial asset have been transferred and the Bank and its subsidiaries has transferred substantially all risks and rewards of ownership of the financial asset.
(C) The contractual rights to receive cash flows from the financial asset have been transferred; however, it has not retained control of the financial asset.
A financial liability is derecognized when the obligation under the liability specified in the contract is discharged or cancelled or expires.
In case of securities lending or borrowing by the Bank and its subsidiaries or provision of bonds or stocks as security for repo trading, the Bank and its subsidiaries does not derecognize the financial asset, because substantially all risks and rewards of ownership of the financial asset are still retained in the Bank and its subsidiaries.
(8) Offsetting financial instruments
Financial assets and liabilities are offset and reported in the net amount in the balance sheet when (A) there is a legally enforceable right to offset the recognized amounts and (B) there is an intention to settle on a net basis or realize the asset and settle the liability simultaneously.
(9) Financial asset-evaluation, provision and reversal of impairment losses
A. The Bank and its subsidiaries would presume that a financial asset or a group of financial assets is impaired and recognize the impairment losses only if there is objective evidence that a financial asset or a group of financial assets is impaired as a result of a loss event that occurred after the initial recognition of the asset and that loss event has an impact on the estimated future cash flows of the financial asset or group of financial assets.
B. The criteria that the Bank and its subsidiaries use to determine whether there is objective evidence of an impairment loss is as follows:
(A) Significant financial difficulty of the issuer or debtor;
(B) A breach of contract, such as a default or delinquency in interest or principal payments;
(C) The Bank and its subsidiaries, for economic or legal reasons relating to the borrower’s financial difficulty, granted the borrower a concession that a lender would not otherwise consider;
(D) It becomes probable that the borrower will enter bankruptcy or other financial reorganization;
(E) The disappearance of an active market for that financial asset because of financial difficulties;
(F) Observable data indicating that there is a measurable decrease in the estimated future cash flows from a group of financial assets since the initial recognition of those assets, although the decrease cannot yet be identified with the individual financial asset in the group, including adverse changes in the payment status of borrowers in the group or national or local economic conditions that correlate with defaults on the assets in the group;
(G) Information about significant changes with an adverse effect that have taken place in the technology, market, economic or legal environment in which the issuer operates, and indicates that the cost of the investment in the equity instrument may not be recovered; or
(H) A significant or prolonged decline in the fair value of an investment in an equity instrument below its cost.
(I) Others are implemented in accordance with the bank and its subsidiaries’ internal policies.
C. The assessment methods of impairment on loans and receivables are based on two categories: individual and collective assessments. Individual assessments are classified as different groups based on whether there is objective evidence of significant impairment of the asset or whether the individual asset has to be specially supervised. If no objective evidence of impairment exists for an individually assessed financial asset, the asset will be classified into a group of financial assets with similar credit risk characteristics for collective assessments.
D. After assessed impairment of loans and receivables, the Bank and its subsidiaries recognizes’ impairment loss measured as the difference between the asset’s carrying amount and the present value of estimated future cash flows of credit enhancement factors discounted at the asset’s original effective interest rate. The credit enhancement factors include financial guarantee and net of collateral. If, in a subsequent period, the amount of the impairment loss decreased and such decrease is objectively related to an event occurred after the impairment was recognized, the amount of impairment loss recognized previously shall be
32Mega ICBC
32
reversed by adjusting the allowance for doubtful debts. The reversal shall not cause a carrying amount of the financial asset that exceeds the amortized cost of the period before recognition of the impairment loss. The amount of reversal shall be recognized in profit or loss.
E. Above-mentioned assessments on loans and receivables are performed in accordance with “Regulations Governing the Procedures for Banking Institutions to Evaluate Assets and Deal with Non-performing/Non-accrual Loans” as issued by the FSC.
(10) Derivatives
Derivatives are initially recognized at fair value at the contract date and subsequently measured by fair value. The fair value includes the public quotation in an active market or the latest trade price (e.g., Exchange-traded options), and evaluation techniques such as cash flow discounting model or option pricing model (e.g., Swap contract and foreign exchange contracts). All derivatives are recognized as assets when the fair value is positive and as liabilities when the fair value is negative.
Hybrid contract refers to financial instruments of the embedded derivatives. Economic characteristics and risks of the embedded derivatives and the economic characteristics of the main contract should be examined for the embedded derivatives. If the two are not closely correlated and the main contract is not a financial asset or liability at fair value through profit and loss, the main contract and embedded derivatives should be respectively recognized unless the overall hybrid contract is designated as assets or liabilities at fair value through profit and loss. The embedded derivatives are the financial assets or liabilities at fair value through profit and loss.
(11) Investments accounted for under the equity method
The Bank and its subsidiaries’ investments accounted for under the equity method refer to the investments in associates.
Associates are all entities over which the Bank and its subsidiaries have significant influence but not control. In general, it is presumed that the investor has significant influence, if an investor holds, directly or indirectly 20 percent or more of the voting power of the investee. Investments in associates are accounted for using the equity method and are initially recognized at cost.
The Bank and its subsidiaries’ share of its associates’ post-acquisition profits or losses is recognized or loss, and its share of post-acquisition movements in other comprehensive income is recognized in other comprehensive income. When the Bank and its subsidiaries’ share of losses in an associate equals or exceeds its interest in the associate, including any other unsecured receivables, the Bank and its subsidiaries do not recognize further losses, unless it has incurred legal or constructive obligations or made payments on behalf of the associate.
Unrealised gains on transactions between the Bank and its subsidiaries and its associates are eliminated to the extent of the Bank and its subsidiaries’ interest in the associates. Unrealised losses are also eliminated unless the transaction provides evidence of an impairment of the asset transferred. Accounting policies of associates have been adjusted where necessary to ensure consistency with the policies adopted by the Bank and its subsidiaries.
When changes in an associate’s enity that are not recognized in profit or loss or other comprehensive income of the associates and such changes not affecting the Bank and its subsidiaries’ ownership percentage of the associate, the Bank and its Subsidiaries recognized the Bank and its subsidiaries’ share of change in equity of the associate in ‘capital’ in proportion to its ownership.
(12) Property and equipment
The property and equipment of the Bank and its subsidiaries are recognized on the basis of the historical cost less accumulated depreciation. Historical cost includes all costs directly attributable to the acquisition of the assets.
Such assets are subsequently measured using the cost model. Subsequent costs are included in the asset’s carrying amount or recognized as a separate asset, as appropriate, only when it is probable that future economic benefits associated with the item will flow to the Bank and its subsidiaries and the cost of the item can be measured reliably. The carrying amount of the replaced part is derecognized. All other repairs and maintenance are charged to profit or loss during the financial period in which they are incurred.
Land is not affected by depreciation. Depreciation for other assets is provided on a straight-line basis over the estimated useful lives of the assets till residual value, If each part of an item of property and equipment with a cost that is significant in relation to the total cost of the item must be depreciated separately.
The assets’ residual values, useful lives and depreciation methods are reviewed, and adjusted if appropriate, at each balance sheet date. If expectations for the assets’ residual values and useful lives differ from previous estimates or the patterns of consumption of the assets’ future economic benefits embodied in the assets have changed significantly, any change is accounted for as a change in estimate under IAS 8, ‘Accounting Policies, Changes in Accounting Estimates and Errors’, from the date of the change. The estimated useful lives of property, plant and equipment are as follows:
Item Year
Buildings and accessory equipment 1~60
Machinery and computer equipment 1~20
Transportation equipment 1~10
Other equipment 3~10
(13) Investment property
The properties held by the Bank and its subsidiaries, with an intention to obtain long-term rental profit or capital increase or both and not being used by any other enterprises of the consolidated entities, are classified as investment property. Investment property includes the office building and land leased out in a form of operating lease.
33 Annual Report 2014
33
Part of the property may be held by the Bank and its subsidiaries and the remaining will be used to generate rental income or capital appreciation. If the property held by the Bank and its subsidiaries can be sold individually, then the accounting treatment should be made respectively.
When the future economic benefit related to the investment property is highly likely to flow into the Bank and its subsidiaries and the costs can be reliably measured, the investment property shall be recognized as assets. When the future economic benefit generated from subsequent costs is highly likely to flow into the entity and the costs can be reliably measured, the subsequent expenses of the assets shall be capitalized. All maintenance cost are recognized as incurred in the consolidated statement of comprehensive income.
An investment property is stated initially at its cost and measured subsequently using the cost model. The depreciation method, remaining useful life and residual value should apply the same rules as applicable for property and equipment.
(14) Foreclosed properties
Foreclosed properties are stated at the lower of carrying amount or fair value less selling cost on the financial reporting date.
(15) Impairment of non-financial assets
The Bank and its subsidiaries assess at each balance sheet date the recoverable amounts of those assets where there is an indication that they are impaired. An impairment loss is recognized for the amount by which the asset’s carrying amount exceeds its recoverable amount. The recoverable amount is the higher of an asset’s fair value less costs to sell or value in use. When the circumstances or reasons for recognizing impairment loss for an asset in prior years no longer exist or diminish, the impairment loss shall be reversed. The increased carrying amount due to reversal should not be more than what the depreciated or amortized historical cost would have been if the impairment had not been recognized.
(16) Provisions for liabilities, contingent liabilities and contingent assets
When all the following criteria are met, the Bank and its subsidiaries shall recognize a provision:
A. A present obligation (legal or constructive) as a result of a past event;
B. It is probable that an outflow of resources embodying economic benefits will be required to settle the obligation; and
C. The amount of the obligation can be reliably estimated.
If there are several similar obligations, the outflow of economic benefit as a result of settlement is determined based on the overall obligation. Provisions for liabilities should be recognized when the outflow of economic benefits is probable in order to settle the obligation as a whole even if the outflow of economic benefits from any one of the obligation is remote.
Provisions are measured by the present value of expense which is required for settling the anticipated obligation. The pre-tax discount rate is used with timely adjustment that reflects the current market assessments on the time value of money and the risks specific to the obligation.
Contingent liability is a possible obligation that arises from past event, whose existence will be confirmed only by the occurrence or non-occurrence of one or more uncertain future events not wholly within the control of the Bank and its subsidiaries. Or it could be a present obligation as a result of past event but the payment is not probable or the amount cannot be measured reliably. The Bank and its subsidiaries did not recognize any contingent liabilities but made appropriate disclosure in compliance with relevant regulations.
Contingent asset is a possible asset that arises from past event, whose existence will be confirmed only by the occurrence or non-occurrence of one or more uncertain future events not wholly within the control of the Bank and its subsidiaries. The Bank and its subsidiaries did not recognize any contingent assets and made appropriate disclosure in compliance with relevant regulations when the economic inflow is probable.
(17) Financial guarantee contracts
A financial guarantee contract is a contract that requires the Bank and its subsidiaries to make specified payments to reimburse the holder for a loss it incurs because a specified debtor fails to make payment when due in accordance with the original or modified terms of a debt instrument.
The Bank and its subsidiaries initially recognize financial guarantee contracts at fair value on the date of issuance. The Bank and its subsidiaries charge a service fee when the contract is signed and therefore the service fee income charged is the fair value at the date that the financial guarantee contract is signed. Service fee received in advance is recognized in deferred accounts and amortized through straight-line method during the contract term.
Subsequently, the Bank and its subsidiaries should measure the financial guarantee contract issued at the higher of:
A. The amount determined in accordance with IAS 37; and
B. The amount initially recognized less, when appropriate, cumulative amortization recognized in accordance with IAS 18, “Revenue”.
The best estimate of the liability amount of a financial guarantee contract requires management to exercise their judgment combined with historical loss data based on the similar transaction experiences.
The increase in liabilities due to financial guarantee contract is recognized in “bad debt expense and reserve for guarantee liabilities”.
Assessment of above guarantee reserve is in accordance with “Regulations Governing the Procedures for Banking Institutions to Evaluate Assets and Deal with Non-performing/ Non-accrual Loans” announced by the FSC.
34Mega ICBC
34
(18) Employee benefits
A. Short-term employee benefits
The Bank and its subsidiaries should recognize the undiscounted amount of the short-term benefits expected to be paid in the future as expenses in the period when the employees render service.
B. Employee preferential savings
The Bank provides preferential interest rate for employees, including flat preferential savings for current employees and flat preferential savings for retired employees and current employees. The difference gap compared to market interest rate is deemed as employee benefits.
According to Regulation Governing the Preparation of Financial Statements by Public Banks, the preferential monthly interest paid to current employees is calculated based on accrual basis, and the difference between the preferential interest rate and the market interest rate is recognized under “employee benefit expense”. According to Article 28 of “Regulation Governing the Preparation of Financial Statements by Public Banks”, the excessive interest arising from the interest rate upon retirement agreed with the employees in excess of general market interest rate should be recognized in accordance with IAS 19, “Employee Benefits”, as endorsed by the FSC. However, various parameters should be in compliance with competent authorities if indicated otherwise.
C. Termination benefits
Termination benefit is paid to the employees who are eligible for retirement and terminated or voluntarily dismissed in exchange for termination benefit. The Bank and its subsidiaries have made commitments in the formal detailed employment termination plan which is irrevocable, and shall recognize liabilities when providing termination benefit to employees who voluntarily resign as a result of encouragement. Termination benefits paid 12 months after the financial reporting date should be discounted.
D. Post employment benefit
The pension plan of the Bank and its subsidiaries includes both Defined Benefit Plan and Defined Contribution Plan. In addition, defined contribution plan is adopted for employees working overseas according to the local regulations.
(A) Defined Contribution Plan
The contributions are recognized as pension expenses when they are due on an accrual basis. Prepaid contributions are recognized as an asset to the extent of a cash refund or a reduction in the future payments.
(B) Defined Benefit Plan
a. Net obligation under a defined benefit plan is defined as the present value of an amount of pension benefits that employees will receive on retirement for their services with the Bank and its subsidiaries in current period or prior periods. The liability recognized in the balance sheet in respect of defined benefit pension plans is the present value of the defined benefit obligation at the balance sheet date less the fair value of plan assets, together with adjustments for unrecognized past service costs. The defined benefit net obligation is calculated annually by independent actuaries using the projected unit credit method. The rate used to discount is determined by using interest rates of high-quality corporate bonds that are denominated in the currency in which the benefits will be paid, and that have terms to maturity approximating to the terms of the related pension liability; when there is no deep market in high-quality corporate bonds, the Bank and its subsidiaries uses interest rates of government bonds (at the balance sheet date) instead.
b. Actuarial gains and losses arising on defined benefit plans are recognized in other comprehensive income in the period in which they arise.
c. Past service costs are recognized immediately in profit or loss if vested immediately; if not, the past service costs are amortized on a straight-line basis over the vesting period.
E. Employees’ bonus and directors’ and supervisors’ remuneration
Employees’ bonus and directors’ and supervisors’ remuneration are recognized as expenses and liabilities, provided that such recognition is required under legal obligation or constructive obligation and those amounts can be reliably estimated. However, if the accrued amounts for employees’ bonus and directors’ and supervisors’ remuneration are different from the actual distributed amounts as resolved by the Board of Directors that act on behalf of stockholders at the Board of Directors’ meeting subsequently, the differences should be recognized based on the accounting for changes in estimates.
(19) Employee share-based payment
For the equity-settled share-based payment arrangements, the employee services received are measured at the fair value of the equity instruments granted at the grant date, and are recognized as compensation cost over the vesting period, with a corresponding adjustment to equity. The fair value of the equity instruments granted shall reflect the impact of market vesting conditions and non-market vesting conditions. Compensation cost is subject to adjustment based on the service conditions that are expected to be satisfied and the estimates of the number of equity instruments that are expected to vest under the non-market vesting conditions at each balance sheet date. And ultimately, the amount of compensation cost recognized is based on the number of equity instruments that eventually vest.
(20) Revenue and expense
Income and expense of the Bank and its subsidiaries are recognized as incurred. Expenses consist of employee benefit expense, depreciation and amortization expense and other business and administration expenses. Dividend revenues are recognized within ‘Revenues other than interest, net’ in the consolidated statement of comprehensive income when the right to receive dividends is assured.
35 Annual Report 2014
35
A. Other than those classified as financial assets and liabilities at fair value through profit and loss, all the interest income and interest expense generated from interest-bearing financial assets are calculated by effective interest rate according to relevant regulations and recognized as “interest income” and “interest expense” in the consolidated statement of comprehensive income.
B. Service fee income and expense are recognized upon the completion of services of loans or other services; service fee earned from performing significant items shall be recognized upon the completion of the service, such as syndication loan service fee received from sponsor, service fee income and expense of subsequent services of loans are amortized or included in the calculation of effective interest rate of loans and receivables during the service period. When determining whether the agreed rate of interest should be adjusted to effective interest rate for interest-earning loans and receivables, the loans and receivables may be measured by the initial amounts if the effects on discount are insignificant according to the “Regulation Governing the Preparation of Financial Reports by Public Banks”.
(21) Income tax
The tax expense for the period comprises current and deferred tax. Tax is recognized in profit or loss, except to the extent that it relates to items recognized in other comprehensive income or items recognized directly in equity, in which cases the tax is recognized in other comprehensive income or equity.
The current income tax expense is calculated on the basis of the tax laws enacted or substantively enacted at the balance sheet date in the countries where the Bank and its subsidiaries operate and generate taxable income. Management periodically evaluates positions taken in tax returns with respect to situations in accordance with applicable tax regulations. It establishes provisions where appropriate based on the amounts expected to be paid to the tax authorities. An additional 10% tax is levied on the unappropriated retained earnings and is recorded as income tax expense in the year the stockholders resolve to retain the earnings.
Deferred income tax is recognized, using the balance sheet liability method, on temporary differences arising between the tax bases of assets and liabilities and their carrying amounts in the consolidated balance sheet. However, the deferred income tax is not accounted for if it arises from initial recognition of goodwill or of an asset or liability in a transaction other than a business combination that at the time of the transaction affects neither accounting nor taxable profit or loss. Deferred income tax is provided on temporary differences arising on investments in subsidiaries, except where the timing of the reversal of the temporary difference is controlled by the Bank and its subsidiaries and it is probable that the temporary difference will not reverse in the foreseeable future. Deferred income tax is determined using tax rates (and laws) that have been enacted or substantially enacted by the balance sheet date and are expected to apply when the related deferred income tax asset is realized or the deferred income tax liability is settled.
Deferred income tax assets are recognized only to the extent that it is probable that future taxable profit will be available against which the temporary differences can be utilized. At each balance sheet date, unrecognized and recognized deferred income tax assets are reassessed.
Current income tax assets and liabilities are offset and the net amount reported in the balance sheet when there is a legally enforceable right to offset the recognized amounts and there is an intention to settle on a net basis or realize the asset and settle the liability simultaneously. Deferred income tax assets and liabilities are offset on the balance sheet when the entity has the legally enforceable right to offset current tax assets against current tax liabilities and they are levied by the same taxation authority on either the same entity or different entities that intend to settle on a net basis or reealize the asset and settle the liability simultaneously.
(22) Share capital and dividends
Net of incremental costs directly attributable to the issuance of new shares will be removed from equity after related income tax expenses is eliminated. Dividends on ordinary shares are recognized in the financial statements in the period in which they are approved by the shareholders. Cash dividends are recorded as liabilities. Stock dividends are recorded as stock dividends to be distributed and are reclassified to ordinary shares on the effective date of new shares issuance; they are not recognized and only disclosed as subsequent event in the notes if the dividend declaration date is later than the consolidated balance sheet date.
(23) Operating segments
Information of operating segments of the Bank and its subsidiaries is reported in the same method as the internal management report provided to the chief operating decision-maker (CODM). The CODM is the person or the Bank and its subsidiaries in charge of allocating resources to operating segments and evaluating their performance. The (CODM) of the Bank and its subsidiaries is the Board of Directors.
(24) Convenience translation into US dollars (Unaudited)
The Bank maintains its accounting records and prepares its financial statements in New Taiwan dollars. The United States dollar amounts disclosed in the 2014 financial statements are presented solely for the convenience of the readers and were translated into US dollars using the exchange rate prevailing at December 31, 2014 of US$1:NT$31.663. Such translation amounts are not in compliance with generally accepted accounting principles in the Republic of China and should not be construed as representation that the New Taiwan dollar amounts represent, or have been or could be converted into United States dollars at that or any other rate.
5. CRITICAL ACCOUNTING JUDGEMENTS, ESTIMATES AND KEY SOURCES OF ASSUMPTION UNCERTAINTY
The preparation of these consolidated financial statements requires management to make critical judgements in applying the Bank and its subsidiaries’ accounting policies and make critical assumptions and estimates concerning future events. Assumptions and estimates may differ from the actual results and are continually evaluated and adjusted based on historical experience and other factors.
Management’s critical judgements in applying the Bank and its subsidiaries’ accounting policies that have significant impact on the consolidated financial statements are outlined below:
(1) Financial instruments (including derivative instruments) valuation
If there is no quoted market price available in an active market for financial instruments, a valuation technique will be adopted to measure the fair value. If there are observable data of similar financial instruments in the market, then the fair value of the underlying financial instruments is estimated by reference to the observable data; otherwise, the fair value is estimated using the appropriate pricing models which are commonly used in the market. The assumptions used in the pricing models should refer to the observable data in the market. However, when those data are not observable from the market and/or the assumptions used in the pricing models
36Mega ICBC
36
are more subjective, the fair value of the financial instruments may be estimated based on historical data or other information. The pricing models used by the Bank and its subsidiaries are all evaluated and tested periodically to ensure the outputs may reflect the actual data and market prices. The primary assumptions used in determining the fair values of financial instruments are provided in Note 7. The management believes the pricing models and assumptions used have appropriately determined the fair values of financial instruments.
(2) Loan impairment
The Bank and its subsidiaries’ impairment evaluations are in compliance with the regulations of regulatory authorities. The Bank and its subsidiaries evaluates cash flows and impairment amounts, through model analysis and individual case assessment, on a monthly basis based on several factors, such as nature of client risk and security coverage. The Bank and its subsidiaries recognize impairment loss whenever there is observable evidence showing that impairment has occurred. This evidence includes repayment status of debtor, event that would cause delinquency in payments, and any significantly unfavorable changes in national or local economic circumstance. Future cash flows are estimated primarily based on the length of overdue time, the status of debtors, security coverage, guarantee of external institution and historical experiences. The incidence of impairment and subsequent collectability rate used in impairment evaluations are estimated based on the types of products and historical data. The Bank and its subsidiaries review the assumptions and inputs used in impairment evaluations periodically to ensure they are all reasonable.
(3) Post-employment benefit
The present value of post-employment benefit obligations are estimated based on several assumptions. Any changes in those assumptions will affect the carrying amounts of post-employment benefit obligations.
The assumptions used to determine net pension cost (revenue) comprise discount rate. The Bank and its subsidiaries determine the appropriate discount rate at the end of each year, and uses the discount rate in calculating the present value of future cash out of post-employment benefit obligations. The discount rate is chosen by reference to the rate of government bonds where the currency and maturity date of government bonds are in agreement with those of post-employment benefit obligations.
(4) Income tax
The Bank and its subsidiaries have to pay income tax in different countries and need to depend on significant assessment of estimating global income tax. The estimates of income tax payable in all these countries include the considerations of many transactions and calculations. The Bank and its subsidiaries may recognize additional income tax liabilities for some tax issues when necessary. Any difference between final income tax payable and initially recognized income tax payable will affect the amounts of current income taxes and deferred income taxes.
6. DETAILS OF SIGNIFICANT ACCOUNTS
(1) Cash and cash equivalents
December 31, 2014 NT$ US$ Cash on hand $ 14,842,201 $ 468,755 Checks for clearance 1,112,024 35,121 Due from banks(Note) 148,453,306 4,688,542 Total $ 164,407,531 $ 5,192,418
December 31, 2013 January 1, 2013 NT$ NT$ Cash on hand $ 14,304,691 $ 13,433,442 Checks for clearance 2,064,396 838,854 Due from banks(Note) 136,864,305 71,088,571 Total $ 153,233,392 $ 85,360,867
Note: Pursuant to the requirements of the competent authority, deposits of overseas branches with foreign Central Banks were reclassified from “due from banks” to “due from the Central Bank” account. Thus, as of December 31 and January 1, 2013, due from banks of $344,566,397 thousand and $291,456,671 thousand were adjusted to $136,864,305 thousand and $71,088,571 thousand, respectively.
(2) Due from the Central Bank and call loans to banks
December 31, 2014 NT$ US$
Reserve for deposits-category A $ 21,885,736 $ 691,209 Reserve for deposits-category B 36,566,092 1,154,853 Reserve for deposits-general 5,700,300 180,030 Reserve for deposits-foreign currency 431,340 13,623 Deposits of overseas branches with foreign Central Banks (Note) 239,979,957 7,579,192 Call loans to banks and bank overdrafts 87,926,666 2,776,953 Import and export loans from banks 71,463,911 2,257,016 Participate in interbank financing with risk 2,782,450 87,877 Subtotal 466,736,452 14,740,753 Less allowance for doubtful accounts
import and export loans from banks ( 750,371 )
( 23,699 ) Total $ 465,986,081 $ 14,717,054
37 Annual Report 2014
37
December 31, 2013 January 1, 2013 NT$ NT$ Reserve for deposits-category A $ 19,192,096 $ 20,360,016 Reserve for deposits-category B 35,270,994 31,919,840 Reserve for deposits-general 5,700,282 5,700,275 Reserve for deposits-foreign currency 490,698 470,583 Deposits of overseas branches with foreign Central Banks (Note) 207,702,092 220,368,100 Call loans to banks and bank overdrafts 39,656,280 54,719,987 Import and export loans from banks 81,916,206 13,042,150 Participate in interbank financing with risk 3,230,588 24,749,186 Subtotal 393,159,236 371,330,137 Less allowance for doubtful accounts
import and export loans from banks - - Total $ 393,159,236 $ 371,330,137
ote: please see Note 6(1).
As required by relevant laws, the reserves for deposits are calculated at required reserve ratios based on the monthly average balances of various deposit accounts. Reserve for deposits - category B cannot be used except upon the monthly adjustment of the reserve.
(3) Financial assets at fair value through profit or loss, net
December 31, 2014 December 31, 2013 NT$ US$ NT$ Financial assets held for trading Stocks $ 4,626,120 $ 146,105 $ 3,763,363 Derivative instruments 5,066,261 160,006 4,255,213 Corporate bonds 20,340,642 642,410 24,290,091 Government bonds - - 599,252 Financial bonds 13,664,024 431,545 11,573,121 Total $ 43,697,047 $ 1,380,066 $ 44,481,040
A. Gain (loss) on financial assets and liabilities held for trading and gain (loss) on financial liabilities designated as at fair value through profit or loss recognized for the years ended December 31, 2014 and 2013 are provided in Note 6(27).
B. As of December 31, 2014 and 2013, the above financial assets used as underlying assets for the business were NT$10,862,311 thousand and NT$6,587,686 thousand, respectively, and were pledged to other parties as collateral for business reserves and guarantees.
C. As of December 31, 2014 and 2013, the aforementioned financial assets at fair value through profit or loss used as underlying assets for repurchase agreements were NT$12,394,288 thousand and NT$7,644,422 thousand, respectively. (Such repurchase agreements were booked under the “securities sold under repurchase agreements” account)
(4) Receivables, net
December 31, 2014 December 31, 2013 NT$ US$ NT$ Factoring receivable $ 46,390,766 $ 1,465,141 $ 69,336,768 Accrued interest 4,898,391 154,704 4,448,918 Acceptances receivable 8,587,329 271,210 11,341,730 Accounts receivable factoring-D/A 26,100,991 824,337 - Accounts receivable -Credit card 4,319,291 136,414 3,995,541 Accounts receivable -Usance L/C at sight 2,903,307 91,694 538,291 Accounts receivable -Usance L/C buyout 66,887,471 2,112,481 63,149,254 Call loan to central bank receivable 3,482,933 110,000 - Other receivables 9,104,016 287,529 7,793,475 Total 172,674,495 5,453,510 160,603,977 Less: Allowance for bad debts ( 1,620,552 ) ( 51,181 ) ( 1,006,805 ) Receivables, net $ 171,053,943 $ 5,402,329 $ 159,597,172
(5) Bills discounted and loans, net
December 31, 2014 December 31, 2013 NT$ US$ NT$ Bills and notes discounted $ 6,505 $ 205 $ 18,288 Overdrafts 2,135,984 67,460 1,797,601 Short-term loans 439,845,990 13,891,482 462,928,362 Medium-term loans 756,782,261 23,901,155 698,836,700 Long-term loans 536,461,755 16,942,859 489,432,634 Import/export bills negotiated 19,533,489 616,919 20,543,348 Loans transferred to non-accrual loans 1,148,319 36,267 2,791,291 Total 1,755,914,303 55,456,347 1,676,348,224 Less: Allowance for bad debts ( 21,920,032 ) ( 692,292 ) ( 21,771,031 ) Bills discounted and loans, net $ 1,733,994,271 $ 54,764,055 $ 1,654,577,193
A. As of December 31, 2014 and 2013, the amounts of reclassified non-performing loans (overdue for more than six months) were NT$1,148,319 thousand and NT$2,791,291 thousand, respectively, to ‘overdue receivables’ account. These amounts included interest receivable of NT$6,888 thousand and NT$12,914 thousand, respectively.
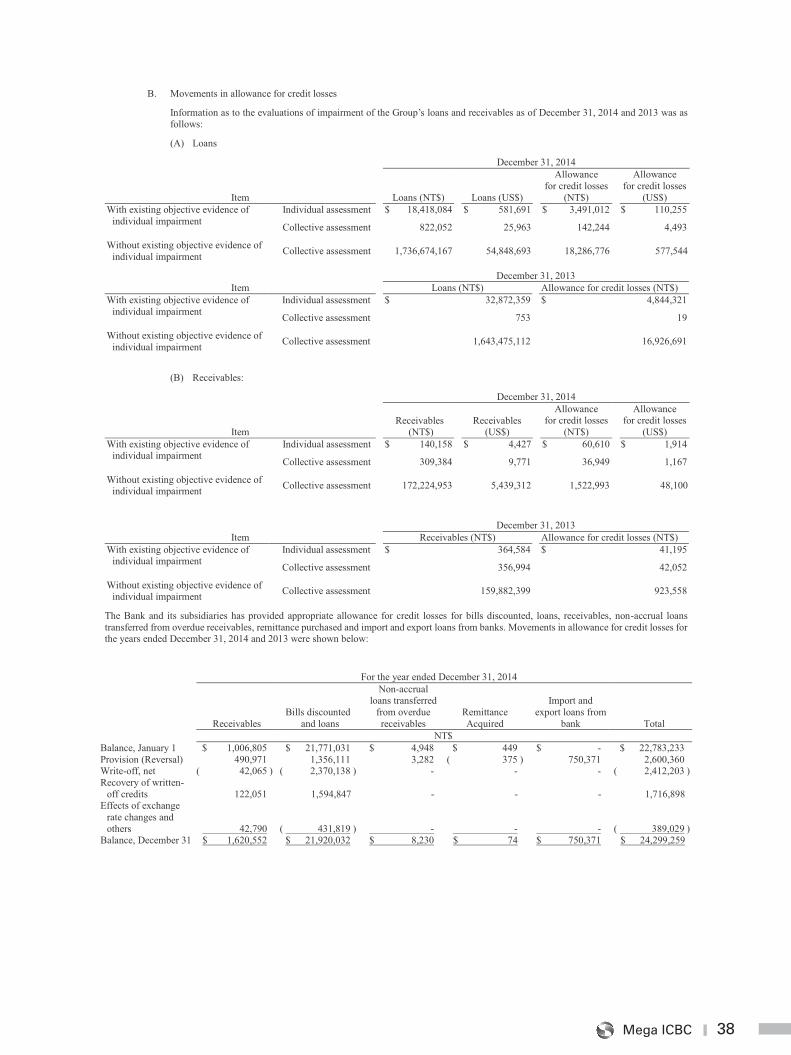
38Mega ICBC
38
B. Movements in allowance for credit losses
Information as to the evaluations of impairment of the Group’s loans and receivables as of December 31, 2014 and 2013 was as follows:
(A) Loans
December 31, 2014
Item
Loans (NT$)
Loans (US$)
Allowance for credit losses
(NT$)
Allowance for credit losses
(US$) With existing objective evidence of
individual impairment Individual assessment $ 18,418,084 $ 581,691 $ 3,491,012 $ 110,255
Collective assessment 822,052 25,963 142,244 4,493
Without existing objective evidence of individual impairment Collective assessment 1,736,674,167 54,848,693 18,286,776 577,544
December 31, 2013 Item Loans (NT$) Allowance for credit losses (NT$)
With existing objective evidence of individual impairment
Individual assessment $ 32,872,359 $ 4,844,321
Collective assessment 753 19
Without existing objective evidence of individual impairment Collective assessment 1,643,475,112 16,926,691
(B) Receivables:
December 31, 2014
Item
Receivables
(NT$)
Receivables
(US$)
Allowance for credit losses
(NT$)
Allowance for credit losses
(US$) With existing objective evidence of
individual impairment Individual assessment $ 140,158 $ 4,427 $ 60,610 $ 1,914
Collective assessment 309,384 9,771 36,949 1,167
Without existing objective evidence of individual impairment Collective assessment 172,224,953 5,439,312 1,522,993 48,100
December 31, 2013 Item Receivables (NT$) Allowance for credit losses (NT$)
With existing objective evidence of individual impairment
Individual assessment $ 364,584 $ 41,195
Collective assessment 356,994 42,052
Without existing objective evidence of individual impairment Collective assessment 159,882,399 923,558
The Bank and its subsidiaries has provided appropriate allowance for credit losses for bills discounted, loans, receivables, non-accrual loans transferred from overdue receivables, remittance purchased and import and export loans from banks. Movements in allowance for credit losses for the years ended December 31, 2014 and 2013 were shown below:
For the year ended December 31, 2014
Receivables
Bills discounted and loans
Non-accrual loans transferred
from overdue receivables
Remittance Acquired
Import and
export loans from bank
Total NT$ Balance, January 1 $ 1,006,805 $ 21,771,031 $ 4,948 $ 449 $ - $ 22,783,233 Provision (Reversal) 490,971 1,356,111 3,282 ( 375 ) 750,371 2,600,360 Write-off, net ( 42,065 ) ( 2,370,138 ) - - - ( 2,412,203 ) Recovery of written-
off credits 122,051 1,594,847 - - - 1,716,898 Effects of exchange
rate changes and others 42,790
( 431,819 )
-
-
-
( 389,029 ) Balance, December 31 $ 1,620,552 $ 21,920,032 $ 8,230 $ 74 $ 750,371 $ 24,299,259
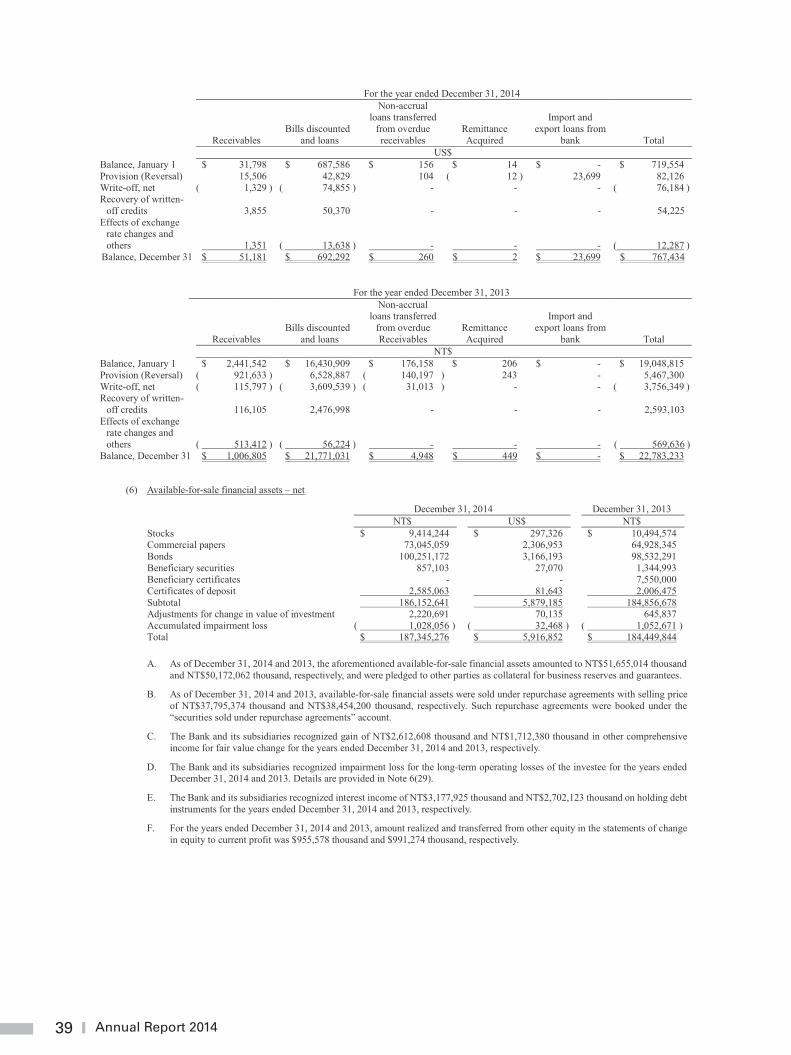
39 Annual Report 2014
39
For the year ended December 31, 2014
Receivables
Bills discounted and loans
Non-accrual loans transferred
from overdue receivables
Remittance Acquired
Import and
export loans from bank
Total US$ Balance, January 1 $ 31,798 $ 687,586 $ 156 $ 14 $ - $ 719,554 Provision (Reversal) 15,506 42,829 104 ( 12 ) 23,699 82,126 Write-off, net ( 1,329 ) ( 74,855 ) - - - ( 76,184 ) Recovery of written-
off credits 3,855 50,370 - - - 54,225 Effects of exchange
rate changes and others 1,351 ( 13,638 ) -
-
-
( 12,287 ) Balance, December 31 $ 51,181 $ 692,292 $ 260 $ 2 $ 23,699 $ 767,434
For the year ended December 31, 2013
Receivables
Bills discounted and loans
Non-accrual loans transferred
from overdue Receivables
Remittance Acquired
Import and
export loans from bank
Total NT$ Balance, January 1 $ 2,441,542 $ 16,430,909 $ 176,158 $ 206 $ - $ 19,048,815 Provision (Reversal) ( 921,633 ) 6,528,887 ( 140,197 ) 243 - 5,467,300 Write-off, net ( 115,797 ) ( 3,609,539 ) ( 31,013 ) - - ( 3,756,349 ) Recovery of written-
off credits 116,105 2,476,998 - - - 2,593,103 Effects of exchange
rate changes and others ( 513,412 ) ( 56,224 ) -
-
-
( 569,636 ) Balance, December 31 $ 1,006,805 $ 21,771,031 $ 4,948 $ 449 $ - $ 22,783,233
(6) Available-for-sale financial assets – net
December 31, 2014 December 31, 2013 NT$ US$ NT$ Stocks $ 9,414,244 $ 297,326 $ 10,494,574 Commercial papers 73,045,059 2,306,953 64,928,345 Bonds 100,251,172 3,166,193 98,532,291 Beneficiary securities 857,103 27,070 1,344,993 Beneficiary certificates - - 7,550,000 Certificates of deposit 2,585,063 81,643 2,006,475 Subtotal 186,152,641 5,879,185 184,856,678 Adjustments for change in value of investment 2,220,691 70,135 645,837 Accumulated impairment loss ( 1,028,056 ) ( 32,468 ) ( 1,052,671 ) Total $ 187,345,276 $ 5,916,852 $ 184,449,844
A. As of December 31, 2014 and 2013, the aforementioned available-for-sale financial assets amounted to NT$51,655,014 thousand and NT$50,172,062 thousand, respectively, and were pledged to other parties as collateral for business reserves and guarantees.
B. As of December 31, 2014 and 2013, available-for-sale financial assets were sold under repurchase agreements with selling price of NT$37,795,374 thousand and NT$38,454,200 thousand, respectively. Such repurchase agreements were booked under the “securities sold under repurchase agreements” account.
C. The Bank and its subsidiaries recognized gain of NT$2,612,608 thousand and NT$1,712,380 thousand in other comprehensive income for fair value change for the years ended December 31, 2014 and 2013, respectively.
D. The Bank and its subsidiaries recognized impairment loss for the long-term operating losses of the investee for the years ended December 31, 2014 and 2013. Details are provided in Note 6(29).
E. The Bank and its subsidiaries recognized interest income of NT$3,177,925 thousand and NT$2,702,123 thousand on holding debt instruments for the years ended December 31, 2014 and 2013, respectively.
F. For the years ended December 31, 2014 and 2013, amount realized and transferred from other equity in the statements of change in equity to current profit was $955,578 thousand and $991,274 thousand, respectively.
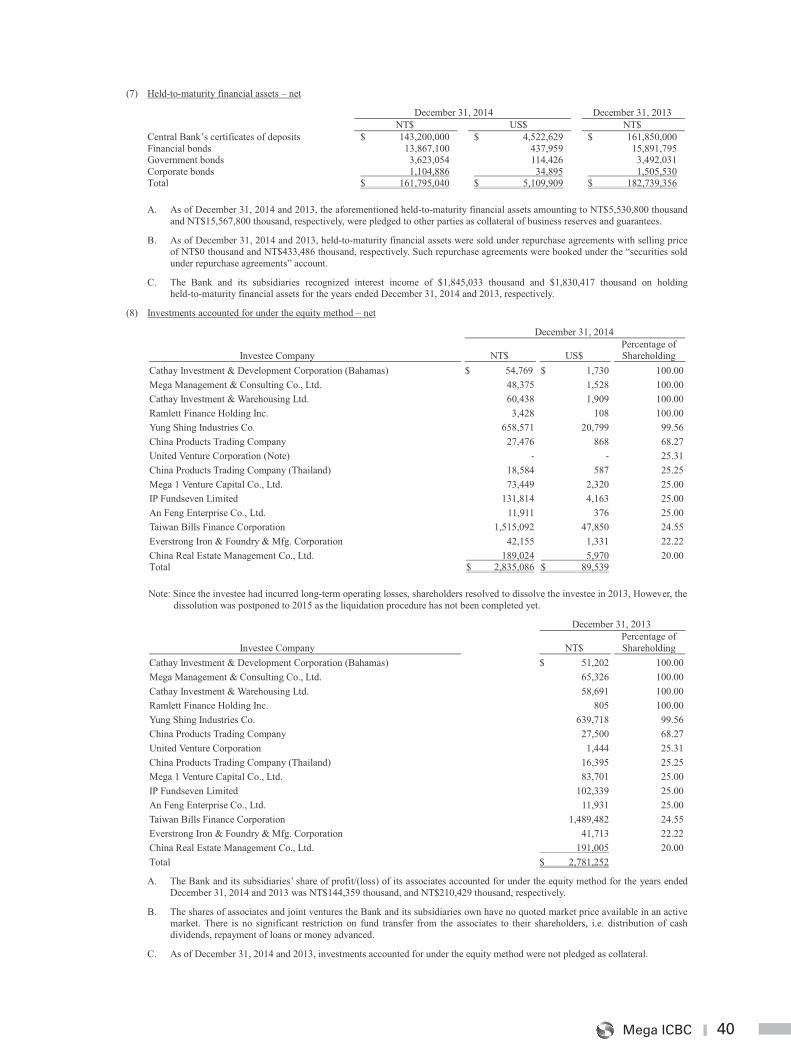
40Mega ICBC
40
(7) Held-to-maturity financial assets – net
December 31, 2014 December 31, 2013 NT$ US$ NT$ Central Bank’s certificates of deposits $ 143,200,000 $ 4,522,629 $ 161,850,000 Financial bonds 13,867,100 437,959 15,891,795 Government bonds 3,623,054 114,426 3,492,031 Corporate bonds 1,104,886 34,895 1,505,530 Total $ 161,795,040 $ 5,109,909 $ 182,739,356
A. As of December 31, 2014 and 2013, the aforementioned held-to-maturity financial assets amounting to NT$5,530,800 thousand and NT$15,567,800 thousand, respectively, were pledged to other parties as collateral of business reserves and guarantees.
B. As of December 31, 2014 and 2013, held-to-maturity financial assets were sold under repurchase agreements with selling price of NT$0 thousand and NT$433,486 thousand, respectively. Such repurchase agreements were booked under the “securities sold under repurchase agreements” account.
C. The Bank and its subsidiaries recognized interest income of $1,845,033 thousand and $1,830,417 thousand on holding held-to-maturity financial assets for the years ended December 31, 2014 and 2013, respectively.
(8) Investments accounted for under the equity method – net
December 31, 2014
Investee Company
NT$
US$ Percentage of
Shareholding Cathay Investment & Development Corporation (Bahamas) $ 54,769 $ 1,730 100.00 Mega Management & Consulting Co., Ltd. 48,375 1,528 100.00 Cathay Investment & Warehousing Ltd. 60,438 1,909 100.00 Ramlett Finance Holding Inc. 3,428 108 100.00 Yung Shing Industries Co. 658,571 20,799 99.56 China Products Trading Company 27,476 868 68.27 United Venture Corporation (Note) - - 25.31 China Products Trading Company (Thailand) 18,584 587 25.25 Mega 1 Venture Capital Co., Ltd. 73,449 2,320 25.00 IP Fundseven Limited 131,814 4,163 25.00 An Feng Enterprise Co., Ltd. 11,911 376 25.00 Taiwan Bills Finance Corporation 1,515,092 47,850 24.55 Everstrong Iron & Foundry & Mfg. Corporation 42,155 1,331 22.22 China Real Estate Management Co., Ltd. 189,024 5,970 20.00 Total $ 2,835,086 $ 89,539
Note: Since the investee had incurred long-term operating losses, shareholders resolved to dissolve the investee in 2013, However, the dissolution was postponed to 2015 as the liquidation procedure has not been completed yet.
December 31, 2013
Investee Company
NT$ Percentage of
Shareholding Cathay Investment & Development Corporation (Bahamas) $ 51,202 100.00 Mega Management & Consulting Co., Ltd. 65,326 100.00 Cathay Investment & Warehousing Ltd. 58,691 100.00 Ramlett Finance Holding Inc. 805 100.00 Yung Shing Industries Co. 639,718 99.56 China Products Trading Company 27,500 68.27 United Venture Corporation 1,444 25.31 China Products Trading Company (Thailand) 16,395 25.25 Mega 1 Venture Capital Co., Ltd. 83,701 25.00 IP Fundseven Limited 102,339 25.00 An Feng Enterprise Co., Ltd. 11,931 25.00 Taiwan Bills Finance Corporation 1,489,482 24.55 Everstrong Iron & Foundry & Mfg. Corporation 41,713 22.22 China Real Estate Management Co., Ltd. 191,005 20.00 Total $ 2,781,252
A. The Bank and its subsidiaries’ share of profit/(loss) of its associates accounted for under the equity method for the years ended December 31, 2014 and 2013 was NT$144,359 thousand, and NT$210,429 thousand, respectively.
B. The shares of associates and joint ventures the Bank and its subsidiaries own have no quoted market price available in an active market. There is no significant restriction on fund transfer from the associates to their shareholders, i.e. distribution of cash dividends, repayment of loans or money advanced.
C. As of December 31, 2014 and 2013, investments accounted for under the equity method were not pledged as collateral.
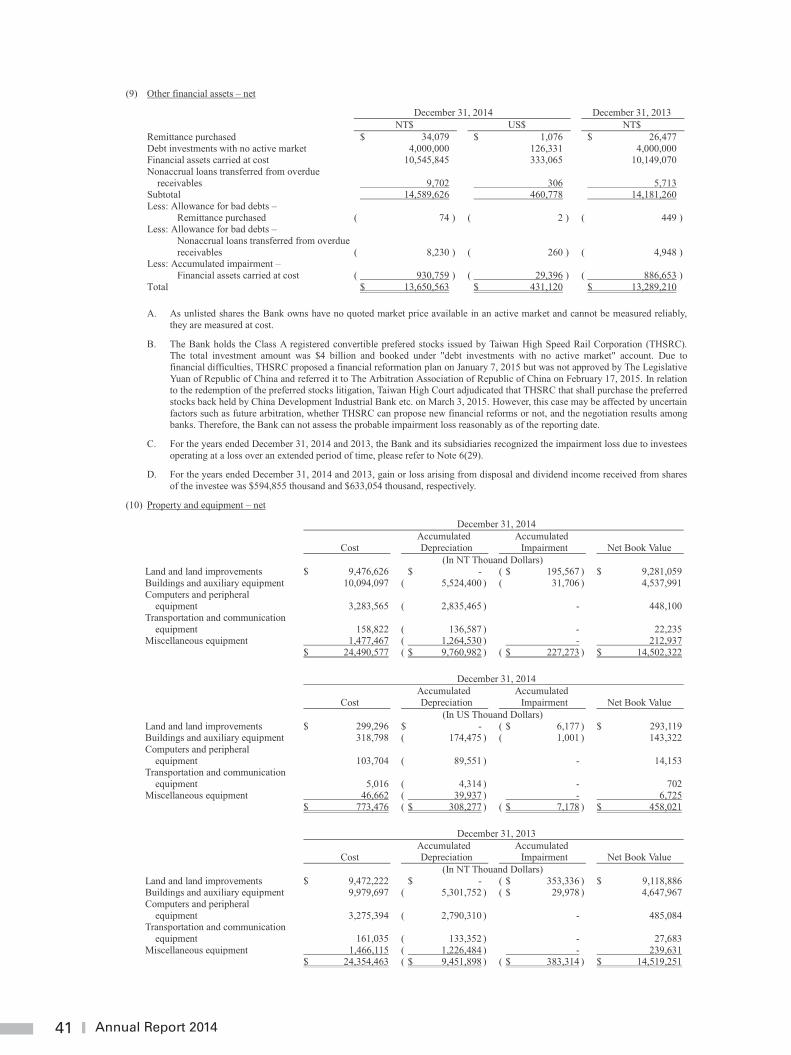
41 Annual Report 2014
41
(9) Other financial assets – net
December 31, 2014 December 31, 2013 NT$ US$ NT$ Remittance purchased $ 34,079 $ 1,076 $ 26,477 Debt investments with no active market 4,000,000 126,331 4,000,000 Financial assets carried at cost 10,545,845 333,065 10,149,070 Nonaccrual loans transferred from overdue
receivables 9,702 306 5,713 Subtotal 14,589,626 460,778 14,181,260 Less: Allowance for bad debts –
Remittance purchased ( 74 ) ( 2 ) ( 449 ) Less: Allowance for bad debts –
Nonaccrual loans transferred from overdue receivables ( 8,230 )
( 260 ) ( 4,948 )
Less: Accumulated impairment – Financial assets carried at cost ( 930,759 ) ( 29,396 ) ( 886,653 )
Total $ 13,650,563 $ 431,120 $ 13,289,210
A. As unlisted shares the Bank owns have no quoted market price available in an active market and cannot be measured reliably, they are measured at cost.
B. The Bank holds the Class A registered convertible prefered stocks issued by Taiwan High Speed Rail Corporation (THSRC). The total investment amount was $4 billion and booked under "debt investments with no active market" account. Due to financial difficulties, THSRC proposed a financial reformation plan on January 7, 2015 but was not approved by The Legislative Yuan of Republic of China and referred it to The Arbitration Association of Republic of China on February 17, 2015. In relation to the redemption of the preferred stocks litigation, Taiwan High Court adjudicated that THSRC that shall purchase the preferred stocks back held by China Development Industrial Bank etc. on March 3, 2015. However, this case may be affected by uncertain factors such as future arbitration, whether THSRC can propose new financial reforms or not, and the negotiation results among banks. Therefore, the Bank can not assess the probable impairment loss reasonably as of the reporting date.
C. For the years ended December 31, 2014 and 2013, the Bank and its subsidiaries recognized the impairment loss due to investees operating at a loss over an extended period of time, please refer to Note 6(29).
D. For the years ended December 31, 2014 and 2013, gain or loss arising from disposal and dividend income received from shares of the investee was $594,855 thousand and $633,054 thousand, respectively.
(10) Property and equipment – net
December 31, 2014
Cost Accumulated
Depreciation Accumulated
Impairment
Net Book Value (In NT Thouand Dollars) Land and land improvements $ 9,476,626 $ - ( $ 195,567 ) $ 9,281,059 Buildings and auxiliary equipment 10,094,097 ( 5,524,400 ) ( 31,706 ) 4,537,991 Computers and peripheral
equipment 3,283,565 ( 2,835,465 ) - 448,100 Transportation and communication
equipment 158,822 ( 136,587 ) - 22,235 Miscellaneous equipment 1,477,467 ( 1,264,530 ) - 212,937
$ 24,490,577 ( $ 9,760,982 ) ( $ 227,273 ) $ 14,502,322
December 31, 2014
Cost Accumulated
Depreciation Accumulated
Impairment
Net Book Value (In US Thouand Dollars) Land and land improvements $ 299,296 $ - ( $ 6,177 ) $ 293,119 Buildings and auxiliary equipment 318,798 ( 174,475 ) ( 1,001 ) 143,322 Computers and peripheral
equipment 103,704 ( 89,551 ) - 14,153 Transportation and communication
equipment 5,016 ( 4,314 ) - 702 Miscellaneous equipment 46,662 ( 39,937 ) - 6,725
$ 773,476 ( $ 308,277 ) ( $ 7,178 ) $ 458,021
December 31, 2013
Cost Accumulated
Depreciation Accumulated
Impairment
Net Book Value (In NT Thouand Dollars)
Land and land improvements $ 9,472,222 $ - ( $ 353,336 ) $ 9,118,886 Buildings and auxiliary equipment 9,979,697 ( 5,301,752 ) ( $ 29,978 ) 4,647,967 Computers and peripheral
equipment 3,275,394 ( 2,790,310 ) - 485,084 Transportation and communication
equipment 161,035 ( 133,352 ) - 27,683 Miscellaneous equipment 1,466,115 ( 1,226,484 ) - 239,631
$ 24,354,463 ( $ 9,451,898 ) ( $ 383,314 ) $ 14,519,251
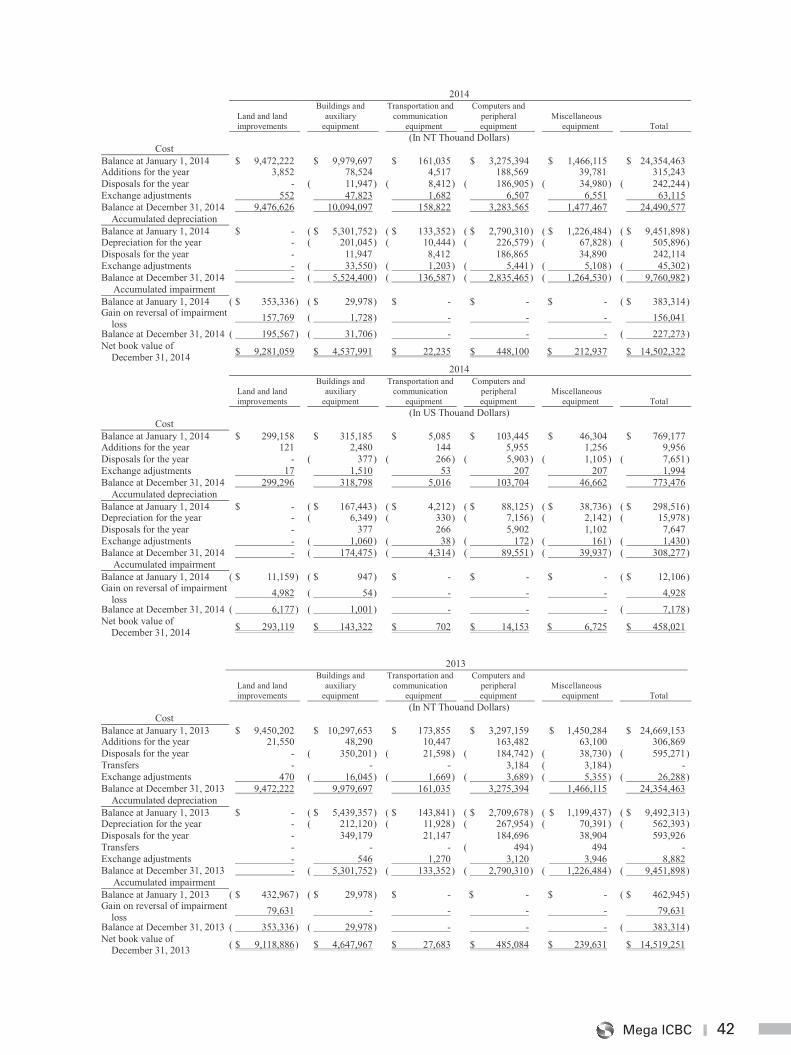
42Mega ICBC
42
2014
Land and land improvements
Buildings and auxiliary
equipment
Transportation and communication
equipment
Computers and peripheral equipment
Miscellaneous equipment Total
(In NT Thouand Dollars) Cost
Balance at January 1, 2014 $ 9,472,222 $ 9,979,697 $ 161,035 $ 3,275,394 $ 1,466,115 $ 24,354,463 Additions for the year 3,852 78,524 4,517 188,569 39,781 315,243 Disposals for the year - ( 11,947 ) ( 8,412 ) ( 186,905 ) ( 34,980 ) ( 242,244 ) Exchange adjustments 552 47,823 1,682 6,507 6,551 63,115 Balance at December 31, 2014 9,476,626 10,094,097 158,822 3,283,565 1,477,467 24,490,577
Accumulated depreciation Balance at January 1, 2014 $ - ( $ 5,301,752 ) ( $ 133,352 ) ( $ 2,790,310 ) ( $ 1,226,484 ) ( $ 9,451,898 ) Depreciation for the year - ( 201,045 ) ( 10,444 ) ( 226,579 ) ( 67,828 ) ( 505,896 ) Disposals for the year - 11,947 8,412 186,865 34,890 242,114 Exchange adjustments - ( 33,550 ) ( 1,203 ) ( 5,441 ) ( 5,108 ) ( 45,302 ) Balance at December 31, 2014 - ( 5,524,400 ) ( 136,587 ) ( 2,835,465 ) ( 1,264,530 ) ( 9,760,982 )
Accumulated impairment Balance at January 1, 2014 ( $ 353,336 ) ( $ 29,978 ) $ - $ - $ - ( $ 383,314 ) Gain on reversal of impairment loss 157,769 ( 1,728 ) - - - 156,041 Balance at December 31, 2014 ( 195,567 ) ( 31,706 ) - - - ( 227,273 ) Net book value of December 31, 2014 $ 9,281,059 $ 4,537,991 $ 22,235 $ 448,100 $ 212,937 $ 14,502,322
2014
Land and land improvements
Buildings and auxiliary
equipment
Transportation and communication
equipment
Computers and peripheral equipment
Miscellaneous equipment Total
(In US Thouand Dollars) Cost
Balance at January 1, 2014 $ 299,158 $ 315,185 $ 5,085 $ 103,445 $ 46,304 $ 769,177 Additions for the year 121 2,480 144 5,955 1,256 9,956 Disposals for the year - ( 377 ) ( 266 ) ( 5,903 ) ( 1,105 ) ( 7,651 ) Exchange adjustments 17 1,510 53 207 207 1,994 Balance at December 31, 2014 299,296 318,798 5,016 103,704 46,662 773,476
Accumulated depreciation Balance at January 1, 2014 $ - ( $ 167,443 ) ( $ 4,212 ) ( $ 88,125 ) ( $ 38,736 ) ( $ 298,516 ) Depreciation for the year - ( 6,349 ) ( 330 ) ( 7,156 ) ( 2,142 ) ( 15,978 ) Disposals for the year - 377 266 5,902 1,102 7,647 Exchange adjustments - ( 1,060 ) ( 38 ) ( 172 ) ( 161 ) ( 1,430 ) Balance at December 31, 2014 - ( 174,475 ) ( 4,314 ) ( 89,551 ) ( 39,937 ) ( 308,277 )
Accumulated impairment Balance at January 1, 2014 ( $ 11,159 ) ( $ 947 ) $ - $ - $ - ( $ 12,106 ) Gain on reversal of impairment loss 4,982 ( 54 ) - - - 4,928 Balance at December 31, 2014 ( 6,177 ) ( 1,001 ) - - - ( 7,178 ) Net book value of
December 31, 2014 $ 293,119 $ 143,322 $ 702 $ 14,153 $ 6,725 $ 458,021
2013
Land and land improvements
Buildings and auxiliary
equipment
Transportation and communication
equipment
Computers and peripheral equipment
Miscellaneous equipment Total
(In NT Thouand Dollars) Cost
Balance at January 1, 2013 $ 9,450,202 $ 10,297,653 $ 173,855 $ 3,297,159 $ 1,450,284 $ 24,669,153 Additions for the year 21,550 48,290 10,447 163,482 63,100 306,869 Disposals for the year - ( 350,201 ) ( 21,598 ) ( 184,742 ) ( 38,730 ) ( 595,271 ) Transfers - - - 3,184 ( 3,184 ) - Exchange adjustments 470 ( 16,045 ) ( 1,669 ) ( 3,689 ) ( 5,355 ) ( 26,288 ) Balance at December 31, 2013 9,472,222 9,979,697 161,035 3,275,394 1,466,115 24,354,463
Accumulated depreciation Balance at January 1, 2013 $ - ( $ 5,439,357 ) ( $ 143,841 ) ( $ 2,709,678 ) ( $ 1,199,437 ) ( $ 9,492,313 ) Depreciation for the year - ( 212,120 ) ( 11,928 ) ( 267,954 ) ( 70,391 ) ( 562,393 ) Disposals for the year - 349,179 21,147 184,696 38,904 593,926 Transfers - - - ( 494 ) 494 -Exchange adjustments - 546 1,270 3,120 3,946 8,882 Balance at December 31, 2013 - ( 5,301,752 ) ( 133,352 ) ( 2,790,310 ) ( 1,226,484 ) ( 9,451,898 )
Accumulated impairment Balance at January 1, 2013 ( $ 432,967 ) ( $ 29,978 ) $ - $ - $ - ( $ 462,945 ) Gain on reversal of impairment
loss 79,631 - - - - 79,631 Balance at December 31, 2013 ( 353,336 ) ( 29,978 ) - - - ( 383,314 ) Net book value of
December 31, 2013 ( $ 9,118,886 ) $ 4,647,967 $ 27,683 $ 485,084 $ 239,631 $ 14,519,251
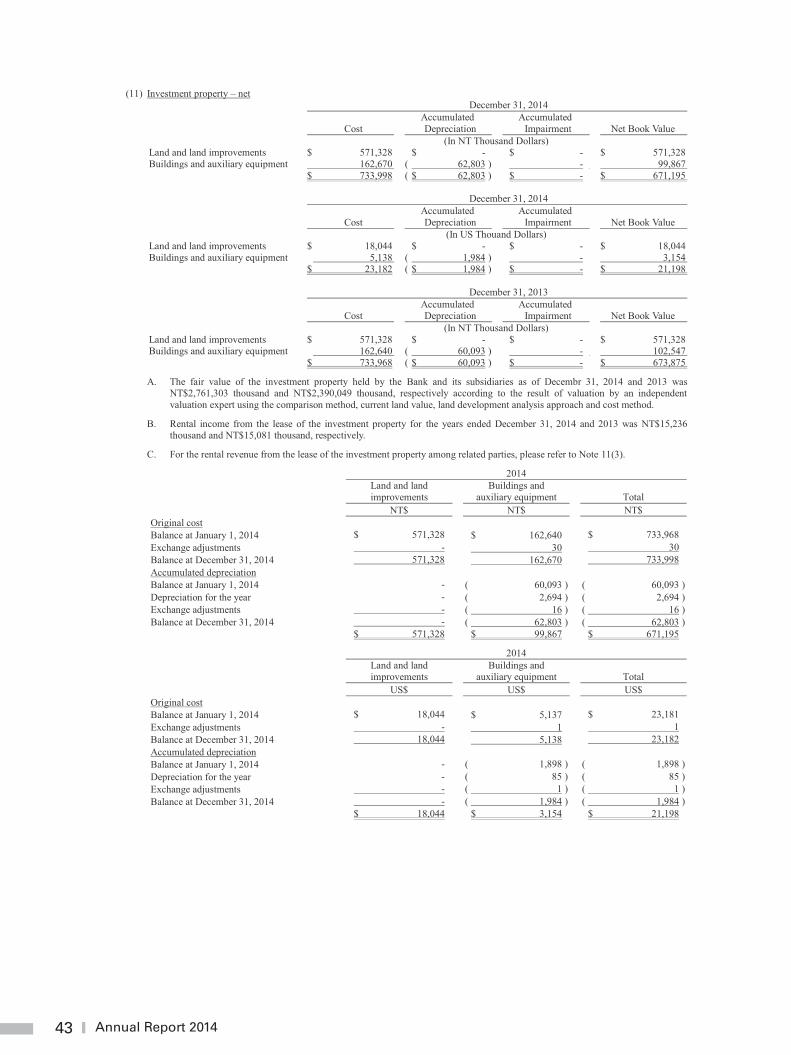
43 Annual Report 2014
43
(11) Investment property – net December 31, 2014
Cost Accumulated
Depreciation Accumulated
Impairment
Net Book Value (In NT Thousand Dollars)
Land and land improvements $ 571,328 $ - $ - $ 571,328 Buildings and auxiliary equipment 162,670 ( 62,803 ) - 99,867
$ 733,998 ( $ 62,803 ) $ - $ 671,195 December 31, 2014
Cost Accumulated
Depreciation Accumulated
Impairment
Net Book Value (In US Thouand Dollars)
Land and land improvements $ 18,044 $ - $ - $ 18,044 Buildings and auxiliary equipment 5,138 ( 1,984 ) - 3,154
$ 23,182 ( $ 1,984 ) $ - $ 21,198 December 31, 2013
Cost Accumulated
Depreciation Accumulated
Impairment
Net Book Value (In NT Thousand Dollars)
Land and land improvements $ 571,328 $ - $ - $ 571,328 Buildings and auxiliary equipment 162,640 ( 60,093 ) - 102,547
$ 733,968 ( $ 60,093 ) $ - $ 673,875
A. The fair value of the investment property held by the Bank and its subsidiaries as of Decembr 31, 2014 and 2013 was NT$2,761,303 thousand and NT$2,390,049 thousand, respectively according to the result of valuation by an independent valuation expert using the comparison method, current land value, land development analysis approach and cost method.
B. Rental income from the lease of the investment property for the years ended December 31, 2014 and 2013 was NT$15,236 thousand and NT$15,081 thousand, respectively.
C. For the rental revenue from the lease of the investment property among related parties, please refer to Note 11(3).
2014 Land and land
improvements Buildings and
auxiliary equipment
Total NT$ NT$ NT$ Original cost Balance at January 1, 2014 $ 571,328 $ 162,640 $ 733,968 Exchange adjustments - 30 30 Balance at December 31, 2014 571,328 162,670 733,998 Accumulated depreciation Balance at January 1, 2014 - ( 60,093 ) ( 60,093 ) Depreciation for the year - ( 2,694 ) ( 2,694 ) Exchange adjustments - ( 16 ) ( 16 ) Balance at December 31, 2014 - ( 62,803 ) ( 62,803 )
$ 571,328 $ 99,867 $ 671,195
2014 Land and land
improvements Buildings and
auxiliary equipment
Total US$ US$ US$ Original cost Balance at January 1, 2014 $ 18,044 $ 5,137 $ 23,181 Exchange adjustments - 1 1 Balance at December 31, 2014 18,044 5,138 23,182 Accumulated depreciation Balance at January 1, 2014 - ( 1,898 ) ( 1,898 ) Depreciation for the year - ( 85 ) ( 85 ) Exchange adjustments - ( 1 ) ( 1 ) Balance at December 31, 2014 - ( 1,984 ) ( 1,984 )
$ 18,044 $ 3,154 $ 21,198
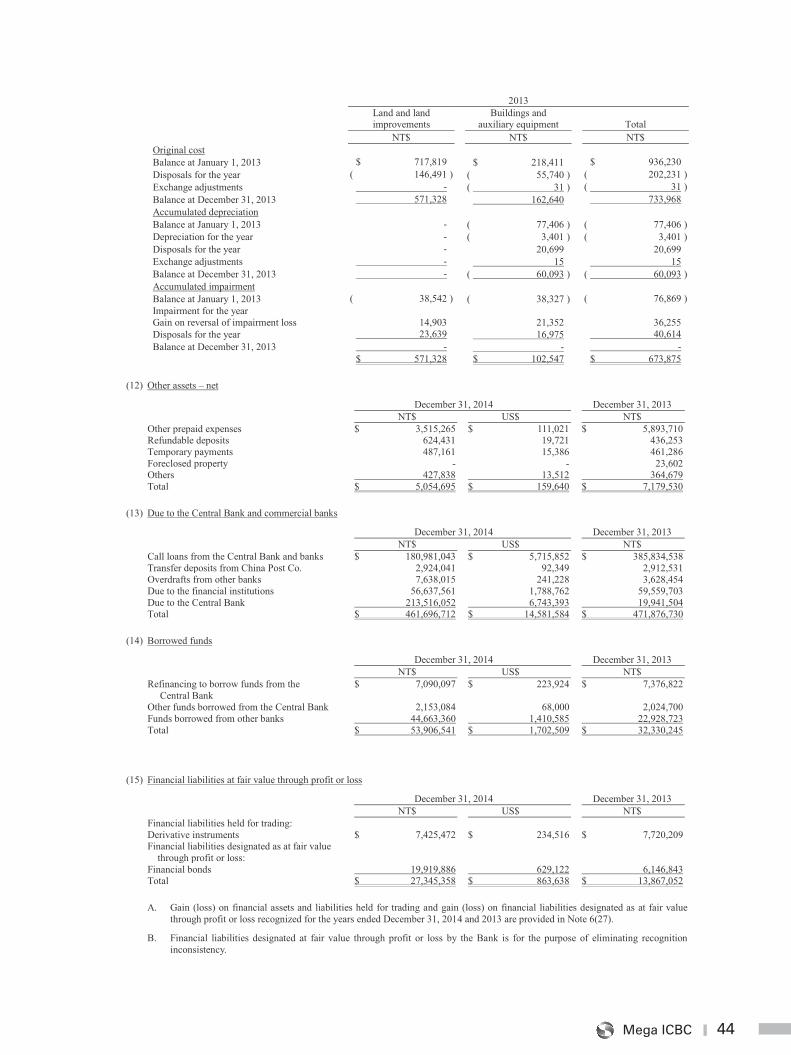
44Mega ICBC
44
2013 Land and land
improvements Buildings and
auxiliary equipment
Total NT$ NT$ NT$ Original cost Balance at January 1, 2013 $ 717,819 $ 218,411 $ 936,230 Disposals for the year ( 146,491 ) ( 55,740 ) ( 202,231 ) Exchange adjustments - ( 31 ) ( 31 ) Balance at December 31, 2013 571,328 162,640 733,968 Accumulated depreciation Balance at January 1, 2013 - ( 77,406 ) ( 77,406 ) Depreciation for the year - ( 3,401 ) ( 3,401 ) Disposals for the year - 20,699 20,699 Exchange adjustments - 15 15 Balance at December 31, 2013 - ( 60,093 ) ( 60,093 ) Accumulated impairment Balance at January 1, 2013 ( 38,542 ) ( 38,327 ) ( 76,869 ) Impairment for the year Gain on reversal of impairment loss 14,903
21,352
36,255
Disposals for the year 23,639 16,975 40,614 Balance at December 31, 2013 - - -
$ 571,328 $ 102,547 $ 673,875
(12) Other assets – net
December 31, 2014 December 31, 2013 NT$ US$ NT$ Other prepaid expenses $ 3,515,265 $ 111,021 $ 5,893,710 Refundable deposits 624,431 19,721 436,253 Temporary payments 487,161 15,386 461,286 Foreclosed property - - 23,602 Others 427,838 13,512 364,679 Total $ 5,054,695 $ 159,640 $ 7,179,530
(13) Due to the Central Bank and commercial banks
December 31, 2014 December 31, 2013 NT$ US$ NT$ Call loans from the Central Bank and banks $ 180,981,043 $ 5,715,852 $ 385,834,538 Transfer deposits from China Post Co. 2,924,041 92,349 2,912,531 Overdrafts from other banks 7,638,015 241,228 3,628,454 Due to the financial institutions 56,637,561 1,788,762 59,559,703 Due to the Central Bank 213,516,052 6,743,393 19,941,504 Total $ 461,696,712 $ 14,581,584 $ 471,876,730
(14) Borrowed funds
December 31, 2014 December 31, 2013 NT$ US$ NT$ Refinancing to borrow funds from the
Central Bank $ 7,090,097 $ 223,924 $ 7,376,822
Other funds borrowed from the Central Bank 2,153,084 68,000 2,024,700 Funds borrowed from other banks 44,663,360 1,410,585 22,928,723 Total $ 53,906,541 $ 1,702,509 $ 32,330,245
(15) Financial liabilities at fair value through profit or loss
December 31, 2014 December 31, 2013 NT$ US$ NT$ Financial liabilities held for trading: Derivative instruments $ 7,425,472 $ 234,516 $ 7,720,209 Financial liabilities designated as at fair value
through profit or loss:
Financial bonds 19,919,886 629,122 6,146,843 Total $ 27,345,358 $ 863,638 $ 13,867,052
A. Gain (loss) on financial assets and liabilities held for trading and gain (loss) on financial liabilities designated as at fair value through profit or loss recognized for the years ended December 31, 2014 and 2013 are provided in Note 6(27).
B. Financial liabilities designated at fair value through profit or loss by the Bank is for the purpose of eliminating recognition inconsistency.
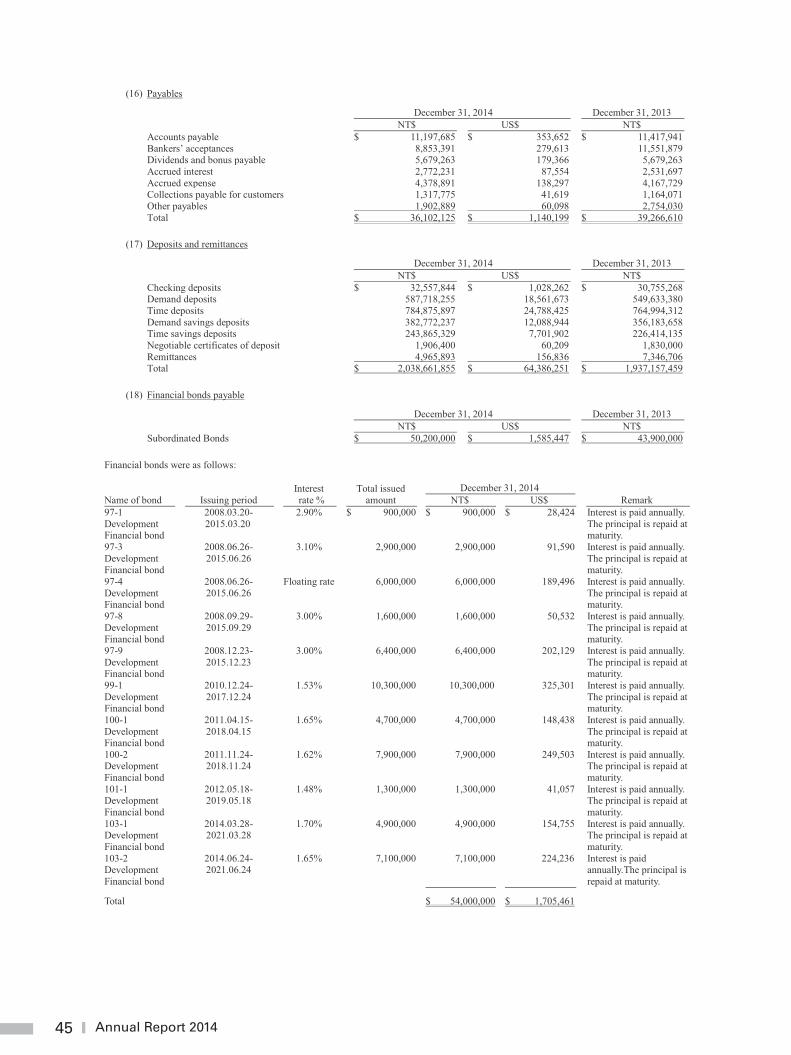
45 Annual Report 2014
45
(16) Payables
December 31, 2014 December 31, 2013 NT$ US$ NT$ Accounts payable $ 11,197,685 $ 353,652 $ 11,417,941 Bankers’ acceptances 8,853,391 279,613 11,551,879 Dividends and bonus payable 5,679,263 179,366 5,679,263 Accrued interest 2,772,231 87,554 2,531,697 Accrued expense 4,378,891 138,297 4,167,729 Collections payable for customers 1,317,775 41,619 1,164,071 Other payables 1,902,889 60,098 2,754,030 Total $ 36,102,125 $ 1,140,199 $ 39,266,610
(17) Deposits and remittances
December 31, 2014 December 31, 2013 NT$ US$ NT$ Checking deposits $ 32,557,844 $ 1,028,262 $ 30,755,268 Demand deposits 587,718,255 18,561,673 549,633,380 Time deposits 784,875,897 24,788,425 764,994,312 Demand savings deposits 382,772,237 12,088,944 356,183,658 Time savings deposits 243,865,329 7,701,902 226,414,135 Negotiable certificates of deposit 1,906,400 60,209 1,830,000 Remittances 4,965,893 156,836 7,346,706 Total $ 2,038,661,855 $ 64,386,251 $ 1,937,157,459
(18) Financial bonds payable
December 31, 2014 December 31, 2013 NT$ US$ NT$ Subordinated Bonds $ 50,200,000 $ 1,585,447 $ 43,900,000
Financial bonds were as follows:
Name of bond
Issuing period Interest
rate % Total issued
amount December 31, 2014
Remark NT$ US$ 97-1 Development Financial bond
2008.03.20- 2015.03.20
2.90% $ 900,000 $ 900,000 $ 28,424 Interest is paid annually. The principal is repaid at maturity.
97-3 Development Financial bond
2008.06.26- 2015.06.26
3.10% 2,900,000 2,900,000 91,590 Interest is paid annually. The principal is repaid at maturity.
97-4 Development Financial bond
2008.06.26- 2015.06.26
Floating rate 6,000,000 6,000,000 189,496 Interest is paid annually. The principal is repaid at maturity.
97-8 Development Financial bond
2008.09.29- 2015.09.29
3.00% 1,600,000 1,600,000 50,532 Interest is paid annually. The principal is repaid at maturity.
97-9 Development Financial bond
2008.12.23- 2015.12.23
3.00% 6,400,000 6,400,000 202,129 Interest is paid annually. The principal is repaid at maturity.
99-1 Development Financial bond
2010.12.24- 2017.12.24
1.53% 10,300,000 10,300,000 325,301 Interest is paid annually. The principal is repaid at maturity.
100-1 Development Financial bond
2011.04.15- 2018.04.15
1.65% 4,700,000 4,700,000 148,438 Interest is paid annually. The principal is repaid at maturity.
100-2 Development Financial bond
2011.11.24- 2018.11.24
1.62% 7,900,000 7,900,000 249,503 Interest is paid annually. The principal is repaid at maturity.
101-1 Development Financial bond
2012.05.18- 2019.05.18
1.48% 1,300,000 1,300,000 41,057 Interest is paid annually. The principal is repaid at maturity.
103-1 Development Financial bond
2014.03.28- 2021.03.28
1.70% 4,900,000 4,900,000 154,755 Interest is paid annually. The principal is repaid at maturity.
103-2 Development Financial bond
2014.06.24- 2021.06.24
1.65% 7,100,000 7,100,000 224,236 Interest is paid annually.The principal is repaid at maturity.
Total $ 54,000,000 $ 1,705,461
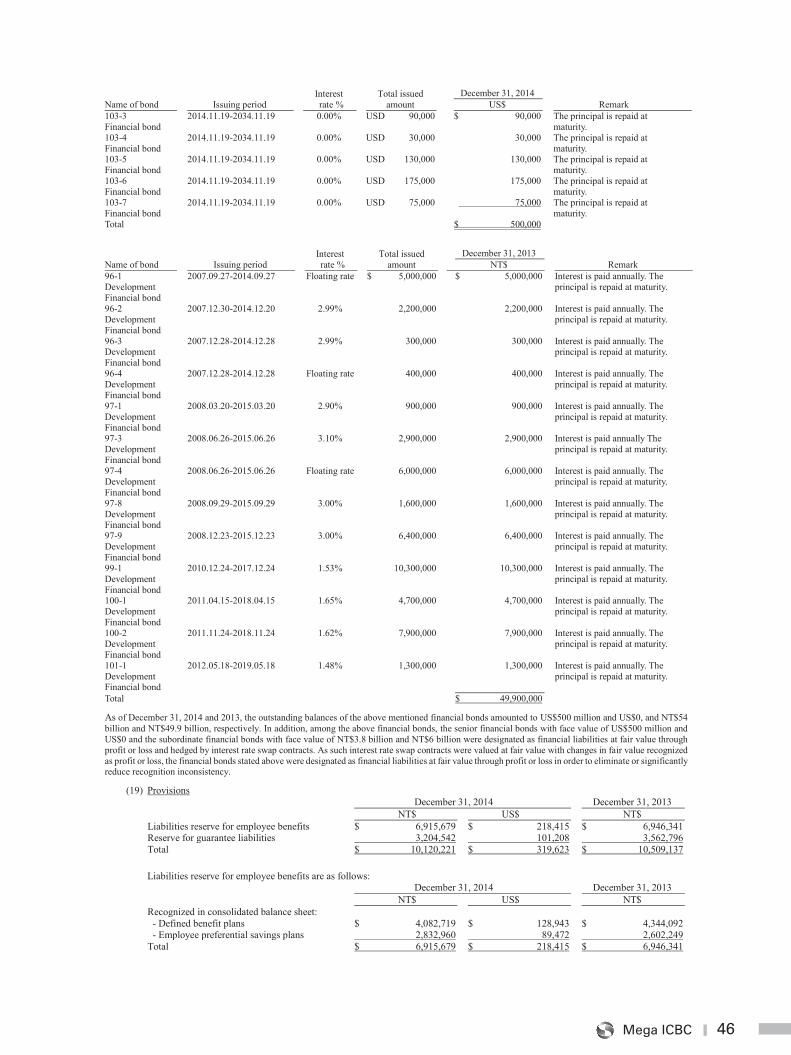
46Mega ICBC
46
Name of bond
Issuing period Interest
rate % Total issued
amount December 31, 2014
Remark US$ 103-3 Financial bond
2014.11.19-2034.11.19 0.00% USD 90,000 $ 90,000 The principal is repaid at maturity.
103-4 Financial bond
2014.11.19-2034.11.19 0.00% USD 30,000 30,000 The principal is repaid at maturity.
103-5 Financial bond
2014.11.19-2034.11.19 0.00% USD 130,000 130,000 The principal is repaid at maturity.
103-6 Financial bond
2014.11.19-2034.11.19 0.00% USD 175,000 175,000 The principal is repaid at maturity.
103-7 Financial bond
2014.11.19-2034.11.19 0.00% USD 75,000 75,000 The principal is repaid at maturity.
Total $ 500,000
Name of bond
Issuing period Interest
rate % Total issued
amount December 31, 2013
Remark NT$ 96-1 Development Financial bond
2007.09.27-2014.09.27 Floating rate $ 5,000,000 $ 5,000,000 Interest is paid annually. The principal is repaid at maturity.
96-2 Development Financial bond
2007.12.30-2014.12.20 2.99% 2,200,000 2,200,000 Interest is paid annually. The principal is repaid at maturity.
96-3 Development Financial bond
2007.12.28-2014.12.28 2.99% 300,000 300,000 Interest is paid annually. The principal is repaid at maturity.
96-4 Development Financial bond
2007.12.28-2014.12.28 Floating rate 400,000 400,000 Interest is paid annually. The principal is repaid at maturity.
97-1 Development Financial bond
2008.03.20-2015.03.20 2.90% 900,000 900,000 Interest is paid annually. The principal is repaid at maturity.
97-3 Development Financial bond
2008.06.26-2015.06.26 3.10% 2,900,000 2,900,000 Interest is paid annually The principal is repaid at maturity.
97-4 Development Financial bond
2008.06.26-2015.06.26 Floating rate 6,000,000 6,000,000 Interest is paid annually. The principal is repaid at maturity.
97-8 Development Financial bond
2008.09.29-2015.09.29 3.00% 1,600,000 1,600,000 Interest is paid annually. The principal is repaid at maturity.
97-9 Development Financial bond
2008.12.23-2015.12.23 3.00% 6,400,000 6,400,000 Interest is paid annually. The principal is repaid at maturity.
99-1 Development Financial bond
2010.12.24-2017.12.24 1.53% 10,300,000 10,300,000 Interest is paid annually. The principal is repaid at maturity.
100-1 Development Financial bond
2011.04.15-2018.04.15 1.65% 4,700,000 4,700,000 Interest is paid annually. The principal is repaid at maturity.
100-2 Development Financial bond
2011.11.24-2018.11.24 1.62% 7,900,000 7,900,000 Interest is paid annually. The principal is repaid at maturity.
101-1 Development Financial bond
2012.05.18-2019.05.18 1.48% 1,300,000 1,300,000 Interest is paid annually. The principal is repaid at maturity.
Total $ 49,900,000
As of December 31, 2014 and 2013, the outstanding balances of the above mentioned financial bonds amounted to US$500 million and US$0, and NT$54 billion and NT$49.9 billion, respectively. In addition, among the above financial bonds, the senior financial bonds with face value of US$500 million and US$0 and the subordinate financial bonds with face value of NT$3.8 billion and NT$6 billion were designated as financial liabilities at fair value through profit or loss and hedged by interest rate swap contracts. As such interest rate swap contracts were valued at fair value with changes in fair value recognized as profit or loss, the financial bonds stated above were designated as financial liabilities at fair value through profit or loss in order to eliminate or significantly reduce recognition inconsistency.
(19) Provisions December 31, 2014 December 31, 2013
NT$ US$ NT$ Liabilities reserve for employee benefits $ 6,915,679 $ 218,415 $ 6,946,341 Reserve for guarantee liabilities 3,204,542 101,208 3,562,796 Total $ 10,120,221 $ 319,623 $ 10,509,137
Liabilities reserve for employee benefits are as follows: December 31, 2014 December 31, 2013 NT$ US$ NT$ Recognized in consolidated balance sheet: - Defined benefit plans $ 4,082,719 $ 128,943 $ 4,344,092 - Employee preferential savings plans 2,832,960 89,472 2,602,249 Total $ 6,915,679 $ 218,415 $ 6,946,341
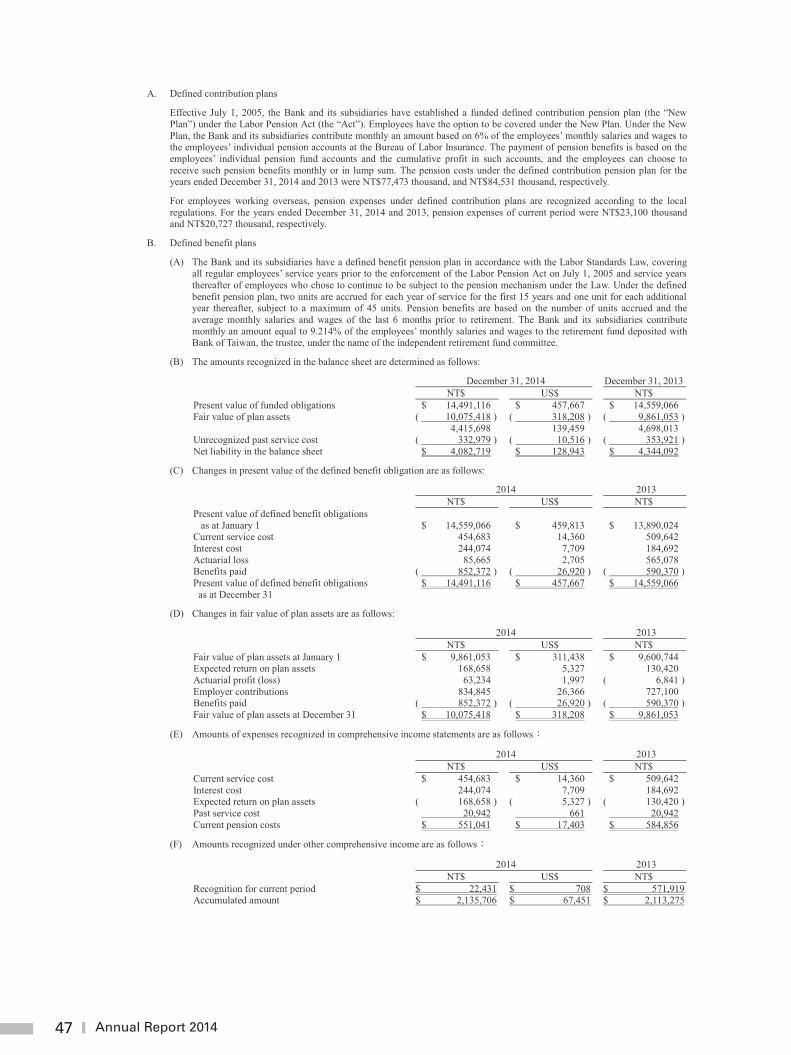
47 Annual Report 2014
47
A. Defined contribution plans
Effective July 1, 2005, the Bank and its subsidiaries have established a funded defined contribution pension plan (the “New Plan”) under the Labor Pension Act (the “Act”). Employees have the option to be covered under the New Plan. Under the New Plan, the Bank and its subsidiaries contribute monthly an amount based on 6% of the employees’ monthly salaries and wages to the employees’ individual pension accounts at the Bureau of Labor Insurance. The payment of pension benefits is based on the employees’ individual pension fund accounts and the cumulative profit in such accounts, and the employees can choose to receive such pension benefits monthly or in lump sum. The pension costs under the defined contribution pension plan for the years ended December 31, 2014 and 2013 were NT$77,473 thousand, and NT$84,531 thousand, respectively.
For employees working overseas, pension expenses under defined contribution plans are recognized according to the local regulations. For the years ended December 31, 2014 and 2013, pension expenses of current period were NT$23,100 thousand and NT$20,727 thousand, respectively.
B. Defined benefit plans
(A) The Bank and its subsidiaries have a defined benefit pension plan in accordance with the Labor Standards Law, covering all regular employees’ service years prior to the enforcement of the Labor Pension Act on July 1, 2005 and service years thereafter of employees who chose to continue to be subject to the pension mechanism under the Law. Under the defined benefit pension plan, two units are accrued for each year of service for the first 15 years and one unit for each additional year thereafter, subject to a maximum of 45 units. Pension benefits are based on the number of units accrued and the average monthly salaries and wages of the last 6 months prior to retirement. The Bank and its subsidiaries contribute monthly an amount equal to 9.214% of the employees’ monthly salaries and wages to the retirement fund deposited with Bank of Taiwan, the trustee, under the name of the independent retirement fund committee.
(B) The amounts recognized in the balance sheet are determined as follows:
December 31, 2014 December 31, 2013 NT$ US$ NT$ Present value of funded obligations $ 14,491,116 $ 457,667 $ 14,559,066 Fair value of plan assets ( 10,075,418 ) ( 318,208 ) ( 9,861,053 ) 4,415,698 139,459 4,698,013 Unrecognized past service cost ( 332,979 ) ( 10,516 ) ( 353,921 ) Net liability in the balance sheet $ 4,082,719 $ 128,943 $ 4,344,092
(C) Changes in present value of the defined benefit obligation are as follows:
2014 2013 NT$ US$ NT$ Present value of defined benefit obligations
as at January 1 $ 14,559,066 $ 459,813 $ 13,890,024 Current service cost 454,683 14,360 509,642 Interest cost 244,074 7,709 184,692 Actuarial loss 85,665 2,705 565,078 Benefits paid ( 852,372 ) ( 26,920 ) ( 590,370 ) Present value of defined benefit obligations as at December 31
$ 14,491,116 $ 457,667 $ 14,559,066
(D) Changes in fair value of plan assets are as follows:
2014 2013 NT$ US$ NT$ Fair value of plan assets at January 1 $ 9,861,053 $ 311,438 $ 9,600,744 Expected return on plan assets 168,658 5,327 130,420 Actuarial profit (loss) 63,234 1,997 ( 6,841 ) Employer contributions 834,845 26,366 727,100 Benefits paid ( 852,372 ) ( 26,920 ) ( 590,370 ) Fair value of plan assets at December 31 $ 10,075,418 $ 318,208 $ 9,861,053
(E) Amounts of expenses recognized in comprehensive income statements are as follows
2014 2013 NT$ US$ NT$ Current service cost $ 454,683 $ 14,360 $ 509,642 Interest cost 244,074 7,709 184,692 Expected return on plan assets ( 168,658 ) ( 5,327 ) ( 130,420 ) Past service cost 20,942 661 20,942 Current pension costs $ 551,041 $ 17,403 $ 584,856
(F) Amounts recognized under other comprehensive income are as follows
2014 2013 NT$ US$ NT$ Recognition for current period $ 22,431 $ 708 $ 571,919 Accumulated amount $ 2,135,706 $ 67,451 $ 2,113,275
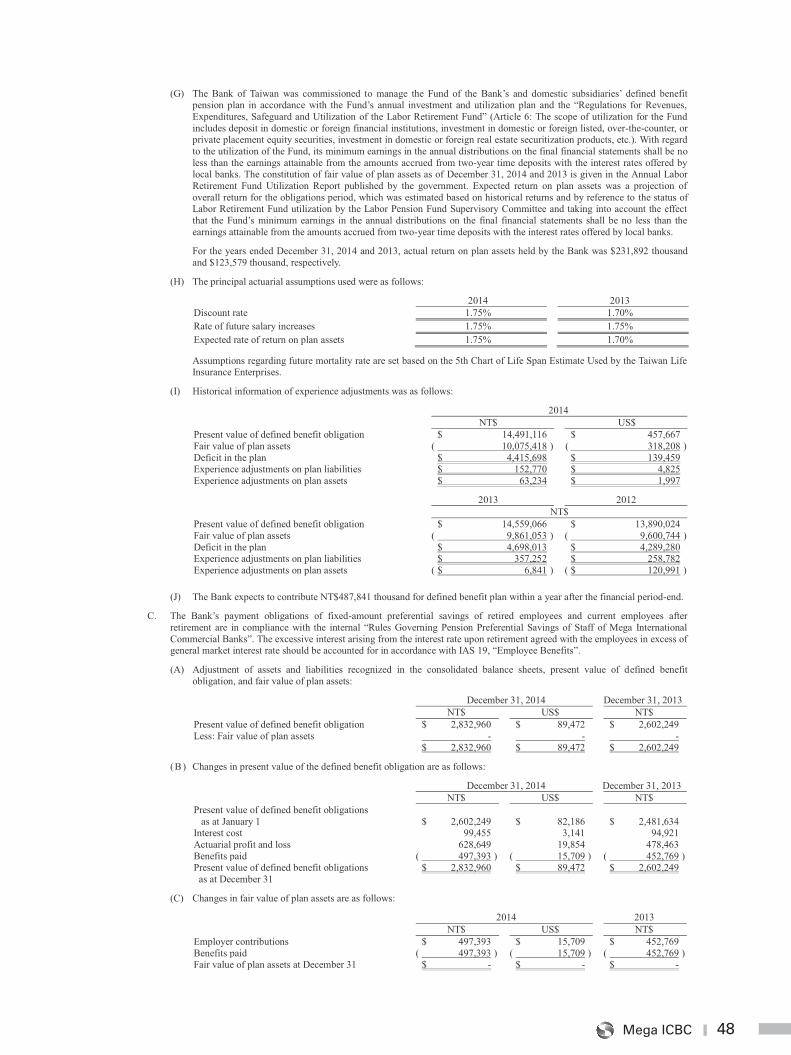
48Mega ICBC
48
(G) The Bank of Taiwan was commissioned to manage the Fund of the Bank’s and domestic subsidiaries’ defined benefit pension plan in accordance with the Fund’s annual investment and utilization plan and the “Regulations for Revenues, Expenditures, Safeguard and Utilization of the Labor Retirement Fund” (Article 6: The scope of utilization for the Fund includes deposit in domestic or foreign financial institutions, investment in domestic or foreign listed, over-the-counter, or private placement equity securities, investment in domestic or foreign real estate securitization products, etc.). With regard to the utilization of the Fund, its minimum earnings in the annual distributions on the final financial statements shall be no less than the earnings attainable from the amounts accrued from two-year time deposits with the interest rates offered by local banks. The constitution of fair value of plan assets as of December 31, 2014 and 2013 is given in the Annual Labor Retirement Fund Utilization Report published by the government. Expected return on plan assets was a projection of overall return for the obligations period, which was estimated based on historical returns and by reference to the status of Labor Retirement Fund utilization by the Labor Pension Fund Supervisory Committee and taking into account the effect that the Fund’s minimum earnings in the annual distributions on the final financial statements shall be no less than the earnings attainable from the amounts accrued from two-year time deposits with the interest rates offered by local banks.
For the years ended December 31, 2014 and 2013, actual return on plan assets held by the Bank was $231,892 thousand and $123,579 thousand, respectively.
(H) The principal actuarial assumptions used were as follows:
2014 2013 Discount rate 1.75% 1.70% Rate of future salary increases 1.75% 1.75% Expected rate of return on plan assets 1.75% 1.70%
Assumptions regarding future mortality rate are set based on the 5th Chart of Life Span Estimate Used by the Taiwan Life Insurance Enterprises.
(I) Historical information of experience adjustments was as follows:
2014 NT$ US$ Present value of defined benefit obligation $ 14,491,116 $ 457,667 Fair value of plan assets ( 10,075,418 ) ( 318,208 ) Deficit in the plan $ 4,415,698 $ 139,459 Experience adjustments on plan liabilities $ 152,770 $ 4,825 Experience adjustments on plan assets $ 63,234 $ 1,997
2013 2012 NT$ Present value of defined benefit obligation $ 14,559,066 $ 13,890,024 Fair value of plan assets ( 9,861,053 ) ( 9,600,744 ) Deficit in the plan $ 4,698,013 $ 4,289,280 Experience adjustments on plan liabilities $ 357,252 $ 258,782 Experience adjustments on plan assets ( $ 6,841 ) ( $ 120,991 )
(J) The Bank expects to contribute NT$487,841 thousand for defined benefit plan within a year after the financial period-end.
C. The Bank’s payment obligations of fixed-amount preferential savings of retired employees and current employees after retirement are in compliance with the internal “Rules Governing Pension Preferential Savings of Staff of Mega International Commercial Banks”. The excessive interest arising from the interest rate upon retirement agreed with the employees in excess of general market interest rate should be accounted for in accordance with IAS 19, “Employee Benefits”.
(A) Adjustment of assets and liabilities recognized in the consolidated balance sheets, present value of defined benefit obligation, and fair value of plan assets:
December 31, 2014 December 31, 2013 NT$ US$ NT$ Present value of defined benefit obligation $ 2,832,960 $ 89,472 $ 2,602,249 Less: Fair value of plan assets - - - $ 2,832,960 $ 89,472 $ 2,602,249
(B) Changes in present value of the defined benefit obligation are as follows:
December 31, 2014 December 31, 2013 NT$ US$ NT$ Present value of defined benefit obligations
as at January 1 $ 2,602,249
$ 82,186
$ 2,481,634 Interest cost 99,455 3,141 94,921 Actuarial profit and loss 628,649 19,854 478,463 Benefits paid ( 497,393 ) ( 15,709 ) ( 452,769 ) Present value of defined benefit obligations as at December 31
$ 2,832,960 $ 89,472 $ 2,602,249
(C) Changes in fair value of plan assets are as follows:
2014 2013 NT$ US$ NT$ Employer contributions $ 497,393 $ 15,709 $ 452,769 Benefits paid ( 497,393 ) ( 15,709 ) ( 452,769 ) Fair value of plan assets at December 31 $ - $ - $ -
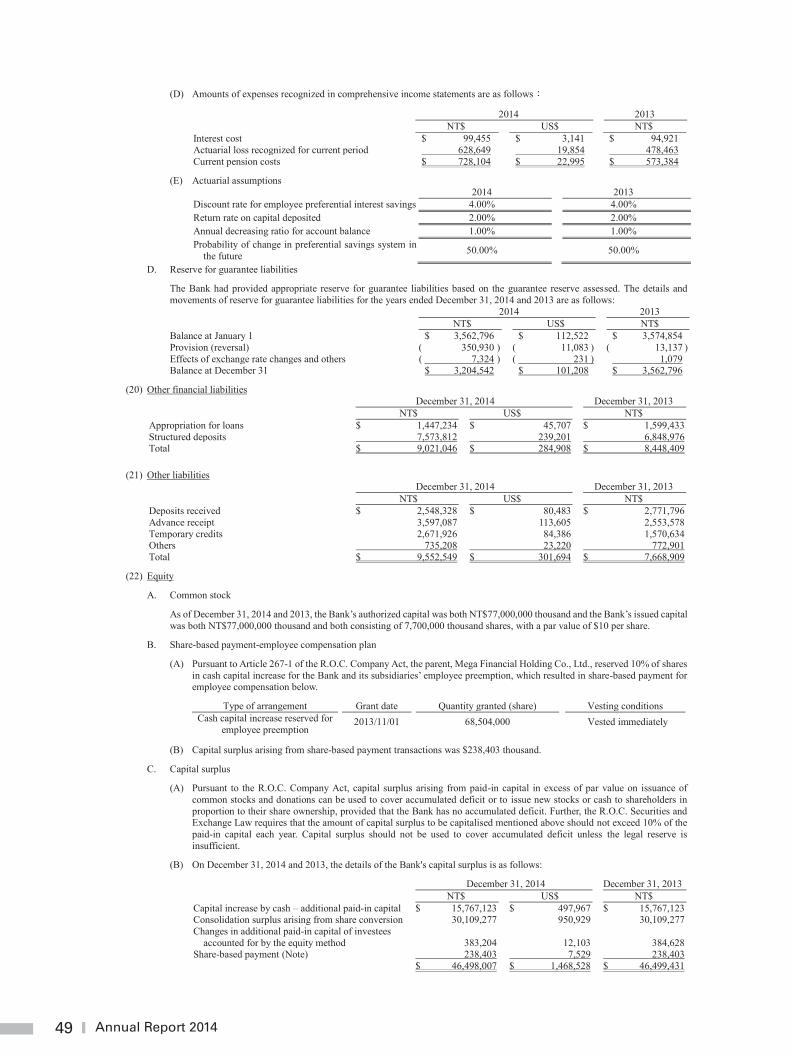
49 Annual Report 2014
49
(D) Amounts of expenses recognized in comprehensive income statements are as follows
2014 2013 NT$ US$ NT$ Interest cost $ 99,455 $ 3,141 $ 94,921 Actuarial loss recognized for current period 628,649 19,854 478,463 Current pension costs $ 728,104 $ 22,995 $ 573,384
(E) Actuarial assumptions 2014 2013 Discount rate for employee preferential interest savings 4.00% 4.00% Return rate on capital deposited 2.00% 2.00% Annual decreasing ratio for account balance 1.00% 1.00% Probability of change in preferential savings system in
the future 50.00% 50.00%
D. Reserve for guarantee liabilities
The Bank had provided appropriate reserve for guarantee liabilities based on the guarantee reserve assessed. The details and movements of reserve for guarantee liabilities for the years ended December 31, 2014 and 2013 are as follows: 2014 2013 NT$ US$ NT$ Balance at January 1 $ 3,562,796 $ 112,522 $ 3,574,854 Provision (reversal) ( 350,930 ) ( 11,083 ) ( 13,137 ) Effects of exchange rate changes and others ( 7,324 ) ( 231 ) 1,079 Balance at December 31 $ 3,204,542 $ 101,208 $ 3,562,796
(20) Other financial liabilities December 31, 2014 December 31, 2013 NT$ US$ NT$ Appropriation for loans $ 1,447,234 $ 45,707 $ 1,599,433 Structured deposits 7,573,812 239,201 6,848,976 Total $ 9,021,046 $ 284,908 $ 8,448,409
(21) Other liabilities December 31, 2014 December 31, 2013 NT$ US$ NT$ Deposits received $ 2,548,328 $ 80,483 $ 2,771,796 Advance receipt 3,597,087 113,605 2,553,578 Temporary credits 2,671,926 84,386 1,570,634 Others 735,208 23,220 772,901 Total $ 9,552,549 $ 301,694 $ 7,668,909
(22) Equity
A. Common stock
As of December 31, 2014 and 2013, the Bank’s authorized capital was both NT$77,000,000 thousand and the Bank’s issued capital was both NT$77,000,000 thousand and both consisting of 7,700,000 thousand shares, with a par value of $10 per share.
B. Share-based payment-employee compensation plan
(A) Pursuant to Article 267-1 of the R.O.C. Company Act, the parent, Mega Financial Holding Co., Ltd., reserved 10% of shares in cash capital increase for the Bank and its subsidiaries’ employee preemption, which resulted in share-based payment for employee compensation below.
Type of arrangement Grant date Quantity granted (share) Vesting conditions Cash capital increase reserved for
employee preemption 2013/11/01 68,504,000 Vested immediately
(B) Capital surplus arising from share-based payment transactions was $238,403 thousand.
C. Capital surplus
(A) Pursuant to the R.O.C. Company Act, capital surplus arising from paid-in capital in excess of par value on issuance of common stocks and donations can be used to cover accumulated deficit or to issue new stocks or cash to shareholders in proportion to their share ownership, provided that the Bank has no accumulated deficit. Further, the R.O.C. Securities and Exchange Law requires that the amount of capital surplus to be capitalised mentioned above should not exceed 10% of the paid-in capital each year. Capital surplus should not be used to cover accumulated deficit unless the legal reserve is insufficient.
(B) On December 31, 2014 and 2013, the details of the Bank's capital surplus is as follows:
December 31, 2014 December 31, 2013 NT$ US$ NT$ Capital increase by cash – additional paid-in capital $ 15,767,123 $ 497,967 $ 15,767,123 Consolidation surplus arising from share conversion 30,109,277 950,929 30,109,277 Changes in additional paid-in capital of investees
accounted for by the equity method 383,204 12,103 384,628 Share-based payment (Note) 238,403 7,529 238,403 $ 46,498,007 $ 1,468,528 $ 46,499,431
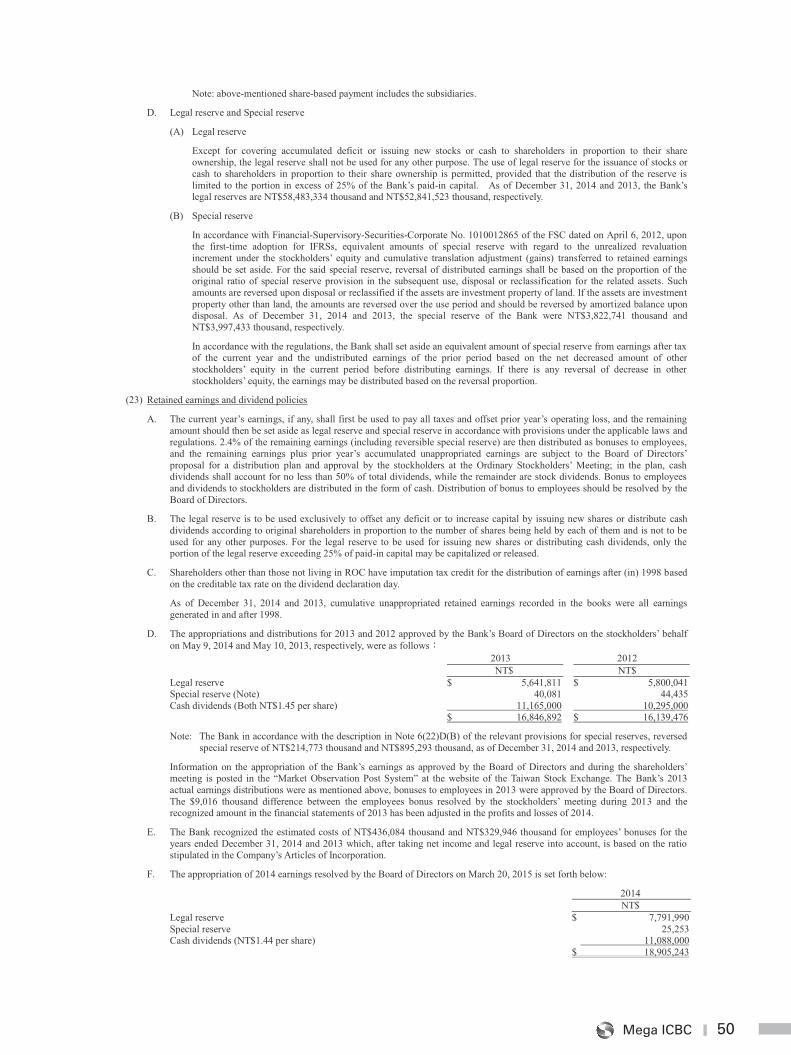
50Mega ICBC
50
Note: above-mentioned share-based payment includes the subsidiaries.
D. Legal reserve and Special reserve
(A) Legal reserve
Except for covering accumulated deficit or issuing new stocks or cash to shareholders in proportion to their share ownership, the legal reserve shall not be used for any other purpose. The use of legal reserve for the issuance of stocks or cash to shareholders in proportion to their share ownership is permitted, provided that the distribution of the reserve is limited to the portion in excess of 25% of the Bank’s paid-in capital. As of December 31, 2014 and 2013, the Bank’s legal reserves are NT$58,483,334 thousand and NT$52,841,523 thousand, respectively.
(B) Special reserve
In accordance with Financial-Supervisory-Securities-Corporate No. 1010012865 of the FSC dated on April 6, 2012, upon the first-time adoption for IFRSs, equivalent amounts of special reserve with regard to the unrealized revaluation increment under the stockholders’ equity and cumulative translation adjustment (gains) transferred to retained earnings should be set aside. For the said special reserve, reversal of distributed earnings shall be based on the proportion of the original ratio of special reserve provision in the subsequent use, disposal or reclassification for the related assets. Such amounts are reversed upon disposal or reclassified if the assets are investment property of land. If the assets are investment property other than land, the amounts are reversed over the use period and should be reversed by amortized balance upon disposal. As of December 31, 2014 and 2013, the special reserve of the Bank were NT$3,822,741 thousand and NT$3,997,433 thousand, respectively.
In accordance with the regulations, the Bank shall set aside an equivalent amount of special reserve from earnings after tax of the current year and the undistributed earnings of the prior period based on the net decreased amount of other stockholders’ equity in the current period before distributing earnings. If there is any reversal of decrease in other stockholders’ equity, the earnings may be distributed based on the reversal proportion.
(23) Retained earnings and dividend policies
A. The current year’s earnings, if any, shall first be used to pay all taxes and offset prior year’s operating loss, and the remaining amount should then be set aside as legal reserve and special reserve in accordance with provisions under the applicable laws and regulations. 2.4% of the remaining earnings (including reversible special reserve) are then distributed as bonuses to employees, and the remaining earnings plus prior year’s accumulated unappropriated earnings are subject to the Board of Directors’ proposal for a distribution plan and approval by the stockholders at the Ordinary Stockholders’ Meeting; in the plan, cash dividends shall account for no less than 50% of total dividends, while the remainder are stock dividends. Bonus to employees and dividends to stockholders are distributed in the form of cash. Distribution of bonus to employees should be resolved by the Board of Directors.
B. The legal reserve is to be used exclusively to offset any deficit or to increase capital by issuing new shares or distribute cash dividends according to original shareholders in proportion to the number of shares being held by each of them and is not to be used for any other purposes. For the legal reserve to be used for issuing new shares or distributing cash dividends, only the portion of the legal reserve exceeding 25% of paid-in capital may be capitalized or released.
C. Shareholders other than those not living in ROC have imputation tax credit for the distribution of earnings after (in) 1998 based on the creditable tax rate on the dividend declaration day.
As of December 31, 2014 and 2013, cumulative unappropriated retained earnings recorded in the books were all earnings generated in and after 1998.
D. The appropriations and distributions for 2013 and 2012 approved by the Bank’s Board of Directors on the stockholders’ behalf on May 9, 2014 and May 10, 2013, respectively, were as follows 2013 2012 NT$ NT$ Legal reserve $ 5,641,811 $ 5,800,041 Special reserve (Note) 40,081 44,435 Cash dividends (Both NT$1.45 per share) 11,165,000 10,295,000 $ 16,846,892 $ 16,139,476
Note: The Bank in accordance with the description in Note 6(22)D(B) of the relevant provisions for special reserves, reversed special reserve of NT$214,773 thousand and NT$895,293 thousand, as of December 31, 2014 and 2013, respectively.
Information on the appropriation of the Bank’s earnings as approved by the Board of Directors and during the shareholders’ meeting is posted in the “Market Observation Post System” at the website of the Taiwan Stock Exchange. The Bank’s 2013 actual earnings distributions were as mentioned above, bonuses to employees in 2013 were approved by the Board of Directors. The $9,016 thousand difference between the employees bonus resolved by the stockholders’ meeting during 2013 and the recognized amount in the financial statements of 2013 has been adjusted in the profits and losses of 2014.
E. The Bank recognized the estimated costs of NT$436,084 thousand and NT$329,946 thousand for employees’ bonuses for the years ended December 31, 2014 and 2013 which, after taking net income and legal reserve into account, is based on the ratio stipulated in the Company’s Articles of Incorporation.
F. The appropriation of 2014 earnings resolved by the Board of Directors on March 20, 2015 is set forth below:
2014 NT$ Legal reserve $ 7,791,990 Special reserve 25,253 Cash dividends (NT$1.44 per share) 11,088,000 $ 18,905,243
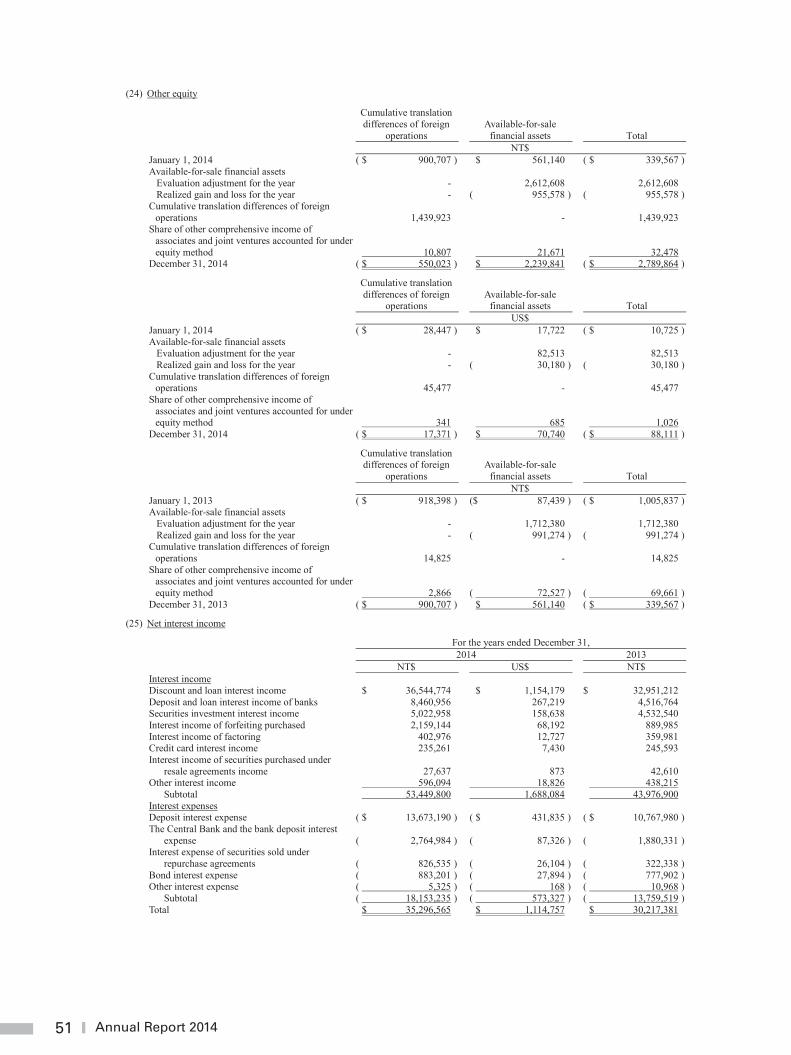
51 Annual Report 2014
51
(24) Other equity
Cumulative translation differences of foreign
operations
Available-for-sale
financial assets
Total NT$ January 1, 2014 ( $ 900,707 ) $ 561,140 ( $ 339,567 ) Available-for-sale financial assets
Evaluation adjustment for the year - 2,612,608 2,612,608 Realized gain and loss for the year - ( 955,578 ) ( 955,578 )
Cumulative translation differences of foreign operations 1,439,923
-
1,439,923
Share of other comprehensive income of associates and joint ventures accounted for under equity method 10,807
21,671
32,478 December 31, 2014 ( $ 550,023 ) $ 2,239,841 ( $ 2,789,864 )
Cumulative translation differences of foreign
operations
Available-for-sale
financial assets
Total US$ January 1, 2014 ( $ 28,447 ) $ 17,722 ( $ 10,725 ) Available-for-sale financial assets
Evaluation adjustment for the year - 82,513 82,513 Realized gain and loss for the year - ( 30,180 ) ( 30,180 )
Cumulative translation differences of foreign operations 45,477
-
45,477
Share of other comprehensive income of associates and joint ventures accounted for under equity method 341
685
1,026 December 31, 2014 ( $ 17,371 ) $ 70,740 ( $ 88,111 )
Cumulative translation differences of foreign
operations
Available-for-sale
financial assets
Total NT$ January 1, 2013 ( $ 918,398 ) ($ 87,439 ) ( $ 1,005,837 ) Available-for-sale financial assets
Evaluation adjustment for the year - 1,712,380 1,712,380 Realized gain and loss for the year - ( 991,274 ) ( 991,274 )
Cumulative translation differences of foreign operations 14,825
-
14,825
Share of other comprehensive income of associates and joint ventures accounted for under equity method 2,866
( 72,527 )
( 69,661 ) December 31, 2013 ( $ 900,707 ) $ 561,140 ( $ 339,567 )
(25) Net interest income
For the years ended December 31, 2014 2013 NT$ US$ NT$ Interest income Discount and loan interest income $ 36,544,774 $ 1,154,179 $ 32,951,212 Deposit and loan interest income of banks 8,460,956 267,219 4,516,764 Securities investment interest income 5,022,958 158,638 4,532,540 Interest income of forfeiting purchased 2,159,144 68,192 889,985 Interest income of factoring 402,976 12,727 359,981 Credit card interest income 235,261 7,430 245,593 Interest income of securities purchased under
resale agreements income 27,637 873 42,610 Other interest income 596,094 18,826 438,215
Subtotal 53,449,800 1,688,084 43,976,900 Interest expenses Deposit interest expense ( $ 13,673,190 ) ( $ 431,835 ) ( $ 10,767,980 ) The Central Bank and the bank deposit interest
expense ( 2,764,984 ) ( 87,326 ) ( 1,880,331 ) Interest expense of securities sold under
repurchase agreements ( 826,535 ) ( 26,104 ) ( 322,338 ) Bond interest expense ( 883,201 ) ( 27,894 ) ( 777,902 ) Other interest expense ( 5,325 ) ( 168 ) ( 10,968 )
Subtotal ( 18,153,235 ) ( 573,327 ) ( 13,759,519 ) Total $ 35,296,565 $ 1,114,757 $ 30,217,381
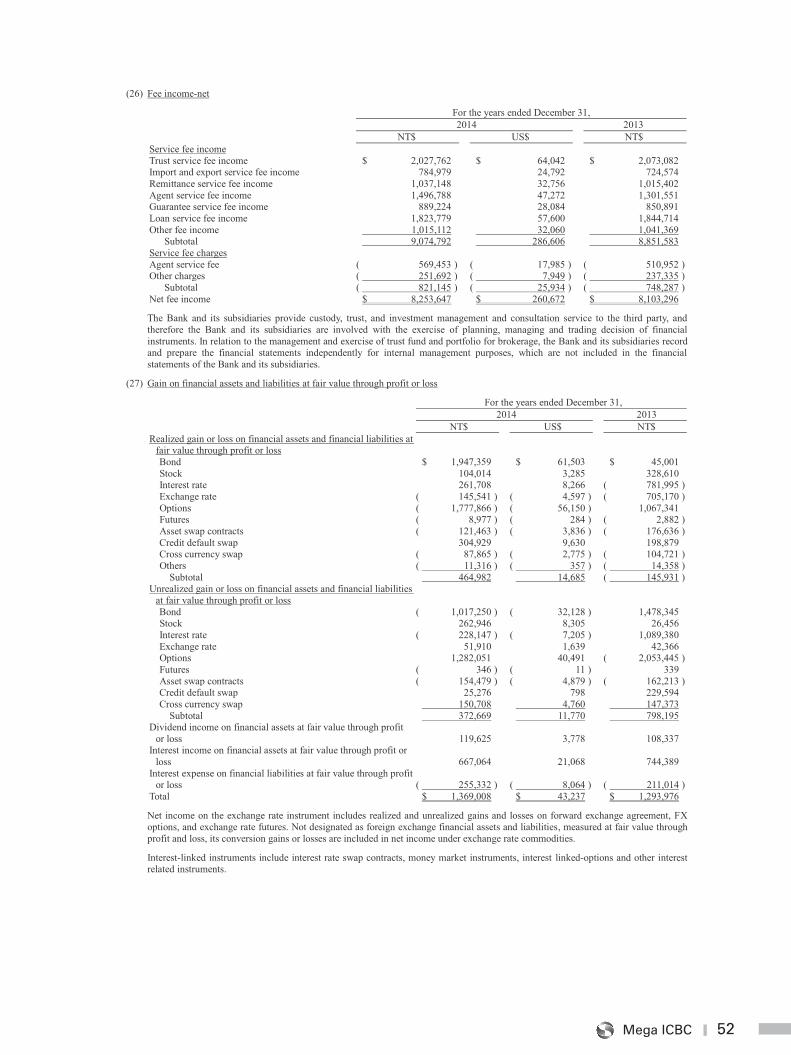
52Mega ICBC
52
(26) Fee income-net
For the years ended December 31, 2014 2013 NT$ US$ NT$ Service fee income Trust service fee income $ 2,027,762 $ 64,042 $ 2,073,082 Import and export service fee income 784,979 24,792 724,574 Remittance service fee income 1,037,148 32,756 1,015,402 Agent service fee income 1,496,788 47,272 1,301,551 Guarantee service fee income 889,224 28,084 850,891 Loan service fee income 1,823,779 57,600 1,844,714 Other fee income 1,015,112 32,060 1,041,369
Subtotal 9,074,792 286,606 8,851,583 Service fee charges Agent service fee ( 569,453 ) ( 17,985 ) ( 510,952 ) Other charges ( 251,692 ) ( 7,949 ) ( 237,335 )
Subtotal ( 821,145 ) ( 25,934 ) ( 748,287 ) Net fee income $ 8,253,647 $ 260,672 $ 8,103,296
The Bank and its subsidiaries provide custody, trust, and investment management and consultation service to the third party, and therefore the Bank and its subsidiaries are involved with the exercise of planning, managing and trading decision of financial instruments. In relation to the management and exercise of trust fund and portfolio for brokerage, the Bank and its subsidiaries record and prepare the financial statements independently for internal management purposes, which are not included in the financial statements of the Bank and its subsidiaries.
(27) Gain on financial assets and liabilities at fair value through profit or loss
For the years ended December 31, 2014 2013 NT$ US$ NT$ Realized gain or loss on financial assets and financial liabilities at
fair value through profit or loss
Bond $ 1,947,359 $ 61,503 $ 45,001 Stock 104,014 3,285 328,610 Interest rate 261,708 8,266 ( 781,995 ) Exchange rate ( 145,541 ) ( 4,597 ) ( 705,170 ) Options ( 1,777,866 ) ( 56,150 ) 1,067,341 Futures ( 8,977 ) ( 284 ) ( 2,882 ) Asset swap contracts ( 121,463 ) ( 3,836 ) ( 176,636 ) Credit default swap 304,929 9,630 198,879 Cross currency swap ( 87,865 ) ( 2,775 ) ( 104,721 ) Others ( 11,316 ) ( 357 ) ( 14,358 ) Subtotal 464,982 14,685 ( 145,931 ) Unrealized gain or loss on financial assets and financial liabilities
at fair value through profit or loss
Bond ( 1,017,250 ) ( 32,128 ) 1,478,345 Stock 262,946 8,305 26,456 Interest rate ( 228,147 ) ( 7,205 ) 1,089,380 Exchange rate 51,910 1,639 42,366 Options 1,282,051 40,491 ( 2,053,445 ) Futures ( 346 ) ( 11 ) 339 Asset swap contracts ( 154,479 ) ( 4,879 ) ( 162,213 ) Credit default swap 25,276 798 229,594 Cross currency swap 150,708 4,760 147,373 Subtotal 372,669 11,770 798,195 Dividend income on financial assets at fair value through profit
or loss 119,625 3,778 108,337 Interest income on financial assets at fair value through profit or
loss 667,064 21,068 744,389 Interest expense on financial liabilities at fair value through profit
or loss ( 255,332 ) ( 8,064 ) ( 211,014 ) Total $ 1,369,008 $ 43,237 $ 1,293,976
Net income on the exchange rate instrument includes realized and unrealized gains and losses on forward exchange agreement, FX options, and exchange rate futures. Not designated as foreign exchange financial assets and liabilities, measured at fair value through profit and loss, its conversion gains or losses are included in net income under exchange rate commodities.
Interest-linked instruments include interest rate swap contracts, money market instruments, interest linked-options and other interest related instruments.
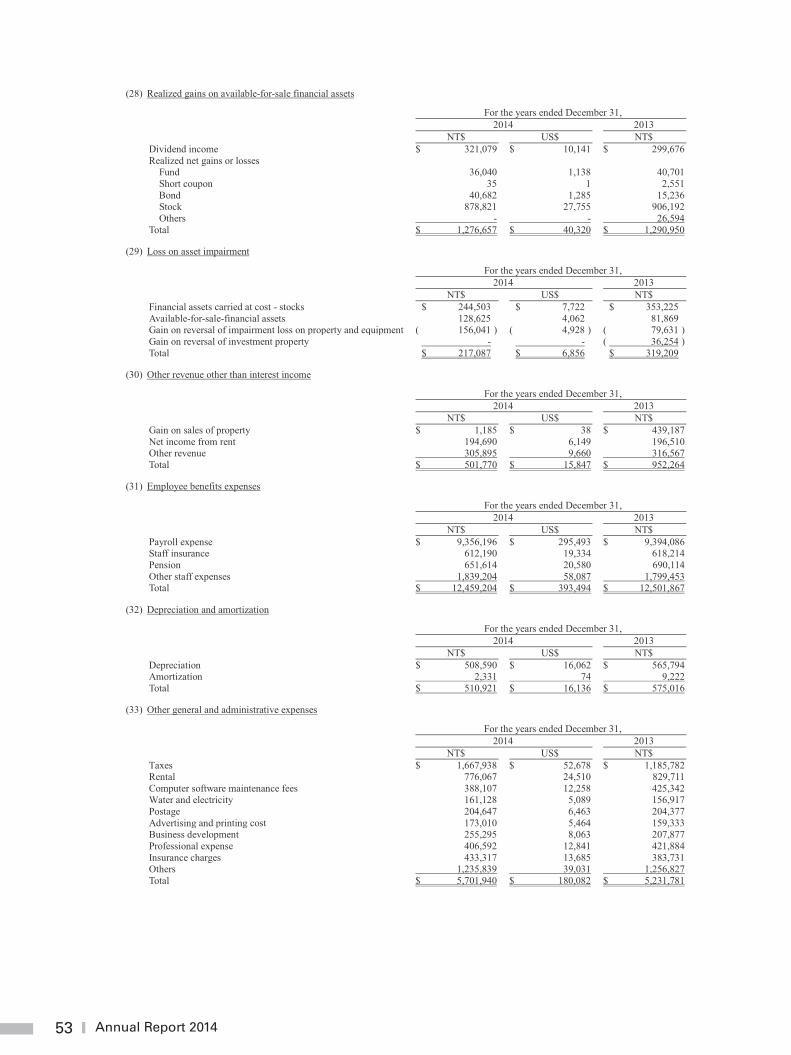
53 Annual Report 2014
53
(28) Realized gains on available-for-sale financial assets
For the years ended December 31, 2014 2013 NT$ US$ NT$ Dividend income $ 321,079 $ 10,141 $ 299,676 Realized net gains or losses Fund 36,040 1,138 40,701 Short coupon 35 1 2,551 Bond 40,682 1,285 15,236 Stock 878,821 27,755 906,192 Others - - 26,594 Total $ 1,276,657 $ 40,320 $ 1,290,950
(29) Loss on asset impairment
For the years ended December 31, 2014 2013 NT$ US$ NT$ Financial assets carried at cost - stocks $ 244,503 $ 7,722 $ 353,225 Available-for-sale-financial assets 128,625 4,062 81,869 Gain on reversal of impairment loss on property and equipment ( 156,041 ) ( 4,928 ) ( 79,631 ) Gain on reversal of investment property - - ( 36,254 ) Total $ 217,087 $ 6,856 $ 319,209
(30) Other revenue other than interest income
For the years ended December 31, 2014 2013 NT$ US$ NT$ Gain on sales of property $ 1,185 $ 38 $ 439,187 Net income from rent 194,690 6,149 196,510 Other revenue 305,895 9,660 316,567 Total $ 501,770 $ 15,847 $ 952,264
(31) Employee benefits expenses
For the years ended December 31, 2014 2013 NT$ US$ NT$ Payroll expense $ 9,356,196 $ 295,493 $ 9,394,086 Staff insurance 612,190 19,334 618,214 Pension 651,614 20,580 690,114 Other staff expenses 1,839,204 58,087 1,799,453 Total $ 12,459,204 $ 393,494 $ 12,501,867
(32) Depreciation and amortization
For the years ended December 31, 2014 2013 NT$ US$ NT$ Depreciation $ 508,590 $ 16,062 $ 565,794 Amortization 2,331 74 9,222 Total $ 510,921 $ 16,136 $ 575,016
(33) Other general and administrative expenses
For the years ended December 31, 2014 2013 NT$ US$ NT$ Taxes $ 1,667,938 $ 52,678 $ 1,185,782 Rental 776,067 24,510 829,711 Computer software maintenance fees 388,107 12,258 425,342 Water and electricity 161,128 5,089 156,917 Postage 204,647 6,463 204,377 Advertising and printing cost 173,010 5,464 159,333 Business development 255,295 8,063 207,877 Professional expense 406,592 12,841 421,884 Insurance charges 433,317 13,685 383,731 Others 1,235,839 39,031 1,256,827 Total $ 5,701,940 $ 180,082 $ 5,231,781
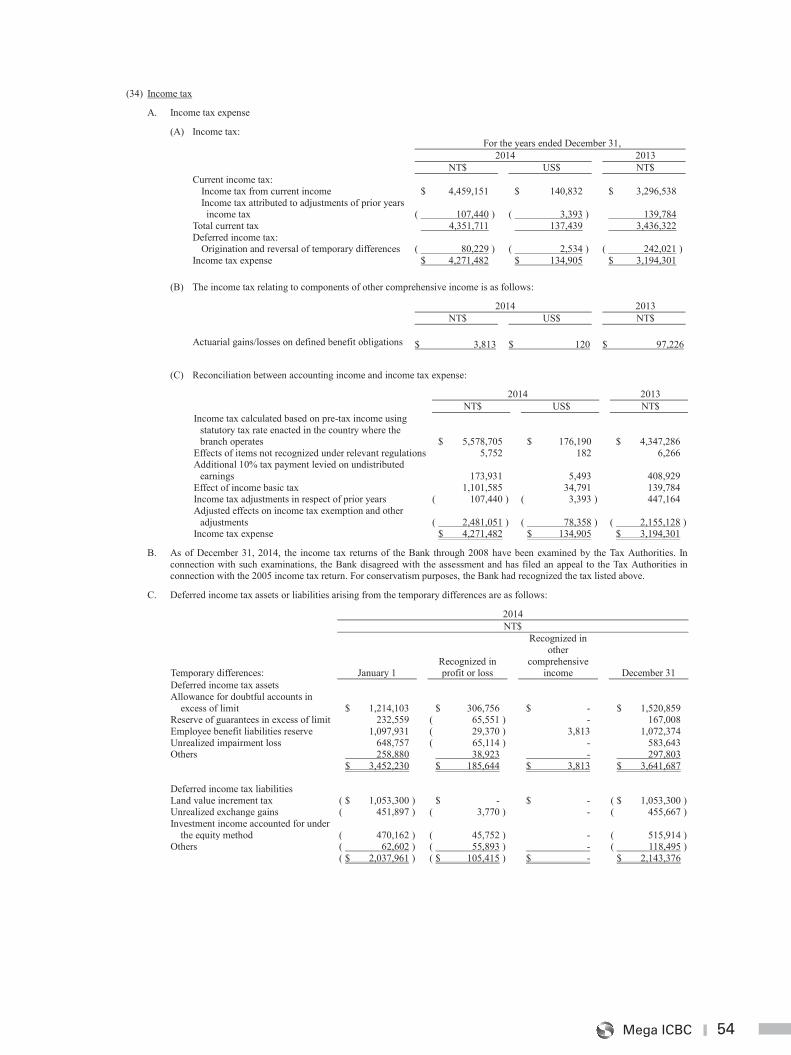
54Mega ICBC
54
(34) Income tax
A. Income tax expense
(A) Income tax: For the years ended December 31, 2014 2013 NT$ US$ NT$ Current income tax:
Income tax from current income $ 4,459,151 $ 140,832 $ 3,296,538 Income tax attributed to adjustments of prior years income tax ( 107,440 ) ( 3,393 ) 139,784
Total current tax 4,351,711 137,439 3,436,322 Deferred income tax:
Origination and reversal of temporary differences ( 80,229 ) ( 2,534 ) ( 242,021 ) Income tax expense $ 4,271,482 $ 134,905 $ 3,194,301
(B) The income tax relating to components of other comprehensive income is as follows:
2014 2013 NT$ US$ NT$ Actuarial gains/losses on defined benefit obligations $ 3,813 $ 120 $ 97,226
(C) Reconciliation between accounting income and income tax expense:
2014 2013 NT$ US$ NT$ Income tax calculated based on pre-tax income using
statutory tax rate enacted in the country where the branch operates $ 5,578,705 $ 176,190 $ 4,347,286
Effects of items not recognized under relevant regulations 5,752 182 6,266 Additional 10% tax payment levied on undistributed
earnings 173,931 5,493 408,929 Effect of income basic tax 1,101,585 34,791 139,784 Income tax adjustments in respect of prior years ( 107,440 ) ( 3,393 ) 447,164 Adjusted effects on income tax exemption and other
adjustments ( 2,481,051 ) ( 78,358 ) ( 2,155,128 ) Income tax expense $ 4,271,482 $ 134,905 $ 3,194,301
B. As of December 31, 2014, the income tax returns of the Bank through 2008 have been examined by the Tax Authorities. In connection with such examinations, the Bank disagreed with the assessment and has filed an appeal to the Tax Authorities in connection with the 2005 income tax return. For conservatism purposes, the Bank had recognized the tax listed above.
C. Deferred income tax assets or liabilities arising from the temporary differences are as follows:
2014 NT$
Temporary differences: January 1
Recognized in profit or loss
Recognized in other
comprehensive income
December 31 Deferred income tax assets Allowance for doubtful accounts in
excess of limit $ 1,214,103
$ 306,756 $ - $ 1,520,859 Reserve of guarantees in excess of limit 232,559 ( 65,551 ) - 167,008 Employee benefit liabilities reserve 1,097,931 ( 29,370 ) 3,813 1,072,374 Unrealized impairment loss 648,757 ( 65,114 ) - 583,643 Others 258,880 38,923 - 297,803 $ 3,452,230 $ 185,644 $ 3,813 $ 3,641,687 Deferred income tax liabilities Land value increment tax ( $ 1,053,300 ) $ - $ - ( $ 1,053,300 ) Unrealized exchange gains ( 451,897 ) ( 3,770 ) - ( 455,667 ) Investment income accounted for under
the equity method ( 470,162 ) ( 45,752 ) - ( 515,914 )
Others ( 62,602 ) ( 55,893 ) - ( 118,495 ) ( $ 2,037,961 ) ( $ 105,415 ) $ - $ 2,143,376
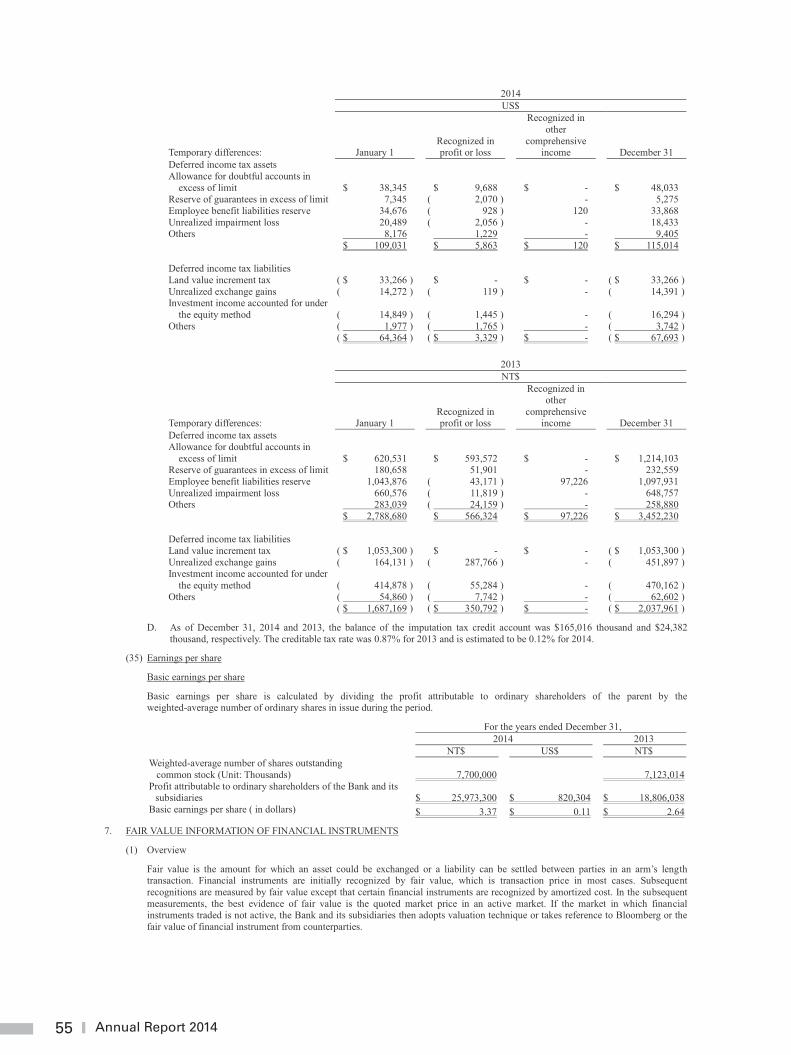
55 Annual Report 2014
55
2014 US$
Temporary differences: January 1
Recognized in profit or loss
Recognized in other
comprehensive income
December 31 Deferred income tax assets Allowance for doubtful accounts in
excess of limit $ 38,345 $ 9,688 $ - $ 48,033 Reserve of guarantees in excess of limit 7,345 ( 2,070 ) - 5,275 Employee benefit liabilities reserve 34,676 ( 928 ) 120 33,868 Unrealized impairment loss 20,489 ( 2,056 ) - 18,433 Others 8,176 1,229 - 9,405 $ 109,031 $ 5,863 $ 120 $ 115,014 Deferred income tax liabilities Land value increment tax ( $ 33,266 ) $ - $ - ( $ 33,266 ) Unrealized exchange gains ( 14,272 ) ( 119 ) - ( 14,391 ) Investment income accounted for under
the equity method ( 14,849 ) ( 1,445 ) - ( 16,294 )
Others ( 1,977 ) ( 1,765 ) - ( 3,742 ) ( $ 64,364 ) ( $ 3,329 ) $ - ( $ 67,693 )
2013 NT$
Temporary differences: January 1
Recognized in profit or loss
Recognized in other
comprehensive income
December 31 Deferred income tax assets Allowance for doubtful accounts in
excess of limit $ 620,531
$ 593,572
$ -
$ 1,214,103 Reserve of guarantees in excess of limit 180,658 51,901 - 232,559 Employee benefit liabilities reserve 1,043,876 ( 43,171 ) 97,226 1,097,931 Unrealized impairment loss 660,576 ( 11,819 ) - 648,757 Others 283,039 ( 24,159 ) - 258,880 $ 2,788,680 $ 566,324 $ 97,226 $ 3,452,230 Deferred income tax liabilities Land value increment tax ( $ 1,053,300 ) $ - $ - ( $ 1,053,300 ) Unrealized exchange gains ( 164,131 ) ( 287,766 ) - ( 451,897 ) Investment income accounted for under
the equity method ( 414,878 )
( 55,284 )
-
( 470,162 ) Others ( 54,860 ) ( 7,742 ) - ( 62,602 ) ( $ 1,687,169 ) ( $ 350,792 ) $ - ( $ 2,037,961 )
D. As of December 31, 2014 and 2013, the balance of the imputation tax credit account was $165,016 thousand and $24,382 thousand, respectively. The creditable tax rate was 0.87% for 2013 and is estimated to be 0.12% for 2014.
(35) Earnings per share
Basic earnings per share
Basic earnings per share is calculated by dividing the profit attributable to ordinary shareholders of the parent by the weighted-average number of ordinary shares in issue during the period.
For the years ended December 31, 2014 2013 NT$ US$ NT$ Weighted-average number of shares outstanding
common stock (Unit: Thousands) 7,700,000 7,123,014
Profit attributable to ordinary shareholders of the Bank and its subsidiaries $ 25,973,300
$ 820,304
$ 18,806,038
Basic earnings per share ( in dollars) $ 3.37 $ 0.11 $ 2.64
7. FAIR VALUE INFORMATION OF FINANCIAL INSTRUMENTS
(1) Overview
Fair value is the amount for which an asset could be exchanged or a liability can be settled between parties in an arm’s length transaction. Financial instruments are initially recognized by fair value, which is transaction price in most cases. Subsequent recognitions are measured by fair value except that certain financial instruments are recognized by amortized cost. In the subsequent measurements, the best evidence of fair value is the quoted market price in an active market. If the market in which financial instruments traded is not active, the Bank and its subsidiaries then adopts valuation technique or takes reference to Bloomberg or the fair value of financial instrument from counterparties.
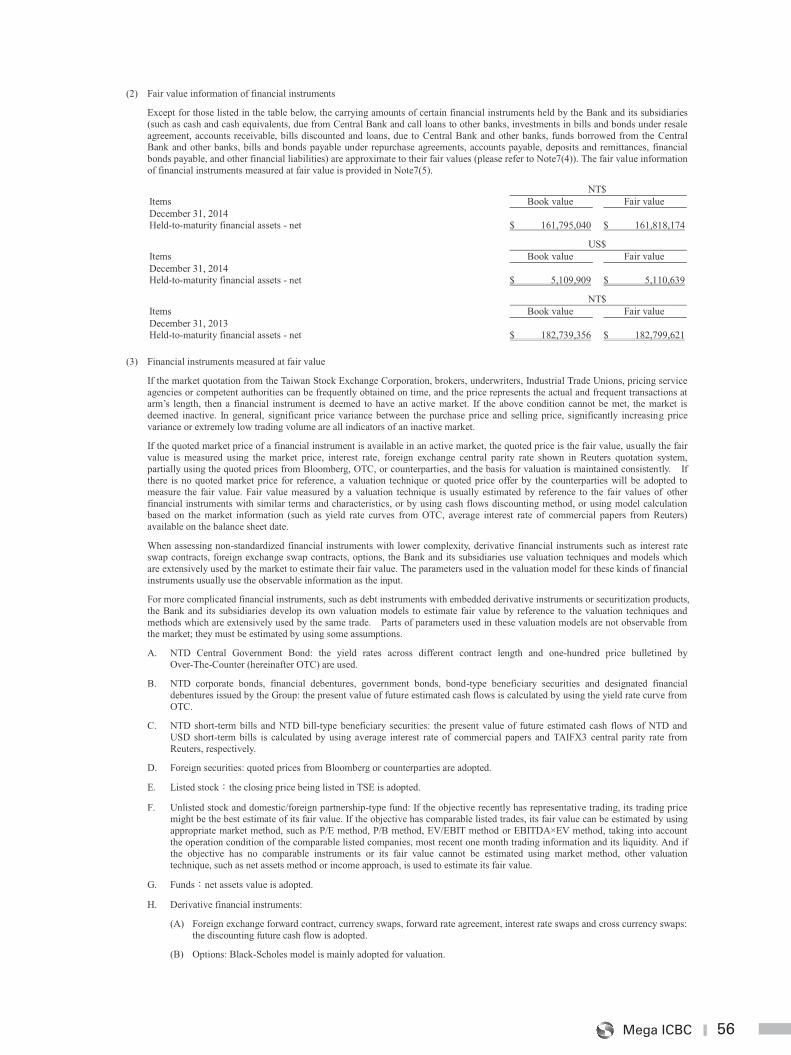
56Mega ICBC
56
(2) Fair value information of financial instruments
Except for those listed in the table below, the carrying amounts of certain financial instruments held by the Bank and its subsidiaries (such as cash and cash equivalents, due from Central Bank and call loans to other banks, investments in bills and bonds under resale agreement, accounts receivable, bills discounted and loans, due to Central Bank and other banks, funds borrowed from the Central Bank and other banks, bills and bonds payable under repurchase agreements, accounts payable, deposits and remittances, financial bonds payable, and other financial liabilities) are approximate to their fair values (please refer to Note7(4)). The fair value information of financial instruments measured at fair value is provided in Note7(5).
NT$ Items Book value Fair value December 31, 2014 Held-to-maturity financial assets - net $ 161,795,040 $ 161,818,174
US$ Items Book value Fair value December 31, 2014 Held-to-maturity financial assets - net $ 5,109,909 $ 5,110,639
NT$ Items Book value Fair value December 31, 2013 Held-to-maturity financial assets - net $ 182,739,356 $ 182,799,621
(3) Financial instruments measured at fair value
If the market quotation from the Taiwan Stock Exchange Corporation, brokers, underwriters, Industrial Trade Unions, pricing service agencies or competent authorities can be frequently obtained on time, and the price represents the actual and frequent transactions at arm’s length, then a financial instrument is deemed to have an active market. If the above condition cannot be met, the market is deemed inactive. In general, significant price variance between the purchase price and selling price, significantly increasing price variance or extremely low trading volume are all indicators of an inactive market.
If the quoted market price of a financial instrument is available in an active market, the quoted price is the fair value, usually the fair value is measured using the market price, interest rate, foreign exchange central parity rate shown in Reuters quotation system, partially using the quoted prices from Bloomberg, OTC, or counterparties, and the basis for valuation is maintained consistently. If there is no quoted market price for reference, a valuation technique or quoted price offer by the counterparties will be adopted to measure the fair value. Fair value measured by a valuation technique is usually estimated by reference to the fair values of other financial instruments with similar terms and characteristics, or by using cash flows discounting method, or using model calculation based on the market information (such as yield rate curves from OTC, average interest rate of commercial papers from Reuters) available on the balance sheet date.
When assessing non-standardized financial instruments with lower complexity, derivative financial instruments such as interest rate swap contracts, foreign exchange swap contracts, options, the Bank and its subsidiaries use valuation techniques and models which are extensively used by the market to estimate their fair value. The parameters used in the valuation model for these kinds of financial instruments usually use the observable information as the input.
For more complicated financial instruments, such as debt instruments with embedded derivative instruments or securitization products, the Bank and its subsidiaries develop its own valuation models to estimate fair value by reference to the valuation techniques and methods which are extensively used by the same trade. Parts of parameters used in these valuation models are not observable from the market; they must be estimated by using some assumptions.
A. NTD Central Government Bond: the yield rates across different contract length and one-hundred price bulletined by Over-The-Counter (hereinafter OTC) are used.
B. NTD corporate bonds, financial debentures, government bonds, bond-type beneficiary securities and designated financial debentures issued by the Group: the present value of future estimated cash flows is calculated by using the yield rate curve from OTC.
C. NTD short-term bills and NTD bill-type beneficiary securities: the present value of future estimated cash flows of NTD and USD short-term bills is calculated by using average interest rate of commercial papers and TAIFX3 central parity rate from Reuters, respectively.
D. Foreign securities: quoted prices from Bloomberg or counterparties are adopted.
E. Listed stock the closing price being listed in TSE is adopted.
F. Unlisted stock and domestic/foreign partnership-type fund: If the objective recently has representative trading, its trading price might be the best estimate of its fair value. If the objective has comparable listed trades, its fair value can be estimated by using appropriate market method, such as P/E method, P/B method, EV/EBIT method or EBITDA×EV method, taking into account the operation condition of the comparable listed companies, most recent one month trading information and its liquidity. And if the objective has no comparable instruments or its fair value cannot be estimated using market method, other valuation technique, such as net assets method or income approach, is used to estimate its fair value.
G. Funds net assets value is adopted.
H. Derivative financial instruments:
(A) Foreign exchange forward contract, currency swaps, forward rate agreement, interest rate swaps and cross currency swaps: the discounting future cash flow is adopted.
(B) Options: Black-Scholes model is mainly adopted for valuation.
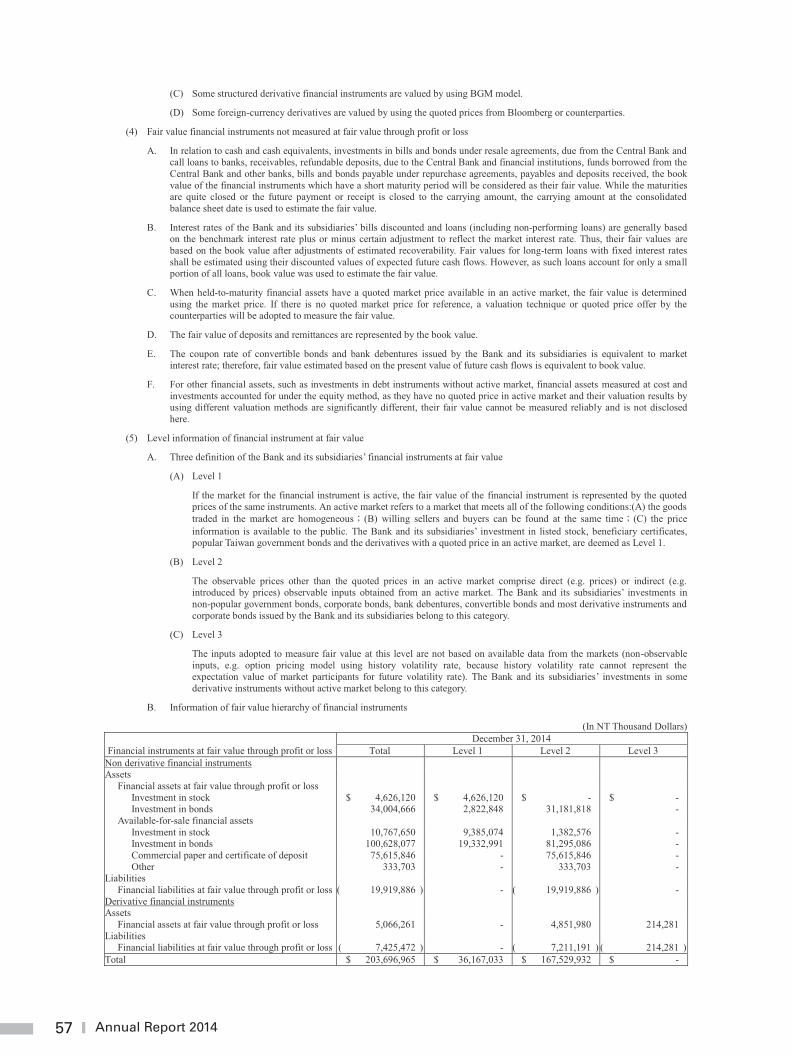
57 Annual Report 2014
57
(C) Some structured derivative financial instruments are valued by using BGM model.
(D) Some foreign-currency derivatives are valued by using the quoted prices from Bloomberg or counterparties.
(4) Fair value financial instruments not measured at fair value through profit or loss
A. In relation to cash and cash equivalents, investments in bills and bonds under resale agreements, due from the Central Bank and call loans to banks, receivables, refundable deposits, due to the Central Bank and financial institutions, funds borrowed from the Central Bank and other banks, bills and bonds payable under repurchase agreements, payables and deposits received, the book value of the financial instruments which have a short maturity period will be considered as their fair value. While the maturities are quite closed or the future payment or receipt is closed to the carrying amount, the carrying amount at the consolidated balance sheet date is used to estimate the fair value.
B. Interest rates of the Bank and its subsidiaries’ bills discounted and loans (including non-performing loans) are generally based on the benchmark interest rate plus or minus certain adjustment to reflect the market interest rate. Thus, their fair values are based on the book value after adjustments of estimated recoverability. Fair values for long-term loans with fixed interest rates shall be estimated using their discounted values of expected future cash flows. However, as such loans account for only a small portion of all loans, book value was used to estimate the fair value.
C. When held-to-maturity financial assets have a quoted market price available in an active market, the fair value is determined using the market price. If there is no quoted market price for reference, a valuation technique or quoted price offer by the counterparties will be adopted to measure the fair value.
D. The fair value of deposits and remittances are represented by the book value.
E. The coupon rate of convertible bonds and bank debentures issued by the Bank and its subsidiaries is equivalent to market interest rate; therefore, fair value estimated based on the present value of future cash flows is equivalent to book value.
F. For other financial assets, such as investments in debt instruments without active market, financial assets measured at cost and investments accounted for under the equity method, as they have no quoted price in active market and their valuation results by using different valuation methods are significantly different, their fair value cannot be measured reliably and is not disclosed here.
(5) Level information of financial instrument at fair value
A. Three definition of the Bank and its subsidiaries’ financial instruments at fair value
(A) Level 1
If the market for the financial instrument is active, the fair value of the financial instrument is represented by the quoted prices of the same instruments. An active market refers to a market that meets all of the following conditions:(A) the goods traded in the market are homogeneous (B) willing sellers and buyers can be found at the same time (C) the price information is available to the public. The Bank and its subsidiaries’ investment in listed stock, beneficiary certificates, popular Taiwan government bonds and the derivatives with a quoted price in an active market, are deemed as Level 1.
(B) Level 2
The observable prices other than the quoted prices in an active market comprise direct (e.g. prices) or indirect (e.g. introduced by prices) observable inputs obtained from an active market. The Bank and its subsidiaries’ investments in non-popular government bonds, corporate bonds, bank debentures, convertible bonds and most derivative instruments and corporate bonds issued by the Bank and its subsidiaries belong to this category.
(C) Level 3
The inputs adopted to measure fair value at this level are not based on available data from the markets (non-observable inputs, e.g. option pricing model using history volatility rate, because history volatility rate cannot represent the expectation value of market participants for future volatility rate). The Bank and its subsidiaries’ investments in some derivative instruments without active market belong to this category.
B. Information of fair value hierarchy of financial instruments
(In NT Thousand Dollars)
Financial instruments at fair value through profit or loss December 31, 2014
Total Level 1 Level 2 Level 3 Non derivative financial instruments Assets
Financial assets at fair value through profit or loss Investment in stock $ 4,626,120 $ 4,626,120 $ - $ - Investment in bonds 34,004,666 2,822,848 31,181,818 -
Available-for-sale financial assets Investment in stock 10,767,650 9,385,074 1,382,576 - Investment in bonds 100,628,077 19,332,991 81,295,086 - Commercial paper and certificate of deposit 75,615,846 - 75,615,846 - Other 333,703 - 333,703 -
Liabilities Financial liabilities at fair value through profit or loss ( 19,919,886 ) - ( 19,919,886 ) -
Derivative financial instruments Assets
Financial assets at fair value through profit or loss 5,066,261 - 4,851,980 214,281 Liabilities
Financial liabilities at fair value through profit or loss ( 7,425,472 ) - ( 7,211,191 ) ( 214,281 ) Total $ 203,696,965 $ 36,167,033 $ 167,529,932 $ -
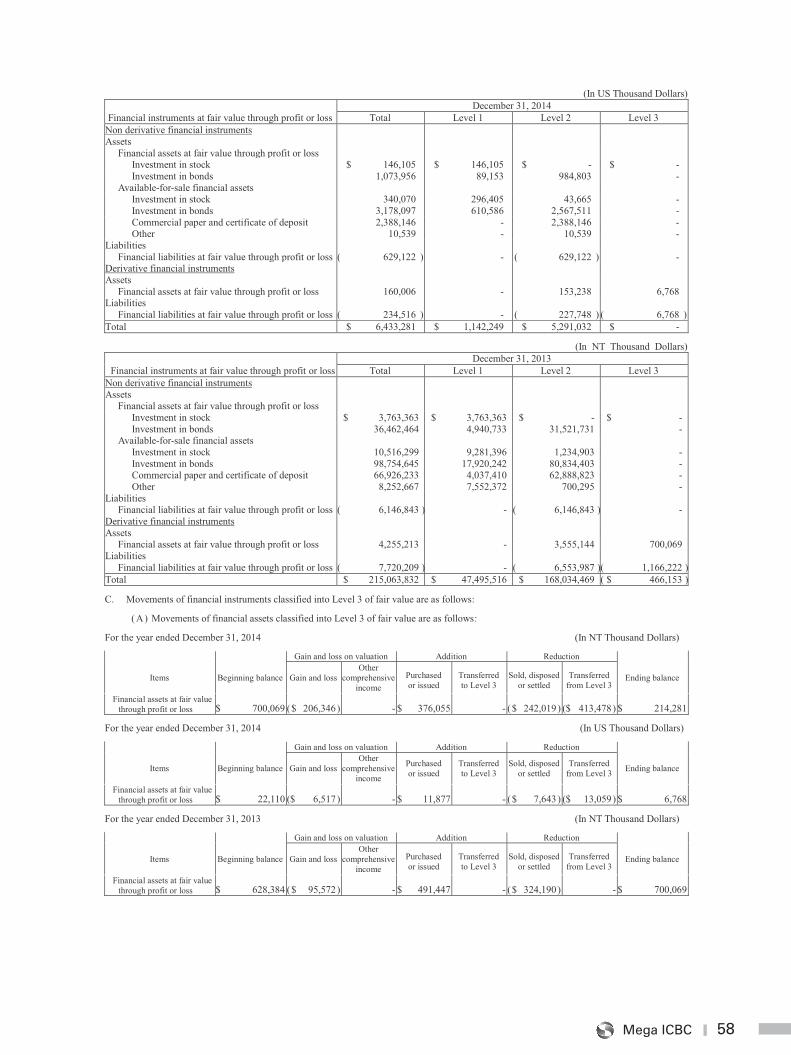
58Mega ICBC
58
(In US Thousand Dollars)
Financial instruments at fair value through profit or loss December 31, 2014
Total Level 1 Level 2 Level 3 Non derivative financial instruments Assets
Financial assets at fair value through profit or loss Investment in stock $ 146,105 $ 146,105 $ - $ - Investment in bonds 1,073,956 89,153 984,803 -
Available-for-sale financial assets Investment in stock 340,070 296,405 43,665 - Investment in bonds 3,178,097 610,586 2,567,511 - Commercial paper and certificate of deposit 2,388,146 - 2,388,146 - Other 10,539 - 10,539 -
Liabilities Financial liabilities at fair value through profit or loss ( 629,122 ) - ( 629,122 ) -
Derivative financial instruments Assets
Financial assets at fair value through profit or loss 160,006 - 153,238 6,768 Liabilities
Financial liabilities at fair value through profit or loss ( 234,516 ) - ( 227,748 ) ( 6,768 ) Total $ 6,433,281 $ 1,142,249 $ 5,291,032 $ -
(In NT Thousand Dollars)
Financial instruments at fair value through profit or loss December 31, 2013
Total Level 1 Level 2 Level 3 Non derivative financial instruments Assets
Financial assets at fair value through profit or loss Investment in stock $ 3,763,363 $ 3,763,363 $ - $ - Investment in bonds 36,462,464 4,940,733 31,521,731 -
Available-for-sale financial assets Investment in stock 10,516,299 9,281,396 1,234,903 - Investment in bonds 98,754,645 17,920,242 80,834,403 - Commercial paper and certificate of deposit 66,926,233 4,037,410 62,888,823 - Other 8,252,667 7,552,372 700,295 -
Liabilities Financial liabilities at fair value through profit or loss ( 6,146,843 ) - ( 6,146,843 ) -
Derivative financial instruments Assets
Financial assets at fair value through profit or loss 4,255,213 - 3,555,144 700,069 Liabilities
Financial liabilities at fair value through profit or loss ( 7,720,209 ) - ( 6,553,987 )( 1,166,222 )Total $ 215,063,832 $ 47,495,516 $ 168,034,469 ( $ 466,153 )
C. Movements of financial instruments classified into Level 3 of fair value are as follows:
( A) Movements of financial assets classified into Level 3 of fair value are as follows:
For the year ended December 31, 2014 (In NT Thousand Dollars)
Gain and loss on valuation Addition Reduction
Items Beginning balance Gain and loss Other
comprehensive income
Purchased or issued
Transferred to Level 3
Sold, disposed or settled
Transferred from Level 3
Ending balance
Financial assets at fair value through profit or loss $ 700,069 ( $ 206,346 ) - $ 376,055 - ( $ 242,019 ) ($ 413,478 ) $ 214,281
For the year ended December 31, 2014 (In US Thousand Dollars)
Gain and loss on valuation Addition Reduction
Items Beginning balance Gain and loss Other
comprehensive income
Purchased or issued
Transferred to Level 3
Sold, disposed or settled
Transferred from Level 3 Ending balance
Financial assets at fair value through profit or loss $ 22,110 ($ 6,517 ) - $ 11,877 - ( $ 7,643 ) ($ 13,059 ) $ 6,768
For the year ended December 31, 2013 (In NT Thousand Dollars)
Gain and loss on valuation Addition Reduction
Items Beginning balance Gain and loss Other
comprehensive income
Purchased or issued
Transferred to Level 3
Sold, disposed or settled
Transferred from Level 3
Ending balance
Financial assets at fair value through profit or loss $ 628,384 ( $ 95,572 ) - $ 491,447 - ( $ 324,190 ) - $ 700,069
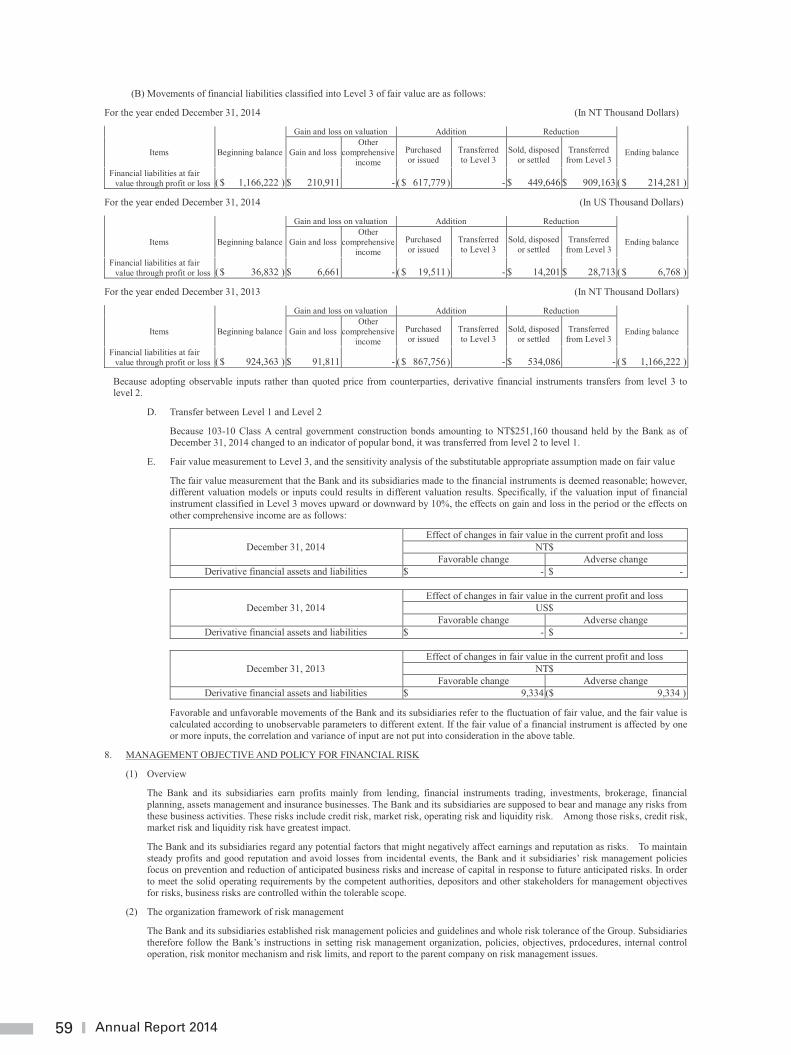
59 Annual Report 2014
59
(B) Movements of financial liabilities classified into Level 3 of fair value are as follows:
For the year ended December 31, 2014 (In NT Thousand Dollars)
Gain and loss on valuation Addition Reduction
Items Beginning balance Gain and loss Other
comprehensive income
Purchased or issued
Transferred to Level 3
Sold, disposed or settled
Transferred from Level 3
Ending balance
Financial liabilities at fair value through profit or loss ( $ 1,166,222 ) $ 210,911 - ( $ 617,779 ) - $ 449,646 $ 909,163 ( $ 214,281 )
For the year ended December 31, 2014 (In US Thousand Dollars)
Gain and loss on valuation Addition Reduction
Items Beginning balance Gain and loss Other
comprehensive income
Purchased or issued
Transferred to Level 3
Sold, disposed or settled
Transferred from Level 3
Ending balance
Financial liabilities at fair value through profit or loss ( $ 36,832 ) $ 6,661 - ( $ 19,511 ) - $ 14,201 $ 28,713 ( $ 6,768 )
For the year ended December 31, 2013 (In NT Thousand Dollars)
Gain and loss on valuation Addition Reduction
Items Beginning balance Gain and loss Other
comprehensive income
Purchased or issued
Transferred to Level 3
Sold, disposed or settled
Transferred from Level 3
Ending balance
Financial liabilities at fair value through profit or loss ( $ 924,363 ) $ 91,811 - ( $ 867,756 ) - $ 534,086 - ( $ 1,166,222 )
Because adopting observable inputs rather than quoted price from counterparties, derivative financial instruments transfers from level 3 to level 2.
D. Transfer between Level 1 and Level 2
Because 103-10 Class A central government construction bonds amounting to NT$251,160 thousand held by the Bank as of December 31, 2014 changed to an indicator of popular bond, it was transferred from level 2 to level 1.
E. Fair value measurement to Level 3, and the sensitivity analysis of the substitutable appropriate assumption made on fair value
The fair value measurement that the Bank and its subsidiaries made to the financial instruments is deemed reasonable; however, different valuation models or inputs could results in different valuation results. Specifically, if the valuation input of financial instrument classified in Level 3 moves upward or downward by 10%, the effects on gain and loss in the period or the effects on other comprehensive income are as follows:
December 31, 2014 Effect of changes in fair value in the current profit and loss
NT$ Favorable change Adverse change
Derivative financial assets and liabilities $ - $ -
December 31, 2014 Effect of changes in fair value in the current profit and loss
US$ Favorable change Adverse change
Derivative financial assets and liabilities $ - $ -
December 31, 2013 Effect of changes in fair value in the current profit and loss
NT$ Favorable change Adverse change
Derivative financial assets and liabilities $ 9,334 ($ 9,334 )
Favorable and unfavorable movements of the Bank and its subsidiaries refer to the fluctuation of fair value, and the fair value is calculated according to unobservable parameters to different extent. If the fair value of a financial instrument is affected by one or more inputs, the correlation and variance of input are not put into consideration in the above table.
8. MANAGEMENT OBJECTIVE AND POLICY FOR FINANCIAL RISK
(1) Overview
The Bank and its subsidiaries earn profits mainly from lending, financial instruments trading, investments, brokerage, financial planning, assets management and insurance businesses. The Bank and its subsidiaries are supposed to bear and manage any risks from these business activities. These risks include credit risk, market risk, operating risk and liquidity risk. Among those risks, credit risk, market risk and liquidity risk have greatest impact.
The Bank and its subsidiaries regard any potential factors that might negatively affect earnings and reputation as risks. To maintain steady profits and good reputation and avoid losses from incidental events, the Bank and it subsidiaries’ risk management policies focus on prevention and reduction of anticipated business risks and increase of capital in response to future anticipated risks. In order to meet the solid operating requirements by the competent authorities, depositors and other stakeholders for management objectives for risks, business risks are controlled within the tolerable scope.
(2) The organization framework of risk management
The Bank and its subsidiaries established risk management policies and guidelines and whole risk tolerance of the Group. Subsidiaries therefore follow the Bank’s instructions in setting risk management organization, policies, objectives, prdocedures, internal control operation, risk monitor mechanism and risk limits, and report to the parent company on risk management issues.
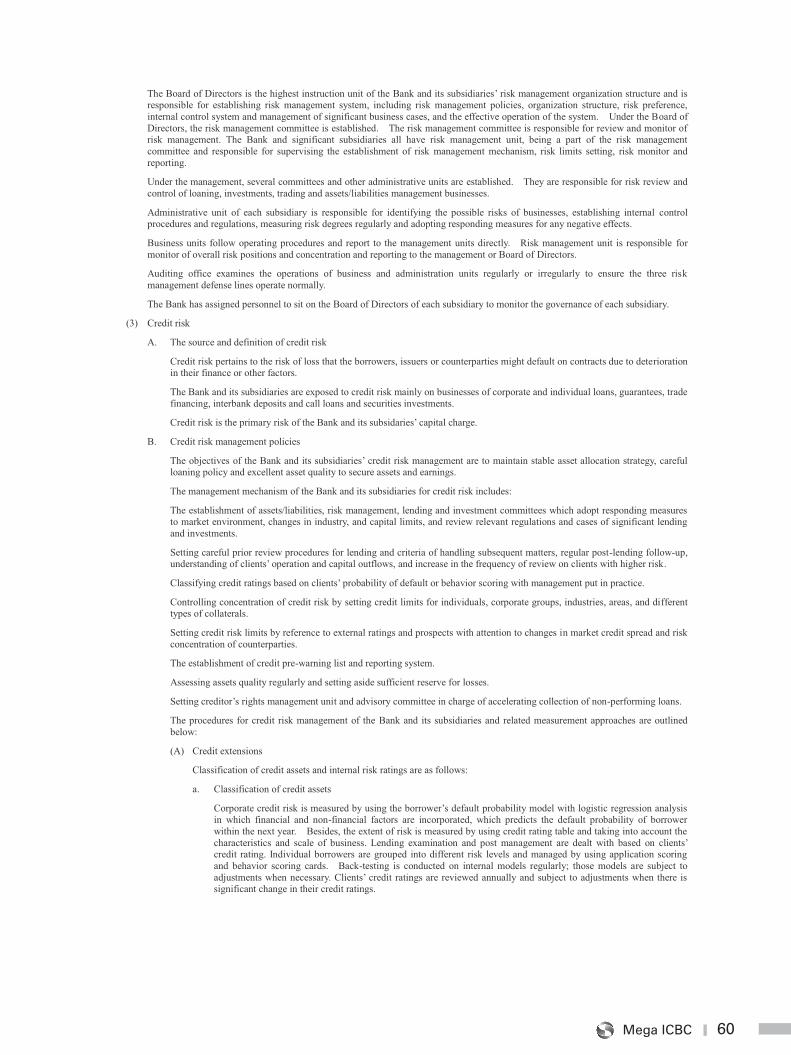
60Mega ICBC
60
The Board of Directors is the highest instruction unit of the Bank and its subsidiaries’ risk management organization structure and is responsible for establishing risk management system, including risk management policies, organization structure, risk preference, internal control system and management of significant business cases, and the effective operation of the system. Under the Board of Directors, the risk management committee is established. The risk management committee is responsible for review and monitor of risk management. The Bank and significant subsidiaries all have risk management unit, being a part of the risk management committee and responsible for supervising the establishment of risk management mechanism, risk limits setting, risk monitor and reporting.
Under the management, several committees and other administrative units are established. They are responsible for risk review and control of loaning, investments, trading and assets/liabilities management businesses.
Administrative unit of each subsidiary is responsible for identifying the possible risks of businesses, establishing internal control procedures and regulations, measuring risk degrees regularly and adopting responding measures for any negative effects.
Business units follow operating procedures and report to the management units directly. Risk management unit is responsible for monitor of overall risk positions and concentration and reporting to the management or Board of Directors.
Auditing office examines the operations of business and administration units regularly or irregularly to ensure the three risk management defense lines operate normally.
The Bank has assigned personnel to sit on the Board of Directors of each subsidiary to monitor the governance of each subsidiary.
(3) Credit risk
A. The source and definition of credit risk
Credit risk pertains to the risk of loss that the borrowers, issuers or counterparties might default on contracts due to deterioration in their finance or other factors.
The Bank and its subsidiaries are exposed to credit risk mainly on businesses of corporate and individual loans, guarantees, trade financing, interbank deposits and call loans and securities investments.
Credit risk is the primary risk of the Bank and its subsidaries’ capital charge.
B. Credit risk management policies
The objectives of the Bank and its subsidiaries’ credit risk management are to maintain stable asset allocation strategy, careful loaning policy and excellent asset quality to secure assets and earnings.
The management mechanism of the Bank and its subsidiaries for credit risk includes:
The establishment of assets/liabilities, risk management, lending and investment committees which adopt responding measures to market environment, changes in industry, and capital limits, and review relevant regulations and cases of significant lending and investments.
Setting careful prior review procedures for lending and criteria of handling subsequent matters, regular post-lending follow-up, understanding of clients’ operation and capital outflows, and increase in the frequency of review on clients with higher risk.
Classifying credit ratings based on clients’ probability of default or behavior scoring with management put in practice.
Controlling concentration of credit risk by setting credit limits for individuals, corporate groups, industries, areas, and different types of collaterals.
Setting credit risk limits by reference to external ratings and prospects with attention to changes in market credit spread and risk concentration of counterparties.
The establishment of credit pre-warning list and reporting system.
Assessing assets quality regularly and setting aside sufficient reserve for losses.
Setting creditor’s rights management unit and advisory committee in charge of accelerating collection of non-performing loans.
The procedures for credit risk management of the Bank and its subsidiaries and related measurement approaches are outlined below:
(A) Credit extensions
Classification of credit assets and internal risk ratings are as follows:
a. Classification of credit assets
Corporate credit risk is measured by using the borrower’s default probability model with logistic regression analysis in which financial and non-financial factors are incorporated, which predicts the default probability of borrower within the next year. Besides, the extent of risk is measured by using credit rating table and taking into account the characteristics and scale of business. Lending examination and post management are dealt with based on clients’ credit rating. Individual borrowers are grouped into different risk levels and managed by using application scoring and behavior scoring cards. Back-testing is conducted on internal models regularly; those models are subject to adjustments when necessary. Clients’ credit ratings are reviewed annually and subject to adjustments when there is significant change in their credit ratings.
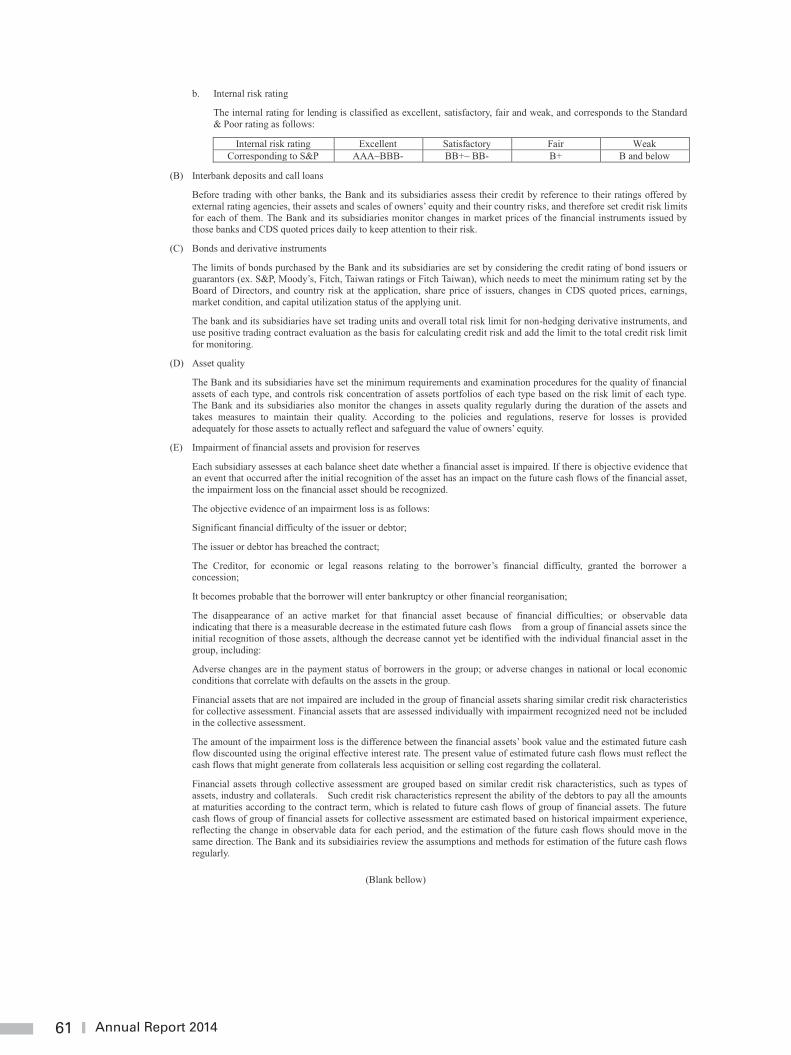
61 Annual Report 2014
61
b. Internal risk rating
The internal rating for lending is classified as excellent, satisfactory, fair and weak, and corresponds to the Standard & Poor rating as follows:
Internal risk rating Excellent Satisfactory Fair Weak Corresponding to S&P AAA~BBB- BB+~ BB- B+ B and below
(B) Interbank deposits and call loans
Before trading with other banks, the Bank and its subsidiaries assess their credit by reference to their ratings offered by external rating agencies, their assets and scales of owners’ equity and their country risks, and therefore set credit risk limits for each of them. The Bank and its subsidiaries monitor changes in market prices of the financial instruments issued by those banks and CDS quoted prices daily to keep attention to their risk.
(C) Bonds and derivative instruments
The limits of bonds purchased by the Bank and its subsidiaries are set by considering the credit rating of bond issuers or guarantors (ex. S&P, Moody’s, Fitch, Taiwan ratings or Fitch Taiwan), which needs to meet the minimum rating set by the Board of Directors, and country risk at the application, share price of issuers, changes in CDS quoted prices, earnings, market condition, and capital utilization status of the applying unit.
The bank and its subsidiaries have set trading units and overall total risk limit for non-hedging derivative instruments, and use positive trading contract evaluation as the basis for calculating credit risk and add the limit to the total credit risk limit for monitoring.
(D) Asset quality
The Bank and its subsidiaries have set the minimum requirements and examination procedures for the quality of financial assets of each type, and controls risk concentration of assets portfolios of each type based on the risk limit of each type. The Bank and its subsidiaries also monitor the changes in assets quality regularly during the duration of the assets and takes measures to maintain their quality. According to the policies and regulations, reserve for losses is provided adequately for those assets to actually reflect and safeguard the value of owners’ equity.
(E) Impairment of financial assets and provision for reserves
Each subsidiary assesses at each balance sheet date whether a financial asset is impaired. If there is objective evidence that an event that occurred after the initial recognition of the asset has an impact on the future cash flows of the financial asset, the impairment loss on the financial asset should be recognized.
The objective evidence of an impairment loss is as follows:
Significant financial difficulty of the issuer or debtor;
The issuer or debtor has breached the contract;
The Creditor, for economic or legal reasons relating to the borrower’s financial difficulty, granted the borrower a concession;
It becomes probable that the borrower will enter bankruptcy or other financial reorganisation;
The disappearance of an active market for that financial asset because of financial difficulties; or observable data indicating that there is a measurable decrease in the estimated future cash flows from a group of financial assets since the initial recognition of those assets, although the decrease cannot yet be identified with the individual financial asset in the group, including:
Adverse changes are in the payment status of borrowers in the group; or adverse changes in national or local economic conditions that correlate with defaults on the assets in the group.
Financial assets that are not impaired are included in the group of financial assets sharing similar credit risk characteristics for collective assessment. Financial assets that are assessed individually with impairment recognized need not be included in the collective assessment.
The amount of the impairment loss is the difference between the financial assets’ book value and the estimated future cash flow discounted using the original effective interest rate. The present value of estimated future cash flows must reflect the cash flows that might generate from collaterals less acquisition or selling cost regarding the collateral.
Financial assets through collective assessment are grouped based on similar credit risk characteristics, such as types of assets, industry and collaterals. Such credit risk characteristics represent the ability of the debtors to pay all the amounts at maturities according to the contract term, which is related to future cash flows of group of financial assets. The future cash flows of group of financial assets for collective assessment are estimated based on historical impairment experience, reflecting the change in observable data for each period, and the estimation of the future cash flows should move in the same direction. The Bank and its subsidiairies review the assumptions and methods for estimation of the future cash flows regularly.
(Blank bellow)
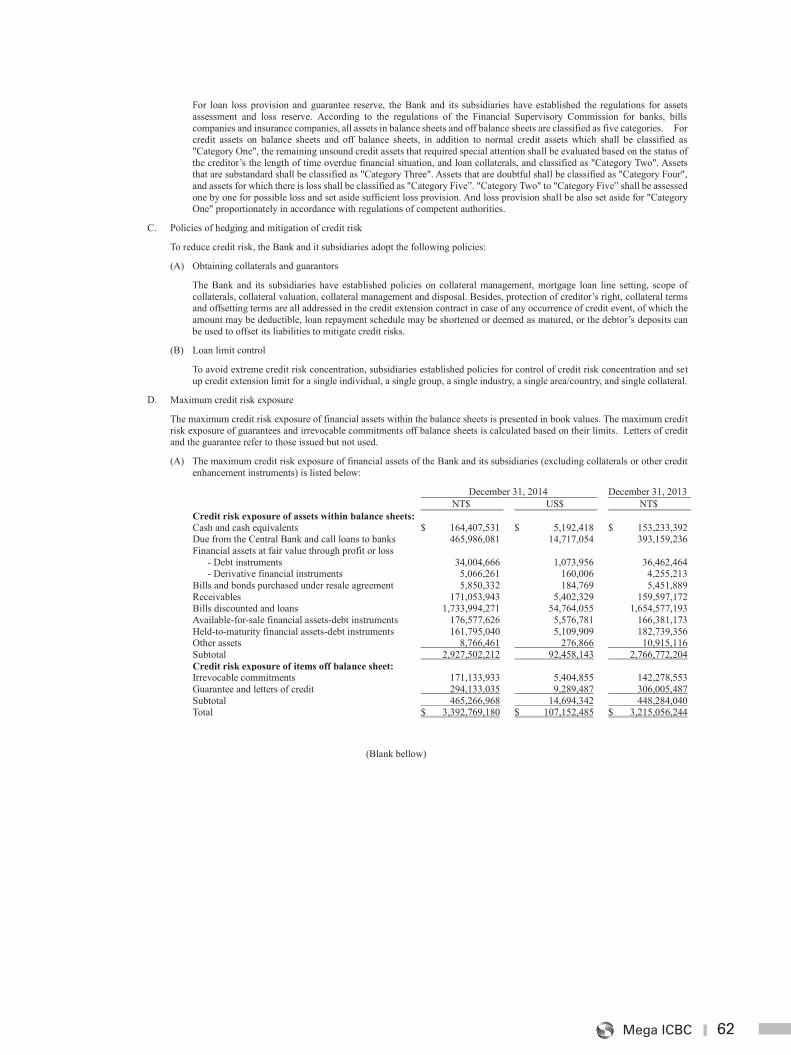
62Mega ICBC
62
For loan loss provision and guarantee reserve, the Bank and its subsidiaries have established the regulations for assets assessment and loss reserve. According to the regulations of the Financial Supervisory Commission for banks, bills companies and insurance companies, all assets in balance sheets and off balance sheets are classified as five categories. For credit assets on balance sheets and off balance sheets, in addition to normal credit assets which shall be classified as "Category One", the remaining unsound credit assets that required special attention shall be evaluated based on the status of the creditor’s the length of time overdue financial situation, and loan collaterals, and classified as "Category Two". Assets that are substandard shall be classified as "Category Three". Assets that are doubtful shall be classified as "Category Four", and assets for which there is loss shall be classified as "Category Five”. "Category Two" to "Category Five” shall be assessed one by one for possible loss and set aside sufficient loss provision. And loss provision shall be also set aside for "Category One" proportionately in accordance with regulations of competent authorities.
C. Policies of hedging and mitigation of credit risk
To reduce credit risk, the Bank and it subsidiaries adopt the following policies:
(A) Obtaining collaterals and guarantors
The Bank and its subsidiaries have established policies on collateral management, mortgage loan line setting, scope of collaterals, collateral valuation, collateral management and disposal. Besides, protection of creditor’s right, collateral terms and offsetting terms are all addressed in the credit extension contract in case of any occurrence of credit event, of which the amount may be deductible, loan repayment schedule may be shortened or deemed as matured, or the debtor’s deposits can be used to offset its liabilities to mitigate credit risks.
(B) Loan limit control
To avoid extreme credit risk concentration, subsidiaries established policies for control of credit risk concentration and set up credit extension limit for a single individual, a single group, a single industry, a single area/country, and single collateral.
D. Maximum credit risk exposure
The maximum credit risk exposure of financial assets within the balance sheets is presented in book values. The maximum credit risk exposure of guarantees and irrevocable commitments off balance sheets is calculated based on their limits. Letters of credit and the guarantee refer to those issued but not used.
(A) The maximum credit risk exposure of financial assets of the Bank and its subsidiaries (excluding collaterals or other credit enhancement instruments) is listed below:
December 31, 2014 December 31, 2013 NT$ US$ NT$
Credit risk exposure of assets within balance sheets: Cash and cash equivalents $ 164,407,531 $ 5,192,418 $ 153,233,392 Due from the Central Bank and call loans to banks 465,986,081 14,717,054 393,159,236 Financial assets at fair value through profit or loss
- Debt instruments 34,004,666 1,073,956 36,462,464 - Derivative financial instruments 5,066,261 160,006 4,255,213
Bills and bonds purchased under resale agreement 5,850,332 184,769 5,451,889 Receivables 171,053,943 5,402,329 159,597,172 Bills discounted and loans 1,733,994,271 54,764,055 1,654,577,193 Available-for-sale financial assets-debt instruments 176,577,626 5,576,781 166,381,173 Held-to-maturity financial assets-debt instruments 161,795,040 5,109,909 182,739,356 Other assets 8,766,461 276,866 10,915,116 Subtotal 2,927,502,212 92,458,143 2,766,772,204 Credit risk exposure of items off balance sheet: Irrevocable commitments 171,133,933 5,404,855 142,278,553 Guarantee and letters of credit 294,133,035 9,289,487 306,005,487 Subtotal 465,266,968 14,694,342 448,284,040 Total $ 3,392,769,180 $ 107,152,485 $ 3,215,056,244
(Blank bellow)
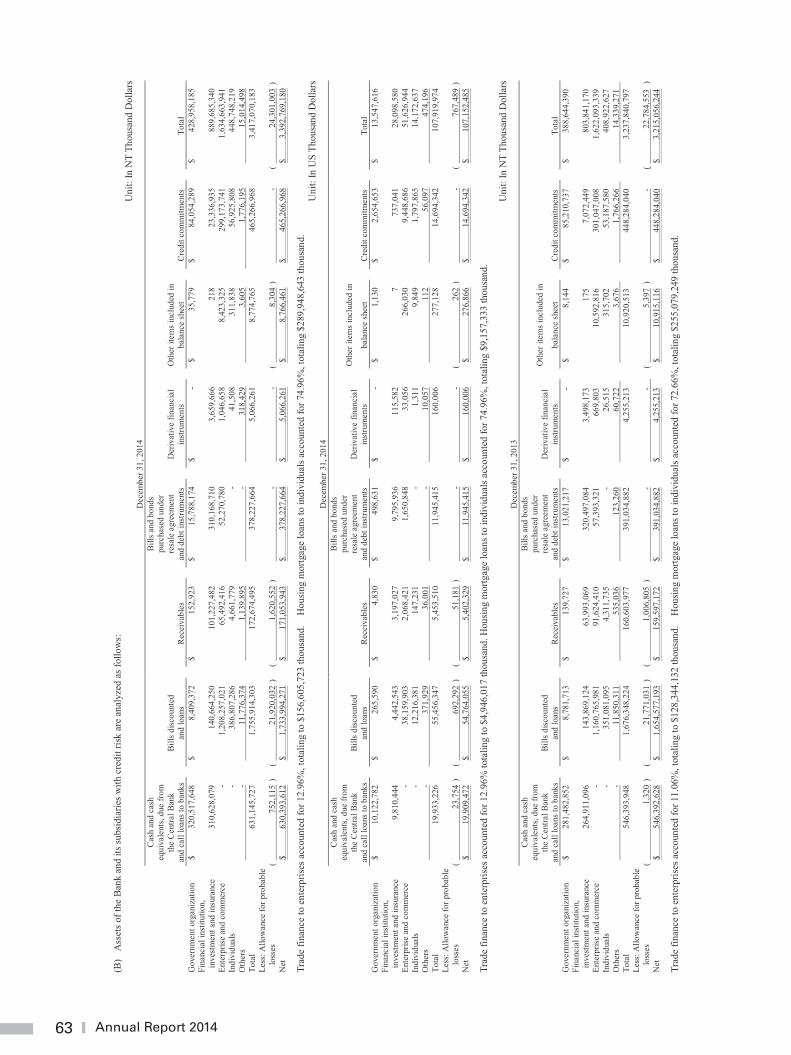
63 Annual Report 2014
63
(B)
Ass
ets o
f the
Ban
k an
d its
subs
idia
ries w
ith c
redi
t risk
are
ana
lyze
d as
follo
ws:
U
nit:
In N
T Th
ousa
nd D
olla
rs
D
ecem
ber 3
1, 2
014
C
ash
and
cash
eq
uiva
lent
s, du
e fr
om
the
Cen
tral B
ank
and
call
loan
s to
bank
s
Bill
s disc
ount
ed
and
loan
s
Rec
eiva
bles
B
ills a
nd b
onds
pu
rcha
sed
unde
r re
sale
agr
eem
ent
and
debt
inst
rum
ents
Der
ivat
ive
finan
cial
in
stru
men
ts
Oth
er it
ems
incl
uded
in
bala
nce
shee
t
Cre
dit c
omm
itmen
ts
Tota
l G
over
nmen
t org
aniz
atio
n $
320,
517,
648
$ 8,
409,
372
$ 15
2,92
3
$
15,7
88,1
74
$ -
$ 35
,779
$
84,0
54,2
89
$ 42
8,95
8,18
5
Fina
ncia
l ins
titut
ion,
in
vest
men
t and
insu
ranc
e
310,
628,
079
14
0,66
4,25
0
101,
227,
482
31
0,16
8,71
0
3,65
9,66
6
218
23
,336
,935
889,
685,
340
En
terp
rise
and
com
mer
ce
-
1,
208,
257,
021
65
,492
,416
52,2
70,7
80
1,
046,
658
8,
423,
325
29
9,17
3,74
1
1,63
4,66
3,94
1
Indi
vidu
als
-
38
6,80
7,28
6
4,66
1,77
9
-
41,5
08
31
1,83
8
56,9
25,8
08
44
8,74
8,21
9
Oth
ers
-
11,7
76,3
74
1,
139,
895
-
318,
429
3,
605
1,
776,
195
15
,014
,498
Tota
l
631,
145,
727
1,
755,
914,
303
17
2,67
4,49
5
378,
227,
664
5,
066,
261
8,
774,
765
46
5,26
6,96
8
3,41
7,07
0,18
3
Less
: Allo
wan
ce fo
r pro
babl
e lo
sses
(
75
2,11
5 )
(
21,9
20,0
32 )
(
1,
620,
552
)
-
-
(
8,
304
)
-
(
24,3
01,0
03 )
N
et
$ 63
0,39
3,61
2
$
1,73
3,99
4,27
1
$
171,
053,
943
$ 37
8,22
7,66
4
$
5,06
6,26
1
$
8,76
6,46
1
$
465,
266,
968
$ 3,
392,
769,
180
Trad
e fin
ance
to e
nter
pris
es a
ccou
nted
for 1
2.96
%, t
otal
ing
to $
156,
605,
723
thou
sand
. H
ousin
g m
ortg
age
loan
s to
indi
vidu
als a
ccou
nted
for 7
4.96
%, t
otal
ing
$289
,948
,643
thou
sand
. U
nit:
In U
S Th
ousa
nd D
olla
rs
D
ecem
ber 3
1, 2
014
C
ash
and
cash
eq
uiva
lent
s, du
e fr
om
the
Cen
tral B
ank
and
call
loan
s to
bank
s
Bill
s disc
ount
ed
and
loan
s
Rec
eiva
bles
B
ills a
nd b
onds
pu
rcha
sed
unde
r re
sale
agr
eem
ent
and
debt
inst
rum
ents
Der
ivat
ive
finan
cial
in
stru
men
ts
O
ther
item
s in
clud
ed in
bala
nce
shee
t
Cre
dit c
omm
itmen
ts
Tota
l G
over
nmen
t org
aniz
atio
n $
10,1
22,7
82
$ 26
5,59
0
$
4,83
0
$
498,
631
$ -
$ 1,
130
$ 2,
654,
653
$ 13
,547
,616
Fina
ncia
l ins
titut
ion,
in
vest
men
t and
insu
ranc
e
9,81
0,44
4
4,44
2,54
3
3,19
7,02
7
9,79
5,93
6
115,
582
7
73
7,04
1
28,0
98,5
80
En
terp
rise
and
com
mer
ce
-
38
,159
,903
2,06
8,42
1
1,65
0,84
8
33,0
56
26
6,03
0
9,44
8,68
6
51,6
26,9
44
In
divi
dual
s
-
12,2
16,3
81
14
7,23
1
-
1,31
1
9,84
9
1,79
7,86
5
14,1
72,6
37
O
ther
s
-
37
1,92
9
36,0
01
-
10,0
57
11
2
56,0
97
47
4,19
6
Tota
l
19,9
33,2
26
55
,456
,347
5,45
3,51
0
11,9
45,4
15
16
0,00
6
277,
128
14
,694
,342
107,
919,
974
Le
ss: A
llow
ance
for p
roba
ble
loss
es
(
23,7
54 )
(
69
2,29
2 )
(
51,1
81 )
-
-
(
26
2 )
-
(
76
7,48
9 )
Net
$
19,9
09,4
72
$ 54
,764
,055
$
5,40
2,32
9
$
11,9
45,4
15
$ 16
0,00
6
$
276,
866
$ 14
,694
,342
$
107,
152,
485
Trad
e fin
ance
to e
nter
pris
es a
ccou
nted
for 1
2.96
% to
talin
g to
$4,
946,
017
thou
sand
. Hou
sing
mor
tgag
e lo
ans t
o in
divi
dual
s acc
ount
ed fo
r 74.
96%
, tot
alin
g $9
,157
,333
thou
sand
.
Uni
t: In
NT
Thou
sand
Dol
lars
Dec
embe
r 31,
201
3
Cas
h an
d ca
sh
equi
vale
nts,
due
from
th
e C
entra
l Ban
k an
d ca
ll lo
ans t
o ba
nks
Bill
s disc
ount
ed
and
loan
s
Rec
eiva
bles
B
ills a
nd b
onds
pu
rcha
sed
unde
r re
sale
agr
eem
ent
and
debt
inst
rum
ents
Der
ivat
ive
finan
cial
in
stru
men
ts
O
ther
item
s in
clud
ed in
bala
nce
shee
t
Cre
dit c
omm
itmen
ts
Tota
l G
over
nmen
t org
aniz
atio
n $
281,
482,
852
$ 8,
781,
713
$ 13
9,72
7
$
13,0
21,2
17
$ -
$ 8,
144
$ 85
,210
,737
$
388,
644,
390
Fi
nanc
ial i
nstit
utio
n,
inve
stm
ent a
nd in
sura
nce
26
4,91
1,09
6
143,
869,
124
63
,993
,069
320,
497,
084
3,
498,
173
17
5
7,07
2,44
9
803,
841,
170
En
terp
rise
and
com
mer
ce
-
1,
160,
765,
981
91
,624
,410
57,3
93,3
21
66
9,80
3
10,5
92,8
16
30
1,04
7,00
8
1,62
2,09
3,33
9
Indi
vidu
als
-
35
1,08
1,09
5
4,31
1,73
5
-
26,5
15
31
5,70
2
53,1
87,5
80
40
8,92
2,62
7
Oth
ers
-
11,8
50,3
11
53
5,03
6
123,
260
60
,722
3,67
6
1,76
6,26
6
14,3
39,2
71
To
tal
54
6,39
3,94
8
1,
676,
348,
224
16
0,60
3,97
7
391,
034,
882
4,
255,
213
10
,920
,513
448,
284,
040
3,
237,
840,
797
Le
ss: A
llow
ance
for p
roba
ble
loss
es
(
1,32
0 )
(
21,7
71,0
31 )
(
1,
006,
805
)
-
-
(
5,
397
)
-
(
22
,784
,553
)
Net
$
546,
392,
628
$ 1,
654,
577,
193
$ 15
9,59
7,17
2
$
391,
034,
882
$ 4,
255,
213
$ 10
,915
,116
$
448,
284,
040
$ 3,
215,
056,
244
Trad
e fin
ance
to e
nter
pris
es a
ccou
nted
for 1
1.06
%, t
otal
ing
to $
128,
344,
132
thou
sand
. H
ousin
g m
ortg
age
loan
s to
indi
vidu
als a
ccou
nted
for 7
2.66
%, t
otal
ing
$255
,079
,249
thou
sand
.
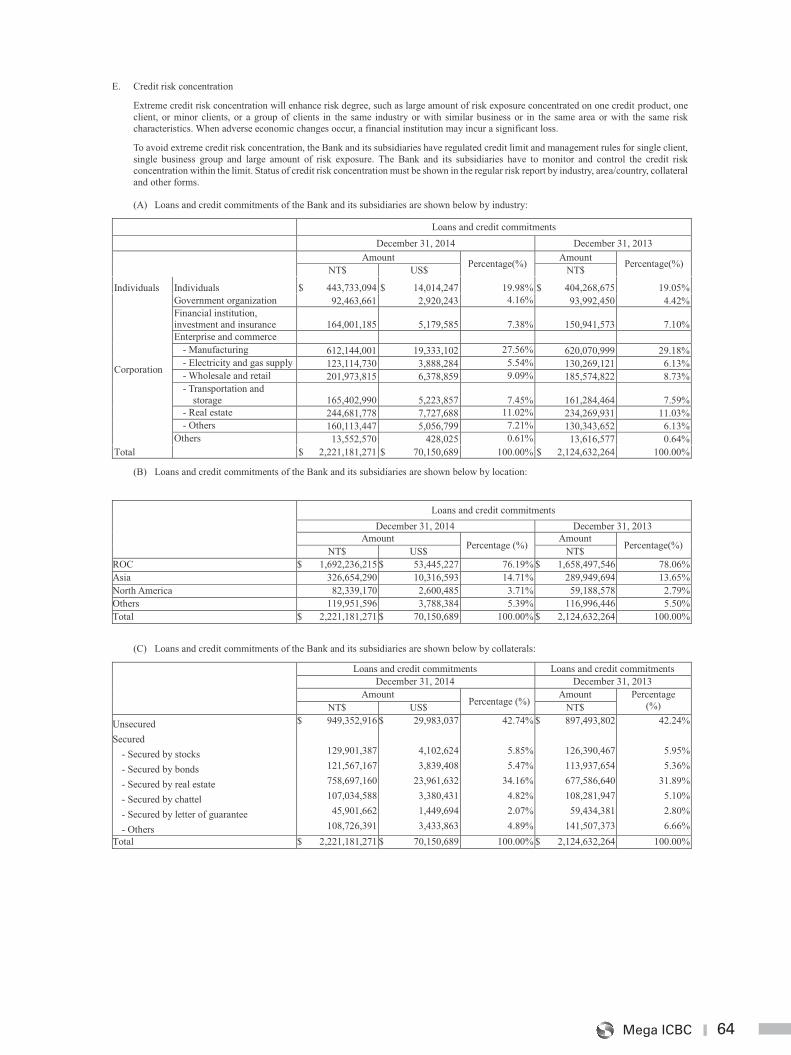
64Mega ICBC
64
E. Credit risk concentration
Extreme credit risk concentration will enhance risk degree, such as large amount of risk exposure concentrated on one credit product, one client, or minor clients, or a group of clients in the same industry or with similar business or in the same area or with the same risk characteristics. When adverse economic changes occur, a financial institution may incur a significant loss.
To avoid extreme credit risk concentration, the Bank and its subsidiaries have regulated credit limit and management rules for single client, single business group and large amount of risk exposure. The Bank and its subsidiaries have to monitor and control the credit risk concentration within the limit. Status of credit risk concentration must be shown in the regular risk report by industry, area/country, collateral and other forms.
(A) Loans and credit commitments of the Bank and its subsidiaries are shown below by industry:
Loans and credit commitments December 31, 2014 December 31, 2013 Amount Percentage(%) Amount Percentage(%) NT$ US$ NT$
Individuals Individuals $ 443,733,094 $ 14,014,247 19.98% $ 404,268,675 19.05%
Corporation
Government organization 92,463,661 2,920,243 4.16% 93,992,450 4.42% Financial institution, investment and insurance 164,001,185 5,179,585 7.38% 150,941,573 7.10% Enterprise and commerce
- Manufacturing 612,144,001 19,333,102 27.56% 620,070,999 29.18% - Electricity and gas supply 123,114,730 3,888,284 5.54% 130,269,121 6.13% - Wholesale and retail 201,973,815 6,378,859 9.09% 185,574,822 8.73% - Transportation and
storage 165,402,990 5,223,857 7.45% 161,284,464 7.59% - Real estate 244,681,778 7,727,688 11.02% 234,269,931 11.03% - Others 160,113,447 5,056,799 7.21% 130,343,652 6.13%
Others 13,552,570 428,025 0.61% 13,616,577 0.64% Total $ 2,221,181,271 $ 70,150,689 100.00% $ 2,124,632,264 100.00%
(B) Loans and credit commitments of the Bank and its subsidiaries are shown below by location:
Loans and credit commitments
December 31, 2014 December 31, 2013 Amount
Percentage (%) Amount
Percentage(%) NT$ US$ NT$ ROC $ 1,692,236,215 $ 53,445,227 76.19% $ 1,658,497,546 78.06% Asia 326,654,290 10,316,593 14.71% 289,949,694 13.65% North America 82,339,170 2,600,485 3.71% 59,188,578 2.79% Others 119,951,596 3,788,384 5.39% 116,996,446 5.50% Total $ 2,221,181,271 $ 70,150,689 100.00% $ 2,124,632,264 100.00%
(C) Loans and credit commitments of the Bank and its subsidiaries are shown below by collaterals:
Loans and credit commitments Loans and credit commitments December 31, 2014 December 31, 2013 Amount
Percentage (%) Amount Percentage
(%) NT$ US$ NT$
Unsecured $ 949,352,916 $ 29,983,037 42.74% $ 897,493,802 42.24%
Secured
- Secured by stocks 129,901,387 4,102,624 5.85% 126,390,467 5.95%
- Secured by bonds 121,567,167 3,839,408 5.47% 113,937,654 5.36%
- Secured by real estate 758,697,160 23,961,632 34.16% 677,586,640 31.89%
- Secured by chattel 107,034,588 3,380,431 4.82% 108,281,947 5.10%
- Secured by letter of guarantee 45,901,662 1,449,694 2.07% 59,434,381 2.80%
- Others 108,726,391 3,433,863 4.89% 141,507,373 6.66% Total $ 2,221,181,271 $ 70,150,689 100.00% $ 2,124,632,264 100.00%
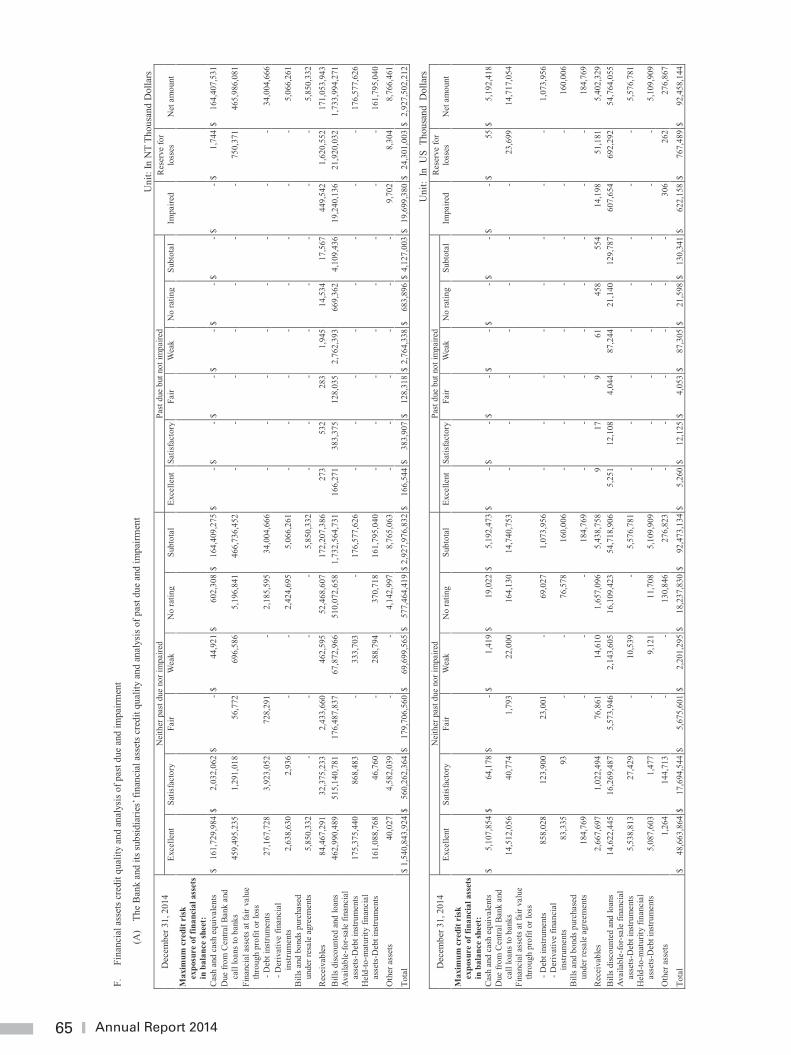
65 Annual Report 2014
65
F.
Fina
ncia
l ass
ets c
redi
t qua
lity
and
anal
ysis
of p
ast d
ue a
nd im
pairm
ent
(A)
The
Ban
k an
d its
subs
idia
ries’
finan
cial
ass
ets c
redi
t qua
lity
and
anal
ysis
of p
ast d
ue a
nd im
pairm
ent
Uni
t: In
NT
Thou
sand
Dol
lars
Dec
embe
r 31,
201
4 N
eith
er p
ast d
ue n
or im
paire
d Pa
st d
ue b
ut n
ot im
paire
d Im
paire
d R
eser
ve fo
r lo
sses
N
et a
mou
nt
Exce
llent
Sa
tisfa
ctor
y Fa
ir W
eak
No
ratin
g Su
btot
al
Exce
llent
Sa
tisfa
ctor
y Fa
ir W
eak
No
ratin
g Su
btot
al
Max
imum
cre
dit r
isk
expo
sure
of f
inan
cial
ass
ets
in b
alan
ce sh
eet:
Cas
h an
d ca
sh e
quiv
alen
ts
$ 16
1,72
9,98
4 $
2,03
2,06
2 $
- $
44,9
21 $
60
2,30
8 $
164,
409,
275
$ -
$ -
$ -
$ -
$ -
$ -
$ -
$ 1,
744
$ 16
4,40
7,53
1 D
ue fr
om C
entra
l Ban
k an
d ca
ll lo
ans t
o ba
nks
459,
495,
235
1,29
1,01
8 56
,772
69
6,58
6 5,
196,
841
466,
736,
452
- -
- -
- -
- 75
0,37
1 46
5,98
6,08
1 Fi
nanc
ial a
sset
s at f
air v
alue
th
roug
h pr
ofit
or lo
ss
- Deb
t ins
trum
ents
27
,167
,728
3,
923,
052
728,
291
- 2,
185,
595
34,0
04,6
66
- -
- -
- -
- -
34,0
04,6
66
- Der
ivat
ive
finan
cial
in
stru
men
ts
2,63
8,63
0 2,
936
- -
2,42
4,69
5 5,
066,
261
- -
- -
- -
- -
5,06
6,26
1 B
ills a
nd b
onds
pur
chas
ed
unde
r res
ale
agre
emen
ts
5,85
0,33
2 -
- -
- 5,
850,
332
- -
- -
- -
- -
5,85
0,33
2 R
ecei
vabl
es
84,4
67,2
91
32,3
75,2
33
2,43
3,66
0 46
2,59
5 52
,468
,607
17
2,20
7,38
6 27
3 53
2 28
3 1,
945
14,5
34
17,5
67
449,
542
1,62
0,55
2 17
1,05
3,94
3 B
ills d
iscou
nted
and
loan
s
462,
990,
489
515,
140,
781
176,
487,
837
67,8
72,9
66
510,
072,
658
1,73
2,56
4,73
1 16
6,27
1 38
3,37
5 12
8,03
5 2,
762,
393
669,
362
4,10
9,43
6 19
,240
,136
21
,920
,032
1,
733,
994,
271
Avai
labl
e-fo
r-sal
e fin
anci
al
asse
ts-D
ebt i
nstru
men
ts
175,
375,
440
868,
483
- 33
3,70
3 -
176,
577,
626
- -
- -
- -
- -
176,
577,
626
Hel
d-to
-mat
urity
fina
ncia
l as
sets
-Deb
t ins
trum
ents
16
1,08
8,76
8 46
,760
-
288,
794
370,
718
161,
795,
040
- -
- -
- -
- -
161,
795,
040
Oth
er a
sset
s 40
,027
4,
582,
039
- -
4,14
2,99
7 8,
765,
063
- -
- -
- -
9,70
2 8,
304
8,76
6,46
1
Tota
l $
1,54
0,84
3,92
4 $
560,
262,
364
$ 17
9,70
6,56
0 $
69,6
99,5
65 $
57
7,46
4,41
9 $
2,92
7,97
6,83
2 $
166,
544
$ 38
3,90
7 $
128,
318
$ 2,
764,
338
$ 68
3,89
6 $
4,12
7,00
3 $
19,6
99,3
80 $
24
,301
,003
$ 2
,927
,502
,212
Uni
t: In
US
Thou
sand
Dol
lars
Dec
embe
r 31,
201
4 N
eith
er p
ast d
ue n
or im
paire
d Pa
st d
ue b
ut n
ot im
paire
d Im
paire
d R
eser
ve fo
r lo
sses
N
et a
mou
nt
Exce
llent
Sa
tisfa
ctor
y Fa
ir W
eak
No
ratin
g Su
btot
al
Exce
llent
Sa
tisfa
ctor
y Fa
ir W
eak
No
ratin
g Su
btot
al
Max
imum
cre
dit r
isk
expo
sure
of f
inan
cial
ass
ets
in b
alan
ce sh
eet:
Cas
h an
d ca
sh e
quiv
alen
ts
$ 5,
107,
854
$ 64
,178
$
- $
1,41
9 $
19,0
22 $
5,
192,
473
$ -
$ -
$ -
$ -
$ -
$ -
$ -
$ 55
$
5,19
2,41
8 D
ue fr
om C
entra
l Ban
k an
d ca
ll lo
ans t
o ba
nks
14,5
12,0
56
40,7
74
1,79
3 22
,000
16
4,13
0 14
,740
,753
-
- -
- -
- -
23,6
99
14,7
17,0
54
Fina
ncia
l ass
ets a
t fai
r val
ue
thro
ugh
prof
it or
loss
- Deb
t ins
trum
ents
8
58,0
28
123
,900
23
,001
-
69,0
27
1,07
3,95
6 -
- -
- -
- -
- 1,
073,
956
- Der
ivat
ive
finan
cial
in
stru
men
ts
8
3,33
5 93
-
- 76
,578
16
0,00
6 -
- -
- -
- -
- 16
0,00
6 B
ills a
nd b
onds
pur
chas
ed
unde
r res
ale
agre
emen
ts
184,
769
-
- -
184,
769
- -
- -
- -
- -
184,
769
Rec
eiva
bles
2,
667,
697
1
,022
,494
76
,861
14
,610
1,
657,
096
5,43
8,75
8 9
17
9 61
45
8 55
4 14
,198
51
,181
5,
402,
329
Bill
s disc
ount
ed a
nd lo
ans
14
,622
,445
16
,269
,487
5,
573,
946
2,14
3,60
5 16
,109
,423
54
,718
,906
5,
251
12,1
08
4,04
4 87
,244
21
,140
12
9,78
7 60
7,65
4 69
2,29
2 54
,764
,055
Av
aila
ble-
for-s
ale
finan
cial
as
sets
-Deb
t ins
trum
ents
5,
538,
813
27,4
29
- 10
,539
-
5,57
6,78
1
- -
- -
- -
- -
5,57
6,78
1 H
eld-
to-m
atur
ity fi
nanc
ial
asse
ts-D
ebt i
nstru
men
ts
5,08
7,60
3 1,
477
- 9,
121
11,7
08
5,10
9,90
9 -
- -
- -
- -
- 5,
109,
909
Oth
er a
sset
s 1,
264
144
,713
-
- 13
0,84
6 27
6,82
3 -
- -
- -
- 30
6 26
2 27
6,86
7
Tota
l $
48,
663,
864
$ 17
,694
,544
$
5,67
5,60
1 $
2,2
01,2
95 $
18
,237
,830
$
92,
473,
134
$ 5,
260
$ 12
,125
$
4,05
3 $
87,3
05 $
21
,598
$
130,
341
$ 62
2,15
8 $
767,
489
$ 92
,458
,144
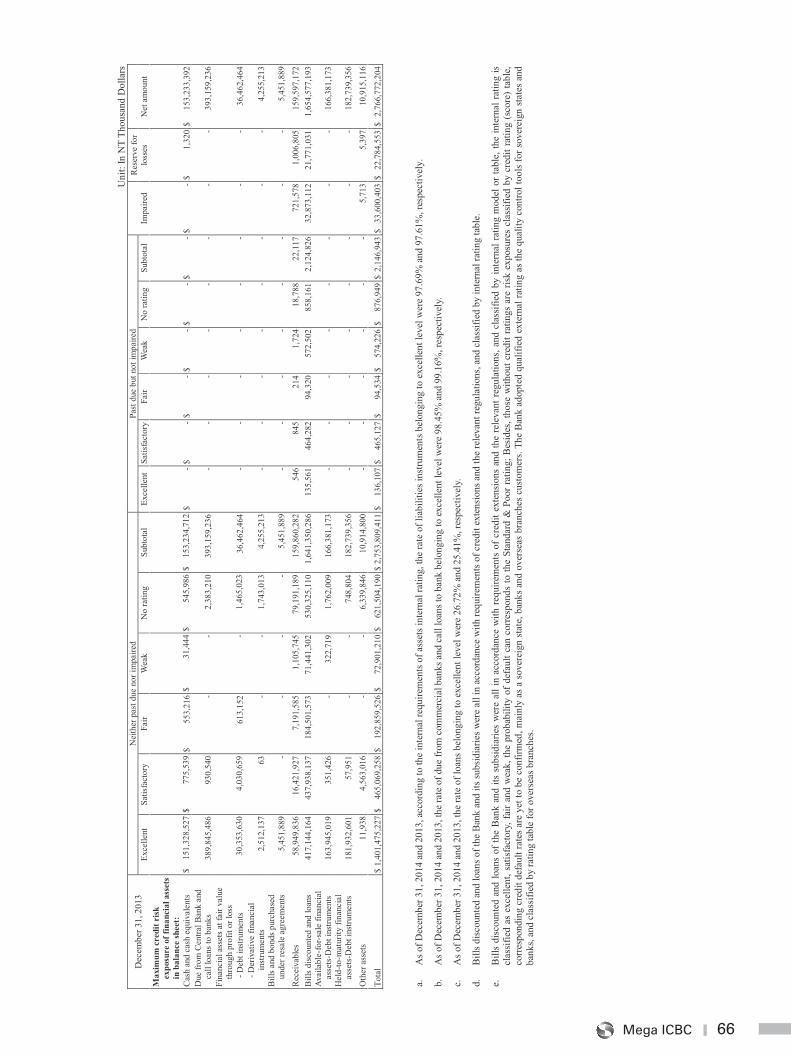
66Mega ICBC
66
Uni
t: In
NT
Thou
sand
Dol
lars
Dec
embe
r 31,
201
3 N
eith
er p
ast d
ue n
or im
paire
d Pa
st d
ue b
ut n
ot im
paire
d Im
paire
d R
eser
ve fo
r lo
sses
N
et a
mou
nt
Exce
llent
Sa
tisfa
ctor
y Fa
ir W
eak
No
ratin
g Su
btot
al
Exce
llent
Sa
tisfa
ctor
y Fa
ir W
eak
No
ratin
g Su
btot
al
Max
imum
cre
dit r
isk
expo
sure
of f
inan
cial
ass
ets
in b
alan
ce sh
eet:
Cas
h an
d ca
sh e
quiv
alen
ts
$ 15
1,32
8,52
7 $
775,
539
$ 55
3,21
6 $
31,4
44 $
54
5,98
6 $
153,
234,
712
$ -
$ -
$ -
$ -
$ -
$ -
$ -
$ 1,
320
$ 15
3,23
3,39
2 D
ue fr
om C
entra
l Ban
k an
d ca
ll lo
ans t
o ba
nks
389,
845,
486
930,
540
- -
2,38
3,21
0 39
3,15
9,23
6 -
- -
- -
- -
- 39
3,15
9,23
6 Fi
nanc
ial a
sset
s at f
air v
alue
th
roug
h pr
ofit
or lo
ss
- D
ebt i
nstru
men
ts
30,3
53,6
30
4,03
0,65
9 61
3,15
2 -
1,46
5,02
3
36,4
62,4
64
- -
- -
- -
- -
36,4
62,4
64
- Der
ivat
ive
finan
cial
in
stru
men
ts
2,51
2,13
7 63
-
- 1,
743,
013
4,
255,
213
- -
- -
- -
- -
4,25
5,21
3 B
ills a
nd b
onds
pur
chas
ed
unde
r res
ale
agre
emen
ts
5,45
1,88
9 -
- -
-
5,45
1,88
9 -
- -
- -
- -
- 5,
451,
889
Rec
eiva
bles
58
,949
,836
16
,421
,927
7,
191,
585
1,10
5,74
5 79
,191
,189
15
9,86
0,28
2 54
6 84
5 21
4 1,
724
18,7
88
22,1
17
721,
578
1,00
6,80
5 15
9,59
7,17
2 B
ills d
iscou
nted
and
loan
s
417,
144,
164
437,
938,
137
184,
501,
573
71,4
41,3
02
530,
325,
110
1,
641,
350,
286
135,
561
464,
282
94,3
20
572,
502
858,
161
2,12
4,82
6 32
,873
,112
21
,771
,031
1,
654,
577,
193
Avai
labl
e-fo
r-sal
e fin
anci
al
asse
ts-D
ebt i
nstru
men
ts
163,
945,
019
351,
426
- 32
2,71
9 1,
762,
009
16
6,38
1,17
3 -
- -
- -
- -
- 16
6,38
1,17
3 H
eld-
to-m
atur
ity fi
nanc
ial
asse
ts-D
ebt i
nstru
men
ts
181,
932,
601
57,9
51
- -
748,
804
18
2,73
9,35
6 -
- -
- -
- -
- 18
2,73
9,35
6 O
ther
ass
ets
11,9
38
4,56
3,01
6 -
- 6,
339,
846
10
,914
,800
-
- -
- -
- 5,
713
5,39
7 10
,915
,116
Tota
l $
1,40
1,47
5,22
7 $
465,
069,
258
$ 19
2,85
9,52
6 $
72,9
01,2
10 $
62
1,50
4,19
0 $
2,75
3,80
9,41
1 $
136,
107
$ 46
5,12
7 $
94,5
34 $
57
4,22
6 $
876,
949
$ 2,
146,
943
$ 33
,600
,403
$
22,7
84,5
53 $
2,7
66,7
72,2
04
a.
As o
f Dec
embe
r 31,
201
4 an
d 20
13, a
ccor
ding
to th
e in
tern
al re
quire
men
ts o
f ass
ets i
nter
nal r
atin
g, th
e ra
te o
f lia
bilit
ies i
nstru
men
ts b
elon
ging
to e
xcel
lent
leve
l wer
e 97
.69%
and
97.
61%
, res
pect
ivel
y.
b.
As o
f Dec
embe
r 31,
201
4 an
d 20
13, t
he ra
te o
f due
from
com
mer
cial
ban
ks a
nd c
all l
oans
to b
ank
belo
ngin
g to
exc
elle
nt le
vel w
ere
98.4
5% a
nd 9
9.16
%, r
espe
ctiv
ely.
c.
As o
f Dec
embe
r 31,
201
4 an
d 20
13, t
he ra
te o
f loa
ns b
elon
ging
to e
xcel
lent
leve
l wer
e 26
.72%
and
25.
41%
, res
pect
ivel
y.
d.
Bill
s dis
coun
ted
and
loan
s of t
he B
ank
and
its su
bsid
iarie
s wer
e al
l in
acco
rdan
ce w
ith re
quire
men
ts o
f cre
dit e
xten
sion
s and
the
rele
vant
regu
latio
ns, a
nd c
lass
ified
by
inte
rnal
ratin
g ta
ble.
e.
Bill
s di
scou
nted
and
loan
s of
the
Ban
k an
d its
sub
sidia
ries
wer
e al
l in
acco
rdan
ce w
ith re
quire
men
ts o
f cre
dit e
xten
sion
s an
d th
e re
leva
nt re
gula
tions
, and
cla
ssifi
ed b
y in
tern
al ra
ting
mod
el o
r tab
le, t
he in
tern
al ra
ting
is cl
assi
fied
as e
xcel
lent
, sat
isfa
ctor
y, fa
ir an
d w
eak,
the
prob
abili
ty o
f def
ault
can
corre
spon
ds to
the
Stan
dard
& P
oor r
atin
g; B
esid
es, t
hose
with
out c
redi
t rat
ings
are
ris
k ex
posu
res
clas
sifie
d by
cre
dit r
atin
g (s
core
) ta
ble,
corre
spon
ding
cre
dit d
efau
lt ra
tes
are
yet t
o be
con
firm
ed, m
ainl
y as
a s
over
eign
sta
te, b
anks
and
ove
rsea
s br
anch
es c
usto
mer
s. Th
e B
ank
adop
ted
qual
ified
ext
erna
l rat
ing
as th
e qu
ality
con
trol t
ools
for s
over
eign
sta
tes a
nd
bank
s, an
d cl
assi
fied
by ra
ting
tabl
e fo
r ove
rsea
s bra
nche
s.
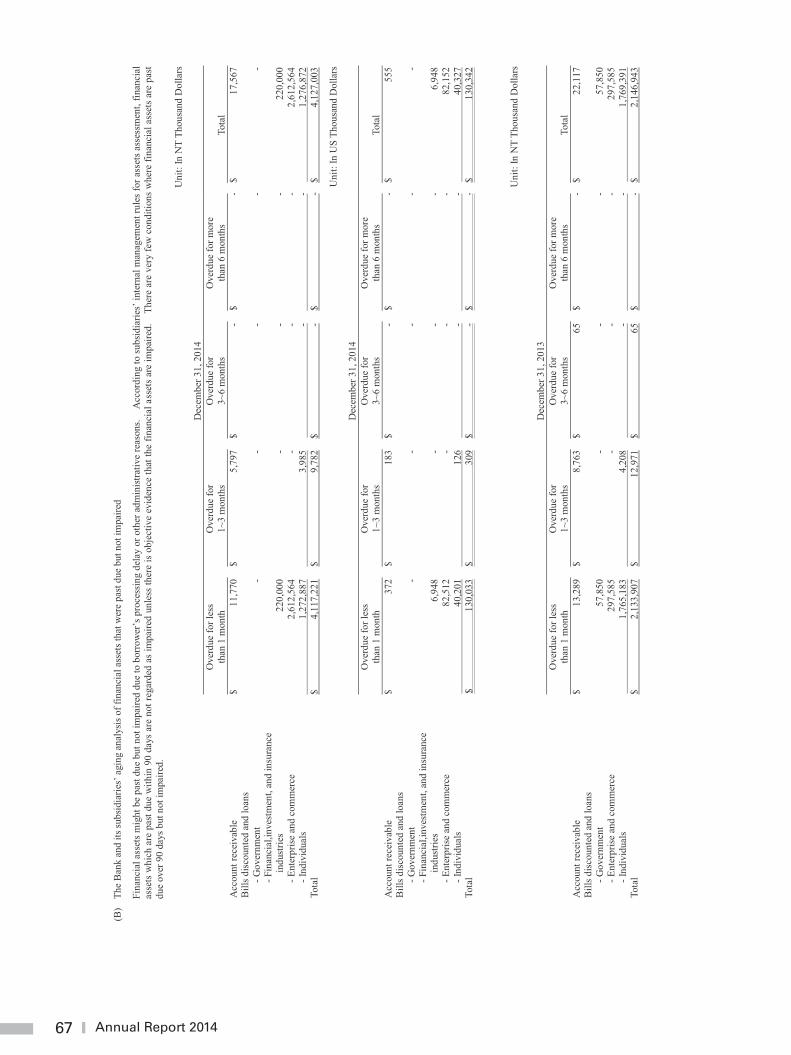
67 Annual Report 2014
67
(B)
The
Ban
k an
d its
subs
idia
ries’
agi
ng a
naly
sis o
f fin
anci
al a
sset
s tha
t wer
e pa
st d
ue b
ut n
ot im
paire
d
Fina
ncia
l ass
ets m
ight
be
past
due
but n
ot im
paire
d du
e to
bor
row
er’s
pro
cess
ing
dela
y or
oth
er a
dmin
istra
tive
reas
ons.
Acc
ordi
ng to
subs
idia
ries’
inte
rnal
man
agem
ent r
ules
for a
sset
s ass
essm
ent,
finan
cial
as
sets
whi
ch a
re p
ast d
ue w
ithin
90
days
are
not
rega
rded
as
impa
ired
unle
ss th
ere
is o
bjec
tive
evid
ence
that
the
finan
cial
ass
ets a
re im
paire
d.
Ther
e ar
e ve
ry fe
w c
ondi
tions
whe
re fi
nanc
ial a
sset
s ar
e pa
st du
e ov
er 9
0 da
ys b
ut n
ot im
paire
d.
Uni
t: In
NT
Thou
sand
Dol
lars
D
ecem
ber 3
1, 2
014
O
verd
ue fo
r les
s th
an 1
mon
th
O
verd
ue fo
r 1~
3 m
onth
s
Ove
rdue
for
3~6
mon
ths
O
verd
ue fo
r mor
e th
an 6
mon
ths
To
tal
Acc
ount
rece
ivab
le
$ 11
,770
$
5,79
7 $
- $
- $
17,5
67
Bill
s dis
coun
ted
and
loan
s
- Gov
ernm
ent
-
-
-
-
- - F
inan
cial
,inve
stm
ent,
and
insu
ranc
e in
dust
ries
22
0,00
0
-
-
-
220,
000
- Ent
erpr
ise
and
com
mer
ce
2,
612,
564
-
- -
2,
612,
564
- Ind
ivid
uals
1,27
2,88
7
3,
985
-
-
1,27
6,87
2 To
tal
$ 4,
117,
221
$
9,78
2 $
- $
- $
4,12
7,00
3
Uni
t: In
US
Thou
sand
Dol
lars
D
ecem
ber 3
1, 2
014
O
verd
ue fo
r les
s th
an 1
mon
th
O
verd
ue fo
r 1~
3 m
onth
s
Ove
rdue
for
3~6
mon
ths
O
verd
ue fo
r mor
e th
an 6
mon
ths
To
tal
Acc
ount
rece
ivab
le
$ 37
2
$ 18
3 $
- $
- $
555
Bill
s dis
coun
ted
and
loan
s
- Gov
ernm
ent
-
-
-
-
- - F
inan
cial
,inve
stm
ent,
and
insu
ranc
e in
dust
ries
6,
948
-
-
-
6,
948
- Ent
erpr
ise
and
com
mer
ce
82
,512
-
- -
82
,152
- I
ndiv
idua
ls
40
,201
126
-
-
40,3
27
Tota
l $
130,
033
$
309
$ -
$ -
$ 13
0,34
2
Uni
t: In
NT
Thou
sand
Dol
lars
D
ecem
ber 3
1, 2
013
O
verd
ue fo
r les
s th
an 1
mon
th
O
verd
ue fo
r 1~
3 m
onth
s
Ove
rdue
for
3~6
mon
ths
O
verd
ue fo
r mor
e th
an 6
mon
ths
To
tal
Acc
ount
rece
ivab
le
$ 13
,289
$
8,76
3 $
65
$ -
$ 22
,117
B
ills d
isco
unte
d an
d lo
ans
- G
over
nmen
t
57,8
50
-
-
-
57,8
50
- Ent
erpr
ise
and
com
mer
ce
29
7,58
5
-
-
-
297,
585
- Ind
ivid
uals
1,76
5,18
3
4,
208
-
-
1,76
9,39
1 To
tal
$ 2,
133,
907
$
12,9
71
$ 65
$
- $
2,14
6,94
3
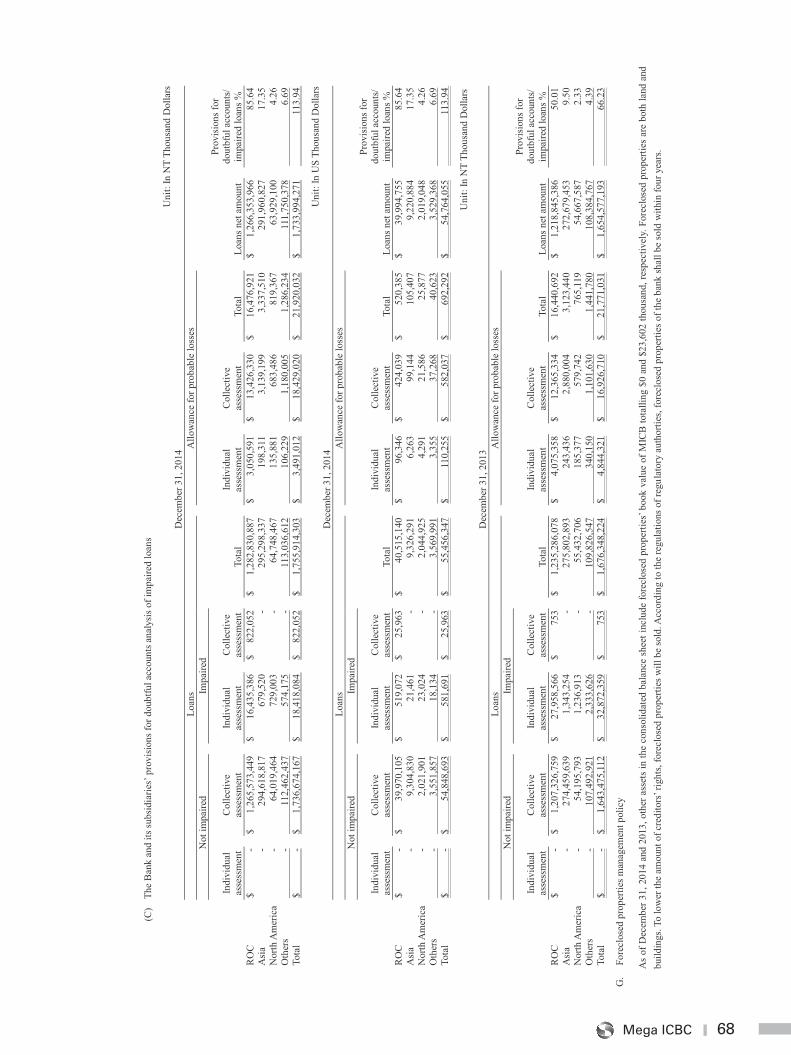
68Mega ICBC
68
(C)
The
Ban
k an
d its
subs
idia
ries’
pro
visio
ns fo
r dou
btfu
l acc
ount
s ana
lysi
s of i
mpa
ired
loan
s
Uni
t: In
NT
Thou
sand
Dol
lars
Dec
embe
r 31,
201
4
Loan
s
Allo
wan
ce fo
r pro
babl
e lo
sses
Not
impa
ired
Im
paire
d
In
divi
dual
as
sess
men
t
C
olle
ctiv
e as
sess
men
t
In
divi
dual
as
sess
men
t
C
olle
ctiv
e
asse
ssm
ent
Tota
l
In
divi
dual
as
sess
men
t
C
olle
ctiv
e as
sess
men
t
Tota
l
Loan
s net
am
ount
Pr
ovis
ions
for
dout
bful
acc
ount
s/ im
paire
d lo
ans %
R
OC
$
-
$ 1,
265,
573,
449
$
16,4
35,3
86
$ 82
2,05
2
$ 1,
282,
830,
887
$
3,05
0,59
1
$ 13
,426
,330
$
16,4
76,9
21
$
1,26
6,35
3,96
6
85.6
4 A
sia
-
294,
618,
817
679,
520
-
29
5,29
8,33
7
19
8,31
1
3,
139,
199
3,33
7,51
0
29
1,96
0,82
7
17.3
5 N
orth
Am
eric
a
-
64
,019
,464
729,
003
-
64
,748
,467
135,
881
683,
486
819,
367
63,9
29,1
00
4.26
O
ther
s
-
11
2,46
2,43
7
57
4,17
5
-
113,
036,
612
106,
229
1,18
0,00
5
1,
286,
234
111,
750,
378
6.
69
Tota
l $
-
$ 1,
736,
674,
167
$
18,4
18,0
84
$
822,
052
$
1,75
5,91
4,30
3
$ 3,
491,
012
$
18,4
29,0
20
$ 21
,920
,032
$
1,73
3,99
4,27
1
11
3.94
Uni
t: In
US
Thou
sand
Dol
lars
Dec
embe
r 31,
201
4
Loan
s
Allo
wan
ce fo
r pro
babl
e lo
sses
Not
impa
ired
Im
paire
d
In
divi
dual
as
sess
men
t
C
olle
ctiv
e as
sess
men
t
In
divi
dual
as
sess
men
t
C
olle
ctiv
e
asse
ssm
ent
Tota
l
In
divi
dual
as
sess
men
t
C
olle
ctiv
e as
sess
men
t
Tota
l
Loan
s net
am
ount
Pr
ovis
ions
for
dout
bful
acc
ount
s/ im
paire
d lo
ans %
R
OC
$
-
$ 39
,970
,105
$
519,
072
$
25,9
63
$ 40
,515
,140
$
96,3
46
$ 42
4,03
9
$ 52
0,38
5
$
39,9
94,7
55
85.6
4 A
sia
-
9,30
4,83
0
21
,461
-
9,
326,
291
6,26
3
99
,144
105,
407
9,22
0,88
4
17.3
5 N
orth
Am
eric
a
-
2,
021,
901
23,0
24
-
2,04
4,92
5
4,
291
21,5
86
25
,877
2,01
9,04
8
4.26
O
ther
s
-
3,
551,
857
18,1
34
-
3,56
9,99
1
3,
355
37,2
68
40
,623
3,52
9,36
8
6.69
To
tal
$ -
$
54,8
48,6
93
$ 58
1,69
1
$
25,9
63
$ 55
,456
,347
$
110,
255
$
582,
037
$
692,
292
$
54,7
64,0
55
11
3.94
U
nit:
In N
T Th
ousa
nd D
olla
rs
D
ecem
ber 3
1, 2
013
Lo
ans
A
llow
ance
for p
roba
ble
loss
es
N
ot im
paire
d
Impa
ired
In
divi
dual
as
sess
men
t
C
olle
ctiv
e as
sess
men
t
In
divi
dual
as
sess
men
t
C
olle
ctiv
e
asse
ssm
ent
Tota
l
In
divi
dual
as
sess
men
t
C
olle
ctiv
e as
sess
men
t
Tota
l
Loan
s net
am
ount
Pr
ovis
ions
for
dout
bful
acc
ount
s/ im
paire
d lo
ans %
R
OC
$
-
$ 1,
207,
326,
759
$
27,9
58,5
66
$ 75
3
$ 1,
235,
286,
078
$
4,07
5,35
8
$ 12
,365
,334
$
16,4
40,6
92
$
1,21
8,84
5,38
6
50.0
1 A
sia
-
274,
459,
639
1,34
3,25
4
-
275,
802,
893
24
3,43
6
2,
880,
004
3,12
3,44
0
27
2,67
9,45
3
9.50
N
orth
Am
eric
a
-
54
,195
,793
1,23
6,91
3
-
55,4
32,7
06
18
5,37
7
57
9,74
2
76
5,11
9
54
,667
,587
2.
33
Oth
ers
-
107,
492,
921
2,33
3,62
6
-
109,
826,
547
340,
150
1,10
1,63
0
1,
441,
780
108,
384,
767
4.39
To
tal
$ -
$
1,64
3,47
5,11
2
$ 32
,872
,359
$
75
3
$ 1,
676,
348,
224
$
4,84
4,32
1
$ 16
,926
,710
$
21,7
71,0
31
$ 1,
654,
577,
193
66.2
3
G.
Fore
clos
ed p
rope
rties
man
agem
ent p
olic
y
As
of D
ecem
ber 3
1, 2
014
and
2013
, oth
er a
sset
s in
the
cons
olid
ated
bal
ance
she
et in
clud
e fo
recl
osed
pro
perti
es’ b
ook
valu
e of
MIC
B to
talli
ng $
0 an
d $2
3,60
2 th
ousa
nd, r
espe
ctiv
ely.
For
eclo
sed
prop
ertie
s ar
e bo
th la
nd a
nd
build
ings
. To
low
er th
e am
ount
of c
redi
tors
’ rig
hts,
fore
clos
ed p
rope
rties
will
be
sold
. Acc
ordi
ng to
the
regu
latio
ns o
f reg
ulat
ory
auth
ortie
s, fo
recl
osed
pro
perti
es o
f the
ban
k sh
all b
e so
ld w
ithin
four
yea
rs.
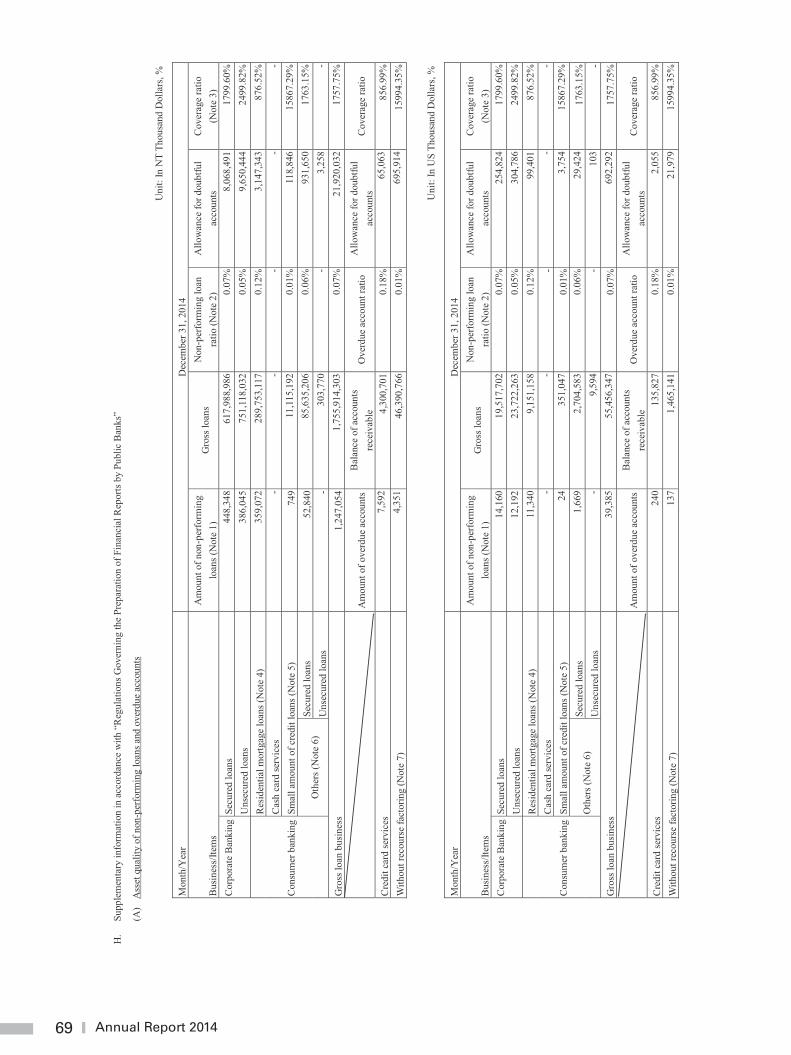
69 Annual Report 2014
69
H.
Supp
lem
enta
ry in
form
atio
n in
acc
orda
nce
with
“R
egul
atio
ns G
over
ning
the
Prep
arat
ion
of F
inan
cial
Rep
orts
by
Publ
ic B
anks
”
(A)
Ass
et q
ualit
y of
non
-per
form
ing
loan
s and
ove
rdue
acc
ount
s
Uni
t: In
NT
Thou
sand
Dol
lars
, %
Mon
th/Y
ear
Dec
embe
r 31,
201
4
Bus
ines
s/Ite
ms
Am
ount
of n
on-p
erfo
rmin
g lo
ans (
Not
e 1)
G
ross
loan
s N
on-p
erfo
rmin
g lo
an
ratio
(Not
e 2)
A
llow
ance
for d
oubt
ful
acco
unts
C
over
age
ratio
(N
ote
3)
Cor
pora
te B
anki
ng S
ecur
ed lo
ans
448,
348
617,
988,
986
0.07
%
8,06
8,49
1 17
99.6
0%
Uns
ecur
ed lo
ans
386,
045
751,
118,
032
0.05
%
9,65
0,44
4 24
99.8
2%
Con
sum
er b
anki
ng R
esid
entia
l mor
tgag
e lo
ans (
Not
e 4)
35
9,07
2 28
9,75
3,11
7 0.
12%
3,
147,
343
876.
52%
Cas
h ca
rd se
rvic
es
- -
- -
-
Smal
l am
ount
of c
redi
t loa
ns (N
ote
5)
749
11,1
15,1
92
0.01
%
118,
846
1586
7.29
%
Oth
ers (
Not
e 6)
Se
cure
d lo
ans
52,8
40
85,
635,
206
0.06
%
931,
650
1763
.15%
Uns
ecur
ed lo
ans
- 30
3,77
0 -
3,25
8 -
Gro
ss lo
an b
usin
ess
1,24
7,05
4 1,
755,
914,
303
0.07
%
21,9
20,0
32
1757
.75%
A
mou
nt o
f ove
rdue
acc
ount
s B
alan
ce o
f acc
ount
s re
ceiv
able
O
verd
ue a
ccou
nt ra
tio
Allo
wan
ce fo
r dou
btfu
l ac
coun
ts
Cov
erag
e ra
tio
Cre
dit c
ard
serv
ices
7,
592
4,30
0,70
1 0.
18%
65
,063
85
6.99
%
With
out r
ecou
rse
fact
orin
g (N
ote
7)
4,35
1 46
,390
,766
0.
01%
69
5,91
4 15
994.
35%
Uni
t: In
US
Thou
sand
Dol
lars
, %
Mon
th/Y
ear
Dec
embe
r 31,
201
4
Bus
ines
s/Ite
ms
Am
ount
of n
on-p
erfo
rmin
g lo
ans (
Not
e 1)
G
ross
loan
s N
on-p
erfo
rmin
g lo
an
ratio
(Not
e 2)
A
llow
ance
for d
oubt
ful
acco
unts
C
over
age
ratio
(N
ote
3)
Cor
pora
te B
anki
ng S
ecur
ed lo
ans
14,1
60
19,5
17,7
02
0.07
%
254,
824
1799
.60%
Uns
ecur
ed lo
ans
12,1
92
23,7
22,2
63
0.05
%
304,
786
2499
.82%
Con
sum
er b
anki
ng R
esid
entia
l mor
tgag
e lo
ans (
Not
e 4)
11
,340
9,
151,
158
0.12
%
99,4
01
876.
52%
Cas
h ca
rd se
rvic
es
- -
- -
-
Smal
l am
ount
of c
redi
t loa
ns (N
ote
5)
24
351,
047
0.01
%
3,75
4 15
867.
29%
Oth
ers (
Not
e 6)
Se
cure
d lo
ans
1,66
9 2,
704,
583
0.06
%
29,4
24
1763
.15%
U
nsec
ured
loan
s -
9,59
4 -
103
- G
ross
loan
bus
ines
s 39
,385
55
,456
,347
0.
07%
69
2,29
2 17
57.7
5%
A
mou
nt o
f ove
rdue
acc
ount
s B
alan
ce o
f acc
ount
s re
ceiv
able
O
verd
ue a
ccou
nt ra
tio
Allo
wan
ce fo
r dou
btfu
l ac
coun
ts
Cov
erag
e ra
tio
Cre
dit c
ard
serv
ices
24
0 13
5,82
7 0.
18%
2,
055
856.
99%
With
out r
ecou
rse
fact
orin
g (N
ote
7)
137
1,46
5,14
1 0
.01%
21
,979
15
994.
35%
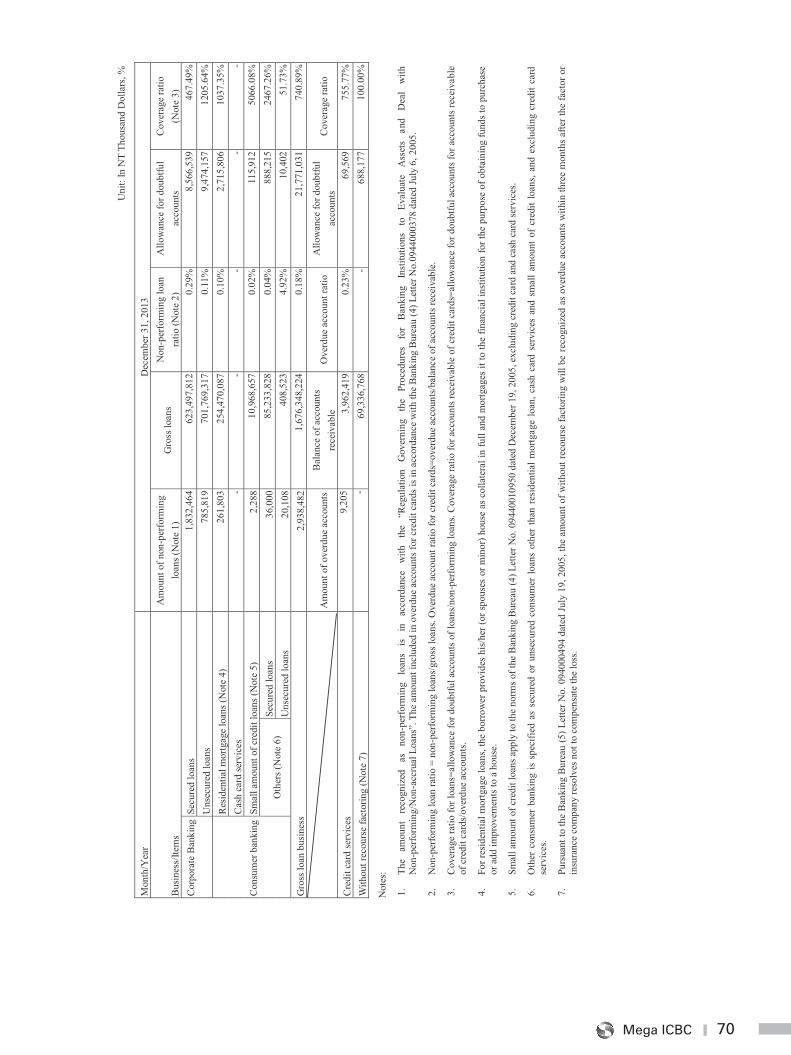
70Mega ICBC
70
Uni
t: In
NT
Thou
sand
Dol
lars
, %
Mon
th/Y
ear
Dec
embe
r 31,
201
3
Bus
ines
s/Ite
ms
Am
ount
of n
on-p
erfo
rmin
g lo
ans (
Not
e 1)
G
ross
loan
s N
on-p
erfo
rmin
g lo
an
ratio
(Not
e 2)
A
llow
ance
for d
oubt
ful
acco
unts
C
over
age
ratio
(N
ote
3)
Cor
pora
te B
anki
ng S
ecur
ed lo
ans
1,83
2,46
4 62
3,49
7,81
2 0.
29%
8,
566,
539
467.
49%
Uns
ecur
ed lo
ans
785,
819
701,
769,
317
0.11
%
9,47
4,15
7 12
05.6
4%
Con
sum
er b
anki
ng R
esid
entia
l mor
tgag
e lo
ans (
Not
e 4)
26
1,80
3 25
4,47
0,08
7 0.
10%
2,
715,
806
1037
.35%
Cas
h ca
rd se
rvic
es
- -
-
- -
Smal
l am
ount
of c
redi
t loa
ns (N
ote
5)
2,28
8 10
,968
,657
0.
02%
11
5,91
2 50
66.0
8%
Oth
ers (
Not
e 6)
Se
cure
d lo
ans
36,0
00
85,
233,
828
0.04
%
888,
215
2467
.26%
Uns
ecur
ed lo
ans
20,1
08
408,
523
4.92
%
10,4
02
51.7
3%
Gro
ss lo
an b
usin
ess
2,93
8,48
2 1,
676,
348,
224
0.18
%
21,7
71,0
31
740.
89%
A
mou
nt o
f ove
rdue
acc
ount
s B
alan
ce o
f acc
ount
s re
ceiv
able
O
verd
ue a
ccou
nt ra
tio
Allo
wan
ce fo
r dou
btfu
l ac
coun
ts
Cov
erag
e ra
tio
Cre
dit c
ard
serv
ices
9,
205
3,96
2,41
9 0.
23%
69
,569
75
5.77
%
With
out r
ecou
rse
fact
orin
g (N
ote
7)
- 69
,336
,768
-
688,
177
100.
00%
Not
es:
1.
The
amou
nt
reco
gniz
ed
as
non-
perfo
rmin
g lo
ans
is
in
acco
rdan
ce
with
th
e “R
egul
atio
n G
over
ning
th
e Pr
oced
ures
fo
r B
anki
ng
Inst
itutio
ns
to
Eval
uate
A
sset
s an
d D
eal
with
N
on-p
erfo
rmin
g/N
on-a
ccru
al L
oans
”. T
he a
mou
nt in
clud
ed in
ove
rdue
acc
ount
s for
cre
dit c
ards
is in
acc
orda
nce
with
the
Bank
ing
Bur
eau
(4) L
ette
r No.
0944
0003
78 d
ated
July
6, 2
005.
2.
Non
-per
form
ing
loan
ratio
= n
on-p
erfo
rmin
g lo
ans/
gros
s loa
ns. O
verd
ue a
ccou
nt ra
tio fo
r cre
dit c
ards
=ove
rdue
acc
ount
s/bal
ance
of a
ccou
nts r
ecei
vabl
e.
3.
Cov
erag
e ra
tio fo
r loa
ns=a
llow
ance
for d
oubt
ful a
ccou
nts o
f loa
ns/n
on-p
erfo
rmin
g lo
ans.
Cov
erag
e ra
tio fo
r acc
ount
s rec
eiva
ble
of c
redi
t car
ds=a
llow
ance
for d
oubt
ful a
ccou
nts f
or a
ccou
nts r
ecei
vabl
e of
cre
dit c
ards
/ove
rdue
acc
ount
s.
4.
For r
esid
entia
l mor
tgag
e lo
ans,
the
borro
wer
pro
vide
s his/
her (
or sp
ouse
s or
min
or) h
ouse
as c
olla
tera
l in
full
and
mor
tgag
es it
to th
e fin
anci
al in
stitu
tion
for t
he p
urpo
se o
f obt
aini
ng fu
nds t
o pu
rcha
se
or a
dd im
prov
emen
ts to
a h
ouse
.
5.
Smal
l am
ount
of c
redi
t loa
ns a
pply
to th
e no
rms o
f the
Ban
king
Bur
eau
(4) L
ette
r No.
094
4001
0950
dat
ed D
ecem
ber 1
9, 2
005,
exc
ludi
ng c
redi
t car
d an
d ca
sh c
ard
serv
ices
.
6.
Oth
er c
onsu
mer
ban
king
is s
peci
fied
as s
ecur
ed o
r un
secu
red
cons
umer
loan
s ot
her
than
res
iden
tial m
ortg
age
loan
, cas
h ca
rd s
ervi
ces
and
smal
l am
ount
of
cred
it lo
ans,
and
excl
udin
g cr
edit
card
se
rvic
es.
7.
Purs
uant
to th
e B
anki
ng B
urea
u (5
) Let
ter N
o. 0
9400
0494
dat
ed Ju
ly 1
9, 2
005,
the
amou
nt o
f with
out r
ecou
rse
fact
orin
g w
ill b
e re
cogn
ized
as
over
due
acco
unts
with
in th
ree
mon
ths a
fter t
he fa
ctor
or
insu
ranc
e co
mpa
ny re
solv
es n
ot to
com
pens
ate
the
loss
.
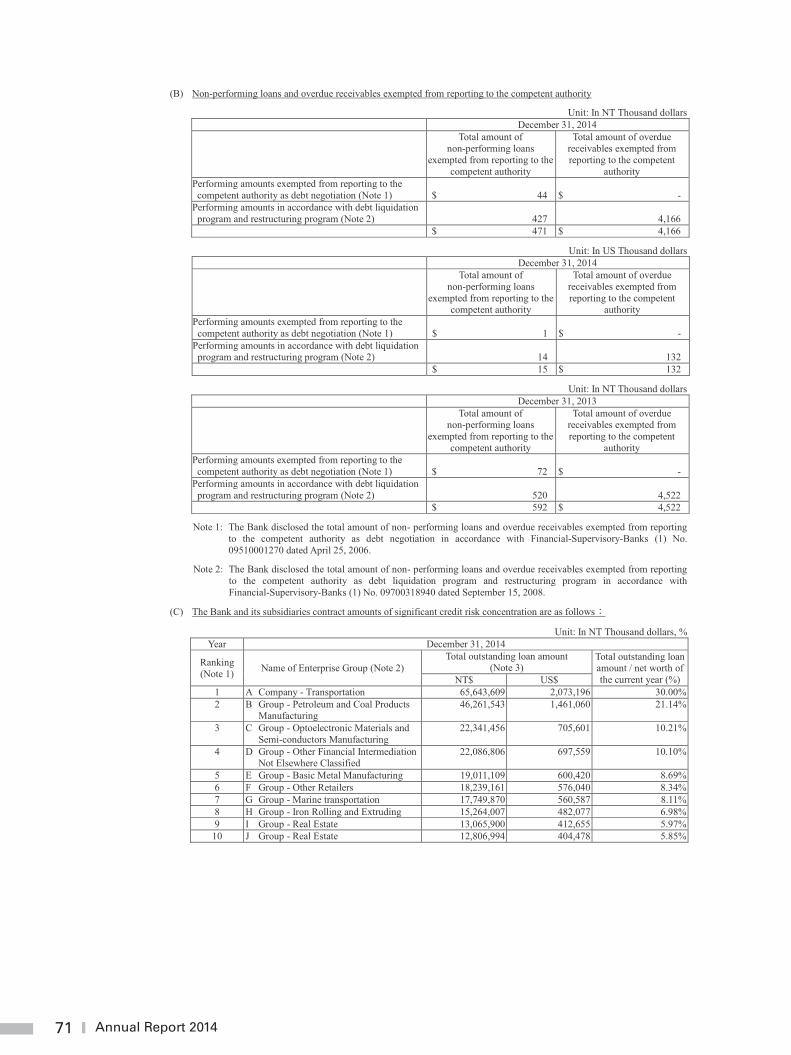
71 Annual Report 2014
71
(B) Non-performing loans and overdue receivables exempted from reporting to the competent authority
Unit: In NT Thousand dollars December 31, 2014 Total amount of
non-performing loans exempted from reporting to the
competent authority
Total amount of overdue receivables exempted from reporting to the competent
authority Performing amounts exempted from reporting to the competent authority as debt negotiation (Note 1) $ 44 $ -
Performing amounts in accordance with debt liquidation program and restructuring program (Note 2) 427 4,166
$ 471 $ 4,166
Unit: In US Thousand dollars December 31, 2014 Total amount of
non-performing loans exempted from reporting to the
competent authority
Total amount of overdue receivables exempted from reporting to the competent
authority Performing amounts exempted from reporting to the competent authority as debt negotiation (Note 1) $ 1 $ -
Performing amounts in accordance with debt liquidation program and restructuring program (Note 2) 14 132
$ 15 $ 132
Unit: In NT Thousand dollars December 31, 2013 Total amount of
non-performing loans exempted from reporting to the
competent authority
Total amount of overdue receivables exempted from reporting to the competent
authority Performing amounts exempted from reporting to the competent authority as debt negotiation (Note 1) $ 72 $ -
Performing amounts in accordance with debt liquidation program and restructuring program (Note 2) 520 4,522
$ 592 $ 4,522
Note 1: The Bank disclosed the total amount of non- performing loans and overdue receivables exempted from reporting to the competent authority as debt negotiation in accordance with Financial-Supervisory-Banks (1) No. 09510001270 dated April 25, 2006.
Note 2: The Bank disclosed the total amount of non- performing loans and overdue receivables exempted from reporting to the competent authority as debt liquidation program and restructuring program in accordance with Financial-Supervisory-Banks (1) No. 09700318940 dated September 15, 2008.
(C) The Bank and its subsidiaries contract amounts of significant credit risk concentration are as follows
Unit: In NT Thousand dollars, % Year December 31, 2014
Ranking (Note 1) Name of Enterprise Group (Note 2)
Total outstanding loan amount (Note 3)
Total outstanding loan amount / net worth of the current year (%) NT$ US$
1 A Company - Transportation 65,643,609 2,073,196 30.00% 2 B Group - Petroleum and Coal Products
Manufacturing 46,261,543 1,461,060 21.14%
3 C Group - Optoelectronic Materials and Semi-conductors Manufacturing
22,341,456 705,601 10.21%
4 D Group - Other Financial Intermediation Not Elsewhere Classified
22,086,806 697,559 10.10%
5 E Group - Basic Metal Manufacturing 19,011,109 600,420 8.69% 6 F Group - Other Retailers 18,239,161 576,040 8.34% 7 G Group - Marine transportation 17,749,870 560,587 8.11% 8 H Group - Iron Rolling and Extruding 15,264,007 482,077 6.98% 9 I Group - Real Estate 13,065,900 412,655 5.97%
10 J Group - Real Estate 12,806,994 404,478 5.85%
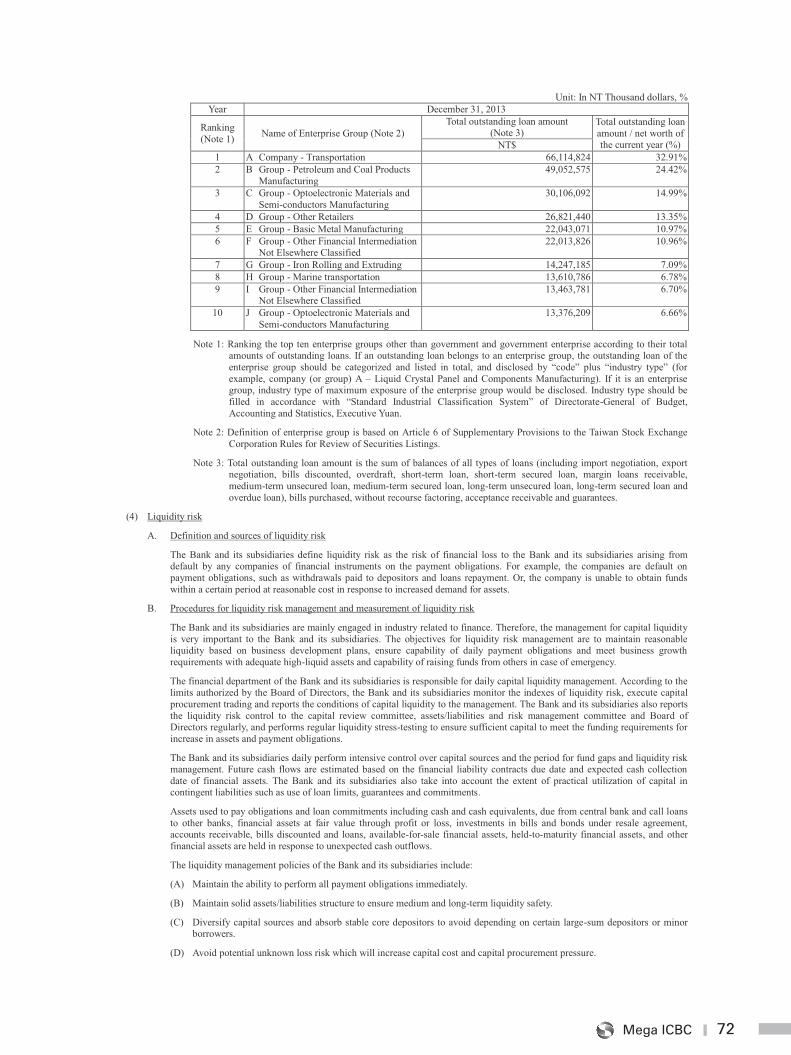
72Mega ICBC
72
Unit: In NT Thousand dollars, % Year December 31, 2013
Ranking (Note 1) Name of Enterprise Group (Note 2)
Total outstanding loan amount (Note 3)
Total outstanding loan amount / net worth of the current year (%) NT$
1 A Company - Transportation 66,114,824 32.91% 2 B Group - Petroleum and Coal Products
Manufacturing 49,052,575 24.42%
3 C Group - Optoelectronic Materials and Semi-conductors Manufacturing
30,106,092 14.99%
4 D Group - Other Retailers 26,821,440 13.35% 5 E Group - Basic Metal Manufacturing 22,043,071 10.97% 6 F Group - Other Financial Intermediation
Not Elsewhere Classified 22,013,826 10.96%
7 G Group - Iron Rolling and Extruding 14,247,185 7.09% 8 H Group - Marine transportation 13,610,786 6.78% 9 I Group - Other Financial Intermediation
Not Elsewhere Classified 13,463,781 6.70%
10 J Group - Optoelectronic Materials and Semi-conductors Manufacturing
13,376,209 6.66%
Note 1: Ranking the top ten enterprise groups other than government and government enterprise according to their total amounts of outstanding loans. If an outstanding loan belongs to an enterprise group, the outstanding loan of the enterprise group should be categorized and listed in total, and disclosed by “code” plus “industry type” (for example, company (or group) A – Liquid Crystal Panel and Components Manufacturing). If it is an enterprise group, industry type of maximum exposure of the enterprise group would be disclosed. Industry type should be filled in accordance with “Standard Industrial Classification System” of Directorate-General of Budget, Accounting and Statistics, Executive Yuan.
Note 2: Definition of enterprise group is based on Article 6 of Supplementary Provisions to the Taiwan Stock Exchange Corporation Rules for Review of Securities Listings.
Note 3: Total outstanding loan amount is the sum of balances of all types of loans (including import negotiation, export negotiation, bills discounted, overdraft, short-term loan, short-term secured loan, margin loans receivable, medium-term unsecured loan, medium-term secured loan, long-term unsecured loan, long-term secured loan and overdue loan), bills purchased, without recourse factoring, acceptance receivable and guarantees.
(4) Liquidity risk
A. Definition and sources of liquidity risk
The Bank and its subsidiaries define liquidity risk as the risk of financial loss to the Bank and its subsidiaries arising from default by any companies of financial instruments on the payment obligations. For example, the companies are default on payment obligations, such as withdrawals paid to depositors and loans repayment. Or, the company is unable to obtain funds within a certain period at reasonable cost in response to increased demand for assets.
B. Procedures for liquidity risk management and measurement of liquidity risk
The Bank and its subsidiaries are mainly engaged in industry related to finance. Therefore, the management for capital liquidity is very important to the Bank and its subsidiaries. The objectives for liquidity risk management are to maintain reasonable liquidity based on business development plans, ensure capability of daily payment obligations and meet business growth requirements with adequate high-liquid assets and capability of raising funds from others in case of emergency.
The financial department of the Bank and its subsidiaries is responsible for daily capital liquidity management. According to the limits authorized by the Board of Directors, the Bank and its subsidiaries monitor the indexes of liquidity risk, execute capital procurement trading and reports the conditions of capital liquidity to the management. The Bank and its subsidiaries also reports the liquidity risk control to the capital review committee, assets/liabilities and risk management committee and Board of Directors regularly, and performs regular liquidity stress-testing to ensure sufficient capital to meet the funding requirements for increase in assets and payment obligations.
The Bank and its subsidiaries daily perform intensive control over capital sources and the period for fund gaps and liquidity risk management. Future cash flows are estimated based on the financial liability contracts due date and expected cash collection date of financial assets. The Bank and its subsidiaries also take into account the extent of practical utilization of capital in contingent liabilities such as use of loan limits, guarantees and commitments.
Assets used to pay obligations and loan commitments including cash and cash equivalents, due from central bank and call loans to other banks, financial assets at fair value through profit or loss, investments in bills and bonds under resale agreement, accounts receivable, bills discounted and loans, available-for-sale financial assets, held-to-maturity financial assets, and other financial assets are held in response to unexpected cash outflows.
The liquidity management policies of the Bank and its subsidiaries include:
(A) Maintain the ability to perform all payment obligations immediately.
(B) Maintain solid assets/liabilities structure to ensure medium and long-term liquidity safety.
(C) Diversify capital sources and absorb stable core depositors to avoid depending on certain large-sum depositors or minor borrowers.
(D) Avoid potential unknown loss risk which will increase capital cost and capital procurement pressure.
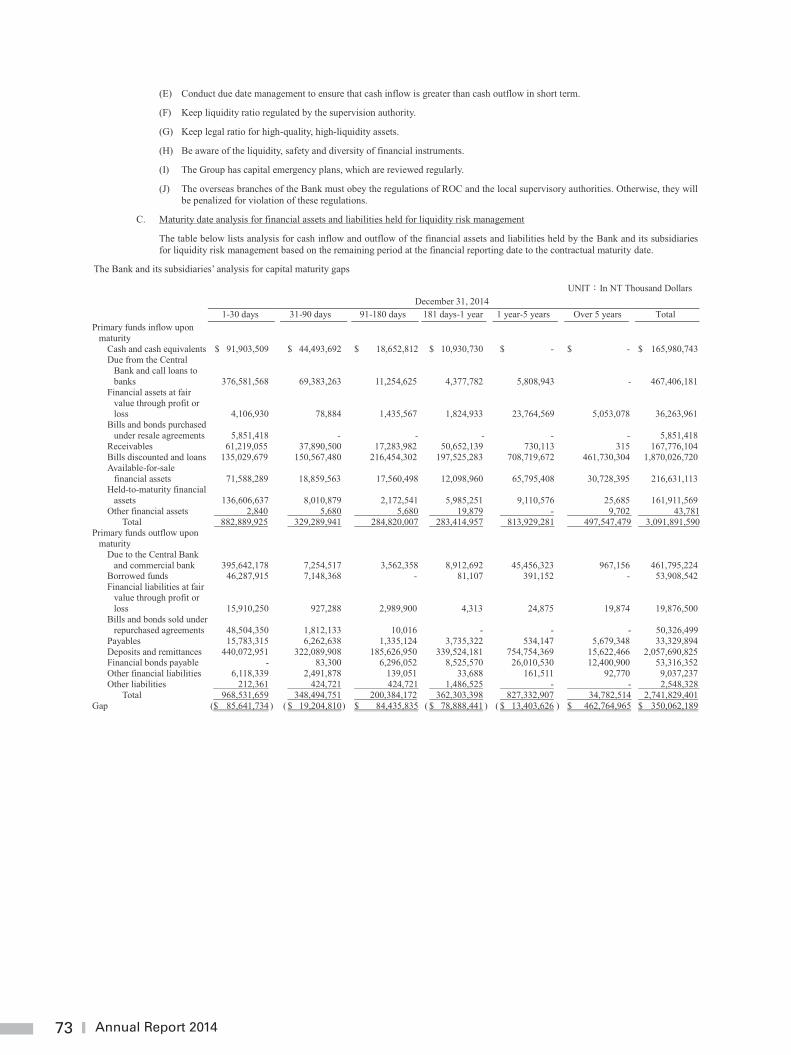
73 Annual Report 2014
73
(E) Conduct due date management to ensure that cash inflow is greater than cash outflow in short term.
(F) Keep liquidity ratio regulated by the supervision authority.
(G) Keep legal ratio for high-quality, high-liquidity assets.
(H) Be aware of the liquidity, safety and diversity of financial instruments.
(I) The Group has capital emergency plans, which are reviewed regularly.
(J) The overseas branches of the Bank must obey the regulations of ROC and the local supervisory authorities. Otherwise, they will be penalized for violation of these regulations.
C. Maturity date analysis for financial assets and liabilities held for liquidity risk management
The table below lists analysis for cash inflow and outflow of the financial assets and liabilities held by the Bank and its subsidiaries for liquidity risk management based on the remaining period at the financial reporting date to the contractual maturity date.
The Bank and its subsidiaries’ analysis for capital maturity gaps
UNIT In NT Thousand Dollars December 31, 2014 1-30 days 31-90 days 91-180 days 181 days-1 year 1 year-5 years Over 5 years Total Primary funds inflow upon
maturity
Cash and cash equivalents $ 91,903,509 $ 44,493,692 $ 18,652,812 $ 10,930,730 $ - $ - $ 165,980,743 Due from the Central
Bank and call loans to banks 376,581,568
69,383,263
11,254,625 4,377,782 5,808,943 - 467,406,181 Financial assets at fair
value through profit or loss 4,106,930
78,884 1,435,567 1,824,933 23,764,569 5,053,078 36,263,961 Bills and bonds purchased
under resale agreements 5,851,418
-
-
-
- - 5,851,418 Receivables 61,219,055 37,890,500 17,283,982 50,652,139 730,113 315 167,776,104 Bills discounted and loans 135,029,679 150,567,480 216,454,302 197,525,283 708,719,672 461,730,304 1,870,026,720 Available-for-sale
financial assets 71,588,289 18,859,563 17,560,498
12,098,960
65,795,408 30,728,395 216,631,113 Held-to-maturity financial
assets 136,606,637 8,010,879 2,172,541 5,985,251 9,110,576 25,685 161,911,569
Other financial assets 2,840 5,680 5,680 19,879 - 9,702 43,781Total 882,889,925 329,289,941 284,820,007 283,414,957 813,929,281 497,547,479 3,091,891,590
Primary funds outflow upon maturity
Due to the Central Bank
and commercial bank 395,642,178 7,254,517
3,562,358
8,912,692 45,456,323 967,156 461,795,224 Borrowed funds 46,287,915 7,148,368 - 81,107 391,152 - 53,908,542 Financial liabilities at fair
value through profit or loss 15,910,250 927,288 2,989,900 4,313 24,875 19,874 19,876,500
Bills and bonds sold under repurchased agreements 48,504,350 1,812,133 10,016
-
-
- 50,326,499
Payables 15,783,315 6,262,638 1,335,124 3,735,322 534,147 5,679,348 33,329,894 Deposits and remittances 440,072,951 322,089,908 185,626,950 339,524,181 754,754,369 15,622,466 2,057,690,825 Financial bonds payable - 83,300 6,296,052 8,525,570 26,010,530 12,400,900 53,316,352 Other financial liabilities 6,118,339 2,491,878 139,051 33,688 161,511 92,770 9,037,237 Other liabilities 212,361 424,721 424,721 1,486,525 - - 2,548,328
Total 968,531,659 348,494,751 200,384,172 362,303,398 827,332,907 34,782,514 2,741,829,401 Gap ($ 85,641,734 ) ( $ 19,204,810 )
$ 84,435,835 ( $ 78,888,441 ) ( $ 13,403,626 ) $ 462,764,965 $ 350,062,189
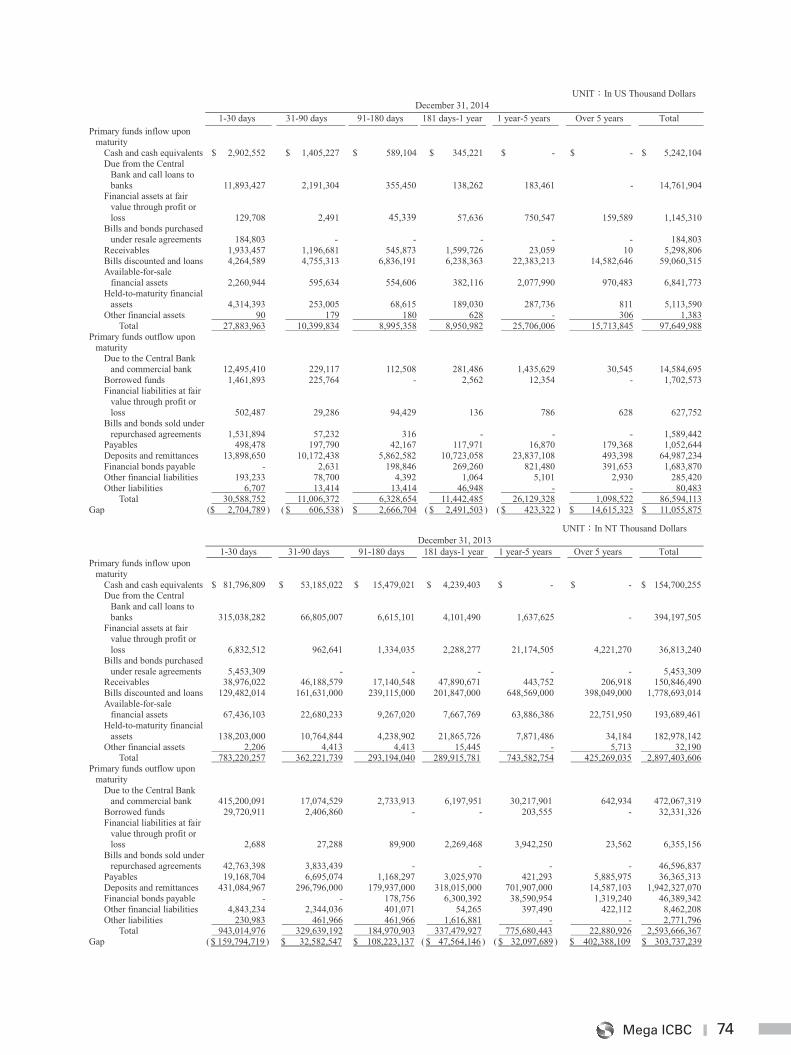
74Mega ICBC
74
UNIT In US Thousand Dollars December 31, 2014 1-30 days 31-90 days 91-180 days 181 days-1 year 1 year-5 years Over 5 years Total Primary funds inflow upon
maturity
Cash and cash equivalents $ 2,902,552 $ 1,405,227 $ 589,104 $ 345,221 $ - $ - $ 5,242,104 Due from the Central
Bank and call loans to banks 11,893,427
2,191,304
355,450 138,262 183,461 - 14,761,904 Financial assets at fair
value through profit or loss 129,708 2,491 45,339 57,636 750,547 159,589 1,145,310
Bills and bonds purchased under resale agreements 184,803
-
- - - - 184,803
Receivables 1,933,457 1,196,681 545,873 1,599,726 23,059 10 5,298,806 Bills discounted and loans 4,264,589 4,755,313 6,836,191 6,238,363 22,383,213 14,582,646 59,060,315 Available-for-sale
financial assets 2,260,944 595,634 554,606 382,116 2,077,990 970,483 6,841,773
Held-to-maturity financial assets 4,314,393 253,005 68,615 189,030 287,736 811 5,113,590
Other financial assets 90 179 180 628 - 306 1,383 Total 27,883,963 10,399,834 8,995,358 8,950,982 25,706,006 15,713,845 97,649,988
Primary funds outflow upon maturity
Due to the Central Bank
and commercial bank 12,495,410 229,117 112,508 281,486 1,435,629 30,545 14,584,695 Borrowed funds 1,461,893 225,764 - 2,562 12,354 - 1,702,573 Financial liabilities at fair
value through profit or loss 502,487 29,286
94,429 136 786 628 627,752
Bills and bonds sold under repurchased agreements 1,531,894
57,232 316 - - - 1,589,442
Payables 498,478 197,790 42,167 117,971 16,870 179,368 1,052,644 Deposits and remittances 13,898,650 10,172,438 5,862,582 10,723,058 23,837,108 493,398 64,987,234 Financial bonds payable - 2,631 198,846 269,260 821,480 391,653 1,683,870 Other financial liabilities 193,233 78,700 4,392 1,064 5,101 2,930 285,420 Other liabilities 6,707 13,414 13,414 46,948 - - 80,483
Total 30,588,752 11,006,372 6,328,654 11,442,485 26,129,328 1,098,522 86,594,113 Gap ($ 2,704,789 ) ( $ 606,538 ) $ 2,666,704 ( $ 2,491,503 ) ( $ 423,322 ) $ 14,615,323 $ 11,055,875
UNIT In NT Thousand Dollars
December 31, 2013 1-30 days 31-90 days 91-180 days 181 days-1 year 1 year-5 years Over 5 years Total Primary funds inflow upon
maturity
Cash and cash equivalents $ 81,796,809 $ 53,185,022 $ 15,479,021 $ 4,239,403 $ - $ - $ 154,700,255 Due from the Central
Bank and call loans to banks 315,038,282
66,805,007
6,615,101
4,101,490 1,637,625
-
394,197,505 Financial assets at fair
value through profit or loss 6,832,512
962,641
1,334,035
2,288,277 21,174,505
4,221,270
36,813,240 Bills and bonds purchased
under resale agreements 5,453,309
-
-
- -
-
5,453,309 Receivables 38,976,022 46,188,579 17,140,548 47,890,671 443,752 206,918 150,846,490 Bills discounted and loans 129,482,014 161,631,000 239,115,000 201,847,000 648,569,000 398,049,000 1,778,693,014 Available-for-sale
financial assets 67,436,103
22,680,233
9,267,020
7,667,769 63,886,386
22,751,950
193,689,461 Held-to-maturity financial
assets 138,203,000
10,764,844
4,238,902
21,865,726 7,871,486
34,184
182,978,142 Other financial assets 2,206 4,413 4,413 15,445 - 5,713 32,190
Total 783,220,257 362,221,739 293,194,040 289,915,781 743,582,754 425,269,035 2,897,403,606 Primary funds outflow upon
maturity
Due to the Central Bank
and commercial bank 415,200,091
17,074,529
2,733,913
6,197,951 30,217,901
642,934
472,067,319 Borrowed funds 29,720,911 2,406,860 - - 203,555 - 32,331,326 Financial liabilities at fair
value through profit or loss 2,688
27,288
89,900
2,269,468 3,942,250
23,562
6,355,156
Bills and bonds sold under repurchased agreements 42,763,398
3,833,439
-
- -
-
46,596,837
Payables 19,168,704 6,695,074 1,168,297 3,025,970 421,293 5,885,975 36,365,313 Deposits and remittances 431,084,967 296,796,000 179,937,000 318,015,000 701,907,000 14,587,103 1,942,327,070 Financial bonds payable - - 178,756 6,300,392 38,590,954 1,319,240 46,389,342 Other financial liabilities 4,843,234 2,344,036 401,071 54,265 397,490 422,112 8,462,208 Other liabilities 230,983 461,966 461,966 1,616,881 - - 2,771,796
Total 943,014,976 329,639,192 184,970,903 337,479,927 775,680,443 22,880,926 2,593,666,367 Gap ( $ 159,794,719 ) $ 32,582,547 $ 108,223,137 ( $ 47,564,146 ) ( $ 32,097,689 ) $ 402,388,109 $ 303,737,239
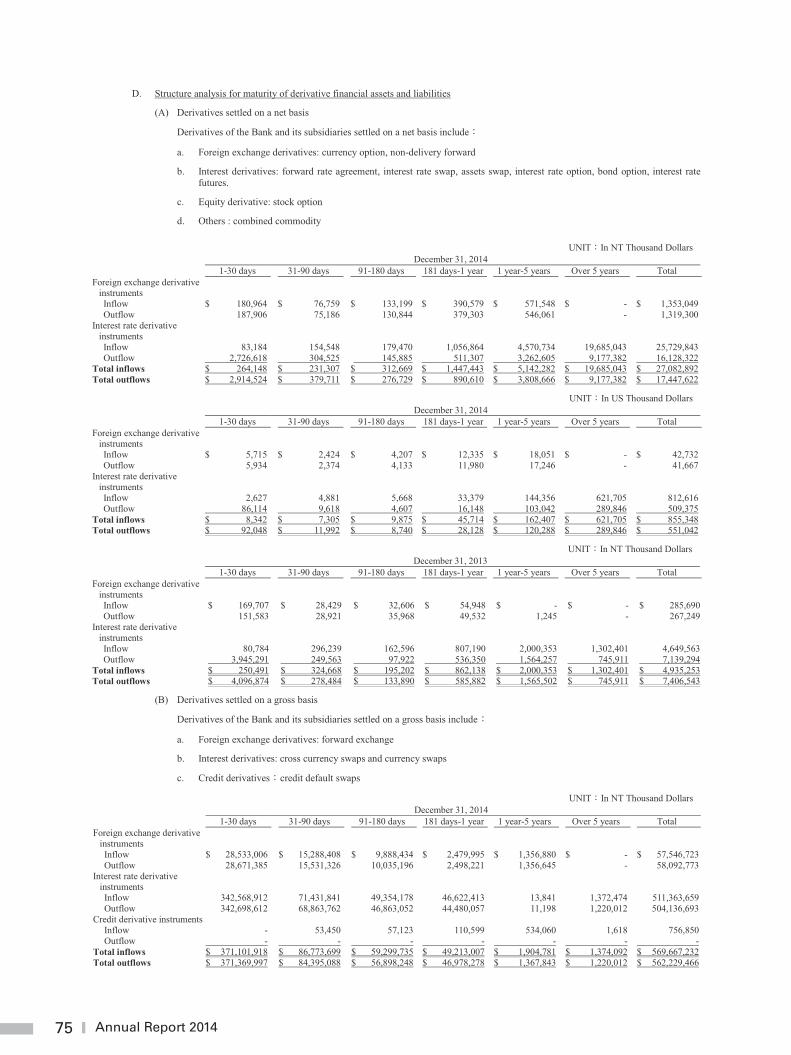
75 Annual Report 2014
75
D. Structure analysis for maturity of derivative financial assets and liabilities
(A) Derivatives settled on a net basis
Derivatives of the Bank and its subsidiaries settled on a net basis include
a. Foreign exchange derivatives: currency option, non-delivery forward
b. Interest derivatives: forward rate agreement, interest rate swap, assets swap, interest rate option, bond option, interest rate futures.
c. Equity derivative: stock option
d. Others : combined commodity
UNIT In NT Thousand Dollars December 31, 2014
1-30 days 31-90 days 91-180 days 181 days-1 year 1 year-5 years Over 5 years Total Foreign exchange derivative
instruments
Inflow $ 180,964 $ 76,759 $ 133,199 $ 390,579 $ 571,548 $ - $ 1,353,049 Outflow 187,906 75,186 130,844 379,303 546,061 - 1,319,300
Interest rate derivative instruments
Inflow 83,184 154,548 179,470 1,056,864 4,570,734 19,685,043 25,729,843 Outflow 2,726,618 304,525 145,885 511,307 3,262,605 9,177,382 16,128,322
Total inflows $ 264,148 $ 231,307 $ 312,669 $ 1,447,443 $ 5,142,282 $ 19,685,043 $ 27,082,892 Total outflows $ 2,914,524 $ 379,711 $ 276,729 $ 890,610 $ 3,808,666 $ 9,177,382 $ 17,447,622
UNIT In US Thousand Dollars December 31, 2014
1-30 days 31-90 days 91-180 days 181 days-1 year 1 year-5 years Over 5 years Total Foreign exchange derivative
instruments
Inflow $ 5,715 $ 2,424 $ 4,207 $ 12,335 $ 18,051 $ - $ 42,732 Outflow 5,934 2,374 4,133 11,980 17,246 - 41,667
Interest rate derivative instruments
Inflow 2,627 4,881 5,668 33,379 144,356 621,705 812,616 Outflow 86,114 9,618 4,607 16,148 103,042 289,846 509,375
Total inflows $ 8,342 $ 7,305 $ 9,875 $ 45,714 $ 162,407 $ 621,705 $ 855,348 Total outflows $ 92,048 $ 11,992 $ 8,740 $ 28,128 $ 120,288 $ 289,846 $ 551,042
UNIT In NT Thousand Dollars December 31, 2013 1-30 days 31-90 days 91-180 days 181 days-1 year 1 year-5 years Over 5 years Total Foreign exchange derivative
instruments
Inflow $ 169,707 $ 28,429 $ 32,606 $ 54,948 $ - $ - $ 285,690 Outflow 151,583 28,921 35,968 49,532 1,245 - 267,249
Interest rate derivative instruments
Inflow 80,784 296,239 162,596 807,190 2,000,353 1,302,401 4,649,563 Outflow 3,945,291 249,563 97,922 536,350 1,564,257 745,911 7,139,294
Total inflows $ 250,491 $ 324,668 $ 195,202 $ 862,138 $ 2,000,353 $ 1,302,401 $ 4,935,253 Total outflows $ 4,096,874 $ 278,484 $ 133,890 $ 585,882 $ 1,565,502 $ 745,911 $ 7,406,543
(B) Derivatives settled on a gross basis
Derivatives of the Bank and its subsidiaries settled on a gross basis include
a. Foreign exchange derivatives: forward exchange
b. Interest derivatives: cross currency swaps and currency swaps
c. Credit derivatives credit default swaps
UNIT In NT Thousand Dollars December 31, 2014 1-30 days 31-90 days 91-180 days 181 days-1 year 1 year-5 years Over 5 years Total Foreign exchange derivative
instruments
Inflow $ 28,533,006 $ 15,288,408 $ 9,888,434 $ 2,479,995 $ 1,356,880 $ - $ 57,546,723 Outflow 28,671,385 15,531,326 10,035,196 2,498,221 1,356,645 - 58,092,773
Interest rate derivative instruments
Inflow 342,568,912 71,431,841 49,354,178 46,622,413 13,841 1,372,474 511,363,659 Outflow 342,698,612 68,863,762 46,863,052 44,480,057 11,198 1,220,012 504,136,693
Credit derivative instruments Inflow - 53,450 57,123 110,599 534,060 1,618 756,850 Outflow - - - - - - -
Total inflows $ 371,101,918 $ 86,773,699 $ 59,299,735 $ 49,213,007 $ 1,904,781 $ 1,374,092 $ 569,667,232 Total outflows $ 371,369,997 $ 84,395,088 $ 56,898,248 $ 46,978,278 $ 1,367,843 $ 1,220,012 $ 562,229,466
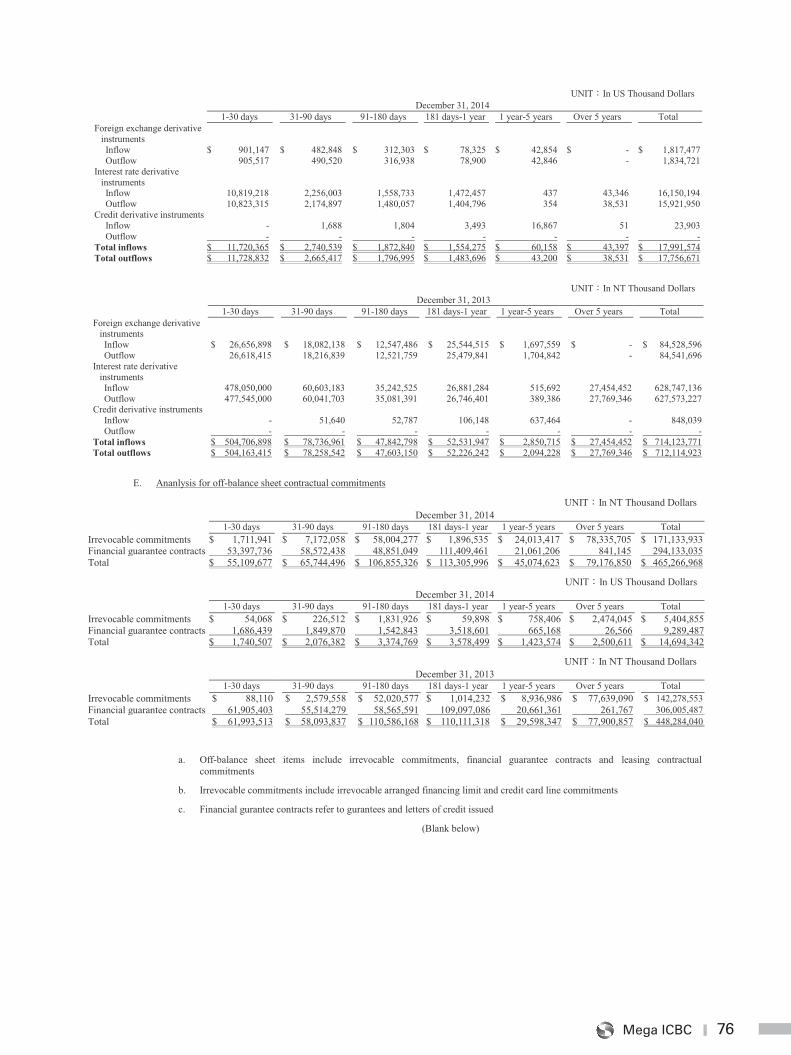
76Mega ICBC
76
UNIT In US Thousand Dollars December 31, 2014 1-30 days 31-90 days 91-180 days 181 days-1 year 1 year-5 years Over 5 years Total Foreign exchange derivative
instruments
Inflow $ 901,147 $ 482,848 $ 312,303 $ 78,325 $ 42,854 $ - $ 1,817,477 Outflow 905,517 490,520 316,938 78,900 42,846 - 1,834,721
Interest rate derivative instruments
Inflow 10,819,218 2,256,003 1,558,733 1,472,457 437 43,346 16,150,194 Outflow 10,823,315 2,174,897 1,480,057 1,404,796 354 38,531 15,921,950
Credit derivative instruments Inflow - 1,688 1,804 3,493 16,867 51 23,903 Outflow - - - - - - -
Total inflows $ 11,720,365 $ 2,740,539 $ 1,872,840 $ 1,554,275 $ 60,158 $ 43,397 $ 17,991,574 Total outflows $ 11,728,832 $ 2,665,417 $ 1,796,995 $ 1,483,696 $ 43,200 $ 38,531 $ 17,756,671
UNIT In NT Thousand Dollars December 31, 2013 1-30 days 31-90 days 91-180 days 181 days-1 year 1 year-5 years Over 5 years Total Foreign exchange derivative
instruments
Inflow $ 26,656,898 $ 18,082,138 $ 12,547,486 $ 25,544,515 $ 1,697,559 $ - $ 84,528,596 Outflow 26,618,415 18,216,839 12,521,759 25,479,841 1,704,842 - 84,541,696
Interest rate derivative instruments
Inflow 478,050,000 60,603,183 35,242,525 26,881,284 515,692 27,454,452 628,747,136 Outflow 477,545,000 60,041,703 35,081,391 26,746,401 389,386 27,769,346 627,573,227
Credit derivative instruments Inflow - 51,640 52,787 106,148 637,464 - 848,039 Outflow - - - - - - -
Total inflows $ 504,706,898 $ 78,736,961 $ 47,842,798 $ 52,531,947 $ 2,850,715 $ 27,454,452 $ 714,123,771 Total outflows $ 504,163,415 $ 78,258,542 $ 47,603,150 $ 52,226,242 $ 2,094,228 $ 27,769,346 $ 712,114,923
E. Ananlysis for off-balance sheet contractual commitments
UNIT In NT Thousand Dollars December 31, 2014 1-30 days 31-90 days 91-180 days 181 days-1 year 1 year-5 years Over 5 years Total Irrevocable commitments $ 1,711,941 $ 7,172,058 $ 58,004,277 $ 1,896,535 $ 24,013,417 $ 78,335,705 $ 171,133,933 Financial guarantee contracts 53,397,736 58,572,438 48,851,049 111,409,461 21,061,206 841,145 294,133,035 Total $ 55,109,677 $ 65,744,496 $ 106,855,326 $ 113,305,996 $ 45,074,623 $ 79,176,850 $ 465,266,968
UNIT In US Thousand Dollars December 31, 2014 1-30 days 31-90 days 91-180 days 181 days-1 year 1 year-5 years Over 5 years Total Irrevocable commitments $ 54,068 $ 226,512 $ 1,831,926 $ 59,898 $ 758,406 $ 2,474,045 $ 5,404,855 Financial guarantee contracts 1,686,439 1,849,870 1,542,843 3,518,601 665,168 26,566 9,289,487 Total $ 1,740,507 $ 2,076,382 $ 3,374,769 $ 3,578,499 $ 1,423,574 $ 2,500,611 $ 14,694,342
UNIT In NT Thousand Dollars December 31, 2013 1-30 days 31-90 days 91-180 days 181 days-1 year 1 year-5 years Over 5 years Total Irrevocable commitments $ 88,110 $ 2,579,558 $ 52,020,577 $ 1,014,232 $ 8,936,986 $ 77,639,090 $ 142,278,553 Financial guarantee contracts 61,905,403 55,514,279 58,565,591 109,097,086 20,661,361 261,767 306,005,487 Total $ 61,993,513 $ 58,093,837 $ 110,586,168 $ 110,111,318 $ 29,598,347 $ 77,900,857 $ 448,284,040
a. Off-balance sheet items include irrevocable commitments, financial guarantee contracts and leasing contractual commitments
b. Irrevocable commitments include irrevocable arranged financing limit and credit card line commitments
c. Financial gurantee contracts refer to gurantees and letters of credit issued
(Blank below)
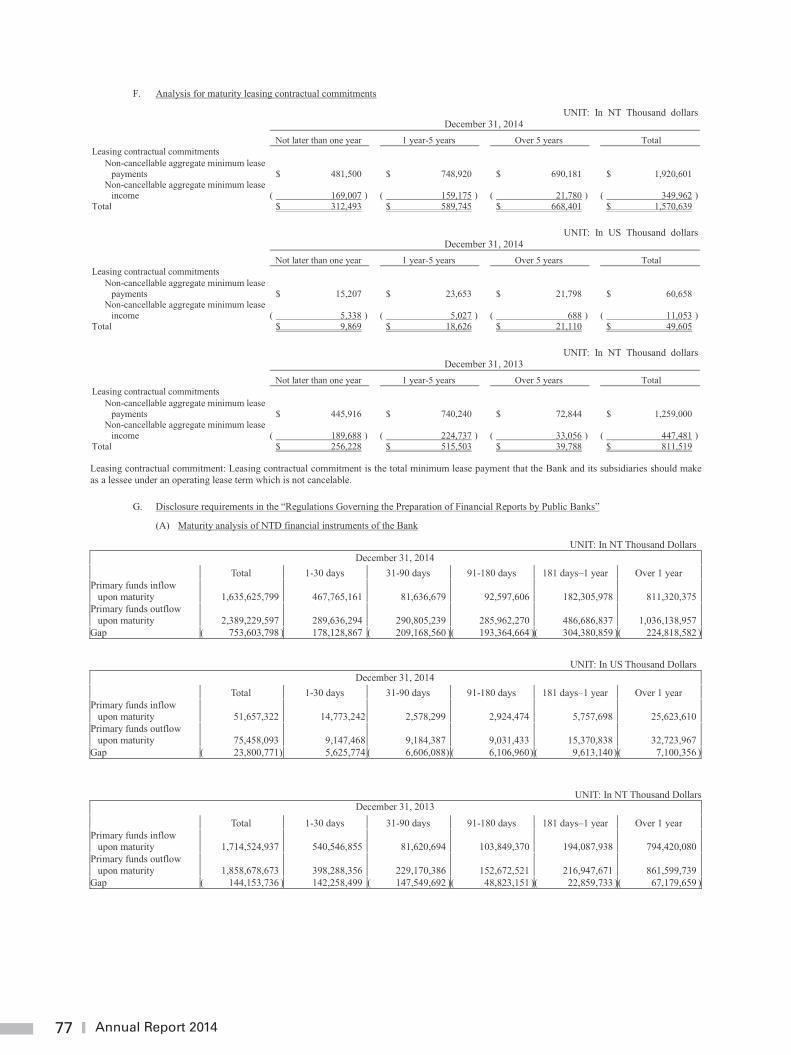
77 Annual Report 2014
77
F. Analysis for maturity leasing contractual commitments
UNIT: In NT Thousand dollars December 31, 2014
Not later than one year 1 year-5 years Over 5 years Total Leasing contractual commitments
Non-cancellable aggregate minimum lease payments $ 481,500 $ 748,920 $ 690,181 $ 1,920,601
Non-cancellable aggregate minimum lease income ( 169,007 ) ( 159,175 ) ( 21,780 ) ( 349,962 )
Total $ 312,493 $ 589,745 $ 668,401 $ 1,570,639 UNIT: In US Thousand dollars December 31, 2014
Not later than one year 1 year-5 years Over 5 years Total Leasing contractual commitments
Non-cancellable aggregate minimum lease payments $ 15,207 $ 23,653 $ 21,798 $ 60,658
Non-cancellable aggregate minimum lease income ( 5,338 ) ( 5,027 ) ( 688 ) ( 11,053 )
Total $ 9,869 $ 18,626 $ 21,110 $ 49,605 UNIT: In NT Thousand dollars December 31, 2013
Not later than one year 1 year-5 years Over 5 years Total Leasing contractual commitments
Non-cancellable aggregate minimum lease payments $ 445,916 $ 740,240 $ 72,844 $ 1,259,000
Non-cancellable aggregate minimum lease income ( 189,688 ) ( 224,737 ) ( 33,056 ) ( 447,481 )
Total $ 256,228 $ 515,503
$ 39,788 $ 811,519
Leasing contractual commitment: Leasing contractual commitment is the total minimum lease payment that the Bank and its subsidiaries should make as a lessee under an operating lease term which is not cancelable.
G. Disclosure requirements in the “Regulations Governing the Preparation of Financial Reports by Public Banks”
(A) Maturity analysis of NTD financial instruments of the Bank
UNIT: In NT Thousand Dollars December 31, 2014
Total 1-30 days 31-90 days 91-180 days 181 days–1 year Over 1 year Primary funds inflow
upon maturity 1,635,625,799 467,765,161 81,636,679 92,597,606 182,305,978 811,320,375 Primary funds outflow
upon maturity 2,389,229,597 289,636,294 290,805,239 285,962,270 486,686,837 1,036,138,957 Gap ( 753,603,798 ) 178,128,867 ( 209,168,560 )( 193,364,664 )( 304,380,859 )( 224,818,582 )
UNIT: In US Thousand DollarsDecember 31, 2014
Total 1-30 days 31-90 days 91-180 days 181 days–1 year Over 1 year Primary funds inflow
upon maturity 51,657,322 14,773,242 2,578,299 2,924,474 5,757,698 25,623,610 Primary funds outflow
upon maturity 75,458,093 9,147,468 9,184,387 9,031,433 15,370,838 32,723,967 Gap ( 23,800,771) 5,625,774 ( 6,606,088 ) ( 6,106,960 ) ( 9,613,140 ) ( 7,100,356 )
UNIT: In NT Thousand Dollars December 31, 2013
Total 1-30 days 31-90 days 91-180 days 181 days–1 year Over 1 year Primary funds inflow
upon maturity 1,714,524,937 540,546,855 81,620,694 103,849,370 194,087,938 794,420,080 Primary funds outflow
upon maturity 1,858,678,673 398,288,356 229,170,386 152,672,521 216,947,671 861,599,739 Gap ( 144,153,736 ) 142,258,499 ( 147,549,692 )( 48,823,151 )( 22,859,733 )( 67,179,659 )
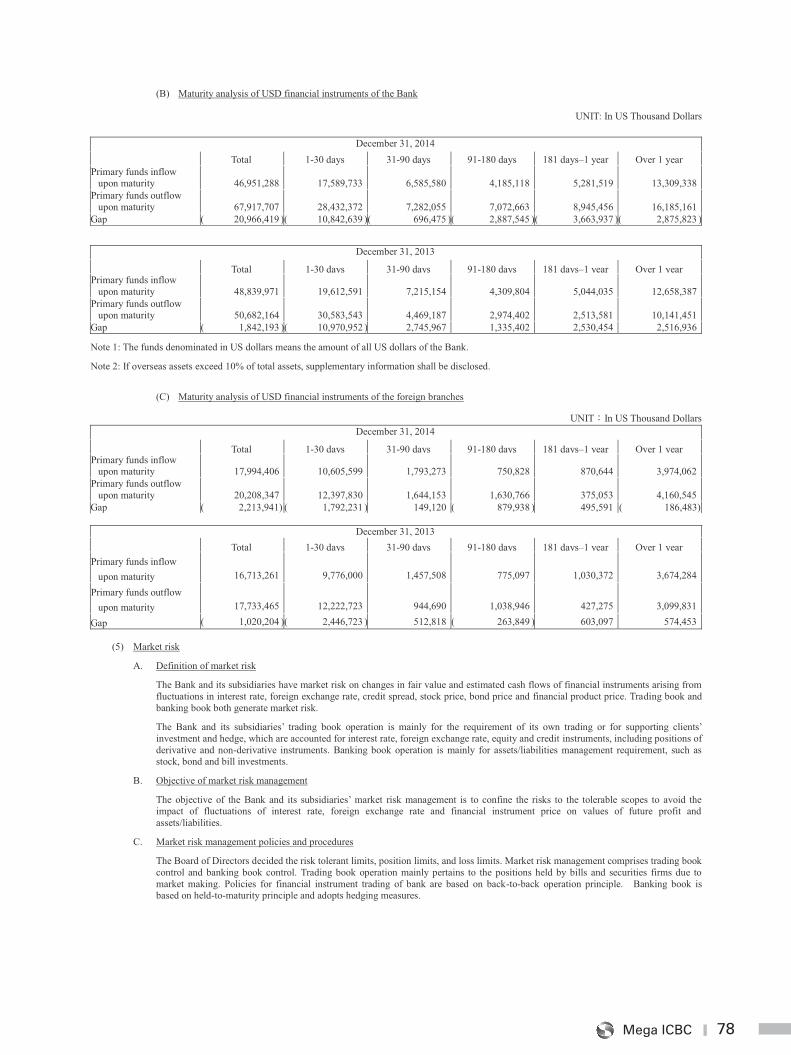
78Mega ICBC
78
(B) Maturity analysis of USD financial instruments of the Bank
UNIT: In US Thousand Dollars
December 31, 2014 Total 1-30 days 31-90 days 91-180 days 181 days–1 year Over 1 year Primary funds inflow
upon maturity 46,951,288 17,589,733 6,585,580 4,185,118 5,281,519 13,309,338 Primary funds outflow
upon maturity 67,917,707 28,432,372 7,282,055 7,072,663 8,945,456 16,185,161 Gap ( 20,966,419 )( 10,842,639 )( 696,475 )( 2,887,545 ) ( 3,663,937 )( 2,875,823 )
December 31, 2013 Total 1-30 days 31-90 days 91-180 days 181 days–1 year Over 1 year Primary funds inflow
upon maturity 48,839,971 19,612,591 7,215,154 4,309,804 5,044,035 12,658,387 Primary funds outflow
upon maturity 50,682,164 30,583,543 4,469,187 2,974,402 2,513,581 10,141,451 Gap ( 1,842,193 )( 10,970,952 ) 2,745,967 1,335,402 2,530,454 2,516,936
Note 1: The funds denominated in US dollars means the amount of all US dollars of the Bank.
Note 2: If overseas assets exceed 10% of total assets, supplementary information shall be disclosed.
(C) Maturity analysis of USD financial instruments of the foreign branches
UNIT In US Thousand Dollars December 31, 2014
Total 1-30 days 31-90 days 91-180 days 181 days–1 year Over 1 year Primary funds inflow
upon maturity 17,994,406 10,605,599 1,793,273 750,828 870,644 3,974,062 Primary funds outflow
upon maturity 20,208,347 12,397,830 1,644,153 1,630,766 375,053 4,160,545 Gap ( 2,213,941) ( 1,792,231 ) 149,120 ( 879,938 ) 495,591 ( 186,483)
December 31, 2013 Total 1-30 days 31-90 days 91-180 days 181 days–1 year Over 1 year Primary funds inflow
upon maturity 16,713,261 9,776,000 1,457,508 775,097 1,030,372 3,674,284
Primary funds outflow upon maturity 17,733,465 12,222,723 944,690 1,038,946 427,275 3,099,831
Gap ( 1,020,204 )( 2,446,723 ) 512,818 ( 263,849 ) 603,097 574,453
(5) Market risk
A. Definition of market risk
The Bank and its subsidiaries have market risk on changes in fair value and estimated cash flows of financial instruments arising from fluctuations in interest rate, foreign exchange rate, credit spread, stock price, bond price and financial product price. Trading book and banking book both generate market risk.
The Bank and its subsidiaries’ trading book operation is mainly for the requirement of its own trading or for supporting clients’ investment and hedge, which are accounted for interest rate, foreign exchange rate, equity and credit instruments, including positions of derivative and non-derivative instruments. Banking book operation is mainly for assets/liabilities management requirement, such as stock, bond and bill investments.
B. Objective of market risk management
The objective of the Bank and its subsidiaries’ market risk management is to confine the risks to the tolerable scopes to avoid the impact of fluctuations of interest rate, foreign exchange rate and financial instrument price on values of future profit and assets/liabilities.
C. Market risk management policies and procedures
The Board of Directors decided the risk tolerant limits, position limits, and loss limits. Market risk management comprises trading book control and banking book control. Trading book operation mainly pertains to the positions held by bills and securities firms due to market making. Policies for financial instrument trading of bank are based on back-to-back operation principle. Banking book is based on held-to-maturity principle and adopts hedging measures.
79 Annual Report 2014
79
D. Procedures for market risk management
(A) The Bank’s objectives of market risk management are respectively proposed by The Treasury Department and The Financial Risk Management Center, and then Risk Control Department summarizes and reports these objectives to Risk Management Committee of Mega Financial Holdings and the Bank’s Board of Directors for assessment.
(B) Financial Risk Management Center not only prepares statement of market risk position and profit and loss of various financial instruments but regularly compiles securities investment performance evaluation and reports to the Board of Directors for the Board’s knowledge of the Bank’s risk control over securities investment. Risk Management Department summarizes and analyzes information from finance department on a daily basis. If there is any early warning indicator approaching stop-loss, Risk Management Department will request Financial Risk Management Center to inform Treasury Department of increasing attention in response to changes in market. Besides, Risk Management Department monthly summarizes and analyzes data collected from positions of various financial instruments, profit and loss assessment, analysis on risk-sensitive factors, and stress testing for senior management’s knowledge of the Bank’s market risk exposure profile.
E. Market risk measurement and control principle
(A) The Bank’s market risk report contains interest rate, exchange rate, positions of equity securities, credit default swap (CDS) and profit and loss assessment. Every transaction has limit and stop-loss provisions, which shall be submitted to approval management in accordance with the Bank’s regulations. Stop-loss limit shall be implemented as soon as a transaction reaches the threhold. If no stop-loss limit will be implemented, trading units shall immediately make statement about reasons to not implement stop-loss limit and coping plan, which shall be submitted to senior management for approval and reported to the Board of Directors regularly.
(B) Non-hedging trading positions of derivative financial instruments are daily assessed based on the market value, whereas hedging trading positions of futures are daily assessed and others are assessed twice a month.
(C) SUMMIT information system for market risk provides functions in relation to risk management such as real-time limits, profit and loss assessment, analysis on risk-sensitive factors, stress testing, and VaR calculation.
F. Policies and procedures of trading-book risk management
The Bank and its subsidiaries daily monitor trading-book positions, changes in risk exposures, and various risk limits, including trading rooms, traders and product line risk limits.
If trading-book financial instruments have market price, the valuation of those instruments is conducted at least one time daily using the independent source and available information. If using mathematical model valuation, the assumptions and parameters used in the model are reviewed regularly.
Risk measurement methods include VaR and sensitivity analysis.
The Bank and its subsidiaries conduct stress test on the positions of its interest rate, foreign exchange rate products, equity securities and credit default swap (CDS)on the assumptions of the monthly change in interest rate, securities market index, foreign exchange rate and CDS by 1%, 15% , 3% and 100 base points, respectively, and reports to the risk control meeting.
G. Trading-book interest rate risk management
Trading-book interest rate risk refers to the financial loss of the decline in values of interest rate products held due to unfavorable changes in interest rates, including securities and derivatives with interest.
The Bank and its subsidiaries interest rate products are traded mainly for hedging.
The trading group screens the credits and financial positions of issuers and selects investment objectives by judging interest rate trend and a variety of country risks and based on the authorized minimum investment criteria. The Bank and its subsidiaries set trading-book trading limits and stop-loss limits (including trading rooms, traders, trading products, counterparties, and daily and overnight limits) based on business strategies and market conditions, and measure monthly the extent of impact of interest rate risk on investment portfolios using DV01 value.
H. Banking book interest rate risk management
Banking book interest rate risk mainly comes from the unmatched maturity dates of assets and liabilities or price resetting dates, and inconsistent changes in base interest rates for assets and liabilities. The Bank and its subsidiaries’ interest rate risk mainly comes from the unmatched periods of interest-rate sensitive assets and liabilities of the Bank and its subsidaries.
As the Bank and its subsidiaries have interest-rate sensitive gaps, market interest rate fluctuations have good or bad impacts on the Bank and its subsidiaries’ earnings and cash flows.
The Bank and its subsidiaries manage Banking book interest rate risk by using repricing gap analysis. The interest-rate repricing gap analysis is to estimate the difference between the assets and liabilities with interest bearing that are to be due near or repriced within a certain period and measure the impact of interest rate change on net interest revenue. The analysis assumes assets and liabilities structure remain unchanged and there are parallel movements of interest rate curves, and excludes the customer behavior, basis risk, option characteristics of early repayment of bonds. The Bank and its subsidiaries calculate the change in net interest revenue for this year and also monitor the percentage of change in net interest revenue to the projection of net interest revenue for this year.
The Bank and its subsidiaries monthly analyze and monitor interest rate risk positions limits and various interest rate risk management indexes. If any risk management index exceeds limit, the Bank and its subsidiaries will adopt responding measures and report the analysis and monitoring results to capital review committee, assets/liabilities and risk management committee and Board of Directors.
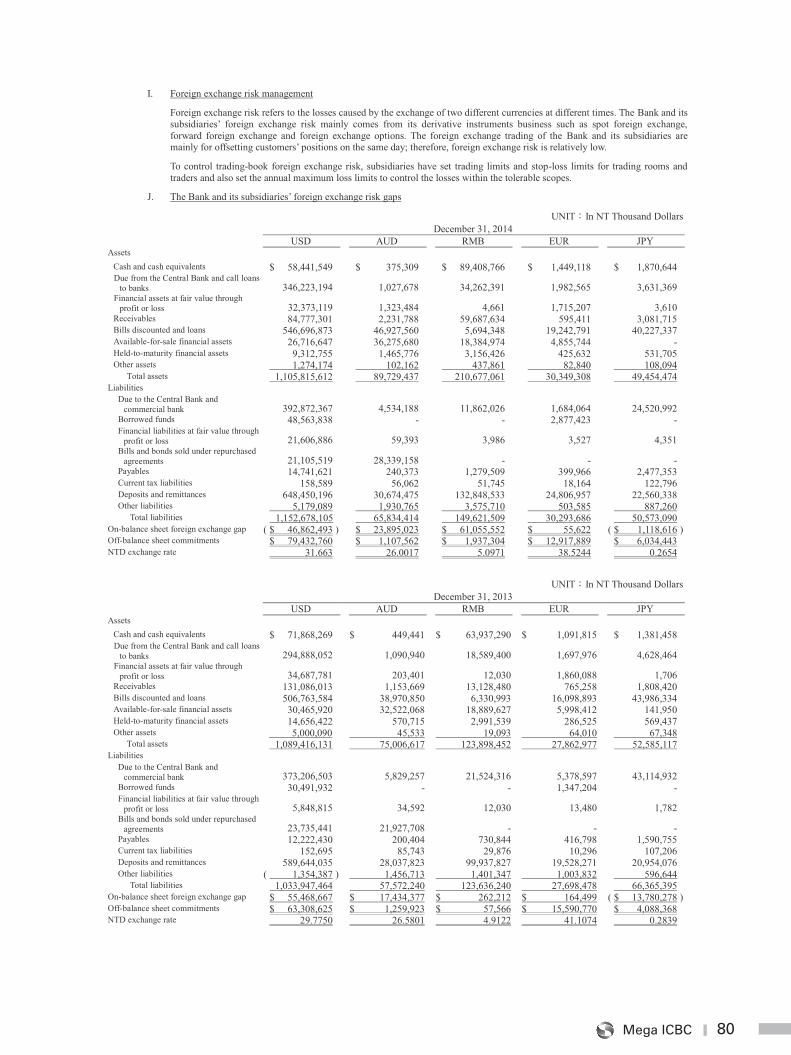
80Mega ICBC
80
I. Foreign exchange risk management
Foreign exchange risk refers to the losses caused by the exchange of two different currencies at different times. The Bank and its subsidiaries’ foreign exchange risk mainly comes from its derivative instruments business such as spot foreign exchange, forward foreign exchange and foreign exchange options. The foreign exchange trading of the Bank and its subsidiaries are mainly for offsetting customers’ positions on the same day; therefore, foreign exchange risk is relatively low.
To control trading-book foreign exchange risk, subsidiaries have set trading limits and stop-loss limits for trading rooms and traders and also set the annual maximum loss limits to control the losses within the tolerable scopes.
J. The Bank and its subsidiaries’ foreign exchange risk gaps
UNIT In NT Thousand Dollars December 31, 2014 USD AUD RMB EUR JPY Assets
Cash and cash equivalents $ 58,441,549 $ 375,309 $ 89,408,766 $ 1,449,118 $ 1,870,644 Due from the Central Bank and call loans
to banks 346,223,194 1,027,678 34,262,391 1,982,565 3,631,369 Financial assets at fair value through
profit or loss 32,373,119 1,323,484 4,661 1,715,207 3,610 Receivables 84,777,301 2,231,788 59,687,634 595,411 3,081,715 Bills discounted and loans 546,696,873 46,927,560 5,694,348 19,242,791 40,227,337 Available-for-sale financial assets 26,716,647 36,275,680 18,384,974 4,855,744 - Held-to-maturity financial assets 9,312,755 1,465,776 3,156,426 425,632 531,705 Other assets 1,274,174 102,162 437,861 82,840 108,094
Total assets 1,105,815,612 89,729,437 210,677,061 30,349,308 49,454,474 Liabilities
Due to the Central Bank and commercial bank 392,872,367 4,534,188 11,862,026 1,684,064 24,520,992
Borrowed funds 48,563,838 - - 2,877,423 - Financial liabilities at fair value through
profit or loss 21,606,886 59,393 3,986 3,527 4,351 Bills and bonds sold under repurchased
agreements 21,105,519 28,339,158 - - - Payables 14,741,621 240,373 1,279,509 399,966 2,477,353 Current tax liabilities 158,589 56,062 51,745 18,164 122,796 Deposits and remittances 648,450,196 30,674,475 132,848,533 24,806,957 22,560,338 Other liabilities 5,179,089 1,930,765 3,575,710 503,585 887,260
Total liabilities 1,152,678,105 65,834,414 149,621,509 30,293,686 50,573,090 On-balance sheet foreign exchange gap ( $ 46,862,493 ) $ 23,895,023 $ 61,055,552 $ 55,622 ( $ 1,118,616 ) Off-balance sheet commitments $ 79,432,760 $ 1,107,562 $ 1,937,304 $ 12,917,889 $ 6,034,443 NTD exchange rate 31.663 26.0017 5.0971 38.5244 0.2654
UNIT In NT Thousand Dollars December 31, 2013 USD AUD RMB EUR JPY Assets
Cash and cash equivalents $ 71,868,269 $ 449,441 $ 63,937,290 $ 1,091,815 $ 1,381,458 Due from the Central Bank and call loans
to banks 294,888,052 1,090,940
18,589,400
1,697,976
4,628,464
Financial assets at fair value through profit or loss 34,687,781
203,401
12,030
1,860,088
1,706
Receivables 131,086,013 1,153,669 13,128,480 765,258 1,808,420 Bills discounted and loans 506,763,584 38,970,850 6,330,993 16,098,893 43,986,334 Available-for-sale financial assets 30,465,920 32,522,068 18,889,627 5,998,412 141,950 Held-to-maturity financial assets 14,656,422 570,715 2,991,539 286,525 569,437 Other assets 5,000,090 45,533 19,093 64,010 67,348
Total assets 1,089,416,131 75,006,617 123,898,452 27,862,977 52,585,117 Liabilities
Due to the Central Bank and commercial bank 373,206,503 5,829,257 21,524,316 5,378,597 43,114,932
Borrowed funds 30,491,932 - - 1,347,204 - Financial liabilities at fair value through
profit or loss 5,848,815 34,592 12,030 13,480 1,782 Bills and bonds sold under repurchased
agreements 23,735,441 21,927,708 - - - Payables 12,222,430 200,404 730,844 416,798 1,590,755 Current tax liabilities 152,695 85,743 29,876 10,296 107,206 Deposits and remittances 589,644,035 28,037,823 99,937,827 19,528,271 20,954,076 Other liabilities ( 1,354,387 ) 1,456,713 1,401,347 1,003,832 596,644
Total liabilities 1,033,947,464 57,572,240 123,636,240 27,698,478 66,365,395 On-balance sheet foreign exchange gap $ 55,468,667 $ 17,434,377 $ 262,212 $ 164,499 ( $ 13,780,278 ) Off-balance sheet commitments $ 63,308,625 $ 1,259,923 $ 57,566 $ 15,590,770 $ 4,088,368 NTD exchange rate 29.7750 26.5801 4.9122 41.1074 0.2839
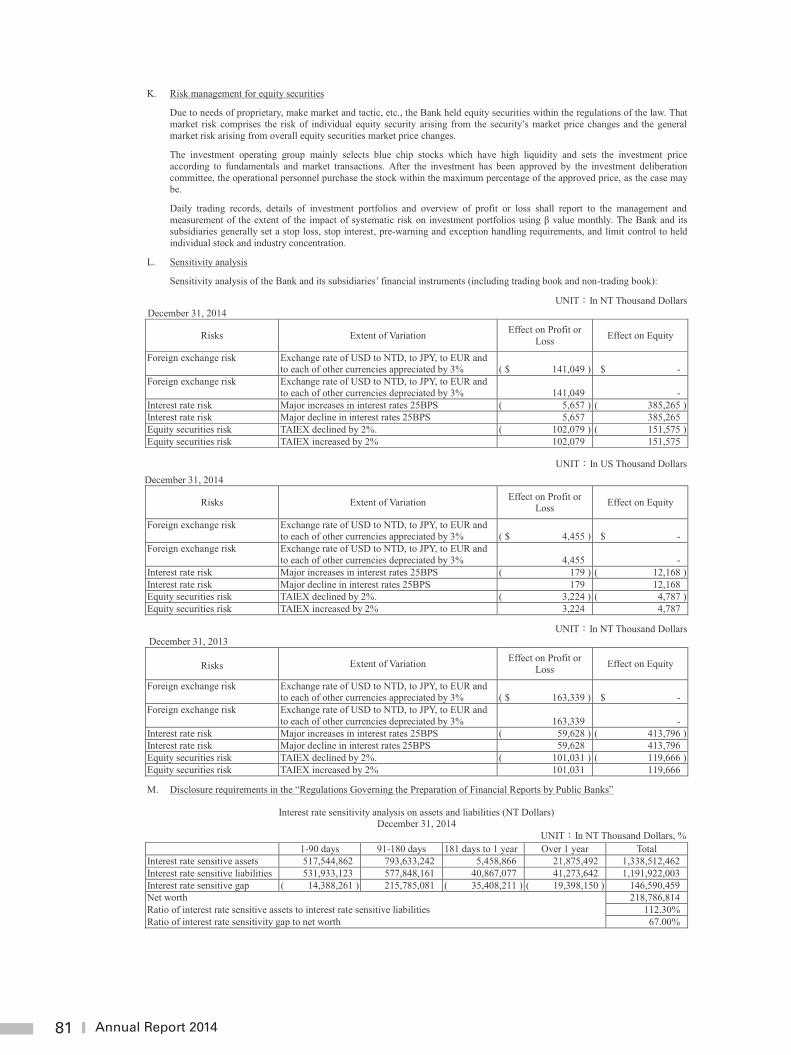
81 Annual Report 2014
81
K. Risk management for equity securities
Due to needs of proprietary, make market and tactic, etc., the Bank held equity securities within the regulations of the law. That market risk comprises the risk of individual equity security arising from the security’s market price changes and the general market risk arising from overall equity securities market price changes.
The investment operating group mainly selects blue chip stocks which have high liquidity and sets the investment price according to fundamentals and market transactions. After the investment has been approved by the investment deliberation committee, the operational personnel purchase the stock within the maximum percentage of the approved price, as the case may be.
Daily trading records, details of investment portfolios and overview of profit or loss shall report to the management and measurement of the extent of the impact of systematic risk on investment portfolios using β value monthly. The Bank and its subsidiaries generally set a stop loss, stop interest, pre-warning and exception handling requirements, and limit control to held individual stock and industry concentration.
L. Sensitivity analysis
Sensitivity analysis of the Bank and its subsidiaries’ financial instruments (including trading book and non-trading book):
UNIT In NT Thousand Dollars December 31, 2014
Risks Extent of Variation Effect on Profit or Loss Effect on Equity
Foreign exchange risk Exchange rate of USD to NTD, to JPY, to EUR and to each of other currencies appreciated by 3% ( $ 141,049 ) $ -
Foreign exchange risk Exchange rate of USD to NTD, to JPY, to EUR and to each of other currencies depreciated by 3% 141,049 -
Interest rate risk Major increases in interest rates 25BPS ( 5,657 ) ( 385,265 ) Interest rate risk Major decline in interest rates 25BPS 5,657 385,265 Equity securities risk TAIEX declined by 2%. ( 102,079 ) ( 151,575 ) Equity securities risk TAIEX increased by 2% 102,079 151,575
UNIT In US Thousand Dollars December 31, 2014
Risks Extent of Variation Effect on Profit or Loss Effect on Equity
Foreign exchange risk Exchange rate of USD to NTD, to JPY, to EUR and to each of other currencies appreciated by 3% ( $ 4,455 ) $ -
Foreign exchange risk Exchange rate of USD to NTD, to JPY, to EUR and to each of other currencies depreciated by 3% 4,455 -
Interest rate risk Major increases in interest rates 25BPS ( 179 ) ( 12,168 ) Interest rate risk Major decline in interest rates 25BPS 179 12,168 Equity securities risk TAIEX declined by 2%. ( 3,224 ) ( 4,787 ) Equity securities risk TAIEX increased by 2% 3,224 4,787
UNIT In NT Thousand Dollars December 31, 2013
Risks Extent of Variation Effect on Profit or Loss Effect on Equity
Foreign exchange risk Exchange rate of USD to NTD, to JPY, to EUR and to each of other currencies appreciated by 3% ( $ 163,339 ) $ -
Foreign exchange risk Exchange rate of USD to NTD, to JPY, to EUR and to each of other currencies depreciated by 3% 163,339 -
Interest rate risk Major increases in interest rates 25BPS ( 59,628 ) ( 413,796 ) Interest rate risk Major decline in interest rates 25BPS 59,628 413,796 Equity securities risk TAIEX declined by 2%. ( 101,031 ) ( 119,666 ) Equity securities risk TAIEX increased by 2% 101,031 119,666
M. Disclosure requirements in the “Regulations Governing the Preparation of Financial Reports by Public Banks”
Interest rate sensitivity analysis on assets and liabilities (NT Dollars) December 31, 2014
UNIT In NT Thousand Dollars, % 1-90 days 91-180 days 181 days to 1 year Over 1 year Total
Interest rate sensitive assets 517,544,862 793,633,242 5,458,866 21,875,492 1,338,512,462 Interest rate sensitive liabilities 531,933,123 577,848,161 40,867,077 41,273,642 1,191,922,003 Interest rate sensitive gap ( 14,388,261 ) 215,785,081 ( 35,408,211 ) ( 19,398,150 ) 146,590,459 Net worth 218,786,814 Ratio of interest rate sensitive assets to interest rate sensitive liabilities 112.30% Ratio of interest rate sensitivity gap to net worth 67.00%
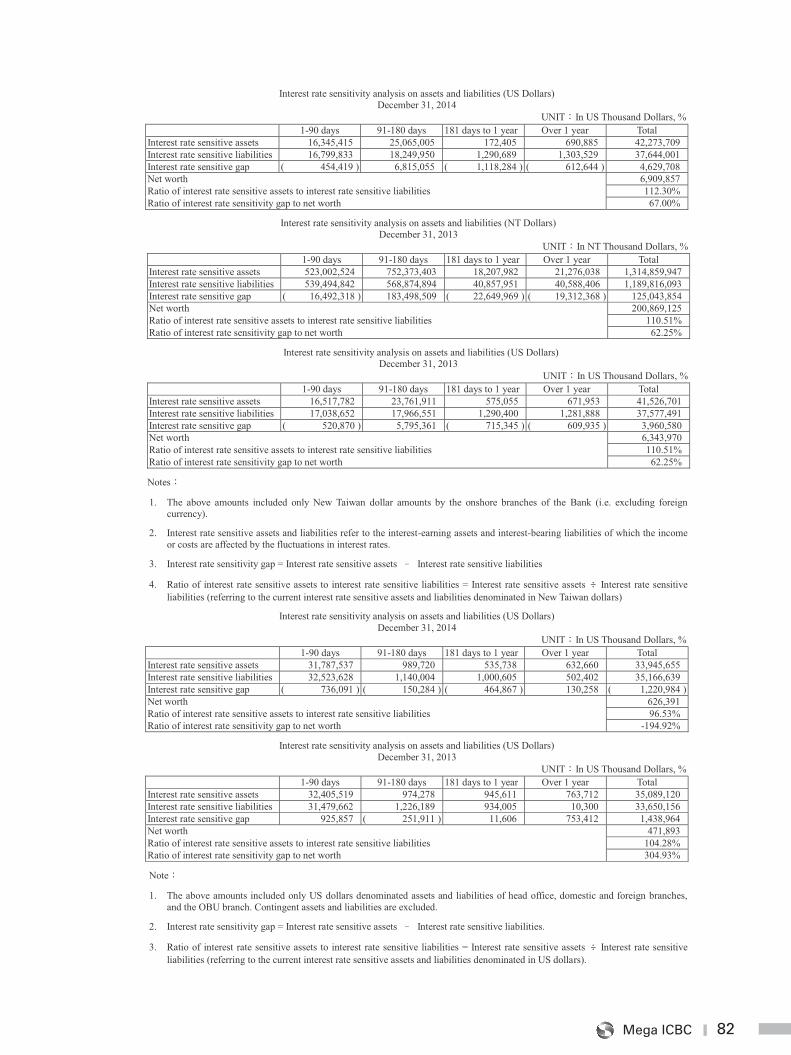
82Mega ICBC
82
Interest rate sensitivity analysis on assets and liabilities (US Dollars) December 31, 2014
UNIT In US Thousand Dollars, % 1-90 days 91-180 days 181 days to 1 year Over 1 year Total
Interest rate sensitive assets 16,345,415 25,065,005 172,405 690,885 42,273,709 Interest rate sensitive liabilities 16,799,833 18,249,950 1,290,689 1,303,529 37,644,001 Interest rate sensitive gap ( 454,419 ) 6,815,055 ( 1,118,284 ) ( 612,644 ) 4,629,708 Net worth 6,909,857 Ratio of interest rate sensitive assets to interest rate sensitive liabilities 112.30% Ratio of interest rate sensitivity gap to net worth 67.00%
Interest rate sensitivity analysis on assets and liabilities (NT Dollars) December 31, 2013
UNIT In NT Thousand Dollars, % 1-90 days 91-180 days 181 days to 1 year Over 1 year Total
Interest rate sensitive assets 523,002,524 752,373,403 18,207,982 21,276,038 1,314,859,947 Interest rate sensitive liabilities 539,494,842 568,874,894 40,857,951 40,588,406 1,189,816,093 Interest rate sensitive gap ( 16,492,318 ) 183,498,509 ( 22,649,969 ) ( 19,312,368 ) 125,043,854 Net worth 200,869,125 Ratio of interest rate sensitive assets to interest rate sensitive liabilities 110.51% Ratio of interest rate sensitivity gap to net worth 62.25%
Interest rate sensitivity analysis on assets and liabilities (US Dollars) December 31, 2013
UNIT In US Thousand Dollars, % 1-90 days 91-180 days 181 days to 1 year Over 1 year Total
Interest rate sensitive assets 16,517,782 23,761,911 575,055 671,953 41,526,701 Interest rate sensitive liabilities 17,038,652 17,966,551 1,290,400 1,281,888 37,577,491 Interest rate sensitive gap ( 520,870 ) 5,795,361 ( 715,345 ) ( 609,935 ) 3,960,580 Net worth 6,343,970 Ratio of interest rate sensitive assets to interest rate sensitive liabilities 110.51% Ratio of interest rate sensitivity gap to net worth 62.25%
Notes
1. The above amounts included only New Taiwan dollar amounts by the onshore branches of the Bank (i.e. excluding foreign currency).
2. Interest rate sensitive assets and liabilities refer to the interest-earning assets and interest-bearing liabilities of which the income or costs are affected by the fluctuations in interest rates.
3. Interest rate sensitivity gap = Interest rate sensitive assets Interest rate sensitive liabilities
4. Ratio of interest rate sensitive assets to interest rate sensitive liabilities = Interest rate sensitive assets Interest rate sensitive liabilities (referring to the current interest rate sensitive assets and liabilities denominated in New Taiwan dollars)
Interest rate sensitivity analysis on assets and liabilities (US Dollars) December 31, 2014
UNIT In US Thousand Dollars, % 1-90 days 91-180 days 181 days to 1 year Over 1 year Total
Interest rate sensitive assets 31,787,537 989,720 535,738 632,660 33,945,655 Interest rate sensitive liabilities 32,523,628 1,140,004 1,000,605 502,402 35,166,639 Interest rate sensitive gap ( 736,091 ) ( 150,284 ) ( 464,867 ) 130,258 ( 1,220,984 ) Net worth 626,391 Ratio of interest rate sensitive assets to interest rate sensitive liabilities 96.53% Ratio of interest rate sensitivity gap to net worth -194.92%
Interest rate sensitivity analysis on assets and liabilities (US Dollars) December 31, 2013
UNIT In US Thousand Dollars, % 1-90 days 91-180 days 181 days to 1 year Over 1 year Total
Interest rate sensitive assets 32,405,519 974,278 945,611 763,712 35,089,120 Interest rate sensitive liabilities 31,479,662 1,226,189 934,005 10,300 33,650,156 Interest rate sensitive gap 925,857 ( 251,911 ) 11,606 753,412 1,438,964 Net worth 471,893 Ratio of interest rate sensitive assets to interest rate sensitive liabilities 104.28% Ratio of interest rate sensitivity gap to net worth 304.93%
Note
1. The above amounts included only US dollars denominated assets and liabilities of head office, domestic and foreign branches, and the OBU branch. Contingent assets and liabilities are excluded.
2. Interest rate sensitivity gap = Interest rate sensitive assets Interest rate sensitive liabilities.
3. Ratio of interest rate sensitive assets to interest rate sensitive liabilities = Interest rate sensitive assets Interest rate sensitive liabilities (referring to the current interest rate sensitive assets and liabilities denominated in US dollars).
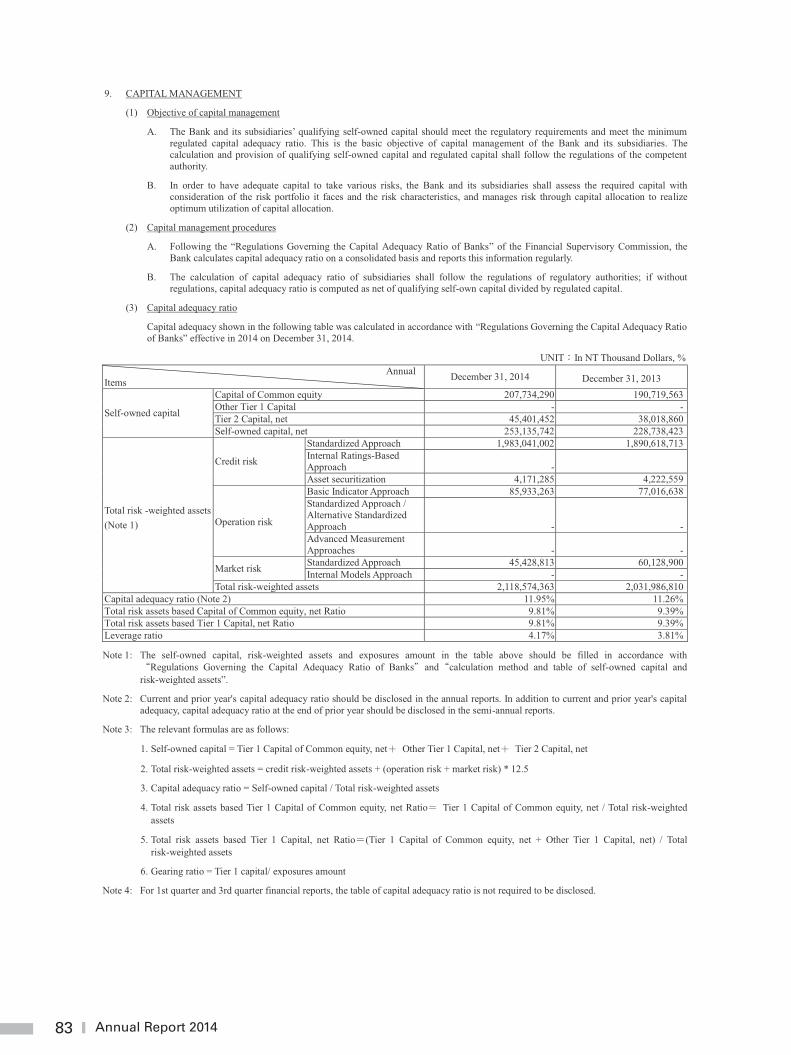
83 Annual Report 2014
83
9. CAPITAL MANAGEMENT
(1) Objective of capital management
A. The Bank and its subsidiaries’ qualifying self-owned capital should meet the regulatory requirements and meet the minimum regulated capital adequacy ratio. This is the basic objective of capital management of the Bank and its subsidiaries. The calculation and provision of qualifying self-owned capital and regulated capital shall follow the regulations of the competent authority.
B. In order to have adequate capital to take various risks, the Bank and its subsidiaries shall assess the required capital with consideration of the risk portfolio it faces and the risk characteristics, and manages risk through capital allocation to realize optimum utilization of capital allocation.
(2) Capital management procedures
A. Following the “Regulations Governing the Capital Adequacy Ratio of Banks” of the Financial Supervisory Commission, the Bank calculates capital adequacy ratio on a consolidated basis and reports this information regularly.
B. The calculation of capital adequacy ratio of subsidiaries shall follow the regulations of regulatory authorities; if without regulations, capital adequacy ratio is computed as net of qualifying self-own capital divided by regulated capital.
(3) Capital adequacy ratio
Capital adequacy shown in the following table was calculated in accordance with “Regulations Governing the Capital Adequacy Ratio of Banks” effective in 2014 on December 31, 2014.
UNIT In NT Thousand Dollars, % Annual Items December 31, 2014 December 31, 2013
Self-owned capital
Capital of Common equity 207,734,290 190,719,563 Other Tier 1 Capital - - Tier 2 Capital, net 45,401,452 38,018,860 Self-owned capital, net 253,135,742 228,738,423
Total risk -weighted assets (Note 1)
Credit risk
Standardized Approach 1,983,041,002 1,890,618,713 Internal Ratings-Based Approach -
Asset securitization 4,171,285 4,222,559
Operation risk
Basic Indicator Approach 85,933,263 77,016,638 Standardized Approach / Alternative Standardized Approach -
- Advanced Measurement Approaches -
-
Market risk Standardized Approach 45,428,813 60,128,900 Internal Models Approach - -
Total risk-weighted assets 2,118,574,363 2,031,986,810 Capital adequacy ratio (Note 2) 11.95% 11.26% Total risk assets based Capital of Common equity, net Ratio 9.81% 9.39% Total risk assets based Tier 1 Capital, net Ratio 9.81% 9.39% Leverage ratio 4.17% 3.81%
Note 1: The self-owned capital, risk-weighted assets and exposures amount in the table above should be filled in accordance with Regulations Governing the Capital Adequacy Ratio of Banks and calculation method and table of self-owned capital and
risk-weighted assets”.
Note 2: Current and prior year's capital adequacy ratio should be disclosed in the annual reports. In addition to current and prior year's capital adequacy, capital adequacy ratio at the end of prior year should be disclosed in the semi-annual reports.
Note 3: The relevant formulas are as follows:
1. Self-owned capital = Tier 1 Capital of Common equity, net Other Tier 1 Capital, net Tier 2 Capital, net
2. Total risk-weighted assets = credit risk-weighted assets + (operation risk + market risk) * 12.5
3. Capital adequacy ratio = Self-owned capital / Total risk-weighted assets
4. Total risk assets based Tier 1 Capital of Common equity, net Ratio Tier 1 Capital of Common equity, net / Total risk-weighted assets
5. Total risk assets based Tier 1 Capital, net Ratio (Tier 1 Capital of Common equity, net + Other Tier 1 Capital, net) / Total risk-weighted assets
6. Gearing ratio = Tier 1 capital/ exposures amount
Note 4: For 1st quarter and 3rd quarter financial reports, the table of capital adequacy ratio is not required to be disclosed.
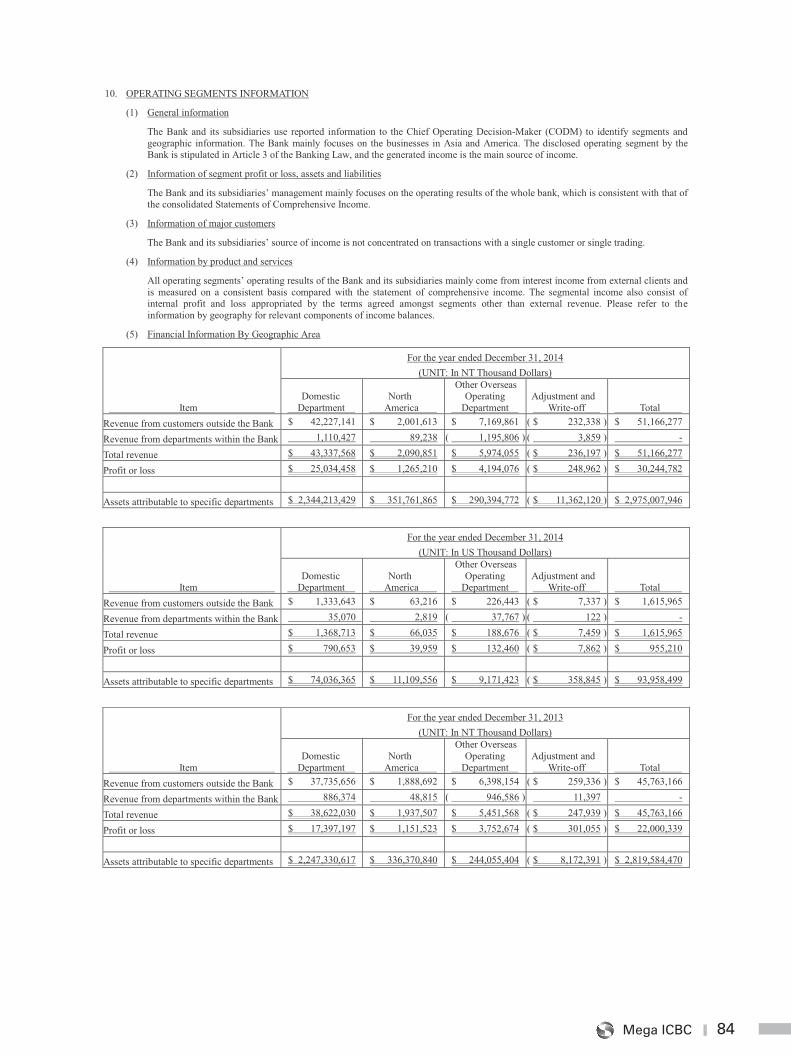
84Mega ICBC
84
10. OPERATING SEGMENTS INFORMATION
(1) General information
The Bank and its subsidiaries use reported information to the Chief Operating Decision-Maker (CODM) to identify segments and geographic information. The Bank mainly focuses on the businesses in Asia and America. The disclosed operating segment by the Bank is stipulated in Article 3 of the Banking Law, and the generated income is the main source of income.
(2) Information of segment profit or loss, assets and liabilities
The Bank and its subsidiaries’ management mainly focuses on the operating results of the whole bank, which is consistent with that of the consolidated Statements of Comprehensive Income.
(3) Information of major customers
The Bank and its subsidiaries’ source of income is not concentrated on transactions with a single customer or single trading.
(4) Information by product and services
All operating segments’ operating results of the Bank and its subsidiaries mainly come from interest income from external clients and is measured on a consistent basis compared with the statement of comprehensive income. The segmental income also consist of internal profit and loss appropriated by the terms agreed amongst segments other than external revenue. Please refer to the information by geography for relevant components of income balances.
(5) Financial Information By Geographic Area
For the year ended December 31, 2014
(UNIT: In NT Thousand Dollars)
Item Domestic Department
North America
Other Overseas Operating Department
Adjustment and Write-off Total
Revenue from customers outside the Bank $ 42,227,141 $ 2,001,613 $ 7,169,861 ( $ 232,338 ) $ 51,166,277
Revenue from departments within the Bank 1,110,427 89,238 ( 1,195,806 ) ( 3,859 ) -
Total revenue $ 43,337,568 $ 2,090,851 $ 5,974,055 ( $ 236,197 ) $ 51,166,277
Profit or loss $ 25,034,458 $ 1,265,210 $ 4,194,076 ( $ 248,962 ) $ 30,244,782
Assets attributable to specific departments $ 2,344,213,429 $ 351,761,865 $ 290,394,772 ( $ 11,362,120 ) $ 2,975,007,946
For the year ended December 31, 2014
(UNIT: In US Thousand Dollars)
Item Domestic Department
North America
Other Overseas Operating Department
Adjustment and Write-off Total
Revenue from customers outside the Bank $ 1,333,643 $ 63,216 $ 226,443 ( $ 7,337 ) $ 1,615,965
Revenue from departments within the Bank 35,070 2,819 ( 37,767 ) ( 122 ) -
Total revenue $ 1,368,713 $ 66,035 $ 188,676 ( $ 7,459 ) $ 1,615,965
Profit or loss $ 790,653 $ 39,959 $ 132,460 ( $ 7,862 ) $ 955,210
Assets attributable to specific departments $ 74,036,365 $ 11,109,556 $ 9,171,423 ( $ 358,845 ) $ 93,958,499
For the year ended December 31, 2013
(UNIT: In NT Thousand Dollars)
Item Domestic Department
North America
Other Overseas Operating Department
Adjustment and Write-off Total
Revenue from customers outside the Bank $ 37,735,656 $ 1,888,692 $ 6,398,154 ( $ 259,336 ) $ 45,763,166
Revenue from departments within the Bank 886,374 48,815 ( 946,586 ) 11,397 -
Total revenue $ 38,622,030 $ 1,937,507 $ 5,451,568 ( $ 247,939 ) $ 45,763,166
Profit or loss $ 17,397,197 $ 1,151,523 $ 3,752,674 ( $ 301,055 ) $ 22,000,339
Assets attributable to specific departments $ 2,247,330,617 $ 336,370,840 $ 244,055,404 ( $ 8,172,391 ) $ 2,819,584,470
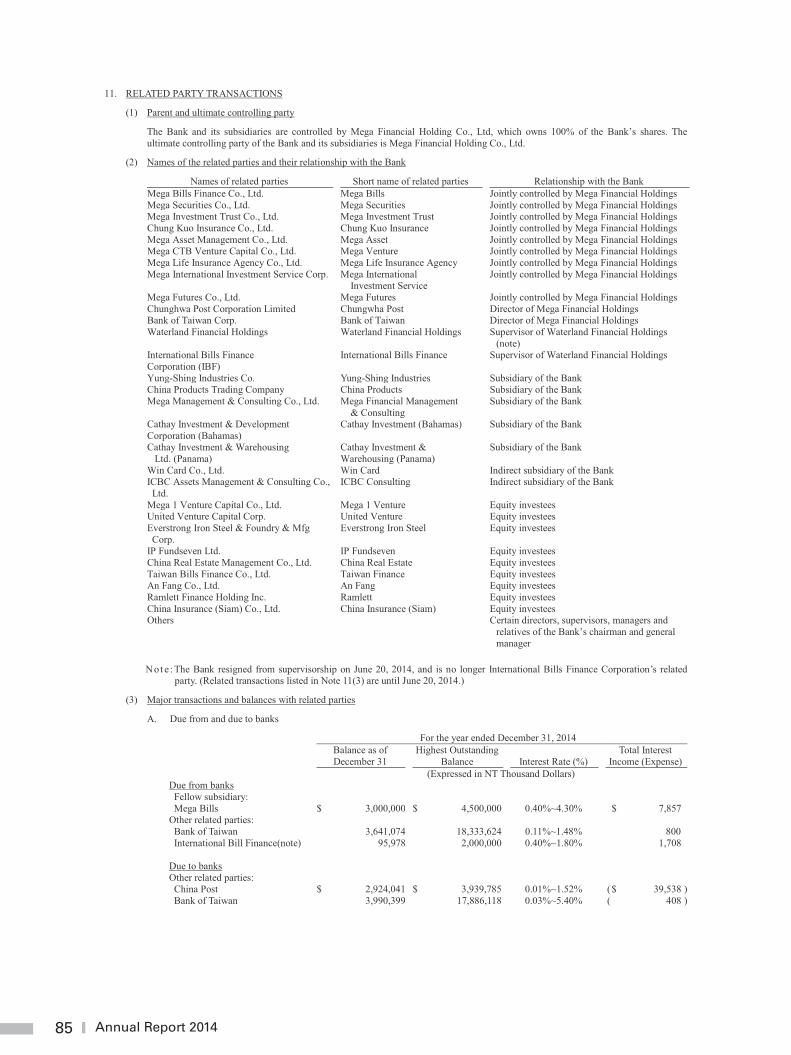
85 Annual Report 2014
85
11. RELATED PARTY TRANSACTIONS
(1) Parent and ultimate controlling party
The Bank and its subsidiaries are controlled by Mega Financial Holding Co., Ltd, which owns 100% of the Bank’s shares. The ultimate controlling party of the Bank and its subsidiaries is Mega Financial Holding Co., Ltd.
(2) Names of the related parties and their relationship with the Bank
Names of related parties Short name of related parties Relationship with the Bank Mega Bills Finance Co., Ltd. Mega Bills Jointly controlled by Mega Financial Holdings Mega Securities Co., Ltd. Mega Securities Jointly controlled by Mega Financial Holdings Mega Investment Trust Co., Ltd. Mega Investment Trust Jointly controlled by Mega Financial Holdings Chung Kuo Insurance Co., Ltd. Chung Kuo Insurance Jointly controlled by Mega Financial Holdings Mega Asset Management Co., Ltd. Mega Asset Jointly controlled by Mega Financial Holdings Mega CTB Venture Capital Co., Ltd. Mega Venture Jointly controlled by Mega Financial Holdings Mega Life Insurance Agency Co., Ltd. Mega Life Insurance Agency Jointly controlled by Mega Financial Holdings Mega International Investment Service Corp. Mega International
Investment Service Jointly controlled by Mega Financial Holdings
Mega Futures Co., Ltd. Mega Futures Jointly controlled by Mega Financial Holdings Chunghwa Post Corporation Limited Chungwha Post Director of Mega Financial Holdings Bank of Taiwan Corp. Bank of Taiwan Director of Mega Financial Holdings Waterland Financial Holdings Waterland Financial Holdings Supervisor of Waterland Financial Holdings
(note) International Bills Finance Corporation (IBF)
International Bills Finance Supervisor of Waterland Financial Holdings
Yung-Shing Industries Co. Yung-Shing Industries Subsidiary of the Bank China Products Trading Company China Products Subsidiary of the Bank Mega Management & Consulting Co., Ltd. Mega Financial Management
& Consulting Subsidiary of the Bank
Cathay Investment & Development Corporation (Bahamas)
Cathay Investment (Bahamas) Subsidiary of the Bank
Cathay Investment & Warehousing Ltd. (Panama)
Cathay Investment & Warehousing (Panama)
Subsidiary of the Bank
Win Card Co., Ltd. Win Card Indirect subsidiary of the Bank ICBC Assets Management & Consulting Co., Ltd.
ICBC Consulting Indirect subsidiary of the Bank
Mega 1 Venture Capital Co., Ltd. Mega 1 Venture Equity investees United Venture Capital Corp. United Venture Equity investees Everstrong Iron Steel & Foundry & Mfg Corp.
Everstrong Iron Steel Equity investees
IP Fundseven Ltd. IP Fundseven Equity investees China Real Estate Management Co., Ltd. China Real Estate Equity investees Taiwan Bills Finance Co., Ltd. Taiwan Finance Equity investees An Fang Co., Ltd. An Fang Equity investees Ramlett Finance Holding Inc. Ramlett Equity investees China Insurance (Siam) Co., Ltd. China Insurance (Siam) Equity investees Others Certain directors, supervisors, managers and
relatives of the Bank’s chairman and general manager
Not e : The Bank resigned from supervisorship on June 20, 2014, and is no longer International Bills Finance Corporation’s related party. (Related transactions listed in Note 11(3) are until June 20, 2014.)
(3) Major transactions and balances with related parties
A. Due from and due to banks
For the year ended December 31, 2014 Balance as of
December 31 Highest Outstanding
Balance
Interest Rate (%) Total Interest
Income (Expense) (Expressed in NT Thousand Dollars) Due from banks Fellow subsidiary: Mega Bills $ 3,000,000 $ 4,500,000 0.40%~4.30% $ 7,857
Other related parties: Bank of Taiwan 3,641,074 18,333,624 0.11%~1.48% 800 International Bill Finance(note) 95,978 2,000,000 0.40%~1.80% 1,708
Due to banks Other related parties: China Post $ 2,924,041 $ 3,939,785 0.01%~1.52% ( $ 39,538 )Bank of Taiwan 3,990,399 17,886,118 0.03%~5.40% ( 408 )
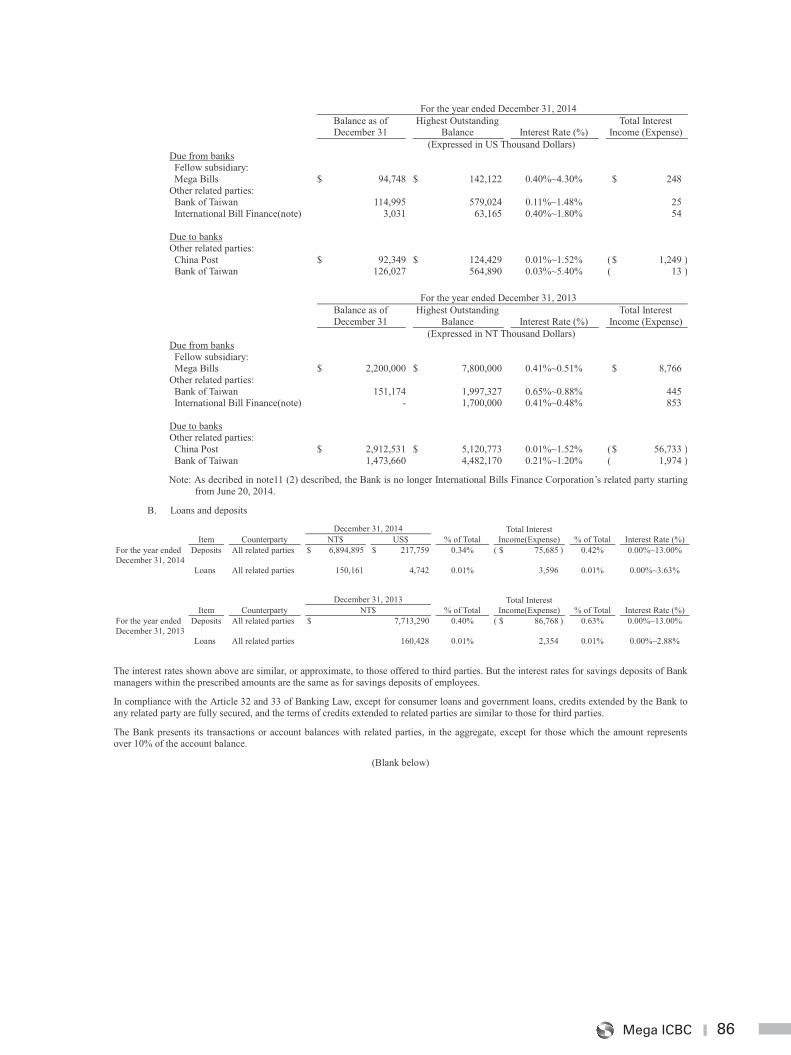
86Mega ICBC
86
For the year ended December 31, 2014 Balance as of
December 31 Highest Outstanding
Balance
Interest Rate (%) Total Interest
Income (Expense) (Expressed in US Thousand Dollars) Due from banks Fellow subsidiary: Mega Bills $ 94,748 $ 142,122 0.40%~4.30% $ 248
Other related parties: Bank of Taiwan 114,995 579,024 0.11%~1.48% 25 International Bill Finance(note) 3,031 63,165 0.40%~1.80% 54
Due to banks Other related parties: China Post $ 92,349 $ 124,429 0.01%~1.52% ( $ 1,249 )Bank of Taiwan 126,027 564,890 0.03%~5.40% ( 13 )
For the year ended December 31, 2013 Balance as of
December 31 Highest Outstanding
Balance
Interest Rate (%) Total Interest
Income (Expense) (Expressed in NT Thousand Dollars) Due from banks Fellow subsidiary: Mega Bills $ 2,200,000 $ 7,800,000 0.41%~0.51% $ 8,766
Other related parties: Bank of Taiwan 151,174 1,997,327 0.65%~0.88% 445 International Bill Finance(note) - 1,700,000 0.41%~0.48% 853
Due to banks Other related parties: China Post $ 2,912,531 $ 5,120,773 0.01%~1.52% ( $ 56,733 )Bank of Taiwan 1,473,660 4,482,170 0.21%~1.20% ( 1,974 )
Note: As decribed in note11 (2) described, the Bank is no longer International Bills Finance Corporation’s related party starting from June 20, 2014.
B. Loans and deposits
December 31, 2014 Total Interest Income(Expense)
Item Counterparty NT$ US$ % of Total % of Total Interest Rate (%) For the year ended December 31, 2014
Deposits All related parties $ 6,894,895 $ 217,759 0.34% ( $ 75,685 ) 0.42% 0.00%~13.00%
Loans All related parties 150,161 4,742 0.01% 3,596 0.01% 0.00%~3.63%
December 31, 2013 Total Interest Income(Expense)
Item Counterparty NT$ % of Total % of Total Interest Rate (%) For the year ended December 31, 2013
Deposits All related parties $ 7,713,290 0.40% ( $ 86,768 ) 0.63% 0.00%~13.00%
Loans All related parties 160,428 0.01% 2,354 0.01% 0.00%~2.88%
The interest rates shown above are similar, or approximate, to those offered to third parties. But the interest rates for savings deposits of Bank managers within the prescribed amounts are the same as for savings deposits of employees.
In compliance with the Article 32 and 33 of Banking Law, except for consumer loans and government loans, credits extended by the Bank to any related party are fully secured, and the terms of credits extended to related parties are similar to those for third parties.
The Bank presents its transactions or account balances with related parties, in the aggregate, except for those which the amount represents over 10% of the account balance.
(Blank below)
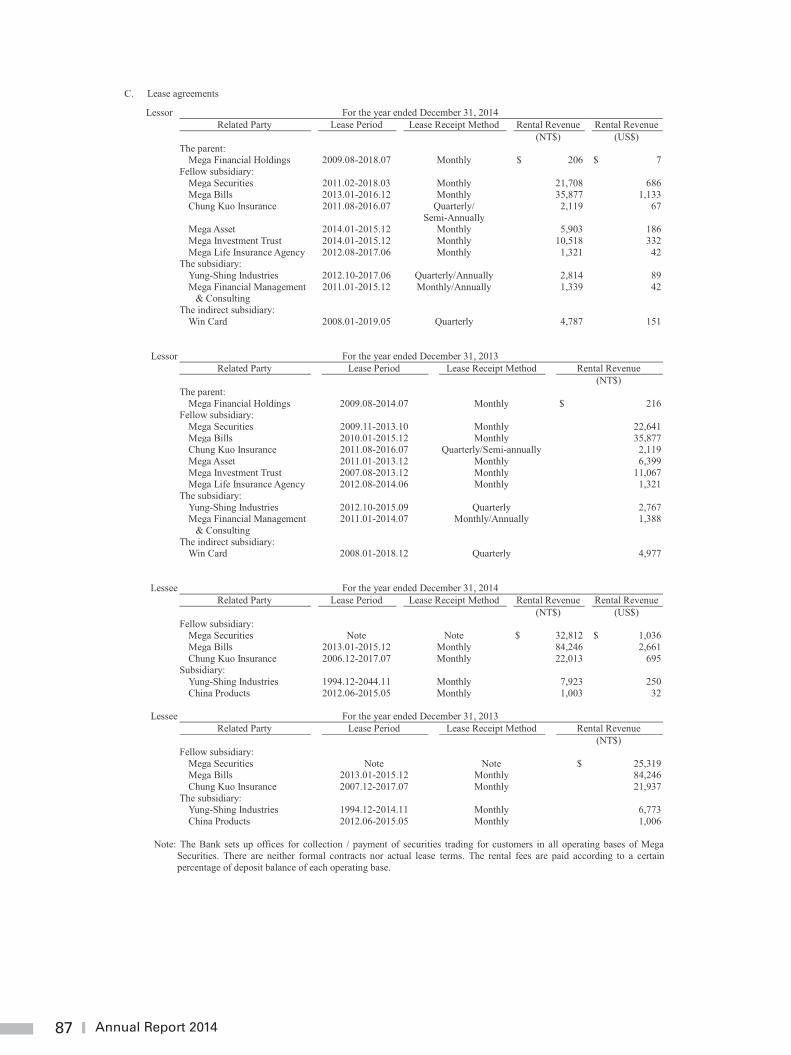
87 Annual Report 2014
87
C. Lease agreements
Lessor For the year ended December 31, 2014 Related Party Lease Period Lease Receipt Method Rental Revenue Rental Revenue (NT$) (US$)
The parent: Mega Financial Holdings 2009.08-2018.07 Monthly $ 206 $ 7
Fellow subsidiary: Mega Securities 2011.02-2018.03 Monthly 21,708 686
Mega Bills 2013.01-2016.12 Monthly 35,877 1,133 Chung Kuo Insurance 2011.08-2016.07 Quarterly/
Semi-Annually 2,119 67
Mega Asset 2014.01-2015.12 Monthly 5,903 186 Mega Investment Trust 2014.01-2015.12 Monthly 10,518 332 Mega Life Insurance Agency 2012.08-2017.06 Monthly 1,321 42 The subsidiary: Yung-Shing Industries 2012.10-2017.06 Quarterly/Annually 2,814 89 Mega Financial Management
& Consulting 2011.01-2015.12 Monthly/Annually 1,339 42
The indirect subsidiary: Win Card 2008.01-2019.05 Quarterly 4,787 151
Lessor For the year ended December 31, 2013 Related Party Lease Period Lease Receipt Method Rental Revenue (NT$)
The parent: Mega Financial Holdings 2009.08-2014.07 Monthly $ 216
Fellow subsidiary: Mega Securities 2009.11-2013.10 Monthly 22,641
Mega Bills 2010.01-2015.12 Monthly 35,877 Chung Kuo Insurance 2011.08-2016.07 Quarterly/Semi-annually 2,119 Mega Asset 2011.01-2013.12 Monthly 6,399 Mega Investment Trust 2007.08-2013.12 Monthly 11,067 Mega Life Insurance Agency 2012.08-2014.06 Monthly 1,321 The subsidiary: Yung-Shing Industries 2012.10-2015.09 Quarterly 2,767 Mega Financial Management
& Consulting 2011.01-2014.07 Monthly/Annually 1,388
The indirect subsidiary: Win Card 2008.01-2018.12 Quarterly 4,977
Lessee For the year ended December 31, 2014 Related Party Lease Period Lease Receipt Method Rental Revenue Rental Revenue (NT$) (US$)
Fellow subsidiary: Mega Securities Note Note $ 32,812 $ 1,036 Mega Bills 2013.01-2015.12 Monthly 84,246 2,661 Chung Kuo Insurance 2006.12-2017.07 Monthly 22,013 695
Subsidiary: Yung-Shing Industries 1994.12-2044.11 Monthly 7,923 250 China Products 2012.06-2015.05 Monthly 1,003 32
Lessee For the year ended December 31, 2013
Related Party Lease Period Lease Receipt Method Rental Revenue (NT$)
Fellow subsidiary: Mega Securities Note Note $ 25,319 Mega Bills 2013.01-2015.12 Monthly 84,246 Chung Kuo Insurance 2007.12-2017.07 Monthly 21,937
The subsidiary: Yung-Shing Industries 1994.12-2014.11 Monthly 6,773 China Products 2012.06-2015.05 Monthly 1,006
Note: The Bank sets up offices for collection / payment of securities trading for customers in all operating bases of Mega
Securities. There are neither formal contracts nor actual lease terms. The rental fees are paid according to a certain percentage of deposit balance of each operating base.
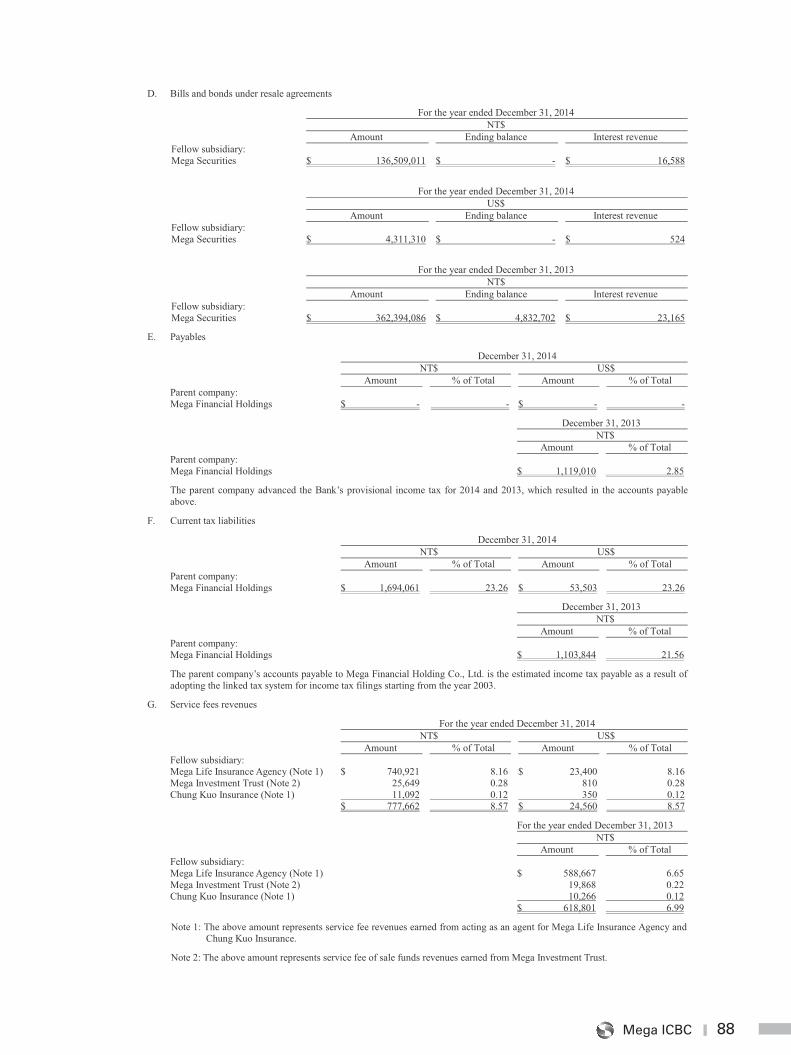
88Mega ICBC
88
D. Bills and bonds under resale agreements
For the year ended December 31, 2014 NT$ Amount Ending balance Interest revenue Fellow subsidiary: Mega Securities $ 136,509,011 $ - $ 16,588
For the year ended December 31, 2014 US$ Amount Ending balance Interest revenue Fellow subsidiary: Mega Securities $ 4,311,310 $ - $ 524
For the year ended December 31, 2013 NT$ Amount Ending balance Interest revenue Fellow subsidiary: Mega Securities $ 362,394,086 $ 4,832,702 $ 23,165
E. Payables
December 31, 2014 NT$ US$ Amount % of Total Amount % of Total Parent company: Mega Financial Holdings $ - - $ - -
December 31, 2013 NT$ Amount % of Total Parent company: Mega Financial Holdings $ 1,119,010 2.85
The parent company advanced the Bank’s provisional income tax for 2014 and 2013, which resulted in the accounts payable above.
F. Current tax liabilities
December 31, 2014 NT$ US$ Amount % of Total Amount % of Total Parent company: Mega Financial Holdings $ 1,694,061 23.26 $ 53,503 23.26
December 31, 2013 NT$ Amount % of Total Parent company: Mega Financial Holdings $ 1,103,844 21.56
The parent company’s accounts payable to Mega Financial Holding Co., Ltd. is the estimated income tax payable as a result of adopting the linked tax system for income tax filings starting from the year 2003.
G. Service fees revenues
For the year ended December 31, 2014 NT$ US$ Amount % of Total Amount % of Total Fellow subsidiary: Mega Life Insurance Agency (Note 1) $ 740,921 8.16 $ 23,400 8.16 Mega Investment Trust (Note 2) 25,649 0.28 810 0.28 Chung Kuo Insurance (Note 1) 11,092 0.12 350 0.12 $ 777,662 8.57 $ 24,560 8.57
For the year ended December 31, 2013 NT$ Amount % of Total Fellow subsidiary: Mega Life Insurance Agency (Note 1) $ 588,667 6.65 Mega Investment Trust (Note 2) 19,868 0.22 Chung Kuo Insurance (Note 1) 10,266 0.12 $ 618,801 6.99
Note 1: The above amount represents service fee revenues earned from acting as an agent for Mega Life Insurance Agency and Chung Kuo Insurance.
Note 2: The above amount represents service fee of sale funds revenues earned from Mega Investment Trust.
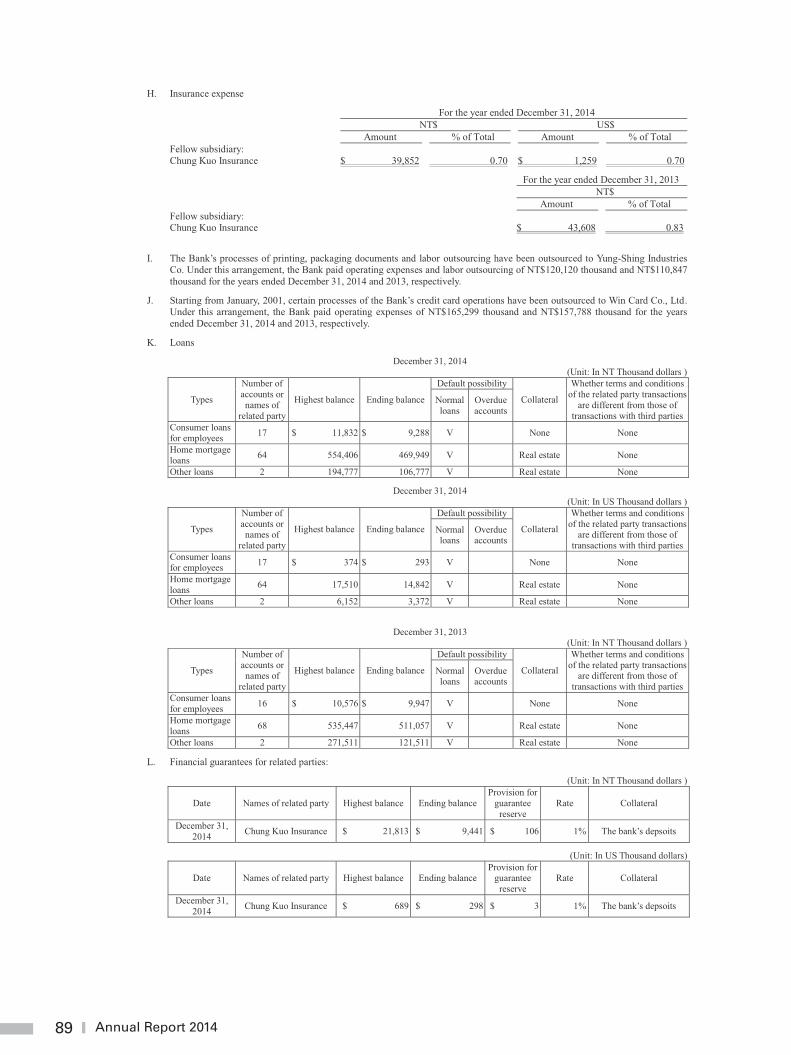
89 Annual Report 2014
89
H. Insurance expense
For the year ended December 31, 2014 NT$ US$ Amount % of Total Amount % of Total Fellow subsidiary: Chung Kuo Insurance $ 39,852 0.70 $ 1,259 0.70
For the year ended December 31, 2013 NT$ Amount % of Total Fellow subsidiary: Chung Kuo Insurance $ 43,608 0.83
I. The Bank’s processes of printing, packaging documents and labor outsourcing have been outsourced to Yung-Shing Industries Co. Under this arrangement, the Bank paid operating expenses and labor outsourcing of NT$120,120 thousand and NT$110,847 thousand for the years ended December 31, 2014 and 2013, respectively.
J. Starting from January, 2001, certain processes of the Bank’s credit card operations have been outsourced to Win Card Co., Ltd. Under this arrangement, the Bank paid operating expenses of NT$165,299 thousand and NT$157,788 thousand for the years ended December 31, 2014 and 2013, respectively.
K. Loans
December 31, 2014 (Unit: In NT Thousand dollars )
Types
Number of accounts or names of
related party
Highest balance Ending balance
Default possibility
Collateral
Whether terms and conditions of the related party transactions
are different from those of transactions with third parties
Normal loans
Overdue accounts
Consumer loans for employees 17 $ 11,832 $ 9,288 V None None
Home mortgage loans 64 554,406 469,949 V Real estate None
Other loans 2 194,777 106,777 V Real estate None
December 31, 2014
(Unit: In US Thousand dollars )
Types
Number of accounts or names of
related party
Highest balance Ending balance
Default possibility
Collateral
Whether terms and conditions of the related party transactions
are different from those of transactions with third parties
Normal loans
Overdue accounts
Consumer loans for employees 17 $ 374 $ 293 V None None
Home mortgage loans 64 17,510 14,842 V Real estate None
Other loans 2 6,152 3,372 V Real estate None
December 31, 2013 (Unit: In NT Thousand dollars )
Types
Number of accounts or names of
related party
Highest balance Ending balance
Default possibility
Collateral
Whether terms and conditions of the related party transactions
are different from those of transactions with third parties
Normal loans
Overdue accounts
Consumer loans for employees 16 $ 10,576 $ 9,947 V None None
Home mortgage loans 68 535,447 511,057 V Real estate None
Other loans 2 271,511 121,511 V Real estate None
L. Financial guarantees for related parties:
(Unit: In NT Thousand dollars )
Date
Names of related party Highest balance Ending balance Provision for
guarantee reserve
Rate Collateral
December 31, 2014 Chung Kuo Insurance $ 21,813 $ 9,441 $ 106 1% The bank’s depsoits
(Unit: In US Thousand dollars)
Date
Names of related party Highest balance Ending balance Provision for
guarantee reserve
Rate Collateral
December 31, 2014 Chung Kuo Insurance $ 689 $ 298 $ 3 1% The bank’s depsoits
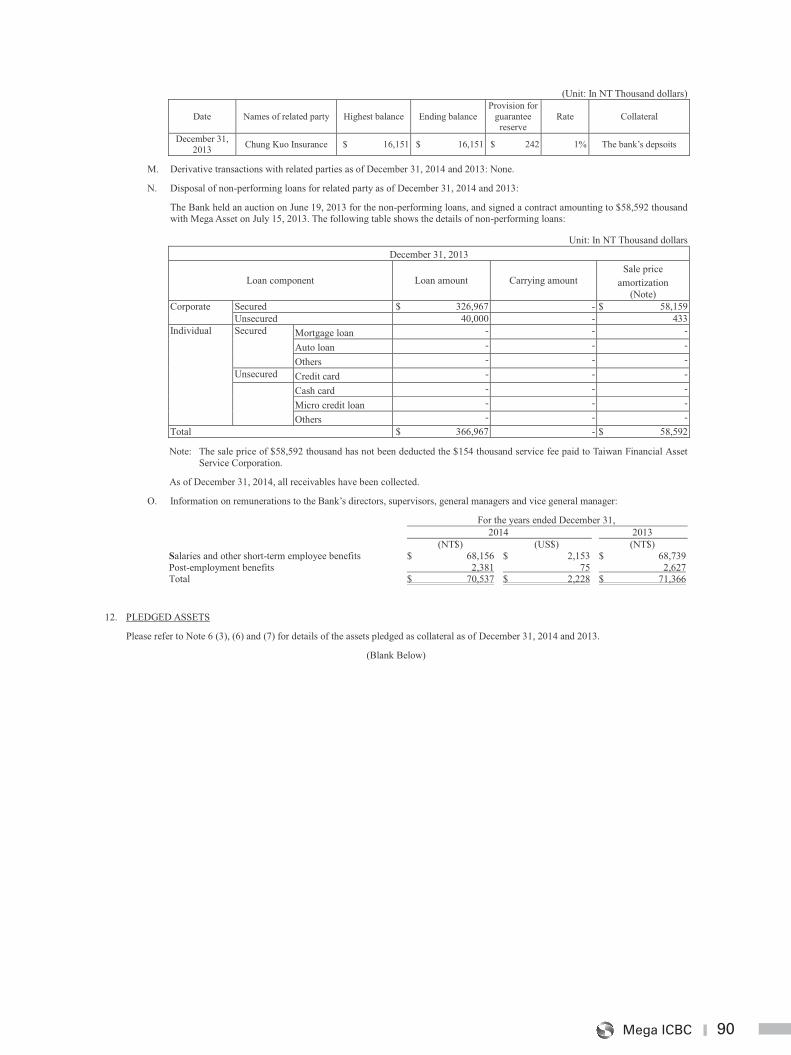
90Mega ICBC
90
(Unit: In NT Thousand dollars)
Date
Names of related party Highest balance Ending balance Provision for
guarantee reserve
Rate Collateral
December 31, 2013 Chung Kuo Insurance $ 16,151 $ 16,151 $ 242 1% The bank’s depsoits
M. Derivative transactions with related parties as of December 31, 2014 and 2013: None.
N. Disposal of non-performing loans for related party as of December 31, 2014 and 2013:
The Bank held an auction on June 19, 2013 for the non-performing loans, and signed a contract amounting to $58,592 thousand with Mega Asset on July 15, 2013. The following table shows the details of non-performing loans:
Unit: In NT Thousand dollars December 31, 2013
Loan component Loan amount Carrying amount Sale price
amortization (Note)
Corporate Secured $ 326,967 - $ 58,159 Unsecured 40,000 - 433
Individual Secured Mortgage loan - - -
Auto loan - - -
Others - - - Unsecured Credit card - - - Cash card - - -
Micro credit loan - - - Others - - -
Total $ 366,967 - $ 58,592
Note: The sale price of $58,592 thousand has not been deducted the $154 thousand service fee paid to Taiwan Financial Asset Service Corporation.
As of December 31, 2014, all receivables have been collected.
O. Information on remunerations to the Bank’s directors, supervisors, general managers and vice general manager:
For the years ended December 31, 2014 2013 (NT$) (US$) (NT$) Salaries and other short-term employee benefits $ 68,156 $ 2,153 $ 68,739 Post-employment benefits 2,381 75 2,627 Total $ 70,537 $ 2,228 $ 71,366
12. PLEDGED ASSETS
Please refer to Note 6 (3), (6) and (7) for details of the assets pledged as collateral as of December 31, 2014 and 2013.
(Blank Below)
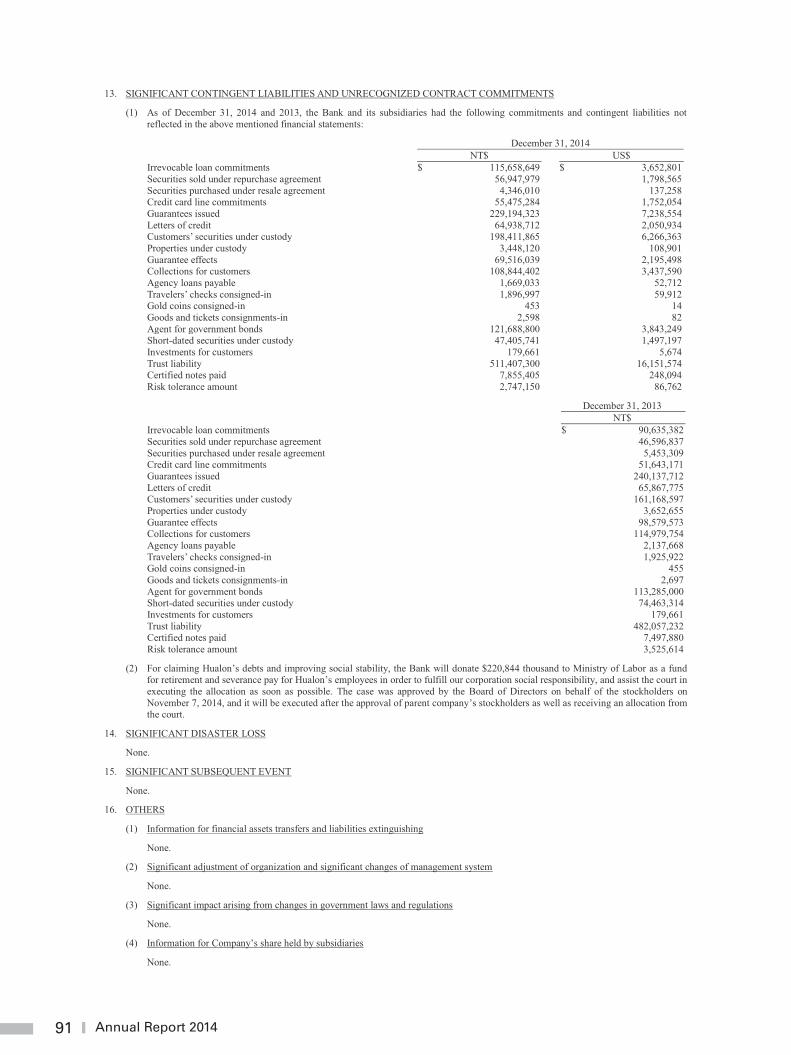
91 Annual Report 2014
91
13. SIGNIFICANT CONTINGENT LIABILITIES AND UNRECOGNIZED CONTRACT COMMITMENTS
(1) As of December 31, 2014 and 2013, the Bank and its subsidiaries had the following commitments and contingent liabilities not reflected in the above mentioned financial statements:
December 31, 2014 NT$ US$ Irrevocable loan commitments $ 115,658,649 $ 3,652,801 Securities sold under repurchase agreement 56,947,979 1,798,565 Securities purchased under resale agreement 4,346,010 137,258 Credit card line commitments 55,475,284 1,752,054 Guarantees issued 229,194,323 7,238,554 Letters of credit 64,938,712 2,050,934 Customers’ securities under custody 198,411,865 6,266,363 Properties under custody 3,448,120 108,901 Guarantee effects 69,516,039 2,195,498 Collections for customers 108,844,402 3,437,590 Agency loans payable 1,669,033 52,712 Travelers’ checks consigned-in 1,896,997 59,912 Gold coins consigned-in 453 14 Goods and tickets consignments-in 2,598 82 Agent for government bonds 121,688,800 3,843,249 Short-dated securities under custody 47,405,741 1,497,197 Investments for customers 179,661 5,674 Trust liability 511,407,300 16,151,574 Certified notes paid 7,855,405 248,094 Risk tolerance amount 2,747,150 86,762
December 31, 2013 NT$ Irrevocable loan commitments $ 90,635,382 Securities sold under repurchase agreement 46,596,837 Securities purchased under resale agreement 5,453,309 Credit card line commitments 51,643,171 Guarantees issued 240,137,712 Letters of credit 65,867,775 Customers’ securities under custody 161,168,597 Properties under custody 3,652,655 Guarantee effects 98,579,573 Collections for customers 114,979,754 Agency loans payable 2,137,668 Travelers’ checks consigned-in 1,925,922 Gold coins consigned-in 455 Goods and tickets consignments-in 2,697 Agent for government bonds 113,285,000 Short-dated securities under custody 74,463,314 Investments for customers 179,661 Trust liability 482,057,232 Certified notes paid 7,497,880 Risk tolerance amount 3,525,614
(2) For claiming Hualon’s debts and improving social stability, the Bank will donate $220,844 thousand to Ministry of Labor as a fund for retirement and severance pay for Hualon’s employees in order to fulfill our corporation social responsibility, and assist the court in executing the allocation as soon as possible. The case was approved by the Board of Directors on behalf of the stockholders on November 7, 2014, and it will be executed after the approval of parent company’s stockholders as well as receiving an allocation from the court.
14. SIGNIFICANT DISASTER LOSS
None.
15. SIGNIFICANT SUBSEQUENT EVENT
None.
16. OTHERS
(1) Information for financial assets transfers and liabilities extinguishing
None.
(2) Significant adjustment of organization and significant changes of management system
None.
(3) Significant impact arising from changes in government laws and regulations
None.
(4) Information for Company’s share held by subsidiaries
None.
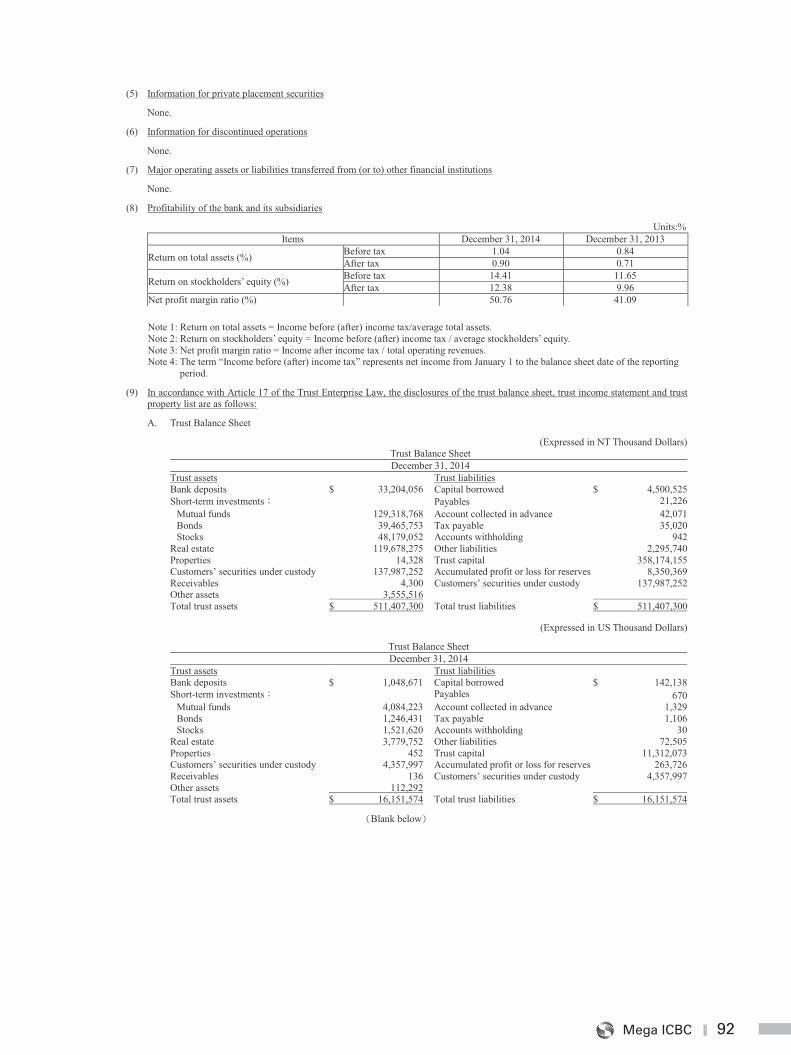
92Mega ICBC
92
(5) Information for private placement securities
None.
(6) Information for discontinued operations
None.
(7) Major operating assets or liabilities transferred from (or to) other financial institutions
None.
(8) Profitability of the bank and its subsidiaries
Units:% Items December 31, 2014 December 31, 2013
Return on total assets (%) Before tax 1.04 0.84 After tax 0.90 0.71
Return on stockholders’ equity (%) Before tax 14.41 11.65 After tax 12.38 9.96
Net profit margin ratio (%) 50.76 41.09
Note 1: Return on total assets = Income before (after) income tax/average total assets. Note 2: Return on stockholders’ equity = Income before (after) income tax / average stockholders’ equity. Note 3: Net profit margin ratio = Income after income tax / total operating revenues. Note 4: The term “Income before (after) income tax” represents net income from January 1 to the balance sheet date of the reporting
period.
(9) In accordance with Article 17 of the Trust Enterprise Law, the disclosures of the trust balance sheet, trust income statement and trust property list are as follows:
A. Trust Balance Sheet
(Expressed in NT Thousand Dollars) Trust Balance Sheet December 31, 2014
Trust assets Trust liabilities Bank deposits $ 33,204,056 Capital borrowed $ 4,500,525 Short-term investments Payables 21,226
Mutual funds 129,318,768 Account collected in advance 42,071 Bonds 39,465,753 Tax payable 35,020 Stocks 48,179,052 Accounts withholding 942
Real estate 119,678,275 Other liabilities 2,295,740 Properties 14,328 Trust capital 358,174,155 Customers’ securities under custody 137,987,252 Accumulated profit or loss for reserves 8,350,369 Receivables 4,300 Customers’ securities under custody 137,987,252 Other assets 3,555,516 Total trust assets $ 511,407,300 Total trust liabilities $ 511,407,300
(Expressed in US Thousand Dollars)
Trust Balance Sheet December 31, 2014
Trust assets Trust liabilities Bank deposits $ 1,048,671 Capital borrowed $ 142,138 Short-term investments Payables 670
Mutual funds 4,084,223 Account collected in advance 1,329 Bonds 1,246,431 Tax payable 1,106 Stocks 1,521,620 Accounts withholding 30
Real estate 3,779,752 Other liabilities 72,505 Properties 452 Trust capital 11,312,073 Customers’ securities under custody 4,357,997 Accumulated profit or loss for reserves 263,726 Receivables 136 Customers’ securities under custody 4,357,997 Other assets 112,292 Total trust assets $ 16,151,574 Total trust liabilities $ 16,151,574
Blank below
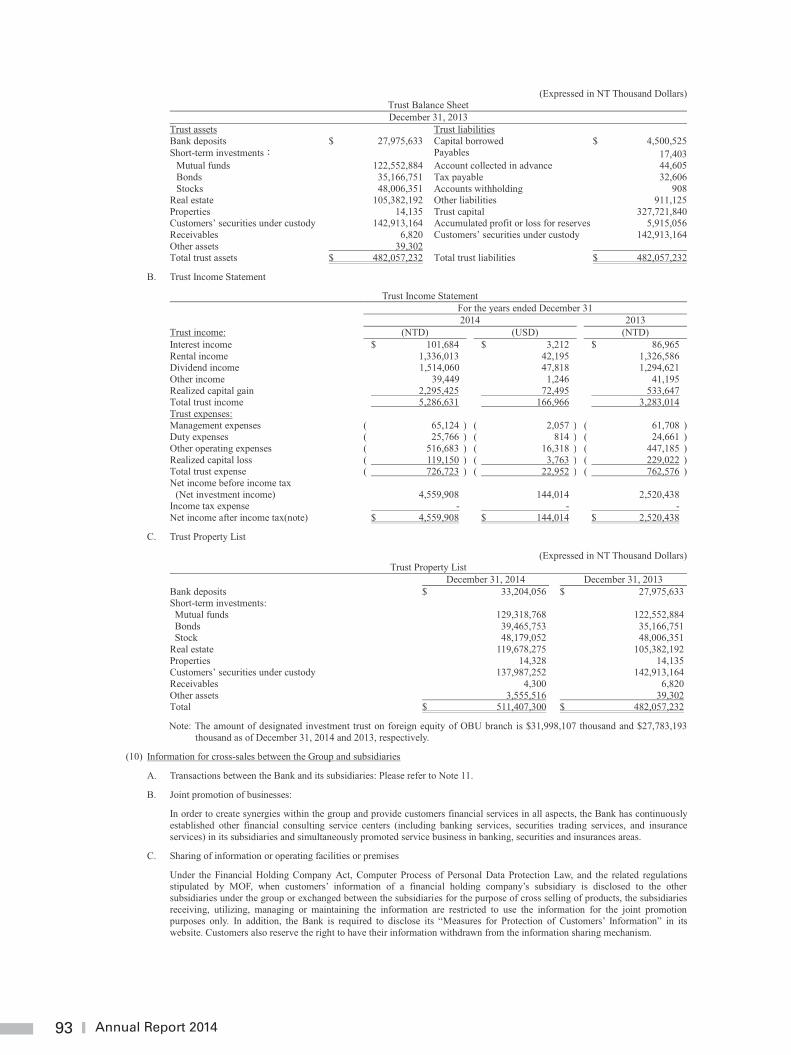
93 Annual Report 2014
93
(Expressed in NT Thousand Dollars) Trust Balance Sheet December 31, 2013
Trust assets Trust liabilities Bank deposits $ 27,975,633 Capital borrowed $ 4,500,525 Short-term investments Payables 17,403
Mutual funds 122,552,884 Account collected in advance 44,605 Bonds 35,166,751 Tax payable 32,606 Stocks 48,006,351 Accounts withholding 908
Real estate 105,382,192 Other liabilities 911,125 Properties 14,135 Trust capital 327,721,840 Customers’ securities under custody 142,913,164 Accumulated profit or loss for reserves 5,915,056 Receivables 6,820 Customers’ securities under custody 142,913,164 Other assets 39,302 Total trust assets $ 482,057,232 Total trust liabilities $ 482,057,232
B. Trust Income Statement
Trust Income Statement For the years ended December 31 2014 2013 Trust income: (NTD) (USD) (NTD) Interest income $ 101,684 $ 3,212 $ 86,965 Rental income 1,336,013 42,195 1,326,586 Dividend income 1,514,060 47,818 1,294,621 Other income 39,449 1,246 41,195 Realized capital gain 2,295,425 72,495 533,647 Total trust income 5,286,631 166,966 3,283,014 Trust expenses: Management expenses ( 65,124 ) ( 2,057 ) ( 61,708 ) Duty expenses ( 25,766 ) ( 814 ) ( 24,661 ) Other operating expenses ( 516,683 ) ( 16,318 ) ( 447,185 ) Realized capital loss ( 119,150 ) ( 3,763 ) ( 229,022 ) Total trust expense ( 726,723 ) ( 22,952 ) ( 762,576 ) Net income before income tax
(Net investment income) 4,559,908 144,014 2,520,438 Income tax expense - - - Net income after income tax(note) $ 4,559,908 $ 144,014 $ 2,520,438
C. Trust Property List
(Expressed in NT Thousand Dollars)Trust Property List
December 31, 2014 December 31, 2013 Bank deposits $ 33,204,056 $ 27,975,633 Short-term investments: Mutual funds 129,318,768 122,552,884 Bonds 39,465,753 35,166,751 Stock 48,179,052 48,006,351
Real estate 119,678,275 105,382,192 Properties 14,328 14,135 Customers’ securities under custody 137,987,252 142,913,164 Receivables 4,300 6,820 Other assets 3,555,516 39,302 Total $ 511,407,300 $ 482,057,232
Note: The amount of designated investment trust on foreign equity of OBU branch is $31,998,107 thousand and $27,783,193 thousand as of December 31, 2014 and 2013, respectively.
(10) Information for cross-sales between the Group and subsidiaries
A. Transactions between the Bank and its subsidiaries: Please refer to Note 11.
B. Joint promotion of businesses:
In order to create synergies within the group and provide customers financial services in all aspects, the Bank has continuously established other financial consulting service centers (including banking services, securities trading services, and insurance services) in its subsidiaries and simultaneously promoted service business in banking, securities and insurances areas.
C. Sharing of information or operating facilities or premises
Under the Financial Holding Company Act, Computer Process of Personal Data Protection Law, and the related regulations stipulated by MOF, when customers’ information of a financial holding company’s subsidiary is disclosed to the other subsidiaries under the group or exchanged between the subsidiaries for the purpose of cross selling of products, the subsidiaries receiving, utilizing, managing or maintaining the information are restricted to use the information for the joint promotion purposes only. In addition, the Bank is required to disclose its “Measures for Protection of Customers’ Information” in its website. Customers also reserve the right to have their information withdrawn from the information sharing mechanism.
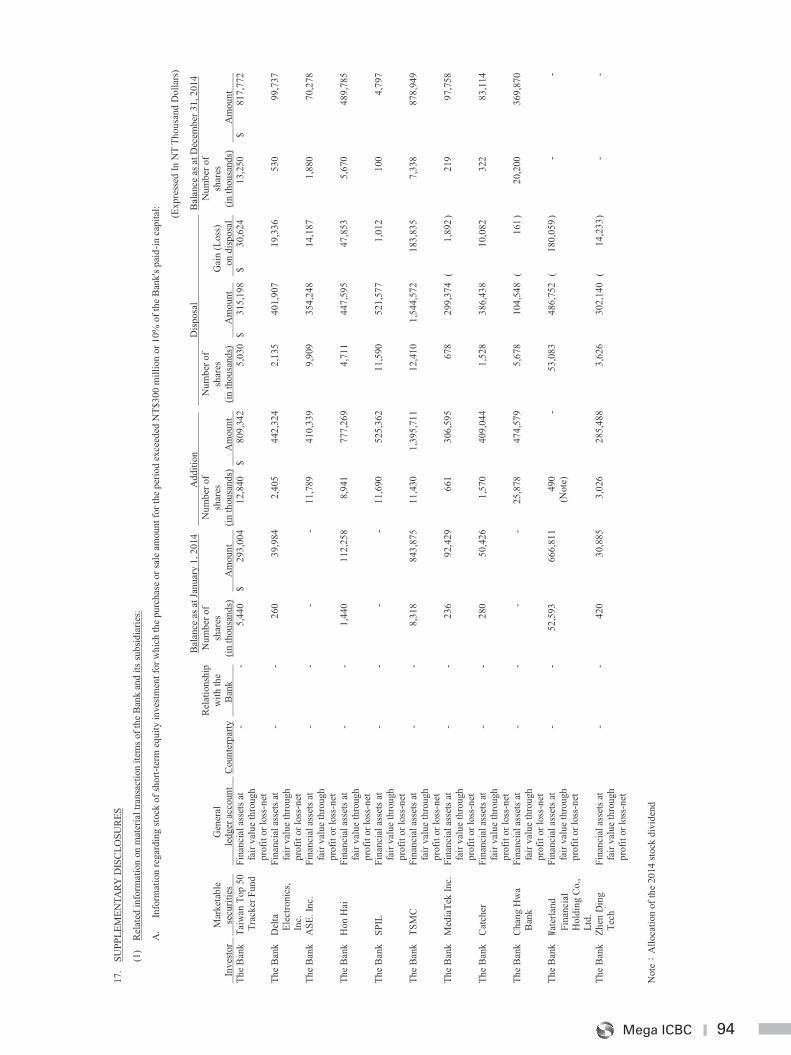
94Mega ICBC
94
17.
SUPP
LEM
ENTA
RY D
ISC
LOSU
RES
(1)
Rel
ated
info
rmat
ion
on m
ater
ial t
rans
actio
n ite
ms o
f the
Ban
k an
d its
subs
idia
ries:
A.
Info
rmat
ion
rega
rdin
g st
ock
of sh
ort-t
erm
equ
ity in
vest
men
t for
whi
ch th
e pu
rcha
se o
r sal
e am
ount
for t
he p
erio
d ex
ceed
ed N
T$30
0 m
illio
n or
10%
of t
he B
ank'
s pai
d-in
cap
ital: (Exp
ress
ed In
NT
Thou
sand
Dol
lars
)
Bal
ance
as a
t Jan
uary
1, 2
014
A
dditi
on
Dis
posa
l B
alan
ce a
s at D
ecem
ber 3
1, 2
014
In
vest
or
Mar
keta
ble
se
curit
ies
G
ener
al
le
dger
acc
ount
C
ount
erpa
rty R
elat
ions
hip
with
the
Ban
k
Num
ber o
f sh
ares
(in
thou
sand
s)
A
mou
nt
Num
ber o
f sh
ares
(in
thou
sand
s)
Am
ount
Num
ber o
f sh
ares
(in
thou
sand
s)
Am
ount
Gai
n (L
oss)
on d
ispos
al
Num
ber o
f sh
ares
(in
thou
sand
s)
A
mou
nt
Th
e B
ank
Taiw
an T
op 5
0 Tr
acke
r Fun
d Fi
nanc
ial a
sset
s at
fair
valu
e th
roug
h pr
ofit
or lo
ss-n
et
- -
5,44
0 $
293,
004
12,8
40
$ 80
9,34
2 5,
030
$ 31
5,19
8 $
30
,624
13
,250
$
81
7,77
2
The
Ban
k D
elta
El
ectro
nics
, In
c.
Fina
ncia
l ass
ets a
t fa
ir va
lue
thro
ugh
prof
it or
loss
-net
- -
260
39,9
84
2,40
5 44
2,32
4 2,
135
401,
907
19
,336
53
0 99
,737
The
Ban
k A
SE. I
nc.
Fina
ncia
l ass
ets a
t fa
ir va
lue
thro
ugh
prof
it or
loss
-net
- -
- -
11,7
89
410,
339
9,90
9 35
4,24
8
14,1
87
1,88
0 70
,278
The
Ban
k H
on H
ai
Fina
ncia
l ass
ets a
t fa
ir va
lue
thro
ugh
prof
it or
loss
-net
- -
1,44
0 11
2,25
8 8,
941
777,
269
4,71
1 44
7,59
5
47,8
53
5,67
0 48
9,78
5
The
Ban
k SP
IL
Fina
ncia
l ass
ets a
t fa
ir va
lue
thro
ugh
prof
it or
loss
-net
- -
- -
11,6
90
525,
362
11,5
90
521,
577
1,
012
10
0 4,
797
The
Ban
k TS
MC
Fi
nanc
ial a
sset
s at
fair
valu
e th
roug
h pr
ofit
or lo
ss-n
et
- -
8,31
8 84
3,87
5 11
,430
1,
395,
711
12,4
10
1,54
4,57
2
183,
835
7,
338
878,
949
The
Ban
k M
edia
Tek
Inc.
Fi
nanc
ial a
sset
s at
fair
valu
e th
roug
h pr
ofit
or lo
ss-n
et
- -
236
92,4
29
661
306,
595
678
299,
374
( 1,
892 )
21
9 97
,758
The
Ban
k C
atch
er
Fina
ncia
l ass
ets a
t fa
ir va
lue
thro
ugh
prof
it or
loss
-net
- -
280
50,4
26
1,57
0 40
9,04
4 1,
528
386,
438
10
,082
32
2 83
,114
The
Ban
k C
hang
Hw
a B
ank
Fina
ncia
l ass
ets a
t fa
ir va
lue
thro
ugh
prof
it or
loss
-net
- -
--
25,8
78
474,
579
5,67
8 10
4,54
8 (
161 )
20
,200
36
9,87
0
The
Ban
k at
erla
nd
Fina
ncia
l H
oldi
ng C
o.,
Ltd.
Fina
ncia
l ass
ets a
t fa
ir va
lue
thro
ugh
prof
it or
loss
-net
- -
52,5
93
666,
811
490
(Not
e)
- 53
,083
48
6,75
2 (
180,
059 )
-
-
The
Ban
k Zh
en D
ing
Tech
Fi
nanc
ial a
sset
s at
fair
valu
e th
roug
h pr
ofit
or lo
ss-n
et
- -
420
30,8
85
3,02
6 28
5,48
8 3,
626
302,
140
( 14
,233
) -
-
Not
eA
lloca
tion
of th
e 20
14 st
ock
divi
dend
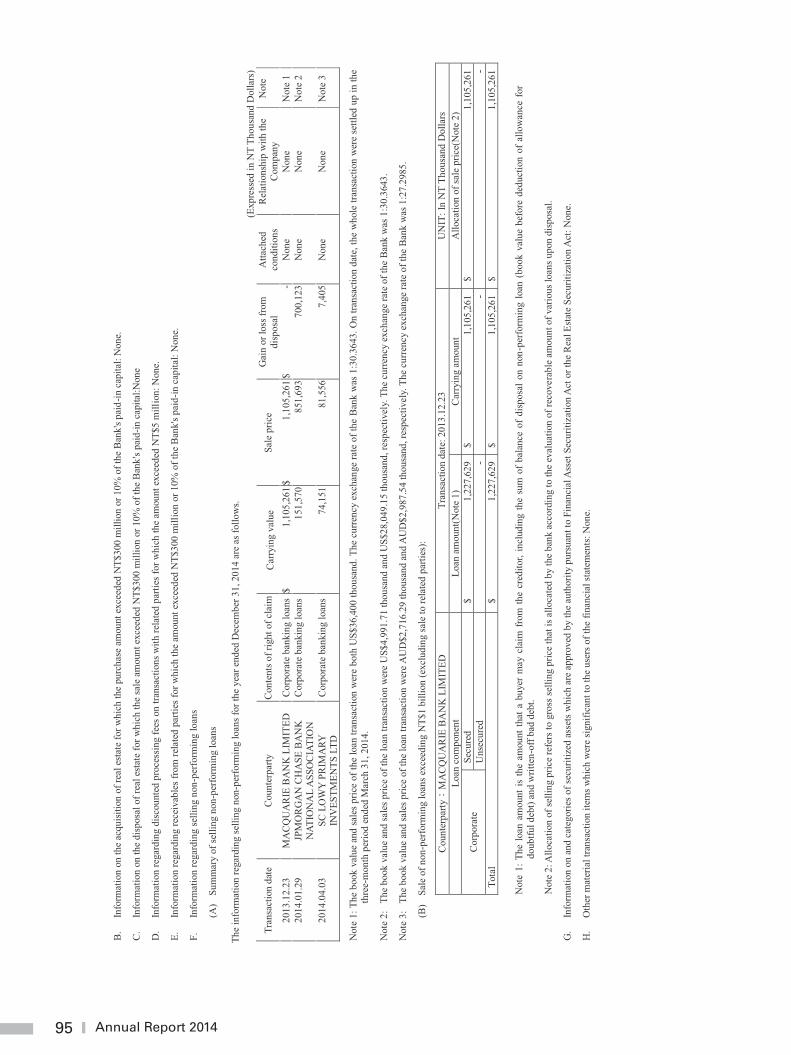
95 Annual Report 2014
95
B.
Info
rmat
ion
on th
e ac
quisi
tion
of re
al e
stat
e fo
r whi
ch th
e pu
rcha
se a
mou
nt e
xcee
ded
NT$
300
mill
ion
or 1
0% o
f the
Ban
k's p
aid-
in c
apita
l: N
one.
C.
Info
rmat
ion
on th
e di
spos
al o
f rea
l est
ate
for w
hich
the
sale
am
ount
exc
eede
d N
T$30
0 m
illio
n or
10%
of t
he B
ank'
s pai
d-in
cap
ital:N
one
D.
Info
rmat
ion
rega
rdin
g di
scou
nted
pro
cess
ing
fees
on
trans
actio
ns w
ith re
late
d pa
rties
for w
hich
the
amou
nt e
xcee
ded
NT$
5 m
illio
n: N
one.
E.
Info
rmat
ion
rega
rdin
g re
ceiv
able
s fro
m re
late
d pa
rties
for w
hich
the
amou
nt e
xcee
ded
NT$
300
mill
ion
or 1
0% o
f the
Ban
k's p
aid-
in c
apita
l: N
one.
F.
Info
rmat
ion
rega
rdin
g se
lling
non
-per
form
ing
loan
s
(A)
Sum
mar
y of
selli
ng n
on-p
erfo
rmin
g lo
ans
The
info
rmat
ion
rega
rdin
g se
lling
non
-per
form
ing
loan
s for
the
year
end
ed D
ecem
ber 3
1, 2
014
are
as fo
llow
s.(E
xpre
ssed
in N
T Th
ousa
nd D
olla
rs)
Tran
sact
ion
date
C
ount
erpa
rty
Con
tent
s of r
ight
of c
laim
C
arry
ing
valu
e Sa
le p
rice
Gai
n or
loss
from
di
spos
al
Atta
ched
co
nditi
ons
Rel
atio
nshi
p w
ith th
e C
ompa
ny
Not
e
2013
.12.
23
MA
CQ
UA
RIE
BA
NK
LIM
ITED
C
orpo
rate
ban
king
loan
s $
1,10
5,26
1 $
1,10
5,26
1 $
- N
one
Non
e N
ote
1 20
14.0
1.29
JP
MO
RG
AN
CH
ASE
BA
NK
N
ATIO
NA
L A
SSO
CIA
TIO
N
Cor
pora
te b
anki
ng lo
ans
15
1,57
0
851,
693
700,
123
Non
e N
one
Not
e 2
2014
.04.
03
SC L
OW
Y P
RIM
ARY
IN
VES
TMEN
TS L
TD
Cor
pora
te b
anki
ng lo
ans
74
,151
81
,556
7,
405
Non
e N
one
Not
e 3
Not
e 1:
The
boo
k va
lue
and
sale
s pric
e of
the
loan
tran
sact
ion
wer
e bo
th U
S$36
,400
thou
sand
. The
cur
renc
y ex
chan
ge ra
te o
f the
Ban
k w
as 1
:30.
3643
. On
trans
actio
n da
te, t
he w
hole
tran
sact
ion
wer
e se
ttled
up
in th
e th
ree-
mon
th p
erio
d en
ded
Mar
ch 3
1, 2
014.
Not
e 2:
Th
e bo
ok v
alue
and
sale
s pric
e of
the
loan
tran
sact
ion
wer
e U
S$4,
991.
71 th
ousa
nd a
nd U
S$28
,049
.15
thou
sand
, res
pect
ivel
y. T
he c
urre
ncy
exch
ange
rate
of t
he B
ank
was
1:3
0.36
43.
Not
e 3:
Th
e bo
ok v
alue
and
sale
s pric
e of
the
loan
tran
sact
ion
wer
e A
UD
$2,7
16.2
9 th
ousa
nd a
nd A
UD
$2,9
87.5
4 th
ousa
nd, r
espe
ctiv
ely.
The
cur
renc
y ex
chan
ge ra
te o
f the
Ban
k w
as 1
:27.
2985
.
(B)
Sale
of n
on-p
erfo
rmin
g lo
ans e
xcee
ding
NT$
1 bi
llion
(exc
ludi
ng sa
le to
rela
ted
parti
es):
Cou
nter
party
MA
CQ
UA
RIE
BA
NK
LIM
ITED
Tr
ansa
ctio
n da
te: 2
013.
12.2
3 U
NIT
: In
NT
Thou
sand
Dol
lars
Lo
an c
ompo
nent
Lo
an a
mou
nt(N
ote
1)
Car
ryin
g am
ount
A
lloca
tion
of sa
le p
rice(
Not
e 2)
Cor
pora
te
Secu
red
$ 1,
227,
629
$ 1,
105,
261
$ 1,
105,
261
Uns
ecur
ed
- -
- To
tal
$ 1,
227,
629
$ 1,
105,
261
$ 1,
105,
261
Not
e 1:
The
loan
am
ount
is th
e am
ount
that
a b
uyer
may
cla
im f
rom
the
cred
itor,
incl
udin
g th
e su
m o
f ba
lanc
e of
disp
osal
on
non-
perfo
rmin
g lo
an (
book
val
ue b
efor
e de
duct
ion
of a
llow
ance
for
do
ubtfu
l deb
t) an
d w
ritte
n-of
f bad
deb
t.
Not
e 2:
Allo
catio
n of
selli
ng p
rice
refe
rs to
gro
ss se
lling
pric
e th
at is
allo
cate
d by
the
bank
acc
ordi
ng to
the
eval
uatio
n of
reco
vera
ble
amou
nt o
f var
ious
loan
s upo
n di
spos
al.
G.
Info
rmat
ion
on a
nd c
ateg
orie
s of s
ecur
itize
d as
sets
whi
ch a
re a
ppro
ved
by th
e au
thor
ity p
ursu
ant t
o Fi
nanc
ial A
sset
Sec
uriti
zatio
n A
ct o
r the
Rea
l Esta
te S
ecur
itiza
tion
Act
: Non
e.
H.
Oth
er m
ater
ial t
rans
actio
n ite
ms w
hich
wer
e si
gnifi
cant
to th
e us
ers o
f the
fina
ncia
l sta
tem
ents
: Non
e.
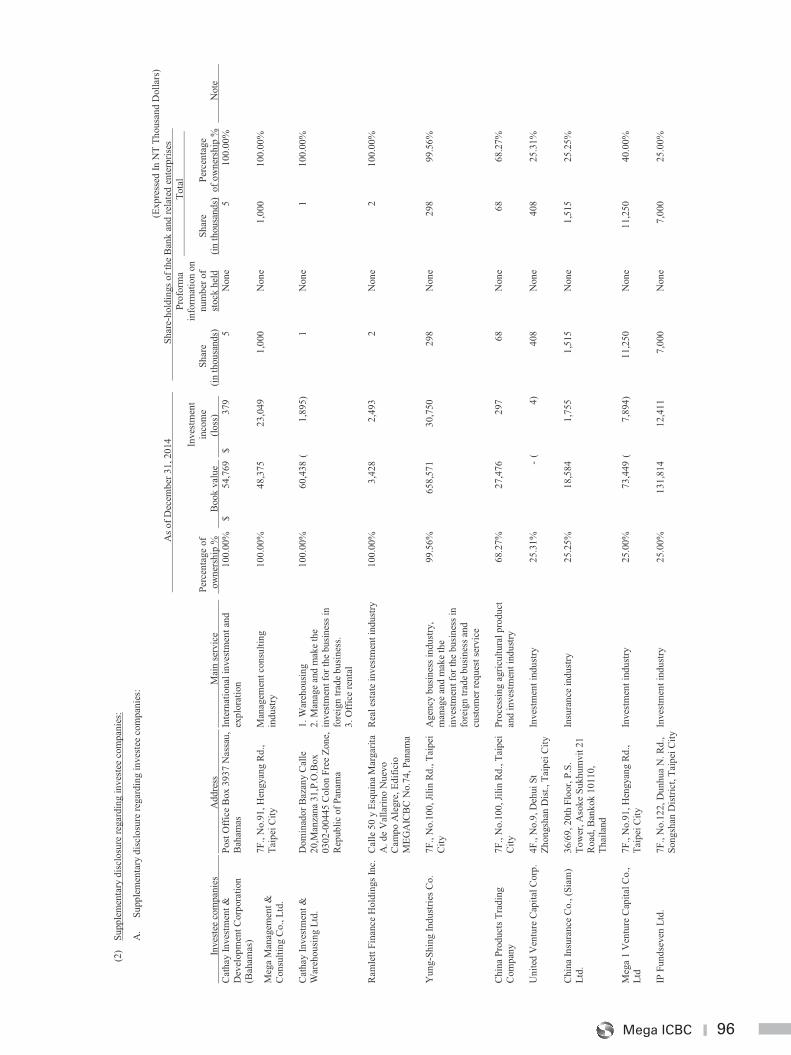
96Mega ICBC
96
(2)
Supp
lem
enta
ry d
iscl
osur
e re
gard
ing
inve
stee
com
pani
es:
A.
Supp
lem
enta
ry d
iscl
osur
e re
gard
ing
inve
stee
com
pani
es:
(Exp
ress
ed In
NT
Thou
sand
Dol
lars
)
A
s of D
ecem
ber 3
1, 2
014
Shar
e-ho
ldin
gs o
f the
Ban
k an
d re
late
d en
terp
rises
Perc
enta
ge o
f o
wne
rshi
p %
Boo
k va
lue
Inve
stm
ent
inco
me
(lo
ss)
Shar
e (in
thou
sand
s)
Prof
orm
a in
form
atio
n on
nu
mbe
r of
stoc
k he
ld
To
tal
In
vest
ee c
ompa
nies
Add
ress
Mai
n se
rvic
e
Sh
are
(in th
ousa
nds)
Pe
rcen
tage
of
ow
ners
hip
%
Not
e C
atha
y In
vest
men
t &
Dev
elop
men
t Cor
pora
tion
(Bah
amas
)
Post
Offi
ce B
ox 3
937
Nas
sau,
B
aham
as
Inte
rnat
iona
l inv
estm
ent a
nd
expl
orat
ion
100.
00%
$
54,7
69
$ 37
9
5 N
one
5 10
0.00
%
Meg
a M
anag
emen
t &
Con
sulti
ng C
o., L
td.
7F.,
No.
91, H
engy
ang
Rd.,
Taip
ei C
ity
Man
agem
ent c
onsu
lting
in
dust
ry
100.
00%
48
,375
23
,049
1,
000
Non
e 1,
000
100.
00%
Cat
hay
Inve
stm
ent &
W
areh
ousi
ng L
td.
Dom
inad
or B
azan
y C
alle
20
,Man
zana
31,
P.O
.Box
03
02-0
0445
Col
on F
ree
Zone
, R
epub
lic o
f Pan
ama
1. W
areh
ousin
g 2.
Man
age
and
mak
e th
e in
vest
men
t for
the
busi
ness
in
fore
ign
trade
bus
ines
s. 3.
Offi
ce re
ntal
100.
00%
60
,438
(
1,89
5)
1 N
one
1 10
0.00
%
Ram
lett
Fina
nce
Hol
ding
s Inc
. C
alle
50
y Es
quin
a M
arga
rita
A. d
e V
alla
rino
Nue
vo
Cam
po A
legr
e, E
dific
io
MEG
AIC
BC
No.
74, P
anam
a
Rea
l est
ate
inve
stm
ent i
ndus
try
100.
00%
3,
428
2,
493
2
Non
e 2
100.
00%
Yun
g-Sh
ing
Indu
strie
s Co.
7F
., N
o.10
0, Ji
lin R
d., T
aipe
i C
ity
Age
ncy
busi
ness
indu
stry
, m
anag
e an
d m
ake
the
inve
stm
ent f
or th
e bu
sine
ss in
fo
reig
n tra
de b
usin
ess a
nd
custo
mer
requ
est s
ervi
ce
99.5
6%
658,
571
30
,750
29
8 N
one
298
99.5
6%
Chi
na P
rodu
cts T
radi
ng
Com
pany
7F
., N
o.10
0, Ji
lin R
d., T
aipe
i C
ity
Proc
essi
ng a
gric
ultu
ral p
rodu
ct
and
inve
stm
ent i
ndus
try
68.2
7%
27,4
76
297
68
N
one
68
68.2
7%
Uni
ted
Ven
ture
Cap
ital C
orp.
4F
., N
o.9,
Deh
ui S
t Zh
ongs
han
Dist
., Ta
ipei
City
In
vest
men
t ind
ustry
25
.31%
- (
4)
408
Non
e 40
8 25
.31%
Chi
na In
sura
nce
Co.
, (Si
am)
Ltd.
36
/69,
20t
h Fl
oor,
P.S.
To
wer
, Aso
ke S
ukhu
mvi
t 21
Roa
d, B
anko
k 10
110,
Th
aila
nd
Insu
ranc
e in
dust
ry
25.2
5%
18,5
84
1,
755
1,
515
Non
e 1,
515
25.2
5%
Meg
a 1
Ven
ture
Cap
ital C
o.,
Ltd
7F.,
No.
91, H
engy
ang
Rd.,
Taip
ei C
ity
Inve
stm
ent i
ndus
try
25.0
0%
73,4
49 (
7,
894)
11
,250
N
one
11,2
50
40.0
0%
IP F
unds
even
Ltd
. 7F
., N
o.12
2, D
unhu
a N
. Rd.
, So
ngsh
an D
istri
ct, T
aipe
i City
Inve
stm
ent i
ndus
try
25.0
0%
131,
814
12
,411
7,
000
Non
e 7,
000
25.0
0%
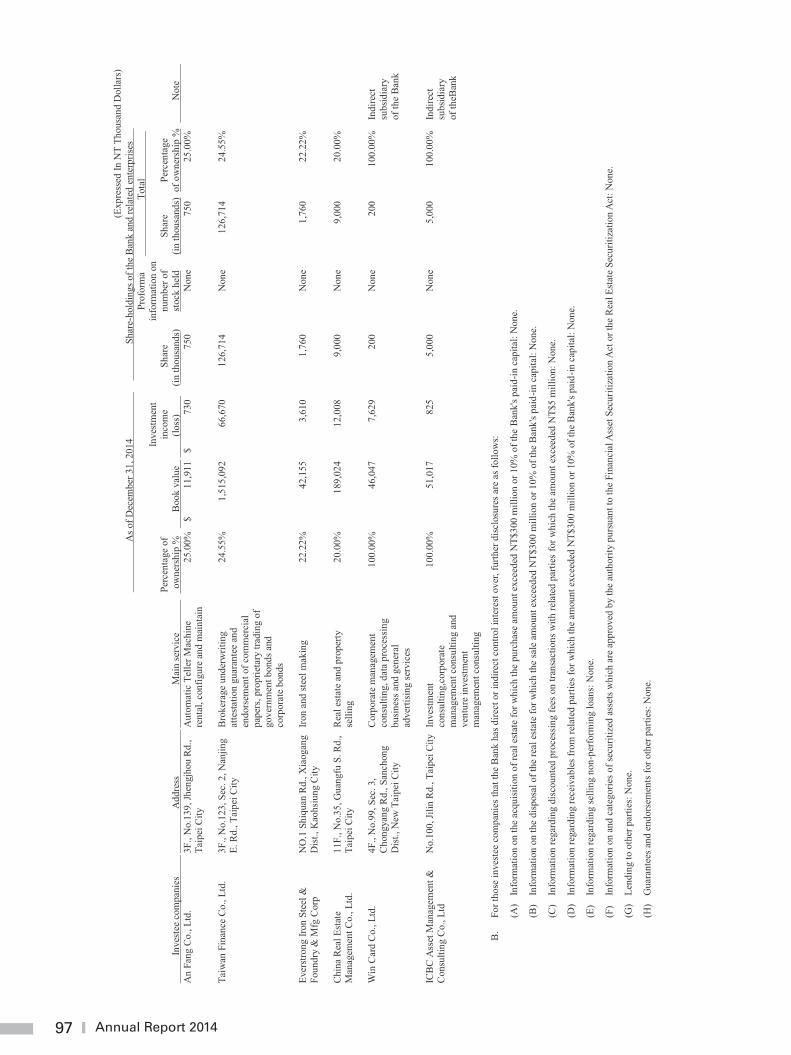
97 Annual Report 2014
97
(Exp
ress
ed In
NT
Thou
sand
Dol
lars
)
A
s of D
ecem
ber 3
1, 2
014
Shar
e-ho
ldin
gs o
f the
Ban
k an
d re
late
d en
terp
rises
Perc
enta
ge o
f o
wne
rshi
p %
Boo
k va
lue
Inve
stm
ent
inco
me
(lo
ss)
Shar
e (in
thou
sand
s)
Prof
orm
a in
form
atio
n on
nu
mbe
r of
stoc
k he
ld
To
tal
In
vest
ee c
ompa
nies
Add
ress
Mai
n se
rvic
e
Sh
are
(in th
ousa
nds)
Pe
rcen
tage
of
ow
ners
hip
%
Not
e A
n Fa
ng C
o., L
td.
3F.,
No.
139,
Jhen
gjho
u Rd
., Ta
ipei
City
A
utom
atic
Tel
ler M
achi
ne
rent
al, c
onfig
ure
and
mai
ntai
n 25
.00%
$
11
,911
$
730
75
0 N
one
750
25.0
0%
Taiw
an F
inan
ce C
o., L
td.
3F.,
No.
123,
Sec
. 2, N
anjin
g E.
Rd.
, Tai
pei C
ity
Bro
kera
ge u
nder
writ
ing
atte
statio
n gu
aran
tee
and
endo
rsem
ent o
f com
mer
cial
pa
pers
, pro
prie
tary
trad
ing
of
gove
rnm
ent b
onds
and
co
rpor
ate
bond
s
24.5
5%
1,51
5,09
2
66,6
70
12
6,71
4 N
one
126,
714
24.5
5%
Ever
stro
ng Ir
on S
teel
&
Foun
dry
& M
fg C
orp
NO
.1 S
hiqu
an R
d., X
iaog
ang
Dis
t., K
aohs
iung
City
Iro
n an
d ste
el m
akin
g 22
.22%
42
,155
3,61
0
1,76
0 N
one
1,76
0 22
.22%
Chi
na R
eal E
stat
e M
anag
emen
t Co.
, Ltd
. 11
F., N
o.35
, Gua
ngfu
S. R
d.,
Taip
ei C
ity
Rea
l est
ate
and
prop
erty
se
lling
20
.00%
18
9,02
4
12,0
08
9,
000
Non
e 9,
000
20.0
0%
Win
Car
d C
o., L
td.
4F.,
No.
99, S
ec. 3
, C
hong
yang
Rd.
, San
chon
g D
ist.,
New
Tai
pei C
ity
Cor
pora
te m
anag
emen
t co
nsul
ting,
dat
a pr
oces
sing
bu
sines
s and
gen
eral
ad
verti
sing
serv
ices
100.
00%
46
,047
7,62
9
200
Non
e 20
0 10
0.00
%
Indi
rect
su
bsid
iary
of
the
Ban
k
ICB
C A
sset
Man
agem
ent &
C
onsu
lting
Co.
, Ltd
N
o.10
0, Ji
lin R
d., T
aipe
i City
Inv
estm
ent
cons
ultin
g,co
rpor
ate
man
agem
ent c
onsu
lting
and
ve
ntur
e in
vest
men
t m
anag
emen
t con
sulti
ng
100.
00%
51
,017
825
5,
000
Non
e 5,
000
100.
00%
In
dire
ct
subs
idia
ry
of th
eBan
k
B.
For t
hose
inve
stee
com
pani
es th
at th
e B
ank
has d
irect
or i
ndire
ct c
ontro
l int
eres
t ove
r, fu
rther
disc
losu
res a
re a
s fol
low
s:
(A)
Info
rmat
ion
on th
e ac
quisi
tion
of re
al e
stat
e fo
r whi
ch th
e pu
rcha
se a
mou
nt e
xcee
ded
NT$
300
mill
ion
or 1
0% o
f the
Ban
k's p
aid-
in c
apita
l: N
one.
(B)
Info
rmat
ion
on th
e di
spos
al o
f the
real
est
ate
for w
hich
the
sale
am
ount
exc
eede
d N
T$30
0 m
illio
n or
10%
of t
he B
ank'
s pai
d-in
cap
ital:
Non
e.
(C)
Info
rmat
ion
rega
rdin
g di
scou
nted
pro
cess
ing
fees
on
trans
actio
ns w
ith re
late
d pa
rties
for w
hich
the
amou
nt e
xcee
ded
NT$
5 m
illio
n: N
one.
(D)
Info
rmat
ion
rega
rdin
g re
ceiv
able
s fro
m re
late
d pa
rties
for w
hich
the
amou
nt e
xcee
ded
NT$
300
mill
ion
or 1
0% o
f the
Ban
k's p
aid-
in c
apita
l: N
one.
(E)
Info
rmat
ion
rega
rdin
g se
lling
non
-per
form
ing
loan
s: N
one.
(F)
Info
rmat
ion
on a
nd c
ateg
orie
s of s
ecur
itize
d as
sets
whi
ch a
re a
ppro
ved
by th
e au
thor
ity p
ursu
ant t
o th
e Fi
nanc
ial A
sset
Sec
uriti
zatio
n A
ct o
r the
Rea
l Est
ate
Secu
ritiz
atio
n A
ct: N
one.
(G)
Lend
ing
to o
ther
par
ties:
Non
e.
(H)
Gua
rant
ees a
nd e
ndor
sem
ents
for o
ther
par
ties:
Non
e.
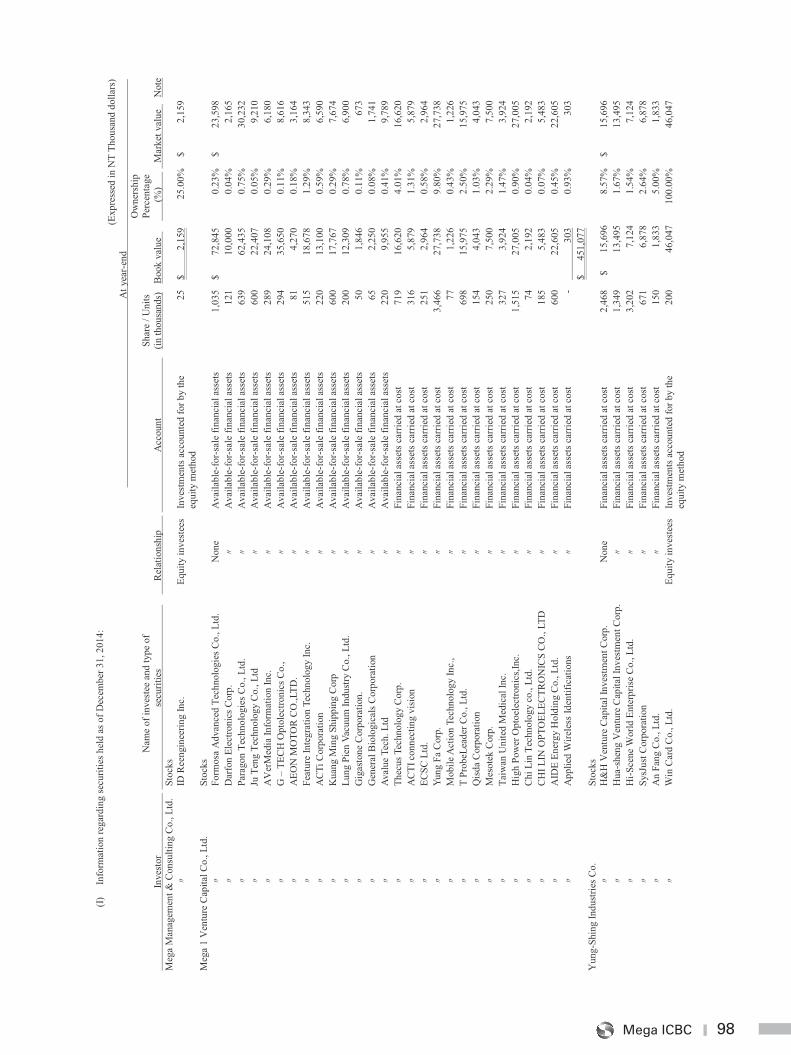
98Mega ICBC
98
(I)
Info
rmat
ion
rega
rdin
g se
curit
ies h
eld
as o
f Dec
embe
r 31,
201
4:
(E
xpre
ssed
in N
T Th
ousa
nd d
olla
rs)
A
t yea
r-en
d
In
vest
or
N
ame
of in
vest
ee a
nd ty
pe o
f
secu
ritie
s
R
elat
ions
hip
A
ccou
nt
Sh
are
/ Uni
ts
(in th
ousa
nds)
B
ook
valu
e
Ow
ners
hip
Perc
enta
ge
(%
)
Mar
ket v
alue
N
ote
Meg
a M
anag
emen
t & C
onsu
lting
Co.
, Ltd
. St
ocks
ID
Ree
ngin
eerin
g In
c.
Equi
ty in
vest
ees
Inve
stm
ents
acc
ount
ed fo
r by
the
equi
ty m
etho
d 25
$
2,15
9 25
.00%
$
2,
159
Meg
a 1
Ven
ture
Cap
ital C
o., L
td.
Stoc
ks
Fo
rmos
a A
dvan
ced
Tech
nolo
gies
Co.
, Ltd
. N
one
Ava
ilabl
e-fo
r-sa
le fi
nanc
ial a
sset
s 1,
035
$ 7
2,84
5 0.
23%
$
23,5
98
D
arfo
n El
ectro
nics
Cor
p.
A
vaila
ble-
for-
sale
fina
ncia
l ass
ets
121
10,0
00
0.04
%
2,16
5
Pa
rago
n Te
chno
logi
es C
o., L
td.
A
vaila
ble-
for-
sale
fina
ncia
l ass
ets
639
62,4
35
0.75
%
30,2
32
Ju
Ten
g Te
chno
logy
Co.
, Ltd
Ava
ilabl
e-fo
r-sa
le fi
nanc
ial a
sset
s 60
0 22
,407
0.
05%
9,
210
AV
erM
edia
Info
rmat
ion
Inc.
Ava
ilabl
e-fo
r-sa
le fi
nanc
ial a
sset
s 28
9 24
,108
0.
29%
6,
180
G –
TEC
H O
ptol
ectro
nics
Co.
,
Ava
ilabl
e-fo
r-sa
le fi
nanc
ial a
sset
s 29
4 35
,650
0.
11%
8,
616
AEO
N M
OTO
R C
O.,L
TD.
A
vaila
ble-
for-
sale
fina
ncia
l ass
ets
81
4,27
0 0.
18%
3,
164
Feat
ure
Inte
grat
ion
Tech
nolo
gy In
c.
A
vaila
ble-
for-
sale
fina
ncia
l ass
ets
515
18,6
78
1.29
%
8,34
3
A
CTi
Cor
pora
tion
A
vaila
ble-
for-
sale
fina
ncia
l ass
ets
220
13,1
00
0.59
%
6,59
0
K
uang
Min
g Sh
ippi
ng C
orp
A
vaila
ble-
for-
sale
fina
ncia
l ass
ets
600
17,7
67
0.29
%
7,67
4
Lu
ng P
ien
Vacu
um In
dustr
y C
o., L
td.
A
vaila
ble-
for-
sale
fina
ncia
l ass
ets
200
12,3
09
0.78
%
6,90
0
G
igas
tone
Cor
pora
tion.
Ava
ilabl
e-fo
r-sa
le fi
nanc
ial a
sset
s 50
1,
846
0.11
%
673
Gen
eral
Bio
logi
cals
Cor
pora
tion
A
vaila
ble-
for-
sale
fina
ncia
l ass
ets
65
2,25
0 0.
08%
1,
741
Aval
ue T
ech.
Ltd
Ava
ilabl
e-fo
r-sa
le fi
nanc
ial a
sset
s 22
0 9,
955
0.41
%
9,78
9
Th
ecus
Tec
hnol
ogy
Cor
p.
Fi
nanc
ial a
sset
s car
ried
at c
ost
719
16,6
20
4.01
%
16,6
20
A
CTI
con
nect
ing
visi
on
Fi
nanc
ial a
sset
s car
ried
at c
ost
316
5,87
9 1.
31%
5,
879
ECSC
Ltd
.
Fina
ncia
l ass
ets c
arrie
d at
cos
t 25
1 2,
964
0.58
%
2,96
4
Yu
ng F
a C
orp.
Fina
ncia
l ass
ets c
arrie
d at
cos
t 3,
466
27,7
38
9.80
%
27,7
38
M
obile
Act
ion
Tech
nolo
gy In
c.,
Fi
nanc
ial a
sset
s car
ried
at c
ost
77
1,
226
0.43
%
1,
226
T Pr
obeL
eade
r Co.
, Ltd
.
Fina
ncia
l ass
ets c
arrie
d at
cos
t 69
8 15
,975
2.
50%
15
,975
Q
isda
Cor
pora
tion
Fi
nanc
ial a
sset
s car
ried
at c
ost
154
4,04
3 1.
03%
4,
043
Mes
otek
Cor
p.
Fi
nanc
ial a
sset
s car
ried
at c
ost
250
7,50
0 2.
29%
7,
500
Taiw
an U
nite
d M
edic
al In
c.
Fi
nanc
ial a
sset
s car
ried
at c
ost
327
3,92
4 1.
47%
3,
924
Hig
h Po
wer
Opt
oele
ctro
nics
,Inc.
Fina
ncia
l ass
ets c
arrie
d at
cos
t 1,
515
27,0
05
0.90
%
27,0
05
C
hi L
in T
echn
olog
y co
., Lt
d.
Fi
nanc
ial a
sset
s car
ried
at c
ost
74
2,19
2 0.
04%
2,
192
CH
I LIN
OPT
OEL
ECTR
ON
ICS
CO
., LT
D
Fi
nanc
ial a
sset
s car
ried
at c
ost
185
5,48
3 0.
07%
5,
483
AID
E En
ergy
Hol
ding
Co.
, Ltd
.
Fina
ncia
l ass
ets c
arrie
d at
cos
t 60
0 22
,605
0.
45%
22
,605
App
lied
Wire
less
Iden
tific
atio
ns
Fi
nanc
ial a
sset
s car
ried
at c
ost
-
303
0.93
%
30
3
$
45
1,07
7
Y
ung-
Shin
g In
dustr
ies C
o.
Stoc
ks
H
&H
Ven
ture
Cap
ital I
nves
tmen
t Cor
p.
Non
e Fi
nanc
ial a
sset
s car
ried
at c
ost
2,46
8 $
15
,696
8.
57%
$
15,6
96
H
ua-s
heng
Ven
ture
Cap
ital I
nves
tmen
t Cor
p.
Fi
nanc
ial a
sset
s car
ried
at c
ost
1,34
9
13,4
95
1.67
%
13,4
95
H
i-Sce
ne W
orld
Ent
erpr
ise
Co.
, Ltd
.
Fina
ncia
l ass
ets c
arrie
d at
cos
t 3,
202
7,
124
1.
54%
7,
124
SysJ
ust C
orpo
ratio
n
Fina
ncia
l ass
ets c
arrie
d at
cos
t 67
1
6,
878
2.
64%
6,8
78
A
n Fa
ng C
o., L
td.
Fi
nanc
ial a
sset
s car
ried
at c
ost
150
1,
833
5.
00%
1,
833
Win
Car
d C
o., L
td.
Equi
ty in
vest
ees
Inve
stm
ents
acc
ount
ed fo
r by
the
equi
ty m
etho
d 20
0
46,0
47
100.
00%
46
,047
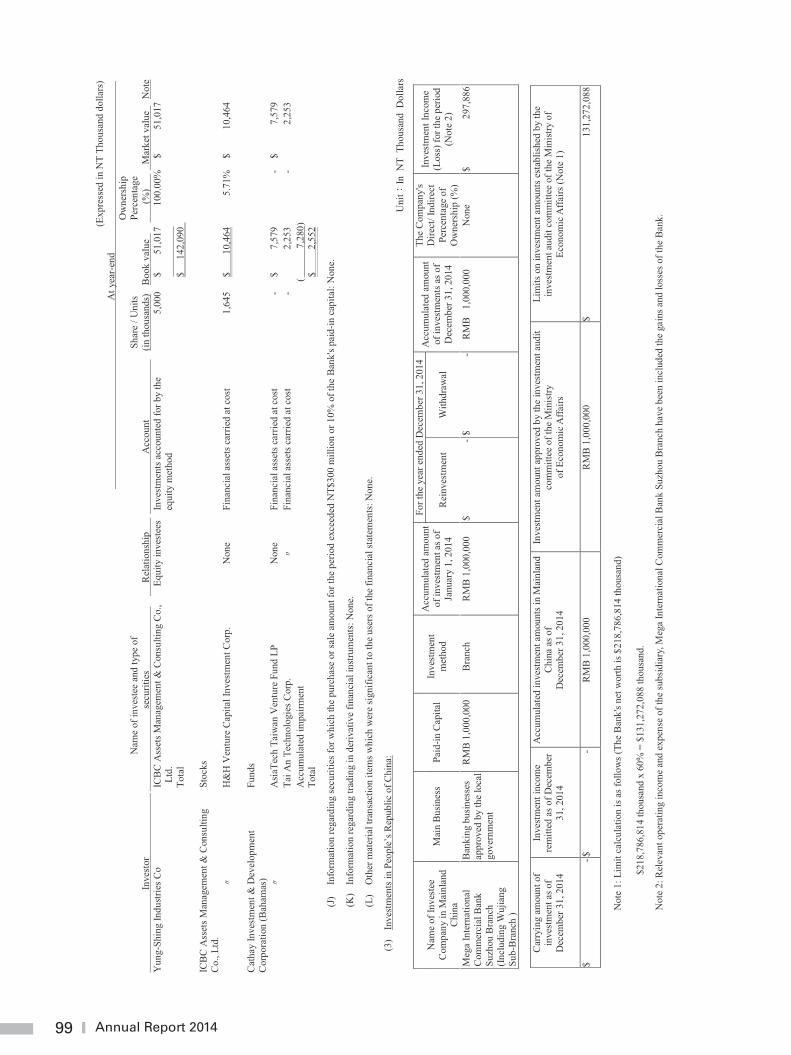
99 Annual Report 2014
99
(E
xpre
ssed
in N
T Th
ousa
nd d
olla
rs)
A
t yea
r-en
d
In
vest
or
Nam
e of
inve
stee
and
type
of
se
curit
ies
Rel
atio
nshi
p
Acc
ount
Shar
e / U
nits
(in
thou
sand
s)
Boo
k va
lue
Ow
ners
hip
Perc
enta
ge
(%
)
Mar
ket v
alue
N
ote
Yun
g-Sh
ing
Indu
strie
s Co
ICB
C A
sset
s Man
agem
ent &
Con
sulti
ng C
o.,
Ltd.
Eq
uity
inve
stee
s In
vest
men
ts a
ccou
nted
for b
y th
e eq
uity
met
hod
5,00
0 $
51
,017
10
0.00
%
$ 51
,017
To
tal
$
14
2,09
0
ICB
C A
sset
s Man
agem
ent &
Con
sulti
ng
Co.
, Ltd
. St
ocks
H
&H
Ven
ture
Cap
ital I
nves
tmen
t Cor
p.
Non
e Fi
nanc
ial a
sset
s car
ried
at c
ost
1,64
5 $
10
,464
5.
71%
$
10,4
64
Cat
hay
Inve
stm
ent &
Dev
elop
men
t C
orpo
ratio
n (B
aham
as)
Fund
s
A
siaT
ech
Taiw
an V
entu
re F
und
LP
Non
e Fi
nanc
ial a
sset
s car
ried
at c
ost
- $
7,
579
-
$ 7,
579
Tai A
n Te
chno
logi
es C
orp.
Fina
ncia
l ass
ets c
arrie
d at
cos
t -
2,
253
-
2,25
3
A
ccum
ulat
ed im
pairm
ent
(
7,28
0 )
To
tal
$
2,
552
(J)
Info
rmat
ion
rega
rdin
g se
curit
ies f
or w
hich
the
purc
hase
or s
ale
amou
nt fo
r the
per
iod
exce
eded
NT$
300
mill
ion
or 1
0% o
f the
Ban
k's p
aid-
in c
apita
l: N
one.
(K)
Info
rmat
ion
rega
rdin
g tra
ding
in d
eriv
ativ
e fin
anci
al in
strum
ents
: Non
e.
(L)
Oth
er m
ater
ial t
rans
actio
n ite
ms w
hich
wer
e si
gnifi
cant
to th
e us
ers o
f the
fina
ncia
l sta
tem
ents
: Non
e.
(3)
Inve
stm
ents
in P
eopl
e’s R
epub
lic o
f Chi
na:
U
nit
In N
T Th
ousa
nd D
olla
rs
N
ame
of In
vest
ee
Com
pany
in M
ainl
and
Chi
na
Mai
n Bu
sine
ss
Paid
-in C
apita
l In
vest
men
t m
etho
d
Acc
umul
ated
am
ount
of
inve
stm
ent a
s of
Janu
ary
1, 2
014
For t
he y
ear e
nded
Dec
embe
r 31,
201
4 A
ccum
ulat
ed a
mou
nt
of in
vest
men
ts as
of
Dec
embe
r 31,
201
4
The
Com
pany
's D
irect
/ Ind
irect
Pe
rcen
tage
of
Ow
ners
hip
(%)
Inve
stm
ent I
ncom
e (L
oss)
for t
he p
erio
d (N
ote
2)
Rei
nves
tmen
t W
ithdr
awal
Meg
a In
tern
atio
nal
Com
mer
cial
Ban
k Su
zhou
Bra
nch
(Incl
udin
g W
ujia
ng
Sub-
Bra
nch
)
Ban
king
bus
ines
ses
appr
oved
by
the
loca
l go
vern
men
t
RM
B 1
,000
,000
B
ranc
h R
MB
1,0
00,0
00
$ -
$ -
RM
B 1,
000,
000
Non
e $
297,
886
C
arry
ing
amou
nt o
f in
vest
men
t as o
f D
ecem
ber 3
1, 2
014
Inve
stm
ent i
ncom
e re
mitt
ed a
s of D
ecem
ber
31, 2
014
Acc
umul
ated
inve
stm
ent a
mou
nts i
n M
ainl
and
Chi
na a
s of
Dec
embe
r 31,
201
4
Inve
stm
ent a
mou
nt a
ppro
ved
by th
e in
vest
men
t aud
it co
mm
ittee
of t
he M
inis
try
of E
cono
mic
Affa
irs
Lim
its o
n in
vest
men
t am
ount
s est
ablis
hed
by th
e in
vest
men
t aud
it co
mm
ittee
of t
he M
inist
ry o
f Ec
onom
ic A
ffairs
(Not
e 1)
$ - $
-
RM
B 1
,000
,000
R
MB
1,0
00,0
00
$
131,
272,
088
Not
e 1:
Lim
it ca
lcul
atio
n is
as f
ollo
ws (
The
Ban
k's n
et w
orth
is $
218,
786,
814
thou
sand
)
$218
,786
,814
thou
sand
x 6
0% =
$13
1,27
2,08
8 th
ousa
nd.
Not
e 2:
Rel
evan
t ope
ratin
g in
com
e an
d ex
pens
e of
the
subs
idia
ry, M
ega
Inte
rnat
iona
l Com
mer
cial
Ban
k Su
zhou
Bra
nch
have
bee
n in
clud
ed th
e ga
ins a
nd lo
sses
of t
he B
ank.
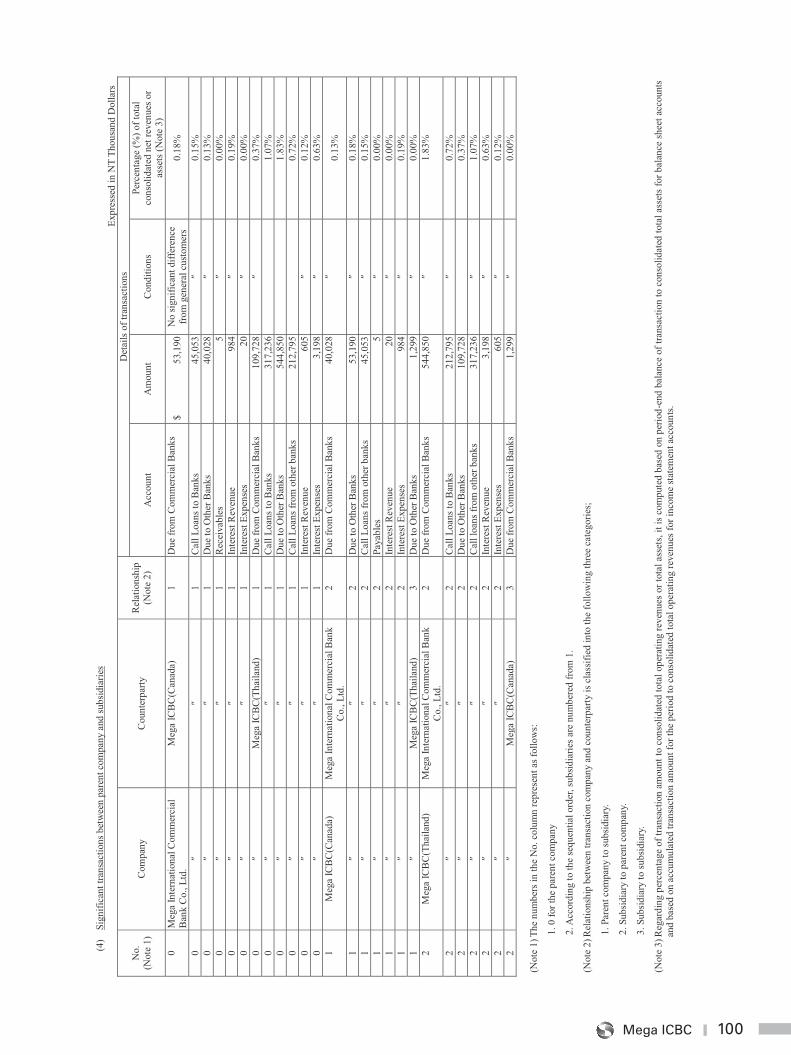
100Mega ICBC
100
(4)
Sign
ifica
nt tr
ansa
ctio
ns b
etw
een
pare
nt c
ompa
ny a
nd su
bsid
iarie
s Ex
pres
sed
in N
T Th
ousa
nd D
olla
rs
No.
(N
ote
1)
Com
pany
C
ount
erpa
rty
Rel
atio
nshi
p (N
ote
2)
Det
ails
of t
rans
actio
ns
Acc
ount
A
mou
nt
Con
ditio
ns
Perc
enta
ge (%
) of t
otal
co
nsol
idat
ed n
et re
venu
es o
r as
sets
(Not
e 3)
0
Meg
a In
tern
atio
nal C
omm
erci
al
Ban
k C
o., L
td.
Meg
a IC
BC
(Can
ada)
1
Due
from
Com
mer
cial
Ban
ks
$ 53
,190
N
o si
gnifi
cant
diff
eren
ce
from
gen
eral
cus
tom
ers
0.18
%
0 ″
″ 1
Cal
l Loa
ns to
Ban
ks
45,0
53
″ 0.
15%
0
″ ″
1 D
ue to
Oth
er B
anks
40
,028
″
0.13
%
0 ″
″ 1
Rec
eiva
bles
5
″ 0.
00%
0
″ ″
1 In
tere
st R
even
ue
984
″ 0.
19%
0
″ ″
1 In
tere
st E
xpen
ses
20
″ 0.
00%
0
″ M
ega
ICB
C(T
haila
nd)
1 D
ue fr
om C
omm
erci
al B
anks
10
9,72
8 ″
0.37
%
0 ″
″ 1
Cal
l Loa
ns to
Ban
ks
317,
236
1.
07%
0
″ ″
1 D
ue to
Oth
er B
anks
54
4,85
0
1.83
%
0 ″
″ 1
Cal
l Loa
ns fr
om o
ther
ban
ks
212,
795
0.
72%
0
″ ″
1 In
tere
st R
even
ue
605
″ 0.
12%
0
″ ″
1 In
tere
st E
xpen
ses
3,19
8 ″
0.63
%
1 M
ega
ICB
C(C
anad
a)
Meg
a In
tern
atio
nal C
omm
erci
al B
ank
Co.
, Ltd
. 2
Due
from
Com
mer
cial
Ban
ks
40,0
28
″ 0.
13%
1 ″
″ 2
Due
to O
ther
Ban
ks
53,1
90
″ 0.
18%
1
″ ″
2 C
all L
oans
from
oth
er b
anks
45
,053
″
0.15
%
1 ″
″ 2
Paya
bles
5
″ 0.
00%
1
″ ″
2 In
tere
st R
even
ue
20
″ 0.
00%
1
″ ″
2 In
tere
st E
xpen
ses
984
″
0.19
%
1 ″
Meg
a IC
BC
(Tha
iland
) 3
Due
to O
ther
Ban
ks
1,29
9 ″
0.00
%
2 M
ega
ICB
C(T
haila
nd)
Meg
a In
tern
atio
nal C
omm
erci
al B
ank
Co.
, Ltd
. 2
Due
from
Com
mer
cial
Ban
ks
544,
850
″ 1.
83%
2 ″
″ 2
Cal
l Loa
ns to
Ban
ks
212,
795
″ 0.
72%
2
″ ″
2 D
ue to
Oth
er B
anks
10
9,72
8
0.37
%
2 ″
″ 2
Cal
l loa
ns fr
om o
ther
ban
ks
317,
236
″ 1.
07%
2
″ ″
2 In
tere
st R
even
ue
3,19
8 ″
0.63
%
2 ″
″ 2
Inte
rest
Exp
ense
s 60
5 ″
0.12
%
2 ″
Meg
a IC
BC
(Can
ada)
3
Due
from
Com
mer
cial
Ban
ks
1,2
99
″ 0.
00%
(N
ote
1) T
he n
umbe
rs in
the
No.
col
umn
repr
esen
t as f
ollo
ws:
1. 0
for t
he p
aren
t com
pany
2. A
ccor
ding
to th
e se
quen
tial o
rder
, sub
sidia
ries a
re n
umbe
red
from
1.
(Not
e 2)
Rel
atio
nshi
p be
twee
n tra
nsac
tion
com
pany
and
cou
nter
party
is c
lass
ified
into
the
follo
win
g th
ree
cate
gorie
s;
1. P
aren
t com
pany
to su
bsid
iary
.
2. S
ubsi
diar
y to
par
ent c
ompa
ny.
3. S
ubsi
diar
y to
subs
idia
ry.
(Not
e 3)
Reg
ardi
ng p
erce
ntag
e of
tran
sact
ion
amou
nt to
con
solid
ated
tota
l ope
ratin
g re
venu
es o
r tot
al a
sset
s, it
is c
ompu
ted
base
d on
per
iod-
end
bala
nce
of tr
ansa
ctio
n to
con
solid
ated
tota
l ass
ets f
or b
alan
ce sh
eet a
ccou
nts
and
base
d on
acc
umul
ated
tran
sact
ion
amou
nt fo
r the
per
iod
to c
onso
lidat
ed to
tal o
pera
ting
reve
nues
for i
ncom
e sta
tem
ent a
ccou
nts.
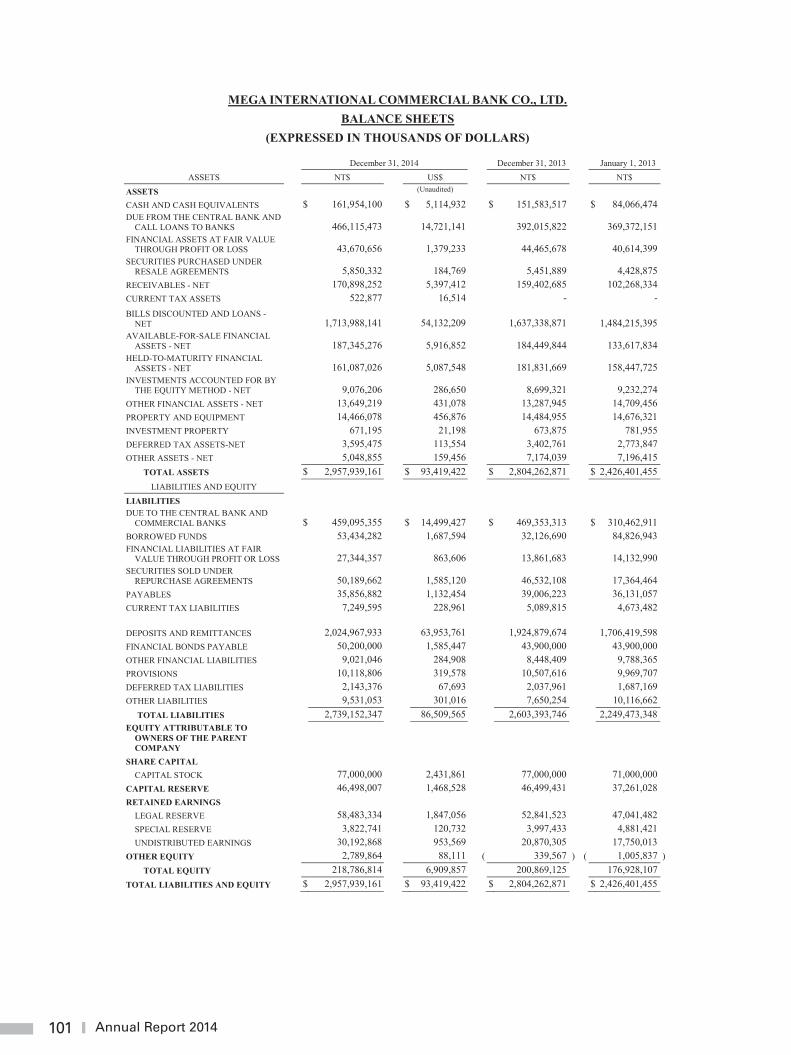
101 Annual Report 2014
101
MEGA INTERNATIONAL COMMERCIAL BANK CO., LTD. BALANCE SHEETS
(EXPRESSED IN THOUSANDS OF DOLLARS)
December 31, 2014 December 31, 2013 January 1, 2013 ASSETS NT$ US$ NT$ NT$
ASSETS (Unaudited) CASH AND CASH EQUIVALENTS $ 161,954,100 $ 5,114,932 $ 151,583,517 $ 84,066,474 DUE FROM THE CENTRAL BANK AND
CALL LOANS TO BANKS 466,115,473 14,721,141 392,015,822 369,372,151 FINANCIAL ASSETS AT FAIR VALUE
THROUGH PROFIT OR LOSS 43,670,656 1,379,233 44,465,678 40,614,399 SECURITIES PURCHASED UNDER
RESALE AGREEMENTS 5,850,332 184,769 5,451,889 4,428,875 RECEIVABLES - NET 170,898,252 5,397,412 159,402,685 102,268,334 CURRENT TAX ASSETS 522,877 16,514 - - BILLS DISCOUNTED AND LOANS -
NET 1,713,988,141 54,132,209 1,637,338,871
1,484,215,395 AVAILABLE-FOR-SALE FINANCIAL
ASSETS - NET 187,345,276 5,916,852 184,449,844 133,617,834 HELD-TO-MATURITY FINANCIAL
ASSETS - NET 161,087,026 5,087,548 181,831,669 158,447,725 INVESTMENTS ACCOUNTED FOR BY
THE EQUITY METHOD - NET 9,076,206 286,650 8,699,321 9,232,274 OTHER FINANCIAL ASSETS - NET 13,649,219 431,078 13,287,945 14,709,456 PROPERTY AND EQUIPMENT 14,466,078 456,876 14,484,955 14,676,321 INVESTMENT PROPERTY 671,195 21,198 673,875 781,955 DEFERRED TAX ASSETS-NET 3,595,475 113,554 3,402,761 2,773,847 OTHER ASSETS - NET 5,048,855 159,456 7,174,039 7,196,415
TOTAL ASSETS $ 2,957,939,161 $ 93,419,422 $ 2,804,262,871 $ 2,426,401,455 LIABILITIES AND EQUITY
LIABILITIES DUE TO THE CENTRAL BANK AND
COMMERCIAL BANKS $ 459,095,355 $ 14,499,427 $ 469,353,313 $ 310,462,911 BORROWED FUNDS 53,434,282 1,687,594 32,126,690 84,826,943 FINANCIAL LIABILITIES AT FAIR
VALUE THROUGH PROFIT OR LOSS 27,344,357 863,606 13,861,683 14,132,990 SECURITIES SOLD UNDER
REPURCHASE AGREEMENTS 50,189,662 1,585,120 46,532,108 17,364,464 PAYABLES 35,856,882 1,132,454 39,006,223 36,131,057 CURRENT TAX LIABILITIES 7,249,595 228,961 5,089,815 4,673,482
DEPOSITS AND REMITTANCES 2,024,967,933 63,953,761 1,924,879,674
1,706,419,598 FINANCIAL BONDS PAYABLE 50,200,000 1,585,447 43,900,000 43,900,000 OTHER FINANCIAL LIABILITIES 9,021,046 284,908 8,448,409 9,788,365 PROVISIONS 10,118,806 319,578 10,507,616 9,969,707 DEFERRED TAX LIABILITIES 2,143,376 67,693 2,037,961 1,687,169 OTHER LIABILITIES 9,531,053 301,016 7,650,254 10,116,662
TOTAL LIABILITIES 2,739,152,347 86,509,565 2,603,393,746 2,249,473,348 EQUITY ATTRIBUTABLE TO
OWNERS OF THE PARENT COMPANY
SHARE CAPITAL CAPITAL STOCK 77,000,000 2,431,861 77,000,000 71,000,000
CAPITAL RESERVE 46,498,007 1,468,528 46,499,431 37,261,028 RETAINED EARNINGS
LEGAL RESERVE 58,483,334 1,847,056 52,841,523 47,041,482 SPECIAL RESERVE 3,822,741 120,732 3,997,433 4,881,421 UNDISTRIBUTED EARNINGS 30,192,868 953,569 20,870,305 17,750,013
OTHER EQUITY 2,789,864 88,111 ( 339,567 ) ( 1,005,837 ) TOTAL EQUITY 218,786,814 6,909,857 200,869,125 176,928,107
TOTAL LIABILITIES AND EQUITY $ 2,957,939,161 $ 93,419,422 $ 2,804,262,871 $ 2,426,401,455
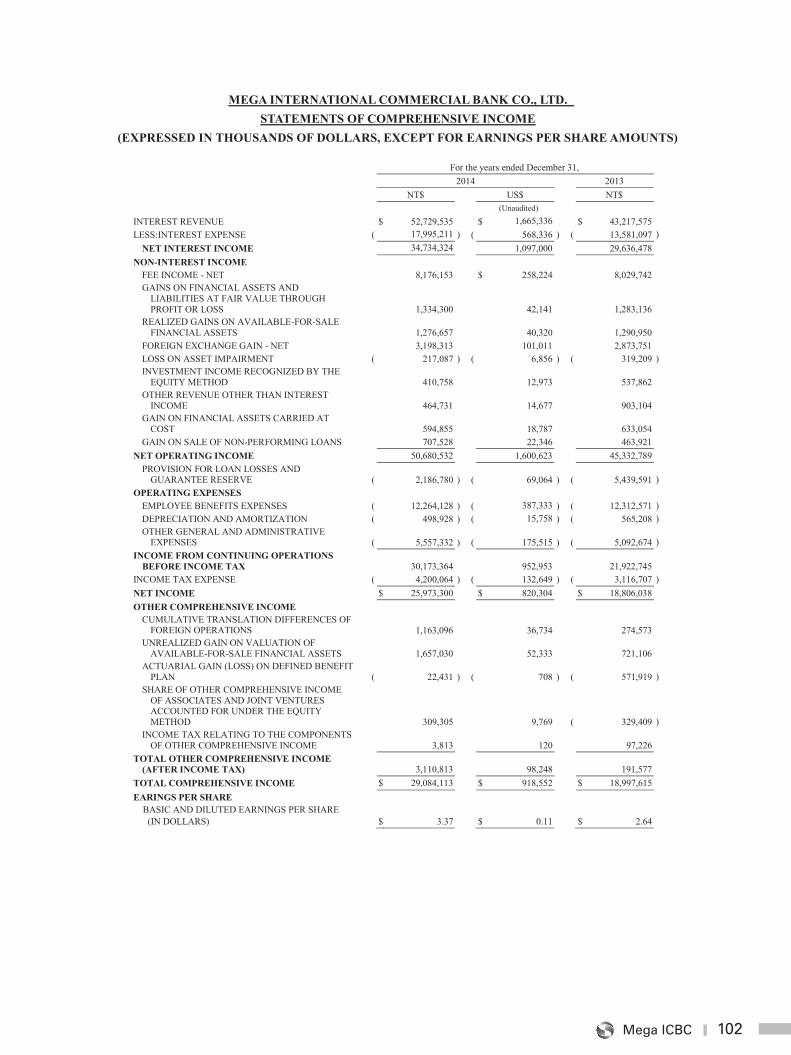
102Mega ICBC
102
MEGA INTERNATIONAL COMMERCIAL BANK CO., LTD. STATEMENTS OF COMPREHENSIVE INCOME
(EXPRESSED IN THOUSANDS OF DOLLARS, EXCEPT FOR EARNINGS PER SHARE AMOUNTS)
For the years ended December 31, 2014 2013 NT$ US$ NT$ (Unaudited) INTEREST REVENUE $ 52,729,535 $ 1,665,336 $ 43,217,575 LESS:INTEREST EXPENSE ( 17,995,211 ) ( 568,336 ) ( 13,581,097 )
NET INTEREST INCOME 34,734,324 1,097,000 29,636,478 NON-INTEREST INCOME
FEE INCOME - NET 8,176,153 $ 258,224 8,029,742 GAINS ON FINANCIAL ASSETS AND
LIABILITIES AT FAIR VALUE THROUGH PROFIT OR LOSS 1,334,300 42,141 1,283,136
REALIZED GAINS ON AVAILABLE-FOR-SALE FINANCIAL ASSETS 1,276,657 40,320 1,290,950
FOREIGN EXCHANGE GAIN - NET 3,198,313 101,011 2,873,751 LOSS ON ASSET IMPAIRMENT ( 217,087 ) ( 6,856 ) ( 319,209 ) INVESTMENT INCOME RECOGNIZED BY THE
EQUITY METHOD 410,758 12,973 537,862 OTHER REVENUE OTHER THAN INTEREST
INCOME 464,731 14,677 903,104 GAIN ON FINANCIAL ASSETS CARRIED AT
COST 594,855 18,787 633,054 GAIN ON SALE OF NON-PERFORMING LOANS 707,528 22,346 463,921
NET OPERATING INCOME 50,680,532 1,600,623 45,332,789 PROVISION FOR LOAN LOSSES AND
GUARANTEE RESERVE ( 2,186,780 ) ( 69,064 ) ( 5,439,591 ) OPERATING EXPENSES
EMPLOYEE BENEFITS EXPENSES ( 12,264,128 ) ( 387,333 ) ( 12,312,571 ) DEPRECIATION AND AMORTIZATION ( 498,928 ) ( 15,758 ) ( 565,208 ) OTHER GENERAL AND ADMINISTRATIVE
EXPENSES ( 5,557,332 ) ( 175,515 ) ( 5,092,674 ) INCOME FROM CONTINUING OPERATIONS
BEFORE INCOME TAX 30,173,364 952,953 21,922,745 INCOME TAX EXPENSE ( 4,200,064 ) ( 132,649 ) ( 3,116,707 ) NET INCOME $ 25,973,300 $ 820,304 $ 18,806,038 OTHER COMPREHENSIVE INCOME
CUMULATIVE TRANSLATION DIFFERENCES OF FOREIGN OPERATIONS 1,163,096 36,734 274,573
UNREALIZED GAIN ON VALUATION OF AVAILABLE-FOR-SALE FINANCIAL ASSETS 1,657,030 52,333 721,106
ACTUARIAL GAIN (LOSS) ON DEFINED BENEFIT PLAN ( 22,431 ) ( 708 ) ( 571,919 )
SHARE OF OTHER COMPREHENSIVE INCOME OF ASSOCIATES AND JOINT VENTURES ACCOUNTED FOR UNDER THE EQUITY METHOD 309,305 9,769 ( 329,409 )
INCOME TAX RELATING TO THE COMPONENTS OF OTHER COMPREHENSIVE INCOME 3,813 120 97,226
TOTAL OTHER COMPREHENSIVE INCOME (AFTER INCOME TAX) 3,110,813 98,248 191,577
TOTAL COMPREHENSIVE INCOME $ 29,084,113 $ 918,552 $ 18,997,615 EARINGS PER SHARE
BASIC AND DILUTED EARNINGS PER SHARE (IN DOLLARS) $ 3.37 $ 0.11 $ 2.64
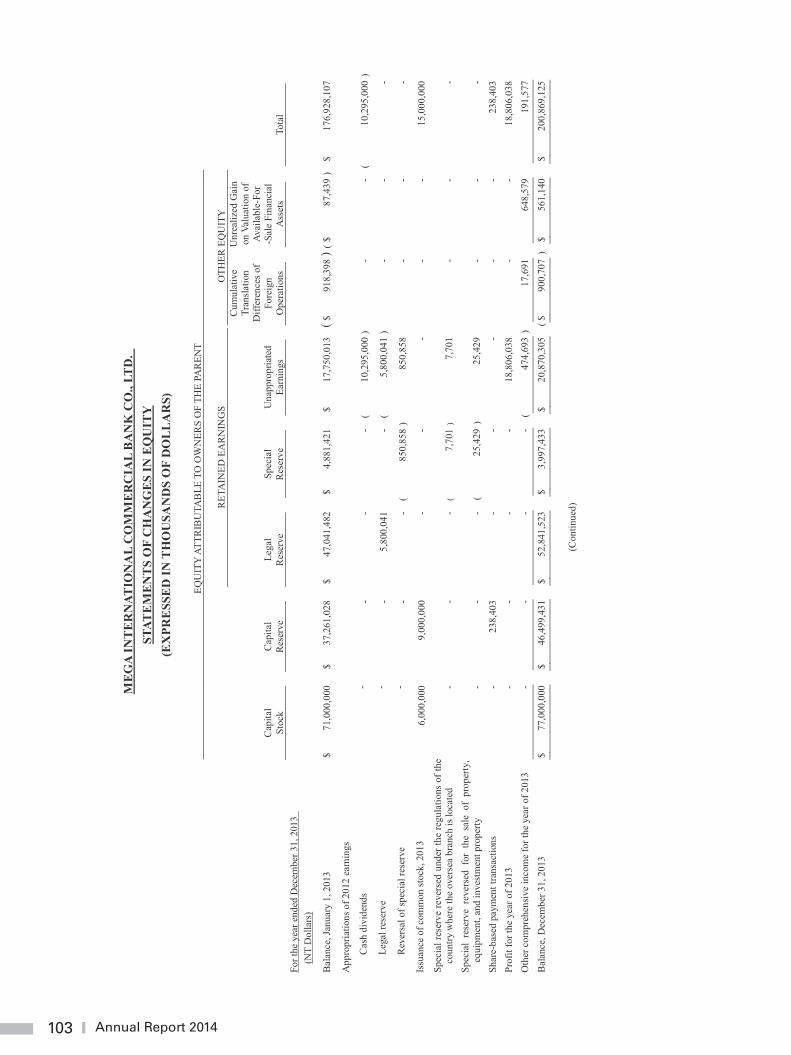
103 Annual Report 2014
103
ME
GA
INT
ER
NAT
ION
AL
CO
MM
ER
CIA
L B
AN
K C
O.,
LTD
.
STAT
EM
EN
TS
OF
CH
AN
GE
S IN
EQ
UIT
Y
(EX
PRE
SSE
D IN
TH
OU
SAN
DS
OF
DO
LL
AR
S)
EQU
ITY
ATT
RIB
UTA
BLE
TO
OW
NER
S O
F TH
E PA
REN
T
R
ETA
INED
EA
RN
ING
S
OTH
ER E
QU
ITY
C
apita
l St
ock
Cap
ital
Res
erve
Le
gal
Res
erve
Sp
ecia
l R
eser
ve
Una
ppro
pria
ted
Earn
ings
Cum
ulat
ive
Tran
slat
ion
Diff
eren
ces o
f Fo
reig
n O
pera
tions
Unr
ealiz
ed G
ain
on V
alua
tion
of
Avai
labl
e-Fo
r -S
ale
Fina
ncia
l A
sset
s
To
tal
Fo
r the
yea
r end
ed D
ecem
ber 3
1, 2
013
(N
T D
olla
rs)
Bal
ance
, Jan
uary
1, 2
013
$ 71
,000
,000
$
3
7,26
1,02
8
$ 47
,041
,482
$
4
,881
,421
$
17
,750
,013
( $
91
8,39
8 ) (
$ 87
,439
) $
1
76,9
28,1
07
App
ropr
iatio
ns o
f 201
2 ea
rnin
gs
Cas
h di
vide
nds
-
-
-
-
(
10,2
95,0
00 )
-
- (
10
,295
,000
)
Lega
l res
erve
-
-
5,80
0,04
1
-
(
5,
800,
041
)
-
-
-
Rev
ersa
l of s
peci
al re
serv
e
-
-
- (
85
0,85
8 )
8
50,8
58
-
-
-
Issu
ance
of c
omm
on st
ock,
201
3
6,0
00,0
00
9
,000
,000
-
-
-
-
-
1
5,00
0,00
0
Spec
ial r
eser
ve re
vers
ed u
nder
the
regu
latio
ns o
f the
co
untry
whe
re th
e ov
erse
a br
anch
is lo
cate
d
-
-
- (
7,70
1 )
7,70
1
-
-
-
Sp
ecia
l re
serv
e re
vers
ed f
or t
he s
ale
of p
rope
rty,
equi
pmen
t, an
d in
vest
men
t pro
perty
-
-
-
(
25
,429
)
25,
429
-
-
-
Shar
e-ba
sed
paym
ent t
rans
actio
ns
-
23
8,40
3
-
-
-
-
-
23
8,40
3
Prof
it fo
r the
yea
r of 2
013
-
-
-
-
18,
806,
038
-
-
1
8,80
6,03
8
Oth
er c
ompr
ehen
sive
inco
me
for t
he y
ear o
f 201
3
-
-
-
-
(
47
4,69
3 )
17,6
91
6
48,5
79
1
91,5
77
B
alan
ce, D
ecem
ber 3
1, 2
013
$ 77
,000
,000
$
46,
499,
431
$
52
,841
,523
$
3,99
7,43
3
$
20,8
70,3
05
( $
90
0,70
7 )
$
561
,140
$
200,
869,
125
(C
ontin
ued)
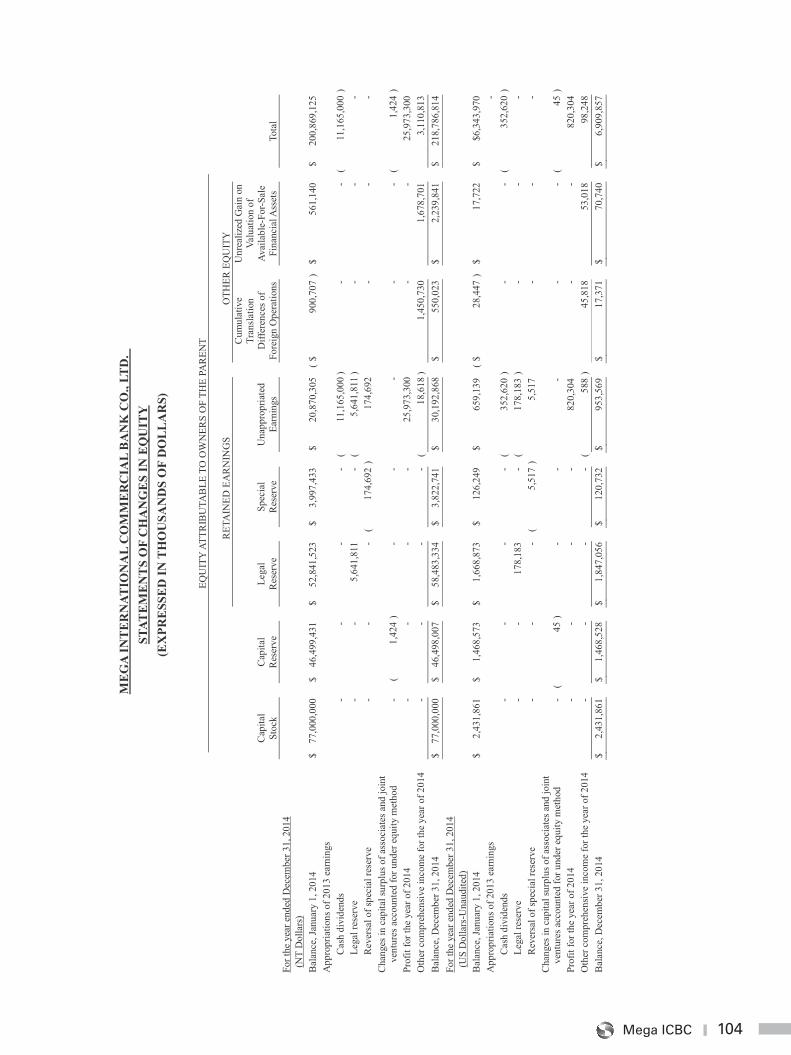
104Mega ICBC
104
ME
GA
INT
ER
NAT
ION
AL
CO
MM
ER
CIA
L B
AN
K C
O.,
LTD
.
STAT
EM
EN
TS
OF
CH
AN
GE
S IN
EQ
UIT
Y
(EX
PRE
SSE
D IN
TH
OU
SAN
DS
OF
DO
LL
AR
S)
EQU
ITY
ATT
RIB
UTA
BLE
TO
OW
NER
S O
F TH
E PA
REN
T
RET
AIN
ED E
AR
NIN
GS
O
THER
EQ
UIT
Y
C
apita
l St
ock
Cap
ital
Res
erve
Le
gal
Res
erve
Sp
ecia
l R
eser
ve
Una
ppro
pria
ted
Earn
ings
Cum
ulat
ive
Tran
slat
ion
Diff
eren
ces o
f Fo
reig
n O
pera
tions
U
nrea
lized
Gai
n on
Va
luat
ion
of
Avai
labl
e-Fo
r-Sal
e Fi
nanc
ial A
sset
s
To
tal
Fo
r the
yea
r end
ed D
ecem
ber 3
1, 2
014
(NT
Dol
lars
)
Bal
ance
, Jan
uary
1, 2
014
$ 77
,000
,000
$
46
,499
,431
$
52
,841
,523
$
3
,997
,433
$
2
0,87
0,30
5 (
$
900,
707
) $
56
1,14
0
$
200
,869
,125
A
ppro
pria
tions
of 2
013
earn
ings
Cas
h di
vide
nds
-
-
-
-
(
11
,165
,000
)
-
-
(
11,1
65,0
00 )
Lega
l res
erve
-
-
5,64
1,81
1
-
(
5,64
1,81
1 )
-
-
-
Rev
ersa
l of s
peci
al re
serv
e
-
-
- (
17
4,69
2 )
174
,692
-
-
-
C
hang
es in
cap
ital s
urpl
us o
f ass
ocia
tes a
nd jo
int
vent
ures
acc
ount
ed fo
r und
er e
quity
met
hod
-
(
1,
424
)
-
-
-
-
-
(
1,42
4 )
Prof
it fo
r the
yea
r of 2
014
-
-
-
-
2
5,97
3,30
0
-
-
25,
973,
300
O
ther
com
preh
ensiv
e in
com
e fo
r the
yea
r of 2
014
-
-
-
-
(
18
,618
)
1
,450
,730
1
,678
,701
3
,110
,813
B
alan
ce, D
ecem
ber 3
1, 2
014
$ 77
,000
,000
$
46
,498
,007
$
58
,483
,334
$
3,
822,
741
$
30
,192
,868
$
5
50,0
23
$
2,2
39,8
41
$
218
,786
,814
Fo
r the
yea
r end
ed D
ecem
ber 3
1, 2
014
(U
S D
olla
rs-U
naud
ited)
Bal
ance
, Jan
uary
1, 2
014
$ 2,
431,
861
$
1
,468
,573
$
1,
668,
873
$
1
26,2
49
$
659,
139
( $
28
,447
) $
17
,722
$
$
6,34
3,97
0
App
ropr
iatio
ns o
f 201
3 ea
rnin
gs
-
Cas
h di
vide
nds
-
-
-
-
(
35
2,62
0 )
-
- (
35
2,62
0 )
Lega
l res
erve
-
-
178,
183
-
(
17
8,18
3 )
-
-
-
Rev
ersa
l of s
peci
al re
serv
e
-
-
- (
5,
517
)
5
,517
-
-
-
C
hang
es in
cap
ital s
urpl
us o
f ass
ocia
tes a
nd jo
int
vent
ures
acc
ount
ed fo
r und
er e
quity
met
hod
-
(
45 )
-
-
-
-
-
(
45 )
Pr
ofit
for t
he y
ear o
f 201
4
-
-
-
-
82
0,30
4
-
-
820
,304
O
ther
com
preh
ensiv
e in
com
e fo
r the
yea
r of 2
014
-
-
-
-
(
58
8 )
45,
818
5
3,01
8
98,
248
B
alan
ce, D
ecem
ber 3
1, 2
014
$ 2,
431,
861
$
1
,468
,528
$
1,
847,
056
$
12
0,73
2 $
95
3,56
9
$
17,3
71
$
70,
740
$
6,90
9,85
7
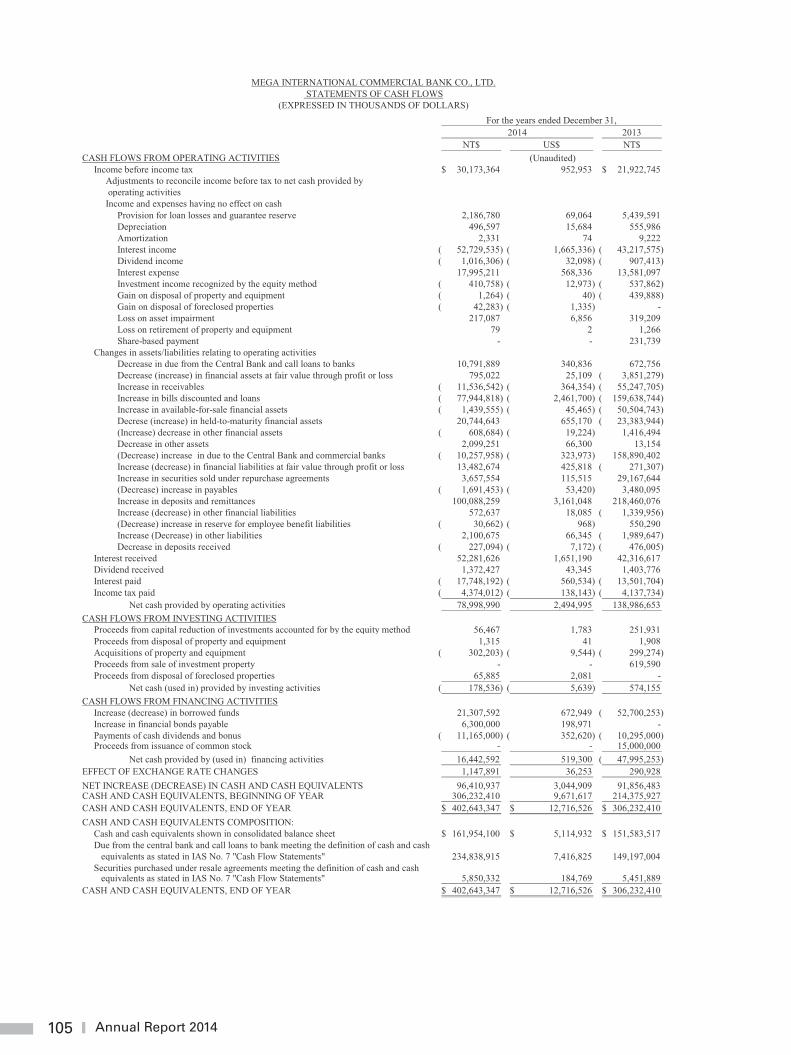
105 Annual Report 2014
2013NT$ US$ NT$
CASH FLOWS FROM OPERATING ACTIVITIES (Unaudited)Income before income tax 30,173,364$ 952,953 21,922,745$
Adjustments to reconcile income before tax to net cash provided by operating activitiesIncome and expenses having no effect on cash
Provision for loan losses and guarantee reserve 2,186,780 69,064 5,439,591 Depreciation 496,597 15,684 555,986 Amortization 2,331 74 9,222 Interest income 52,729,535)( 1,665,336)( 43,217,575)( Dividend income 1,016,306)( 32,098)( 907,413)( Interest expense 17,995,211 568,336 13,581,097 Investment income recognized by the equity method 410,758)( 12,973)( 537,862)( Gain on disposal of property and equipment 1,264)( 40)( 439,888)( Gain on disposal of foreclosed properties 42,283)( 1,335)( - Loss on asset impairment 217,087 6,856 319,209 Loss on retirement of property and equipment 79 2 1,266 Share-based payment - - 231,739
Changes in assets/liabilities relating to operating activitiesDecrease in due from the Central Bank and call loans to banks 10,791,889 340,836 672,756 Decrease (increase) in financial assets at fair value through profit or loss 795,022 25,109 3,851,279)( Increase in receivables 11,536,542)( 364,354)( 55,247,705)( Increase in bills discounted and loans 77,944,818)( 2,461,700)( 159,638,744)( Increase in available-for-sale financial assets 1,439,555)( 45,465)( 50,504,743)( Decrese (increase) in held-to-maturity financial assets 20,744,643 655,170 23,383,944)( (Increase) decrease in other financial assets 608,684)( 19,224)( 1,416,494 Decrease in other assets 2,099,251 66,300 13,154 (Decrease) increase in due to the Central Bank and commercial banks 10,257,958)( 323,973)( 158,890,402 Increase (decrease) in financial liabilities at fair value through profit or loss 13,482,674 425,818 271,307)( Increase in securities sold under repurchase agreements 3,657,554 115,515 29,167,644 (Decrease) increase in payables 1,691,453)( 53,420)( 3,480,095 Increase in deposits and remittances 100,088,259 3,161,048 218,460,076 Increase (decrease) in other financial liabilities 572,637 18,085 1,339,956)( (Decrease) increase in reserve for employee benefit liabilities 30,662)( 968)( 550,290 Increase (Decrease) in other liabilities 2,100,675 66,345 1,989,647)( Decrease in deposits received 227,094)( 7,172)( 476,005)(
Interest received 52,281,626 1,651,190 42,316,617 Dividend received 1,372,427 43,345 1,403,776 Interest paid 17,748,192)( 560,534)( 13,501,704)( Income tax paid 4,374,012)( 138,143)( 4,137,734)(
Net cash provided by operating activities 78,998,990 2,494,995 138,986,653 CASH FLOWS FROM INVESTING ACTIVITIES
Proceeds from capital reduction of investments accounted for by the equity method 56,467 1,783 251,931 Proceeds from disposal of property and equipment 1,315 41 1,908 Acquisitions of property and equipment 302,203)( 9,544)( 299,274)( Proceeds from sale of investment property - - 619,590 Proceeds from disposal of foreclosed properties 65,885 2,081 -
Net cash (used in) provided by investing activities 178,536)( 5,639)( 574,155 CASH FLOWS FROM FINANCING ACTIVITIES
Increase (decrease) in borrowed funds 21,307,592 672,949 52,700,253)( Increase in financial bonds payable 6,300,000 198,971 - Payments of cash dividends and bonus 11,165,000)( 352,620)( 10,295,000)( Proceeds from issuance of common stock - - 15,000,000
Net cash provided by (used in) financing activities 16,442,592 519,300 47,995,253)( EFFECT OF EXCHANGE RATE CHANGES 1,147,891 36,253 290,928 NET INCREASE (DECREASE) IN CASH AND CASH EQUIVALENTS 96,410,937 3,044,909 91,856,483 CASH AND CASH EQUIVALENTS, BEGINNING OF YEAR 306,232,410 9,671,617 214,375,927 CASH AND CASH EQUIVALENTS, END OF YEAR 402,643,347$ 12,716,526$ 306,232,410$ CASH AND CASH EQUIVALENTS COMPOSITION:
Cash and cash equivalents shown in consolidated balance sheet 161,954,100$ 5,114,932$ 151,583,517$ Due from the central bank and call loans to bank meeting the definition of cash and cash equivalents as stated in IAS No. 7 "Cash Flow Statements" 234,838,915 7,416,825 149,197,004 Securities purchased under resale agreements meeting the definition of cash and cash equivalents as stated in IAS No. 7 "Cash Flow Statements" 5,850,332 184,769 5,451,889
CASH AND CASH EQUIVALENTS, END OF YEAR 402,643,347$ 12,716,526$ 306,232,410$
2014For the years ended December 31,
MEGA INTERNATIONAL COMMERCIAL BANK CO., LTD. STATEMENTS OF CASH FLOWS
(EXPRESSED IN THOUSANDS OF DOLLARS)
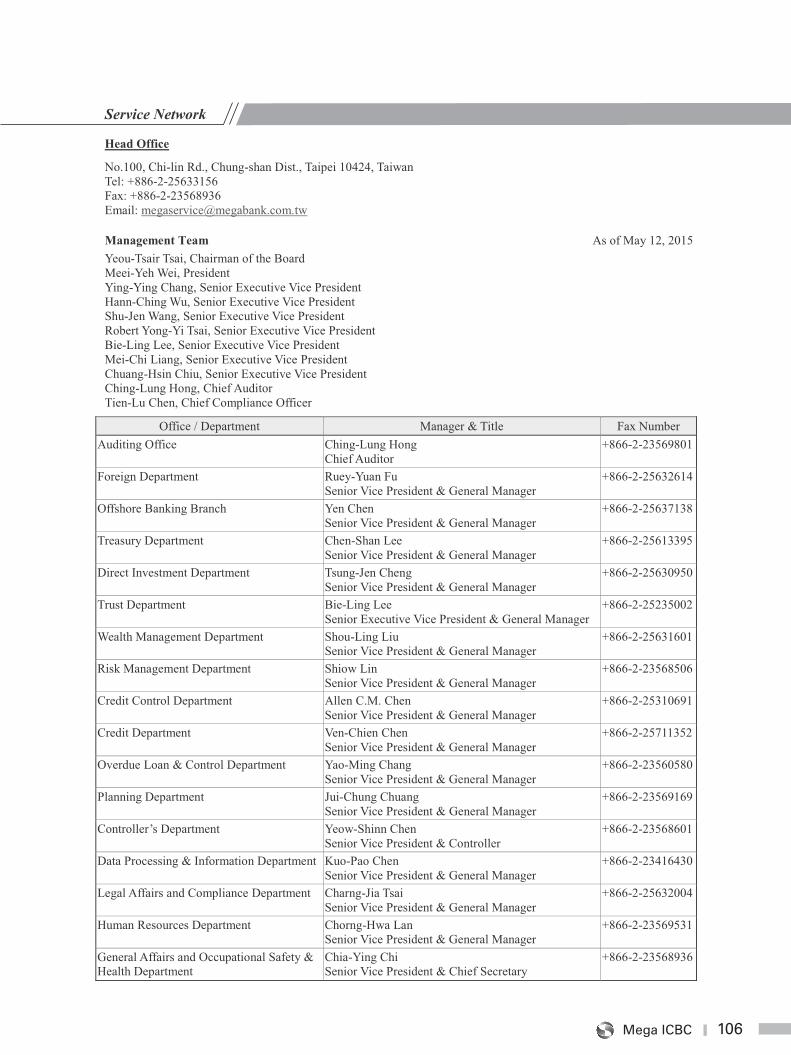
106Mega ICBC
106
Service Network
Head Office
No.100, Chi-lin Rd., Chung-shan Dist., Taipei 10424, Taiwan Tel: +886-2-25633156 Fax: +886-2-23568936 Email: [email protected]
Management Team As of May 12, 2015 Yeou-Tsair Tsai, Chairman of the Board Meei-Yeh Wei, President Ying-Ying Chang, Senior Executive Vice President Hann-Ching Wu, Senior Executive Vice President Shu-Jen Wang, Senior Executive Vice President Robert Yong-Yi Tsai, Senior Executive Vice President Bie-Ling Lee, Senior Executive Vice President Mei-Chi Liang, Senior Executive Vice President Chuang-Hsin Chiu, Senior Executive Vice President Ching-Lung Hong, Chief Auditor Tien-Lu Chen, Chief Compliance Officer
Office / Department Manager & Title Fax Number Auditing Office Ching-Lung Hong
Chief Auditor +866-2-23569801
Foreign Department Ruey-Yuan Fu Senior Vice President & General Manager
+866-2-25632614
Offshore Banking Branch Yen Chen Senior Vice President & General Manager
+866-2-25637138
Treasury Department Chen-Shan Lee Senior Vice President & General Manager
+866-2-25613395
Direct Investment Department Tsung-Jen Cheng Senior Vice President & General Manager
+866-2-25630950
Trust Department Bie-Ling Lee Senior Executive Vice President & General Manager
+866-2-25235002
Wealth Management Department Shou-Ling Liu Senior Vice President & General Manager
+866-2-25631601
Risk Management Department Shiow Lin Senior Vice President & General Manager
+866-2-23568506
Credit Control Department Allen C.M. Chen Senior Vice President & General Manager
+866-2-25310691
Credit Department Ven-Chien Chen Senior Vice President & General Manager
+866-2-25711352
Overdue Loan & Control Department Yao-Ming Chang Senior Vice President & General Manager
+866-2-23560580
Planning Department Jui-Chung Chuang Senior Vice President & General Manager
+866-2-23569169
Controller’s Department Yeow-Shinn Chen Senior Vice President & Controller
+866-2-23568601
Data Processing & Information Department Kuo-Pao Chen Senior Vice President & General Manager
+866-2-23416430
Legal Affairs and Compliance Department Charng-Jia Tsai Senior Vice President & General Manager
+866-2-25632004
Human Resources Department Chorng-Hwa Lan Senior Vice President & General Manager
+866-2-23569531
General Affairs and Occupational Safety & Health Department
Chia-Ying Chi Senior Vice President & Chief Secretary
+866-2-23568936
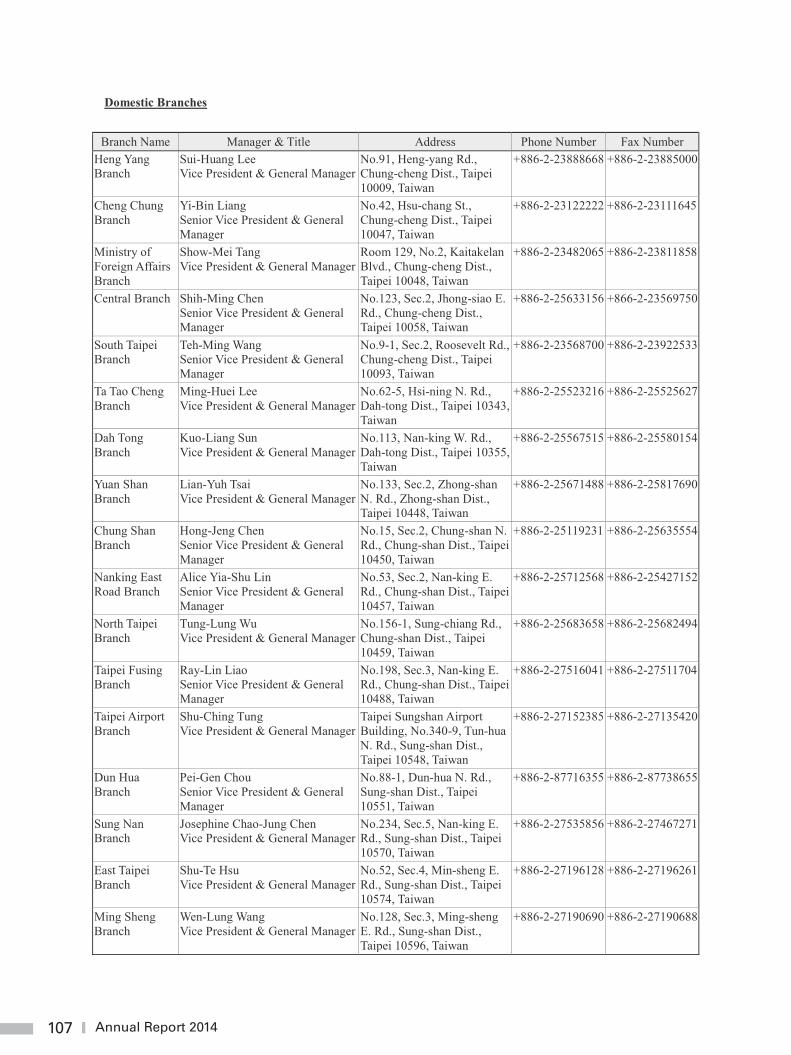
107 Annual Report 2014
107
Domestic Branches
Branch Name Manager & Title Address Phone Number Fax Number Heng Yang Branch
Sui-Huang Lee Vice President & General Manager
No.91, Heng-yang Rd., Chung-cheng Dist., Taipei 10009, Taiwan
+886-2-23888668 +886-2-23885000
Cheng Chung Branch
Yi-Bin Liang Senior Vice President & General Manager
No.42, Hsu-chang St., Chung-cheng Dist., Taipei 10047, Taiwan
+886-2-23122222 +886-2-23111645
Ministry of Foreign Affairs Branch
Show-Mei Tang Vice President & General Manager
Room 129, No.2, Kaitakelan Blvd., Chung-cheng Dist., Taipei 10048, Taiwan
+886-2-23482065 +886-2-23811858
Central Branch Shih-Ming Chen Senior Vice President & General Manager
No.123, Sec.2, Jhong-siao E. Rd., Chung-cheng Dist., Taipei 10058, Taiwan
+886-2-25633156 +866-2-23569750
South Taipei Branch
Teh-Ming Wang Senior Vice President & General Manager
No.9-1, Sec.2, Roosevelt Rd., Chung-cheng Dist., Taipei 10093, Taiwan
+886-2-23568700 +886-2-23922533
Ta Tao Cheng Branch
Ming-Huei Lee Vice President & General Manager
No.62-5, Hsi-ning N. Rd., Dah-tong Dist., Taipei 10343, Taiwan
+886-2-25523216 +886-2-25525627
Dah Tong Branch
Kuo-Liang Sun Vice President & General Manager
No.113, Nan-king W. Rd., Dah-tong Dist., Taipei 10355, Taiwan
+886-2-25567515 +886-2-25580154
Yuan Shan Branch
Lian-Yuh Tsai Vice President & General Manager
No.133, Sec.2, Zhong-shan N. Rd., Zhong-shan Dist., Taipei 10448, Taiwan
+886-2-25671488 +886-2-25817690
Chung Shan Branch
Hong-Jeng Chen Senior Vice President & General Manager
No.15, Sec.2, Chung-shan N. Rd., Chung-shan Dist., Taipei 10450, Taiwan
+886-2-25119231 +886-2-25635554
Nanking East Road Branch
Alice Yia-Shu Lin Senior Vice President & General Manager
No.53, Sec.2, Nan-king E. Rd., Chung-shan Dist., Taipei 10457, Taiwan
+886-2-25712568 +886-2-25427152
North Taipei Branch
Tung-Lung Wu Vice President & General Manager
No.156-1, Sung-chiang Rd., Chung-shan Dist., Taipei 10459, Taiwan
+886-2-25683658 +886-2-25682494
Taipei Fusing Branch
Ray-Lin Liao Senior Vice President & General Manager
No.198, Sec.3, Nan-king E. Rd., Chung-shan Dist., Taipei 10488, Taiwan
+886-2-27516041 +886-2-27511704
Taipei Airport Branch
Shu-Ching Tung Vice President & General Manager
Taipei Sungshan Airport Building, No.340-9, Tun-hua N. Rd., Sung-shan Dist., Taipei 10548, Taiwan
+886-2-27152385 +886-2-27135420
Dun Hua Branch
Pei-Gen Chou Senior Vice President & General Manager
No.88-1, Dun-hua N. Rd., Sung-shan Dist., Taipei 10551, Taiwan
+886-2-87716355 +886-2-87738655
Sung Nan Branch
Josephine Chao-Jung Chen Vice President & General Manager
No.234, Sec.5, Nan-king E. Rd., Sung-shan Dist., Taipei 10570, Taiwan
+886-2-27535856 +886-2-27467271
East Taipei Branch
Shu-Te Hsu Vice President & General Manager
No.52, Sec.4, Min-sheng E. Rd., Sung-shan Dist., Taipei 10574, Taiwan
+886-2-27196128 +886-2-27196261
Ming Sheng Branch
Wen-Lung Wang Vice President & General Manager
No.128, Sec.3, Ming-sheng E. Rd., Sung-shan Dist., Taipei 10596, Taiwan
+886-2-27190690 +886-2-27190688
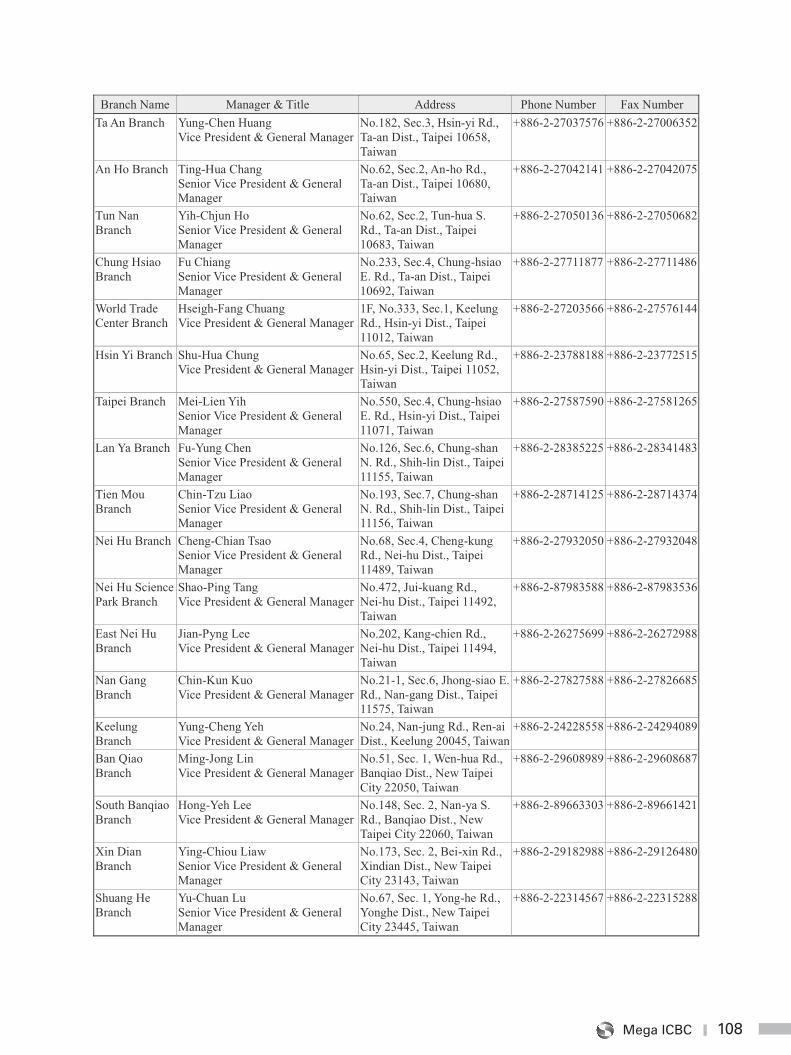
108Mega ICBC
108
Branch Name Manager & Title Address Phone Number Fax Number Ta An Branch Yung-Chen Huang
Vice President & General Manager No.182, Sec.3, Hsin-yi Rd., Ta-an Dist., Taipei 10658, Taiwan
+886-2-27037576 +886-2-27006352
An Ho Branch Ting-Hua Chang Senior Vice President & General Manager
No.62, Sec.2, An-ho Rd., Ta-an Dist., Taipei 10680, Taiwan
+886-2-27042141 +886-2-27042075
Tun Nan Branch
Yih-Chjun Ho Senior Vice President & General Manager
No.62, Sec.2, Tun-hua S. Rd., Ta-an Dist., Taipei 10683, Taiwan
+886-2-27050136 +886-2-27050682
Chung Hsiao Branch
Fu Chiang Senior Vice President & General Manager
No.233, Sec.4, Chung-hsiao E. Rd., Ta-an Dist., Taipei 10692, Taiwan
+886-2-27711877 +886-2-27711486
World Trade Center Branch
Hseigh-Fang Chuang Vice President & General Manager
1F, No.333, Sec.1, Keelung Rd., Hsin-yi Dist., Taipei 11012, Taiwan
+886-2-27203566 +886-2-27576144
Hsin Yi Branch Shu-Hua Chung Vice President & General Manager
No.65, Sec.2, Keelung Rd., Hsin-yi Dist., Taipei 11052, Taiwan
+886-2-23788188 +886-2-23772515
Taipei Branch Mei-Lien Yih Senior Vice President & General Manager
No.550, Sec.4, Chung-hsiao E. Rd., Hsin-yi Dist., Taipei 11071, Taiwan
+886-2-27587590 +886-2-27581265
Lan Ya Branch Fu-Yung Chen Senior Vice President & General Manager
No.126, Sec.6, Chung-shan N. Rd., Shih-lin Dist., Taipei 11155, Taiwan
+886-2-28385225 +886-2-28341483
Tien Mou Branch
Chin-Tzu Liao Senior Vice President & General Manager
No.193, Sec.7, Chung-shan N. Rd., Shih-lin Dist., Taipei 11156, Taiwan
+886-2-28714125 +886-2-28714374
Nei Hu Branch Cheng-Chian Tsao Senior Vice President & General Manager
No.68, Sec.4, Cheng-kung Rd., Nei-hu Dist., Taipei 11489, Taiwan
+886-2-27932050 +886-2-27932048
Nei Hu Science Park Branch
Shao-Ping Tang Vice President & General Manager
No.472, Jui-kuang Rd., Nei-hu Dist., Taipei 11492, Taiwan
+886-2-87983588 +886-2-87983536
East Nei Hu Branch
Jian-Pyng Lee Vice President & General Manager
No.202, Kang-chien Rd., Nei-hu Dist., Taipei 11494, Taiwan
+886-2-26275699 +886-2-26272988
Nan Gang Branch
Chin-Kun Kuo Vice President & General Manager
No.21-1, Sec.6, Jhong-siao E. Rd., Nan-gang Dist., Taipei 11575, Taiwan
+886-2-27827588 +886-2-27826685
Keelung Branch
Yung-Cheng Yeh Vice President & General Manager
No.24, Nan-jung Rd., Ren-ai Dist., Keelung 20045, Taiwan
+886-2-24228558 +886-2-24294089
Ban Qiao Branch
Ming-Jong Lin Vice President & General Manager
No.51, Sec. 1, Wen-hua Rd., Banqiao Dist., New Taipei City 22050, Taiwan
+886-2-29608989 +886-2-29608687
South Banqiao Branch
Hong-Yeh Lee Vice President & General Manager
No.148, Sec. 2, Nan-ya S. Rd., Banqiao Dist., New Taipei City 22060, Taiwan
+886-2-89663303 +886-2-89661421
Xin Dian Branch
Ying-Chiou Liaw Senior Vice President & General Manager
No.173, Sec. 2, Bei-xin Rd., Xindian Dist., New Taipei City 23143, Taiwan
+886-2-29182988 +886-2-29126480
Shuang He Branch
Yu-Chuan Lu Senior Vice President & General Manager
No.67, Sec. 1, Yong-he Rd., Yonghe Dist., New Taipei City 23445, Taiwan
+886-2-22314567 +886-2-22315288
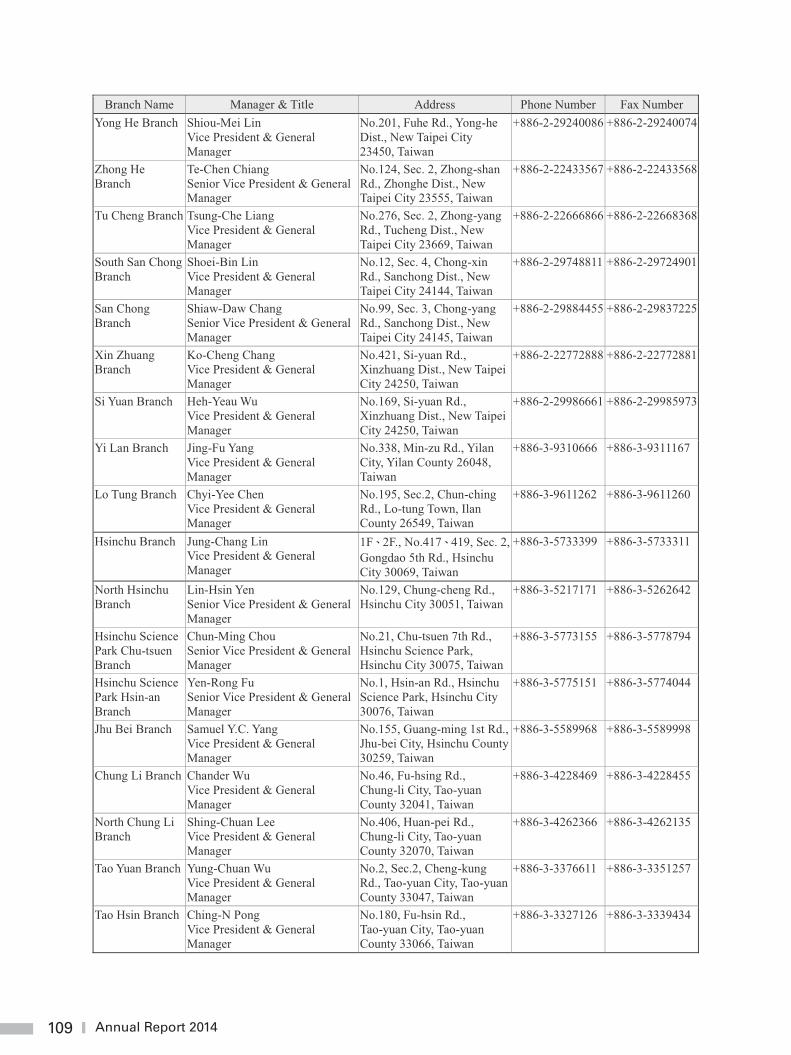
109 Annual Report 2014
109
Branch Name Manager & Title Address Phone Number Fax Number Yong He Branch Shiou-Mei Lin
Vice President & General Manager
No.201, Fuhe Rd., Yong-he Dist., New Taipei City 23450, Taiwan
+886-2-29240086 +886-2-29240074
Zhong He Branch
Te-Chen Chiang Senior Vice President & General Manager
No.124, Sec. 2, Zhong-shan Rd., Zhonghe Dist., New Taipei City 23555, Taiwan
+886-2-22433567 +886-2-22433568
Tu Cheng Branch Tsung-Che Liang Vice President & General Manager
No.276, Sec. 2, Zhong-yang Rd., Tucheng Dist., New Taipei City 23669, Taiwan
+886-2-22666866 +886-2-22668368
South San Chong Branch
Shoei-Bin Lin Vice President & General Manager
No.12, Sec. 4, Chong-xin Rd., Sanchong Dist., New Taipei City 24144, Taiwan
+886-2-29748811 +886-2-29724901
San Chong Branch
Shiaw-Daw Chang Senior Vice President & General Manager
No.99, Sec. 3, Chong-yang Rd., Sanchong Dist., New Taipei City 24145, Taiwan
+886-2-29884455 +886-2-29837225
Xin Zhuang Branch
Ko-Cheng Chang Vice President & General Manager
No.421, Si-yuan Rd., Xinzhuang Dist., New Taipei City 24250, Taiwan
+886-2-22772888 +886-2-22772881
Si Yuan Branch Heh-Yeau Wu Vice President & General Manager
No.169, Si-yuan Rd., Xinzhuang Dist., New Taipei City 24250, Taiwan
+886-2-29986661 +886-2-29985973
Yi Lan Branch Jing-Fu Yang Vice President & General Manager
No.338, Min-zu Rd., Yilan City, Yilan County 26048, Taiwan
+886-3-9310666 +886-3-9311167
Lo Tung Branch Chyi-Yee Chen Vice President & General Manager
No.195, Sec.2, Chun-ching Rd., Lo-tung Town, Ilan County 26549, Taiwan
+886-3-9611262 +886-3-9611260
Hsinchu Branch Jung-Chang Lin Vice President & General Manager
1F 2F., No.417 419, Sec. 2, Gongdao 5th Rd., Hsinchu City 30069, Taiwan
+886-3-5733399 +886-3-5733311
North Hsinchu Branch
Lin-Hsin Yen Senior Vice President & General Manager
No.129, Chung-cheng Rd., Hsinchu City 30051, Taiwan
+886-3-5217171 +886-3-5262642
Hsinchu Science Park Chu-tsuen Branch
Chun-Ming Chou Senior Vice President & General Manager
No.21, Chu-tsuen 7th Rd., Hsinchu Science Park, Hsinchu City 30075, Taiwan
+886-3-5773155 +886-3-5778794
Hsinchu Science Park Hsin-an Branch
Yen-Rong Fu Senior Vice President & General Manager
No.1, Hsin-an Rd., Hsinchu Science Park, Hsinchu City 30076, Taiwan
+886-3-5775151 +886-3-5774044
Jhu Bei Branch Samuel Y.C. Yang Vice President & General Manager
No.155, Guang-ming 1st Rd., Jhu-bei City, Hsinchu County 30259, Taiwan
+886-3-5589968 +886-3-5589998
Chung Li Branch Chander Wu Vice President & General Manager
No.46, Fu-hsing Rd., Chung-li City, Tao-yuan County 32041, Taiwan
+886-3-4228469 +886-3-4228455
North Chung Li Branch
Shing-Chuan Lee Vice President & General Manager
No.406, Huan-pei Rd., Chung-li City, Tao-yuan County 32070, Taiwan
+886-3-4262366 +886-3-4262135
Tao Yuan Branch Yung-Chuan Wu Vice President & General Manager
No.2, Sec.2, Cheng-kung Rd., Tao-yuan City, Tao-yuan County 33047, Taiwan
+886-3-3376611 +886-3-3351257
Tao Hsin Branch Ching-N Pong Vice President & General Manager
No.180, Fu-hsin Rd., Tao-yuan City, Tao-yuan County 33066, Taiwan
+886-3-3327126 +886-3-3339434
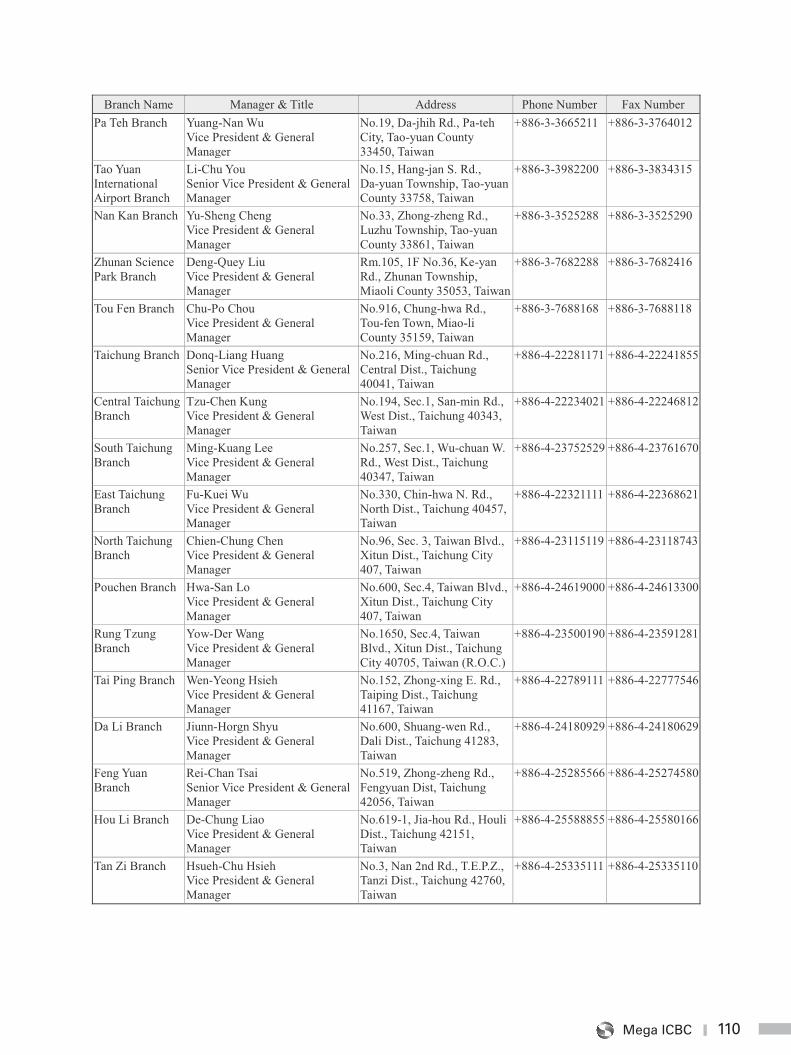
110Mega ICBC
110
Branch Name Manager & Title Address Phone Number Fax Number Pa Teh Branch Yuang-Nan Wu
Vice President & General Manager
No.19, Da-jhih Rd., Pa-teh City, Tao-yuan County 33450, Taiwan
+886-3-3665211 +886-3-3764012
Tao Yuan International Airport Branch
Li-Chu You Senior Vice President & General Manager
No.15, Hang-jan S. Rd., Da-yuan Township, Tao-yuan County 33758, Taiwan
+886-3-3982200 +886-3-3834315
Nan Kan Branch Yu-Sheng Cheng Vice President & General Manager
No.33, Zhong-zheng Rd., Luzhu Township, Tao-yuan County 33861, Taiwan
+886-3-3525288 +886-3-3525290
Zhunan Science Park Branch
Deng-Quey Liu Vice President & General Manager
Rm.105, 1F No.36, Ke-yan Rd., Zhunan Township, Miaoli County 35053, Taiwan
+886-3-7682288 +886-3-7682416
Tou Fen Branch Chu-Po Chou Vice President & General Manager
No.916, Chung-hwa Rd., Tou-fen Town, Miao-li County 35159, Taiwan
+886-3-7688168 +886-3-7688118
Taichung Branch Donq-Liang Huang Senior Vice President & General Manager
No.216, Ming-chuan Rd., Central Dist., Taichung 40041, Taiwan
+886-4-22281171 +886-4-22241855
Central Taichung Branch
Tzu-Chen Kung Vice President & General Manager
No.194, Sec.1, San-min Rd., West Dist., Taichung 40343, Taiwan
+886-4-22234021 +886-4-22246812
South Taichung Branch
Ming-Kuang Lee Vice President & General Manager
No.257, Sec.1, Wu-chuan W. Rd., West Dist., Taichung 40347, Taiwan
+886-4-23752529 +886-4-23761670
East Taichung Branch
Fu-Kuei Wu Vice President & General Manager
No.330, Chin-hwa N. Rd., North Dist., Taichung 40457, Taiwan
+886-4-22321111 +886-4-22368621
North Taichung Branch
Chien-Chung Chen Vice President & General Manager
No.96, Sec. 3, Taiwan Blvd., Xitun Dist., Taichung City 407, Taiwan
+886-4-23115119 +886-4-23118743
Pouchen Branch Hwa-San Lo Vice President & General Manager
No.600, Sec.4, Taiwan Blvd., Xitun Dist., Taichung City 407, Taiwan
+886-4-24619000 +886-4-24613300
Rung Tzung Branch
Yow-Der Wang Vice President & General Manager
No.1650, Sec.4, Taiwan Blvd., Xitun Dist., Taichung City 40705, Taiwan (R.O.C.)
+886-4-23500190 +886-4-23591281
Tai Ping Branch Wen-Yeong Hsieh Vice President & General Manager
No.152, Zhong-xing E. Rd., Taiping Dist., Taichung 41167, Taiwan
+886-4-22789111 +886-4-22777546
Da Li Branch Jiunn-Horgn Shyu Vice President & General Manager
No.600, Shuang-wen Rd., Dali Dist., Taichung 41283, Taiwan
+886-4-24180929 +886-4-24180629
Feng Yuan Branch
Rei-Chan Tsai Senior Vice President & General Manager
No.519, Zhong-zheng Rd., Fengyuan Dist, Taichung 42056, Taiwan
+886-4-25285566 +886-4-25274580
Hou Li Branch De-Chung Liao Vice President & General Manager
No.619-1, Jia-hou Rd., Houli Dist., Taichung 42151, Taiwan
+886-4-25588855 +886-4-25580166
Tan Zi Branch Hsueh-Chu Hsieh Vice President & General Manager
No.3, Nan 2nd Rd., T.E.P.Z., Tanzi Dist., Taichung 42760, Taiwan
+886-4-25335111 +886-4-25335110
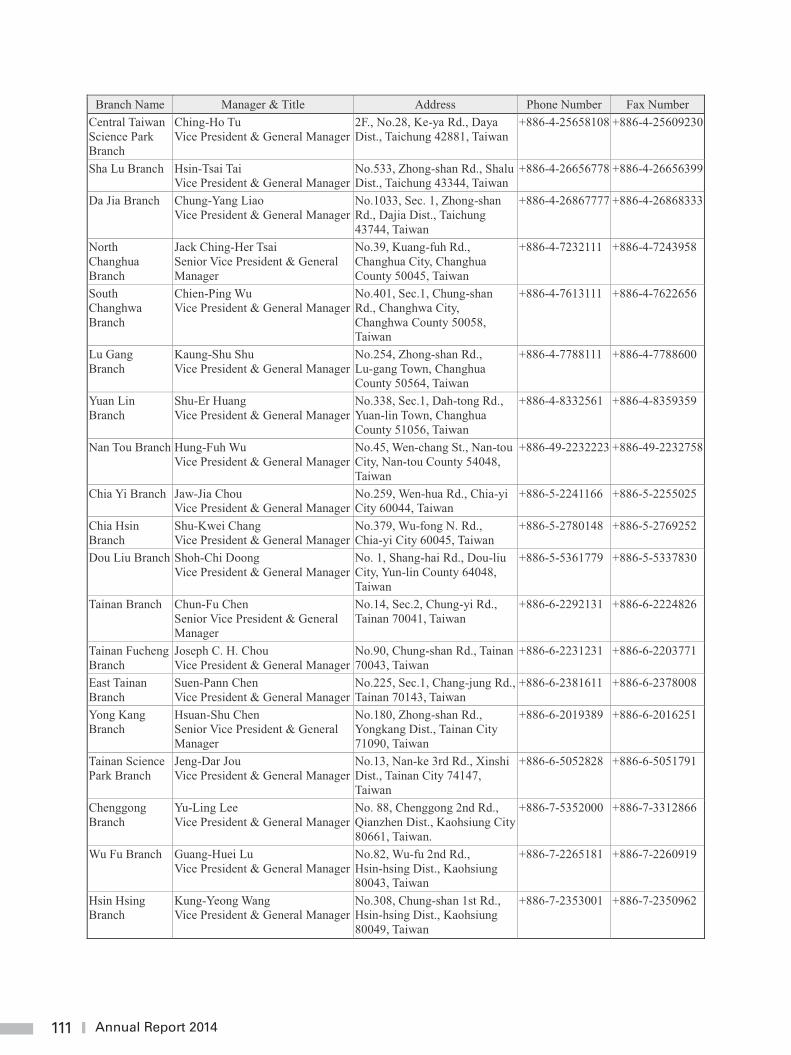
111 Annual Report 2014
111
Branch Name Manager & Title Address Phone Number Fax Number Central Taiwan Science Park Branch
Ching-Ho Tu Vice President & General Manager
2F., No.28, Ke-ya Rd., Daya Dist., Taichung 42881, Taiwan
+886-4-25658108 +886-4-25609230
Sha Lu Branch Hsin-Tsai Tai Vice President & General Manager
No.533, Zhong-shan Rd., Shalu Dist., Taichung 43344, Taiwan
+886-4-26656778 +886-4-26656399
Da Jia Branch Chung-Yang Liao Vice President & General Manager
No.1033, Sec. 1, Zhong-shan Rd., Dajia Dist., Taichung 43744, Taiwan
+886-4-26867777 +886-4-26868333
North Changhua Branch
Jack Ching-Her Tsai Senior Vice President & General Manager
No.39, Kuang-fuh Rd., Changhua City, Changhua County 50045, Taiwan
+886-4-7232111 +886-4-7243958
South Changhwa Branch
Chien-Ping Wu Vice President & General Manager
No.401, Sec.1, Chung-shan Rd., Changhwa City, Changhwa County 50058, Taiwan
+886-4-7613111 +886-4-7622656
Lu Gang Branch
Kaung-Shu Shu Vice President & General Manager
No.254, Zhong-shan Rd., Lu-gang Town, Changhua County 50564, Taiwan
+886-4-7788111 +886-4-7788600
Yuan Lin Branch
Shu-Er Huang Vice President & General Manager
No.338, Sec.1, Dah-tong Rd., Yuan-lin Town, Changhua County 51056, Taiwan
+886-4-8332561 +886-4-8359359
Nan Tou Branch Hung-Fuh Wu Vice President & General Manager
No.45, Wen-chang St., Nan-tou City, Nan-tou County 54048, Taiwan
+886-49-2232223 +886-49-2232758
Chia Yi Branch Jaw-Jia Chou Vice President & General Manager
No.259, Wen-hua Rd., Chia-yi City 60044, Taiwan
+886-5-2241166 +886-5-2255025
Chia Hsin Branch
Shu-Kwei Chang Vice President & General Manager
No.379, Wu-fong N. Rd., Chia-yi City 60045, Taiwan
+886-5-2780148 +886-5-2769252
Dou Liu Branch Shoh-Chi Doong Vice President & General Manager
No. 1, Shang-hai Rd., Dou-liu City, Yun-lin County 64048, Taiwan
+886-5-5361779 +886-5-5337830
Tainan Branch Chun-Fu Chen Senior Vice President & General Manager
No.14, Sec.2, Chung-yi Rd., Tainan 70041, Taiwan
+886-6-2292131 +886-6-2224826
Tainan Fucheng Branch
Joseph C. H. Chou Vice President & General Manager
No.90, Chung-shan Rd., Tainan 70043, Taiwan
+886-6-2231231 +886-6-2203771
East Tainan Branch
Suen-Pann Chen Vice President & General Manager
No.225, Sec.1, Chang-jung Rd., Tainan 70143, Taiwan
+886-6-2381611 +886-6-2378008
Yong Kang Branch
Hsuan-Shu Chen Senior Vice President & General Manager
No.180, Zhong-shan Rd., Yongkang Dist., Tainan City 71090, Taiwan
+886-6-2019389 +886-6-2016251
Tainan Science Park Branch
Jeng-Dar Jou Vice President & General Manager
No.13, Nan-ke 3rd Rd., Xinshi Dist., Tainan City 74147, Taiwan
+886-6-5052828 +886-6-5051791
Chenggong Branch
Yu-Ling Lee Vice President & General Manager
No. 88, Chenggong 2nd Rd., Qianzhen Dist., Kaohsiung City 80661, Taiwan.
+886-7-5352000 +886-7-3312866
Wu Fu Branch Guang-Huei Lu Vice President & General Manager
No.82, Wu-fu 2nd Rd., Hsin-hsing Dist., Kaohsiung 80043, Taiwan
+886-7-2265181 +886-7-2260919
Hsin Hsing Branch
Kung-Yeong Wang Vice President & General Manager
No.308, Chung-shan 1st Rd., Hsin-hsing Dist., Kaohsiung 80049, Taiwan
+886-7-2353001 +886-7-2350962
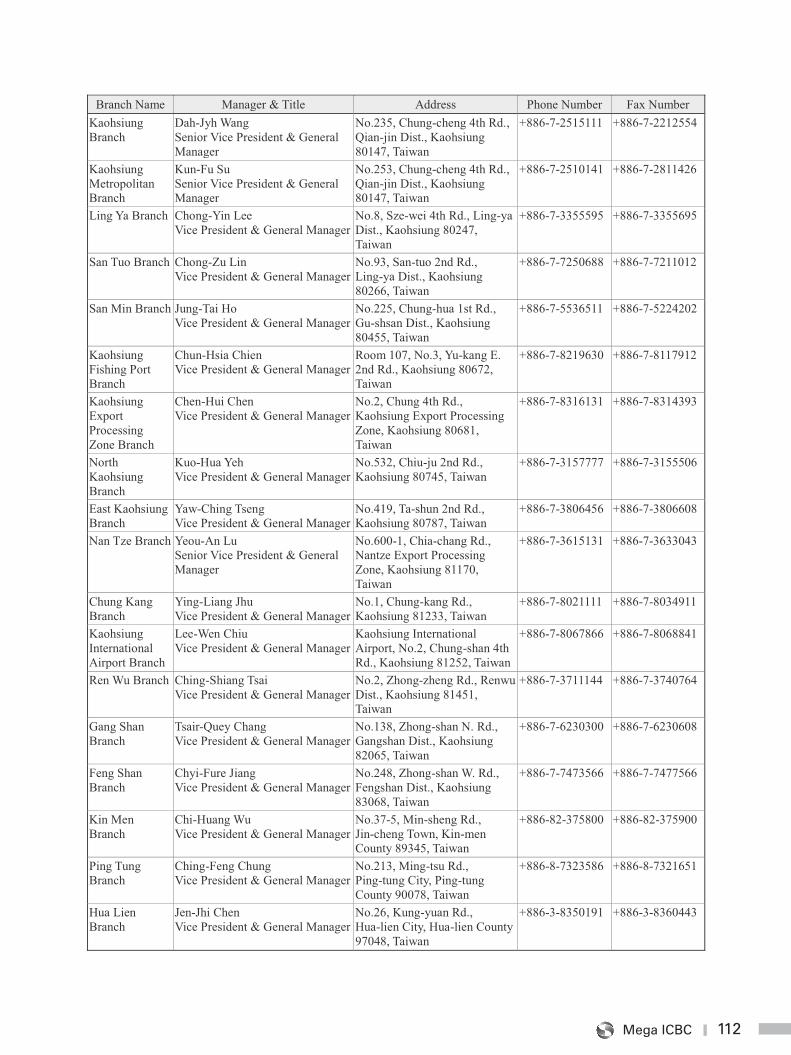
112Mega ICBC
112
Branch Name Manager & Title Address Phone Number Fax Number Kaohsiung Branch
Dah-Jyh Wang Senior Vice President & General Manager
No.235, Chung-cheng 4th Rd., Qian-jin Dist., Kaohsiung 80147, Taiwan
+886-7-2515111 +886-7-2212554
Kaohsiung Metropolitan Branch
Kun-Fu Su Senior Vice President & General Manager
No.253, Chung-cheng 4th Rd., Qian-jin Dist., Kaohsiung 80147, Taiwan
+886-7-2510141 +886-7-2811426
Ling Ya Branch Chong-Yin Lee Vice President & General Manager
No.8, Sze-wei 4th Rd., Ling-ya Dist., Kaohsiung 80247, Taiwan
+886-7-3355595 +886-7-3355695
San Tuo Branch Chong-Zu Lin Vice President & General Manager
No.93, San-tuo 2nd Rd., Ling-ya Dist., Kaohsiung 80266, Taiwan
+886-7-7250688 +886-7-7211012
San Min Branch Jung-Tai Ho Vice President & General Manager
No.225, Chung-hua 1st Rd., Gu-shsan Dist., Kaohsiung 80455, Taiwan
+886-7-5536511 +886-7-5224202
Kaohsiung Fishing Port Branch
Chun-Hsia Chien Vice President & General Manager
Room 107, No.3, Yu-kang E. 2nd Rd., Kaohsiung 80672, Taiwan
+886-7-8219630 +886-7-8117912
Kaohsiung Export Processing Zone Branch
Chen-Hui Chen Vice President & General Manager
No.2, Chung 4th Rd., Kaohsiung Export Processing Zone, Kaohsiung 80681, Taiwan
+886-7-8316131 +886-7-8314393
North Kaohsiung Branch
Kuo-Hua Yeh Vice President & General Manager
No.532, Chiu-ju 2nd Rd., Kaohsiung 80745, Taiwan
+886-7-3157777 +886-7-3155506
East Kaohsiung Branch
Yaw-Ching Tseng Vice President & General Manager
No.419, Ta-shun 2nd Rd., Kaohsiung 80787, Taiwan
+886-7-3806456 +886-7-3806608
Nan Tze Branch Yeou-An Lu Senior Vice President & General Manager
No.600-1, Chia-chang Rd., Nantze Export Processing Zone, Kaohsiung 81170, Taiwan
+886-7-3615131 +886-7-3633043
Chung Kang Branch
Ying-Liang Jhu Vice President & General Manager
No.1, Chung-kang Rd., Kaohsiung 81233, Taiwan
+886-7-8021111 +886-7-8034911
Kaohsiung International Airport Branch
Lee-Wen Chiu Vice President & General Manager
Kaohsiung International Airport, No.2, Chung-shan 4th Rd., Kaohsiung 81252, Taiwan
+886-7-8067866 +886-7-8068841
Ren Wu Branch Ching-Shiang Tsai Vice President & General Manager
No.2, Zhong-zheng Rd., Renwu Dist., Kaohsiung 81451, Taiwan
+886-7-3711144 +886-7-3740764
Gang Shan Branch
Tsair-Quey Chang Vice President & General Manager
No.138, Zhong-shan N. Rd., Gangshan Dist., Kaohsiung 82065, Taiwan
+886-7-6230300 +886-7-6230608
Feng Shan Branch
Chyi-Fure Jiang Vice President & General Manager
No.248, Zhong-shan W. Rd., Fengshan Dist., Kaohsiung 83068, Taiwan
+886-7-7473566 +886-7-7477566
Kin Men Branch
Chi-Huang Wu Vice President & General Manager
No.37-5, Min-sheng Rd., Jin-cheng Town, Kin-men County 89345, Taiwan
+886-82-375800 +886-82-375900
Ping Tung Branch
Ching-Feng Chung Vice President & General Manager
No.213, Ming-tsu Rd., Ping-tung City, Ping-tung County 90078, Taiwan
+886-8-7323586 +886-8-7321651
Hua Lien Branch
Jen-Jhi Chen Vice President & General Manager
No.26, Kung-yuan Rd., Hua-lien City, Hua-lien County 97048, Taiwan
+886-3-8350191 +886-3-8360443
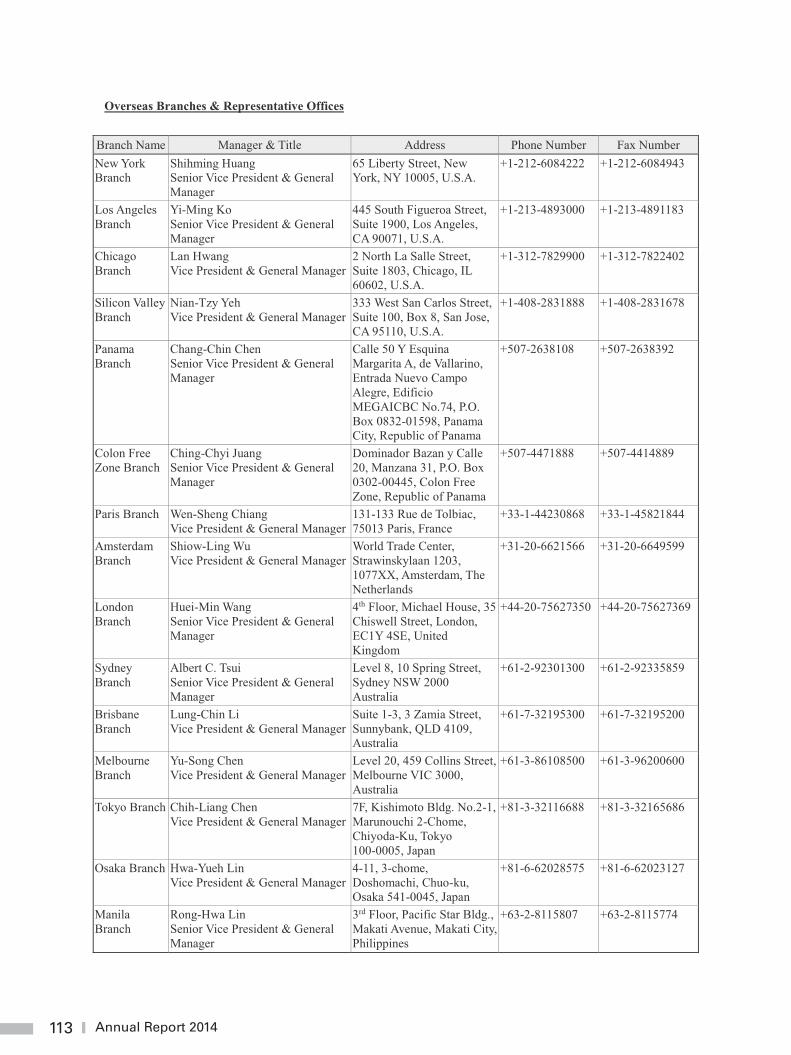
113 Annual Report 2014
113
Overseas Branches & Representative Offices
Branch Name Manager & Title Address Phone Number Fax Number New York Branch
Shihming Huang Senior Vice President & General Manager
65 Liberty Street, New York, NY 10005, U.S.A.
+1-212-6084222 +1-212-6084943
Los Angeles Branch
Yi-Ming Ko Senior Vice President & General Manager
445 South Figueroa Street, Suite 1900, Los Angeles, CA 90071, U.S.A.
+1-213-4893000 +1-213-4891183
Chicago Branch
Lan Hwang Vice President & General Manager
2 North La Salle Street, Suite 1803, Chicago, IL 60602, U.S.A.
+1-312-7829900 +1-312-7822402
Silicon Valley Branch
Nian-Tzy Yeh Vice President & General Manager
333 West San Carlos Street, Suite 100, Box 8, San Jose, CA 95110, U.S.A.
+1-408-2831888 +1-408-2831678
Panama Branch
Chang-Chin Chen Senior Vice President & General Manager
Calle 50 Y Esquina Margarita A, de Vallarino, Entrada Nuevo Campo Alegre, Edificio MEGAICBC No.74, P.O. Box 0832-01598, Panama City, Republic of Panama
+507-2638108 +507-2638392
Colon Free Zone Branch
Ching-Chyi Juang Senior Vice President & General Manager
Dominador Bazan y Calle 20, Manzana 31, P.O. Box 0302-00445, Colon Free Zone, Republic of Panama
+507-4471888 +507-4414889
Paris Branch Wen-Sheng Chiang Vice President & General Manager
131-133 Rue de Tolbiac, 75013 Paris, France
+33-1-44230868 +33-1-45821844
Amsterdam Branch
Shiow-Ling Wu Vice President & General Manager
World Trade Center, Strawinskylaan 1203, 1077XX, Amsterdam, The Netherlands
+31-20-6621566 +31-20-6649599
London Branch
Huei-Min Wang Senior Vice President & General Manager
4th Floor, Michael House, 35 Chiswell Street, London, EC1Y 4SE, United Kingdom
+44-20-75627350 +44-20-75627369
Sydney Branch
Albert C. Tsui Senior Vice President & General Manager
Level 8, 10 Spring Street, Sydney NSW 2000 Australia
+61-2-92301300 +61-2-92335859
Brisbane Branch
Lung-Chin Li Vice President & General Manager
Suite 1-3, 3 Zamia Street, Sunnybank, QLD 4109, Australia
+61-7-32195300 +61-7-32195200
Melbourne Branch
Yu-Song Chen Vice President & General Manager
Level 20, 459 Collins Street, Melbourne VIC 3000, Australia
+61-3-86108500
+61-3-96200600
Tokyo Branch Chih-Liang Chen Vice President & General Manager
7F, Kishimoto Bldg. No.2-1, Marunouchi 2-Chome, Chiyoda-Ku, Tokyo 100-0005, Japan
+81-3-32116688 +81-3-32165686
Osaka Branch Hwa-Yueh Lin Vice President & General Manager
4-11, 3-chome, Doshomachi, Chuo-ku, Osaka 541-0045, Japan
+81-6-62028575 +81-6-62023127
Manila Branch
Rong-Hwa Lin Senior Vice President & General Manager
3rd Floor, Pacific Star Bldg., Makati Avenue, Makati City, Philippines
+63-2-8115807 +63-2-8115774
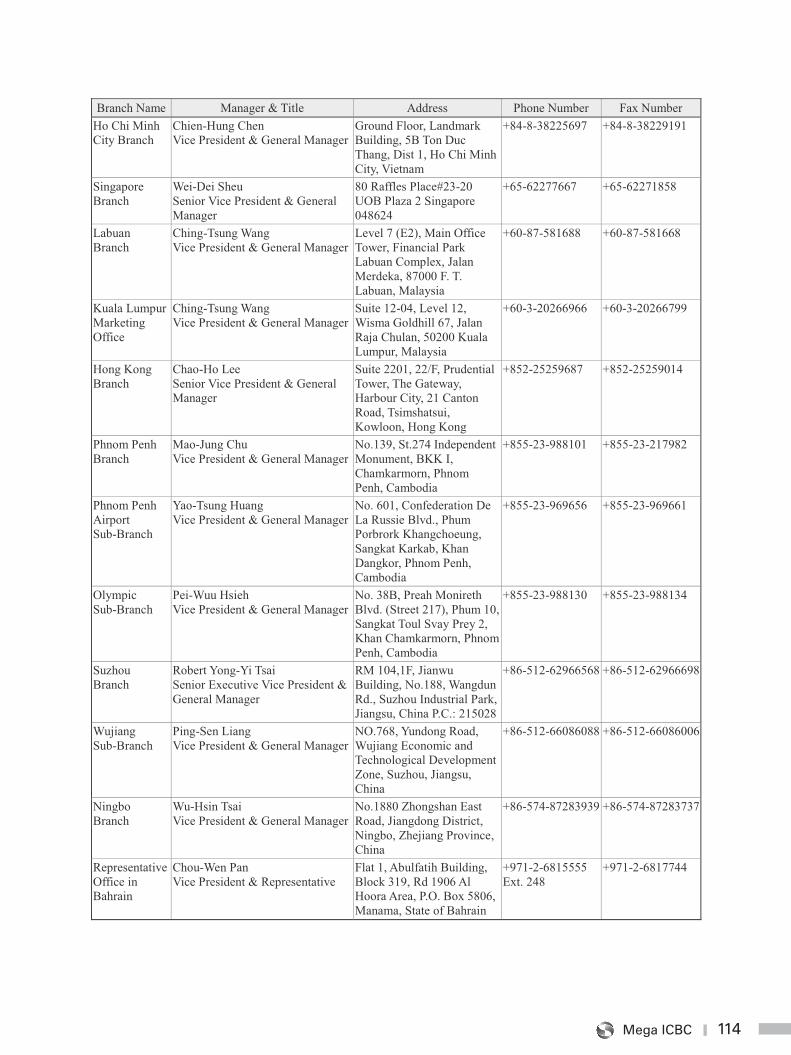
114Mega ICBC
114
Branch Name Manager & Title Address Phone Number Fax Number Ho Chi Minh City Branch
Chien-Hung Chen Vice President & General Manager
Ground Floor, Landmark Building, 5B Ton Duc Thang, Dist 1, Ho Chi Minh City, Vietnam
+84-8-38225697 +84-8-38229191
Singapore Branch
Wei-Dei Sheu Senior Vice President & General Manager
80 Raffles Place#23-20 UOB Plaza 2 Singapore 048624
+65-62277667 +65-62271858
Labuan Branch
Ching-Tsung Wang Vice President & General Manager
Level 7 (E2), Main Office Tower, Financial Park Labuan Complex, Jalan Merdeka, 87000 F. T. Labuan, Malaysia
+60-87-581688 +60-87-581668
Kuala Lumpur Marketing Office
Ching-Tsung Wang Vice President & General Manager
Suite 12-04, Level 12, Wisma Goldhill 67, Jalan Raja Chulan, 50200 Kuala Lumpur, Malaysia
+60-3-20266966 +60-3-20266799
Hong Kong Branch
Chao-Ho Lee Senior Vice President & General Manager
Suite 2201, 22/F, Prudential Tower, The Gateway, Harbour City, 21 Canton Road, Tsimshatsui, Kowloon, Hong Kong
+852-25259687 +852-25259014
Phnom Penh Branch
Mao-Jung Chu Vice President & General Manager
No.139, St.274 Independent Monument, BKK I, Chamkarmorn, Phnom Penh, Cambodia
+855-23-988101 +855-23-217982
Phnom Penh Airport Sub-Branch
Yao-Tsung Huang Vice President & General Manager
No. 601, Confederation De La Russie Blvd., Phum Porbrork Khangchoeung, Sangkat Karkab, Khan Dangkor, Phnom Penh, Cambodia
+855-23-969656 +855-23-969661
Olympic Sub-Branch
Pei-Wuu Hsieh Vice President & General Manager
No. 38B, Preah Monireth Blvd. (Street 217), Phum 10, Sangkat Toul Svay Prey 2, Khan Chamkarmorn, Phnom Penh, Cambodia
+855-23-988130 +855-23-988134
Suzhou Branch
Robert Yong-Yi Tsai Senior Executive Vice President & General Manager
RM 104,1F, Jianwu Building, No.188, Wangdun Rd., Suzhou Industrial Park, Jiangsu, China P.C.: 215028
+86-512-62966568 +86-512-62966698
Wujiang Sub-Branch
Ping-Sen Liang Vice President & General Manager
NO.768, Yundong Road, Wujiang Economic and Technological Development Zone, Suzhou, Jiangsu, China
+86-512-66086088 +86-512-66086006
Ningbo Branch
Wu-Hsin Tsai Vice President & General Manager
No.1880 Zhongshan East Road, Jiangdong District, Ningbo, Zhejiang Province, China
+86-574-87283939 +86-574-87283737
Representative Office in Bahrain
Chou-Wen Pan Vice President & Representative
Flat 1, Abulfatih Building, Block 319, Rd 1906 Al Hoora Area, P.O. Box 5806, Manama, State of Bahrain
+971-2-6815555 Ext. 248
+971-2-6817744
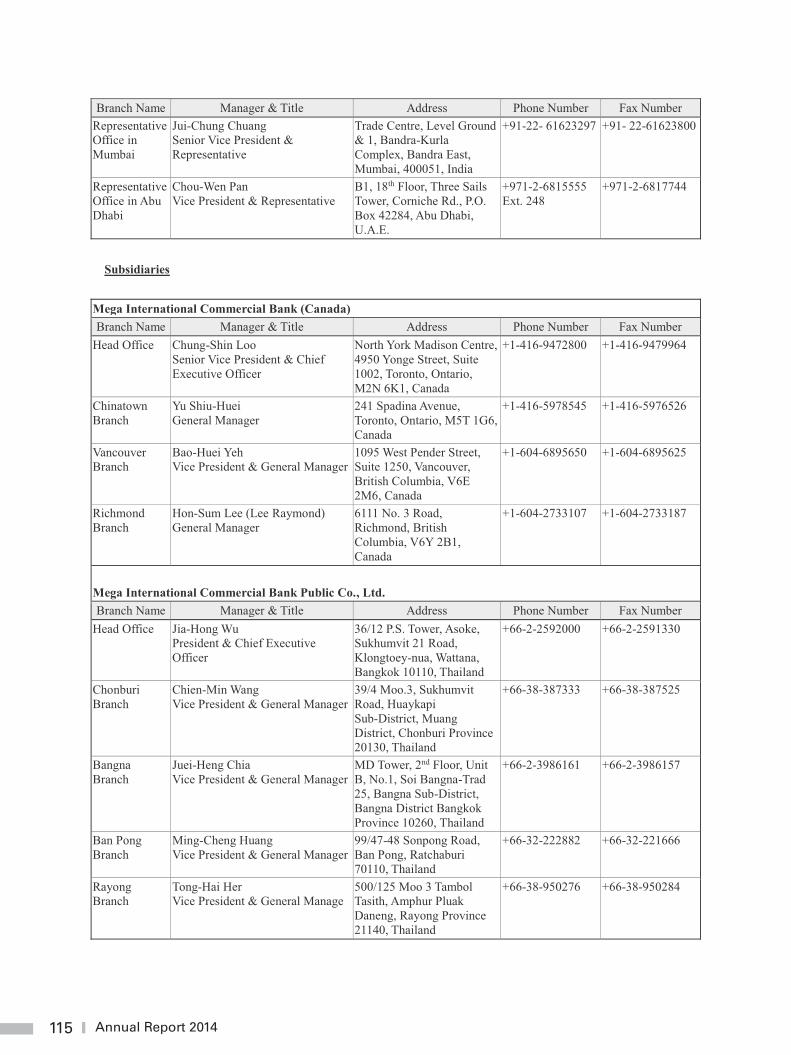
115 Annual Report 2014
115
Branch Name Manager & Title Address Phone Number Fax Number Representative Office in Mumbai
Jui-Chung Chuang Senior Vice President & Representative
Trade Centre, Level Ground & 1, Bandra-Kurla Complex, Bandra East, Mumbai, 400051, India
+91-22- 61623297 +91- 22-61623800
Representative Office in Abu Dhabi
Chou-Wen Pan Vice President & Representative
B1, 18th Floor, Three Sails Tower, Corniche Rd., P.O. Box 42284, Abu Dhabi, U.A.E.
+971-2-6815555 Ext. 248
+971-2-6817744
Subsidiaries
Mega International Commercial Bank (Canada) Branch Name Manager & Title Address Phone Number Fax Number
Head Office Chung-Shin Loo Senior Vice President & Chief Executive Officer
North York Madison Centre, 4950 Yonge Street, Suite 1002, Toronto, Ontario, M2N 6K1, Canada
+1-416-9472800 +1-416-9479964
Chinatown Branch
Yu Shiu-Huei General Manager
241 Spadina Avenue, Toronto, Ontario, M5T 1G6, Canada
+1-416-5978545 +1-416-5976526
Vancouver Branch
Bao-Huei Yeh Vice President & General Manager
1095 West Pender Street, Suite 1250, Vancouver, British Columbia, V6E 2M6, Canada
+1-604-6895650 +1-604-6895625
Richmond Branch
Hon-Sum Lee (Lee Raymond) General Manager
6111 No. 3 Road, Richmond, British Columbia, V6Y 2B1, Canada
+1-604-2733107 +1-604-2733187
Mega International Commercial Bank Public Co., Ltd. Branch Name Manager & Title Address Phone Number Fax Number
Head Office Jia-Hong Wu President & Chief Executive Officer
36/12 P.S. Tower, Asoke, Sukhumvit 21 Road, Klongtoey-nua, Wattana, Bangkok 10110, Thailand
+66-2-2592000 +66-2-2591330
Chonburi Branch
Chien-Min Wang Vice President & General Manager
39/4 Moo.3, Sukhumvit Road, Huaykapi Sub-District, Muang District, Chonburi Province 20130, Thailand
+66-38-387333 +66-38-387525
Bangna Branch
Juei-Heng Chia Vice President & General Manager
MD Tower, 2nd Floor, Unit B, No.1, Soi Bangna-Trad 25, Bangna Sub-District, Bangna District Bangkok Province 10260, Thailand
+66-2-3986161 +66-2-3986157
Ban Pong Branch
Ming-Cheng Huang Vice President & General Manager
99/47-48 Sonpong Road, Ban Pong, Ratchaburi 70110, Thailand
+66-32-222882 +66-32-221666
Rayong Branch
Tong-Hai Her Vice President & General Manage
500/125 Moo 3 Tambol Tasith, Amphur Pluak Daneng, Rayong Province 21140, Thailand
+66-38-950276 +66-38-950284