Embed Size (px)
Citation preview

Splicing pattern of Aryl hydrocarbon interacting protein like 1 (AIPL1)
in relation to Centromere Protein F
Inaugural Dissertation
submitted to the
Faculty of Medicine
in partial fulfillment of the requirements
for the PhD-Degree
of the Faculties of Veterinary Medicine and Medicine
of the Justus Liebig University Giessen
by
Bhupesh Parise
of
Vijayawada, India
Giessen 2013

From the Department of Ophthalmology
Director: Prof. Dr. med. Birgit Lorenz
Faculty of Medicine, Justus Liebig University Giessen
First Supervisor and Committee Member: PD Dr. Dipl-Biol. Markus Preising
Second Supervisor and Committee Member: Prof. Visvanathan Ramamurthy PhD
Examination Chair and Committee Member: Prof. Dr. Christine Wrenzycki
Committee Member: Prof. Dr. Lienhard Schmitz
Date of Doctoral Defense: 26.02.2014

“Tamaso ma jyotir Gamaya ...” (lead us from darkness to light)
In Sanskrit from the discussion of the life force ‘Prana’ in Brihadaranyaka Upanishad
(1.3.28) (800–2000 bc)

To my parents with so much love
i
Table of Contents
Abbreviations………………………………………………………………………………….….Vi
List of figures……………………………………………………………………………………...X
Tables…………………………………………………………………………………………..…Xi
1. INTRODUCTION……………………………………………………………………………....1
1.1 Visual pigments: Role of rods and cones………………………………………………………2
1.1.1 Visual cycle…………………………………………………………………………...2
1.2 Inherited retina degenerations: Lebers Congenital Amaurosis (LCA)…………………………3
1.3 Aryl Hydrocarbon Interacting Protein Like 1 AIPL1…………………………………………..5
1.3.1 Role of TPR motifs in AIPL1………………………………………………………...6
1.3.2 Chaperone role of AIPL1……………………………………………………………..7
1.3.3 Role of Phosphodiesterase 6 (PDE6) in retina & Influence of AIPL1 on PDE6……..7
1.4 Alternative Splicing……………………………………………………………………………..9
1.4.1 Alternative splicing in AIPL1…………………………………………………………9
1.4.2 Splicing pattern in AIPL1…………………………………………………………….10
1.5 Centromere protein F…………………………………………………………………………...11
1.5.1 Leucine Zipper Motifs role in protein interaction……………………………………13
1.6 Relationship between AIPL1 and Cell cycle regulatory proteins…………………………...….14
1.7 Aim of the study………………………………………………………………………………..15
2. MATERIALS AND METHODS………………………………………………………………16
2.1 Materials…………………………………………………………………………………….….16
2.1.1 Chemicals and Reagents………………………………………………………….…..16
2.1.2 Oligonucleotides……………………………………………………………………...18

ii
2.1.3 Vectors………………………………………………………………………………..18
2.1.4 Cell lines……………………………………………………………………………...19
2.1.5 Competent cells………………………………………………………………………19
2.1.6 Enzymes………………………………………………………………..……………19
2.1.7 Antibodies……………………………………………………………………………20
2.1.8 Buffers………………………………………………………………………………..21
2.1.9 Ready Kits……………………………………………………………………………23
2.1.10 Molecular weight standards…………………………………………………………23
2.2 Equipment and devices…………………………………………………………………………24
2.2.1 Computer aided data processing……………………………………………………..25
2.3 Methods of molecular biology…………………………………………………………………26
2.3.1 Polymerase chain reaction (PCR)…………………………………………………….26
2.3.2 Agarose gel electrophoresis…………………………………………………………..28
2.3.3 Isolation of DNA from agarose gels………………………………………………….28
2.3.4 Cloning……………………………………………………………………………….29
2.3.4.1 Restrictionendonuclease digestion…………………………………………………29
2.3.4.2 Dephosphorylation……………………………………………………………...….30
2.3.4.3 Ligation………………………………………………………………………….….30
2.3.4.4 Transformation……………………………………………………………………..31
2.3.4.5 Preparation of competent bacterial cells……………………………………………31
2.3.4.6 Bacterial transformation by electroporation………………………………………..32
2.3.5 Preparation of plasmid DNA…………………………………………………………32
2.3.5.1 Preparation of plasmid DNA (Miniprep)……………………………………………….......32

iii
2.3.5.2 Preparation of plasmid DNA (Maxiprep)…………………………………………..33
2.3.6 Quantification of nucleic acid………………………………………………………………..34
2.3.7 Sequence analysis of plasmids……………………………………………………………….34
2.3.8 Preparation of Glycerol stocks……………………………………………………………….34
2.3.9 Over expression of recombinant proteins……………………………………………………35
2.3.9.1 Growth of standard E.coli expression cultures (100 ml)………………..…….....35
2.3.9.2 Over expression with EnPressoTM
Tablet cultivation set……….………………..35
2.3.10 Protein extraction……………………………………………………………………………36
2.3.10.1 Protein extraction from tissue…………………………………………………...36
2.3.10.2 Bacterial protein extraction……………………………………………………...36
2.3.10.3 Mammalian protein extraction………………………………………………….37
2.3.11 Determination of the protein concentration by Bradford assay……………….…..37
2.3.12 Purification of His tagged proteins using Ni-NTA resin under native conditions……..…...38
2.3.12.1 Buffers for purification under native conditions……………………………….....38
2.3.12.2 Purification of over expressed and extracted recombinant proteins using
Ni_NTA resin……………………………………………………………….……. 38
2.3.13 Concentrating protein samples using centriprep® centrifugal filter device …………….…..39
2.3.14 Gel electrophoresis of proteins-SDS-PAGE…………………………………………….…..40
2.3.14.1 Preparation of His tagged marker…………………………………………………40
2.3.14.2 Protein electrophoresis using manually prepared acrylamide gels…………….….41
2.3.14.3 Loading and running………………………………………………………………41
2.3.14.4 SDS-PAGE using precast 8-16 % gradient SERVAGelTM
TG………………...….41
2.3.15 Polyacrylamide Gel Staining Protocol………………………………………………….…...42
2.3.16 Western Blotting…………………………………………………………………………….42

iv
2.3.17 Ponceau S staining of proteins on nitrocellulose membranes………………………….……43
2.3.18 Antibody Hybridization on nitrocellulose membranes………………………………….…..44
2.3.19 Stripping and reprobing Western blots………………………………………………….…..45
2.3.20 Mammalian cell culture………………………………………………………………….….46
2.3.20.1HEK293 cell line……………………………………………………………….….46
2.3.20.2 HeLa cell line…………………………………………………………………..….46
2.3.20.3 Culture of cell lines………………………………………………………….……47
2.3.20.4 Long term storage of cell lines……………………………………………………47
2.3.21 Heterologous expression in HeLa cells for immunocytochemistry……………….……..…47
2.3.21.1 Transfection of HeLa cells using lipofectamin®………………………….…..…..47
2.3.21.2 Transfection of HeLa cells using Roti®-Fect PLUS………………………………48
2.3.22 Immunocytochemistry………………………………………………………………………48
2.3.23 Heterologous expression in HEK293 cells and mammalian protein extraction…………….49
3. Results…………………………………………………………………………………………...50
3.1 Sub cloning of AIPL1 splice variants into an expression vector……………………….50
3.1.1 Identification of human AIPL1 splice variants…………………………………....….50
3.1.2 Cloning of splice variants…………………………………………………………….51
3.1.3 Restriction digestion and sequence analysis………………………………………….54
3.2 Over expression of AIPL1 splice variants in a Prokaryotic system using the Enbase® Flo
cultivation system …………………………………………………………………………..….56
3.2.1 Recombinant protein purification and pull down experiments………………………56
3.2.1.1 SDS_PAGE of Ni_NTA agarose purified probes of SV1-SV5……………………56
3.2.1.2 SDS_PAGE of His tag purified and centriprep concentrated samples of (SV1-
SV5)………………………………………………………………………………………..57
v
3.2.3 Immunoblot analysis of AIPL1 splice variants………………………………………58
3.2.3.1 Western blot analysis of AIPL1 splice variants (SV1-SV5) expressed in prokaryotic
system……………………………………………………………………………………...58
3.2.3.2 Immunoblot detection of His tags in AIPL1 splice variants from SV1-SV5............60
3.2.3.3 Expression and purification of recombinant proteins in HEK293 cell lines.............61
3.3 Intracellular localization of human AIPL1 splice variants SV1-SV5 in HeLa cells…………...63
3.3.1 Immunohistochemical co-detection of heterologously expressed AIPL1 and
Intrinsic CENP-F…………………………………………………...............................67
5. Discussion…………………………………………………………………………………….….72
4.1 Impact of splicing on AIPL1 protein function.............................................................................72
4.2 Protein expression and purification studies of AIPL1………………………………………….73
4.2.1 Role of imidazole and FKBPs in protein purification…………………………….…74
4.3 Immunoblot analysis of AIPL1 splice variants……………………………………..……….….74
4.4 Choosing CENP-F as a possible interaction partner of AIPL1 …………………..………….…75
4.5 Features that support interaction between AIPL1 and CENP-F………………..………………75
4.6 Colocalization studies of AIPL1 and CENP-F…………………………………………………76
4.7 Future aspects in validating AIPL1 splice variants and protein interaction studies……….…..77
6. Summary…………………………………………………………………………………….…..78
7. Zusammenfassung……………………………………………………………………………....79
8. References…………………………………………………………………………………….…80
9. Acknowledgements………………………………………………………………………….…..88

vi
Abbreviations
AIPL1 Aryl hydrocarbon interacting protein like 1
ABCR ATP-binding cassette (ABC) –transporter gene, retina specific
A. dest Double distilled water
ad autosomal dominant
ar autosomal recessive
aa Amino acid
bp Base pairs
BSA Bovine serum albumin
B-PER Bacterial Protein Extraction Reagent
CENP-F Centromere protein F
COD Cone dystrophy
cDNA coding DNA
cGMP cyclic Guanosine Monophosphate
CORD Cone-Rod dystrophy
CRALBP Cellular Retinaldehyde-binding Protein
CRX Cone Rod Homeobox Protein
CSRD Childhood-onset Severe Retinal Dystrophy
DNA Deoxyribonucleic Acid
dNTP’s Deoxynucleotide Triphosphates
EDTA Ethylenediaminetetraacetic Acid

vii
EOSRD Early-Onset Severe Retinal Dystrophy
ERG Electroretinography
FKBP FK506-binding protein family
FKS Fetal Calf Serum
g gram
GMP/GDP/GTP Guanosin-Mono-/-Di-/-Triphosphat
h hour
HEPES 2-[4-(2-hydroxyethyl)piperazin-1-yl]ethanesulfonic acid
IPTG Isopropyl β-D-1-thiogalactopyranoside
kb Kilobase pairs
kDa Kilodalton
l Liter
LCA Leber Congenital Amaurosis
mRNA messenger RNA
M Mol
MW Molecular weight
min Minute
M-PER Mammalian Protein Extraction Reagent
NUB1 NEDD8 Ultimate Buster 1
nm Nanometer
nt Nucleotide
OD Optical density
PRD Proline rich domain

viii
PDE6 Phosphodiesterase 6
PAA Polyacrylamide
PAGE Poly Acrylamide Gel Electrophoresis
P/Cl phenol / chloroform / isoamyl alcohol
PCR Polymerase Chain Reaction
PFA Paraformaldehyde
RDS Retinal Degeneration Slow
RNA Ribonucleic Acid
RP Retinitis Pigmentosa
RPE Retinal Pigment Epithelium
RPE65 Retinal Pigment Epithelium Protein 65
RPGR Retinitis Pigmentosa GTPase Regulator
rpm revolutions per minute
RT Room Temperature
S Second
SDS Sodium Dodecyl Sulphate
SV Splice Variant
TPR Tetratrico peptide repeat motifs
TBE Tris/Borate/EDTA (Running buffer for gel electrophoresis)
TE Tris-EDTA
U Unit
UTR Untranslated region
UV Ultraviolet light

ix
V Volt
v/v Volume per volume
W Watt
w/v weight per volume
X-Gal 5-bromo-4-chloro-indolyl-β-D-galactopyranoside
Nucleic acids /Nucleotides
A Adenine
C Cytosine
G Guanine
T Thymine
U Uracil
P Purines (A, G)
Y Pyramidines (C, T/U)
N arbitrary nucleotide
Amino acids:
M Met Methionine
N Asn Asparagine
P Pro Proline
Q Gln Glutamine
R Arg Arginine
S Ser Serine
T Thr Threonine
V Val Valine
W Trp Tryptophan
Y Tyr Tyrosine

x
List of figures
Figure 1 Structure of the human retina…………………………………………………………...……1
Figure 1 a. Schematic representation of the human eye……………………………………………….1
Figure 1 b. Cross-section of the human retina………………………………………………………....1
Figure 2 Schematic representation of the human retina……………………………………………….4
Figure 3 Schematic representation of AIPL1protein…………………………………………………..6
Figure 4 Potential AIPL1 photoreceptor functions……………………………………………………8
Figure 5 Schematic illustration of important functional regions of Centromere protein F…………..12
Figure 6 Schematic illustration of CENP-F in cell cycle………………………………………….....13
Figure 7 Western blotting transfer order. Arrow shows direction of transfer ....................................43
Figure 8 pCR®2.1-TOPO-TA vector map with AIPL1 cloned into the TA-site……………………..51
Figure 9 pQE-Tri-System His.Strep 1 vector map and its elements…………………………………52
Figure 10 Multiple cloning site of pQE-TrisSystem His.Strep 1……………………………………..52
Figure 11 Vector map of pQE-Tri-SystemHis.Strep 1 Vector containing AIPL1 splice variants
SV1 - SV5…………………………………………...…………………………………….53
Figure 12 Restriction endonuclease analysis of AIPL1 splice variant pQE-TriSystem 1 His.Strep
clones (SV1 - SV5)……………………………………………………………….....……54
Figure 13 A. Verification of forward frame conservation of the inserts towards start codon of the
vector with chosen restriction site EcoRI…………………………………………….......55
Figure 13 B. Verification of reverse frame conservation of the inserts towards stop codon of the
vector with tags 8x His and Strep along with the chosen restriction site HindIII. ……….55
Figure 14 Coomassie-stained SDS-PAGE analysis of over expressed His tagged AIPL1
(SV1 - SV5) purified by Ni-NTA agarose……………………………..…………......……57
Figure 15 Coomassie-stained SDS-PAGE analysis of His tagged AIPL1 purified by Ni-NTA
agarose and concentrated samples of E2 fractions of (SV1 - SV5)……..………….……...58
Figure 16 A: Ponceau S staining of the nitrocellulose membrane following electrophoretic
transfer of proteins by SDS-PAGE gel separation…..…………………....……………..59
Figure 16 B: Western blot analysis of overexpressed and purified His tagged AIPL1 splice
variants SV1 - SV5 in prokaryotic system………………………………...……………59
Figure 17 Western blot analysis of over expressed and purified His tagged AIPL1 splice variants
(SV1 - SV5) in prokaryotic system………………………………………….……………60
Figure 18 SDS-PAGE of Ni-NTA agarose purified probes (SV1 - SV5) from expression in eukaryotic
HEK293 cell lines...............................................................................................................61

xi
Figure 19 SDS-PAGE of centriprep concentrated probes of AIPL1 SV1 - SV5 from expression in
eukaryotic HEK293 cell lines………………………………………………………….....62
Figure 20 Western blot analysis of AIPL1 splice variants (SV1 - SV5) (Eukaryotic).........................62
Figure 21 Heterologues expression of AIPL1 splice variants in HeLa cells: Immunofluorescent
images showing intracellular localisation of AIPL1 proteins expressed in HeLa cells......65
Figure 22 Heterologous expression of His-tagged AIPL1: Immunofluorescent images showing
cellular localisation of AIPL1 proteins expressed in HeLa cells........................................67
Figure 23 Immunohistochemical detection of intrinsic CENPF expression and transient AIPL1
expression in HeLa cells………………………………………………………………….69
Figure 24 Immunohistochemical detection of intrinsic CENPF expression and transient expression
of His-tagged AIPL1 in HeLa cells…………………………………………………...…...71
Tables
Table 1 List of genes frequently identified underlying LCA and EOSRD………………….3
Table 2 Splicing pattern in AIPL1……………………………………………………….….10
Table 3 Gel mixture……………………………………………………………………….…41
Table 4 Expected sizes of cloned AIPL1 splice variant fragments…………………………..54

1
CHAPTER 1
I. Introduction
The retina is an anatomical component of the eye where light particles are captured and
transmuted into neuronal signals for vision with the help of photoreceptor cells (rods and
cones). In the mammalian retina, rods occupy a share of approximately 90% of photoreceptor
cells and cones occupy the remaining 10%. Rods operate in dim light whereas cones operate
in daylight and perform colour discrimination. The retina is an outpost of the central nervous
system where several genes play a role in retinal dystrophies. Leber Congenital Amaurosis
(LCA) is a subgroup of a set of early onset severe retinal dystrophies (EOSRD) causing
severe visual impairment from birth with legal blindness at the age of 2 years[13]. This study
investigates AIPL1 one of the genes underlying LCA.
Figure 1: Structure of the human retina
a. Schematic representation of the human eye b . Cross-section of the human
retina
a. Schematic representation of the human eye: Light passes through the pupil, lens and
vitreous cavity before reaching the light-sensitive retina. b . Cross-section of the human
retina:
(1) Ganglion cell layer - axons form optic nerve connects the retina to the brain (2) Inner
nuclear layer, which contains second-order neurons, such as bipolar, amacrine and horizontal
cells (3) Outer nuclear or photoreceptor (PR) layer, which contains the cell bodies and nuclei
of the rod and cone PRs (4) PR outer segments, which are densely packed with Opsin-
containing discs and are separated from the inner segments and cell bodies by a narrow 200 –

2
500 nm-long connecting cilium (not visible) (5) Retinal pigment epithelium (RPE), a
monolayer of cells containing tight junctions that separates the neural retina from the choroid,
which supplies blood to the RPE and PRs (outer retina). Notice the inverted orientation, in
which light passes through the nerve fibre layers, inner retinal blood vessels and inner cell
layers before reaching the light-sensitive PRs, which are located close to their blood supply.
[92,105] (Fig reproduced with kind permission of: Nat Rev Genet. 2010 Apr;11(4):273-84.
doi: 10.1038/nrg2717)
1.1 Visual Pigments: Role of rods and cones
In photoreceptors 11-cis retinal, a chromophore is a light sensitive component linked to an
opsin apo-protein. Opsin activates signaling pathways and generates a cellular response to
light. Opsins are G-protein coupled receptors with a binding pocket for 11-cis retinal. The
visual pigment is thus formed when the apo-protein part of the opsin and 11-cis retinal
combine [70]. The apo-proteins are not photosensitive by themselves. Opsins become
photosensitive when 11-cis retinal is attached. Rhodopsin is the visual pigment of rod
photoreceptors. In addition, three types of cone photoreceptors are present in humans, each
one with a specific absorption peak at a wavelength corresponding to red, green, and blue
light [12]. When light strikes the visual pigment, the isomerization of 11-cis retinal to all-
trans retinal in the binding pocket transforms the apo-protein into an active conformation and
initiates phototransduction. While the newly formed all-trans retinal is required for the
activation of opsin all-trans retinal must be released from opsin and fresh 11-cis retinal must
be bound to regain light sensitivity [71].
1.1.1 Visual cycle
The conversion of all-trans-retinal back to 11-cis-retinal requires a complex sequence of
biochemical reactions involving several enzymes and retinoid binding proteins. Collectively,
these reactions are known as the visual cycle or retinoid cycle. These biochemical reactions
take place primarily in the retinal pigment epithelium (RPE). The recovery of 11-cis retinal
during the visual cycle is important to maintain the sensitivity of the visual system [82]
[57,59]. Abnormalities, dysfunction and/or death of retinal photoreceptors constitute the
primary cause of visual impairment or blindness in most of the retinal degeneration diseases,
such as Lebers’s congenital amaurosis (LCA), retinitis pigmentosa and macular degeneration.

3
1.2 Inherited retinal degenerations: Leber Congenital Amaurosis (LCA)
Almost 150 years ago, Theodore Leber [61] described a severe form of vision loss at or near
birth, which was later given his name. LCA accounts for at least 5% of all retinal dystrophies
and is one of the main causes of blindness in children [44,77,84].
Table 1: List of genes frequently identified underlying LCA and EOSRD
Gene Symbol Locus Reference
Retinale Guanylate cyclase 2D GUCY2D LCA1 [76]
Retinal pigment epithelium specific protein 65 kDa RPE65 LCA2 [35]
Spermatogenesis Associated Protein 7 SPATA7 LCA3 [73] [104]
Aryl hydrocarbon receptor interacting protein-like 1 AIPL1 LCA4 [88]
Leber congenital amaurosis 5 LCA5 LCA5 [15]
Retinitis pigmentosa GTPase regulator interacting
protein 1
RPGRIP1 LCA6 [21]
Cone-rod homeobox CRX LCA7 [28]
Crumbs homolog 1 CRB1 LCA8 [18]
Nicotinamide Nucleotide AdenylylTransferase 1 NMNAT1 LCA9 [11,26,53]
[75]
Nephronophthisis 6 NPHP6 ,
CEP290
LCA10 [16]
Inosine monophosphate dehydrogenase 1 IMPDH1 LCA11 [8]
Retinal degeneration 3 RD3 LCA12 [29,79]
Retinol dehydrogenase 12 RDH12 LCA13 [74]
Lecithin retinol acyltransferase LRAT LCA14 [93]
Tubby like protein 1 TULP1 LCA15 [19,68]
Potassium Channel, Inwardly Rectifying, Subfamily
J, Member 13
KCNJ13 LCA16 [85]
The disease was characterized by a reduced or abolished photoreceptor response to light,
wandering nystagmus, and a normal fundus at birth [27] progressing to a typical appearance
of retinitis pigmentosa. There has often been a failure to diagnose LCA because of the normal
appearance of the fundus in the first months of life, leading to the misdiagnosis of cortical
blindness. LCA and related early-onset retinal degenerations are caused by mutations in at

4
least 23 genes (http://www.ncbi.nlm.nih.gov/books/NBK1298/, http://www.retina-
international.org/sci-news/databases/disease-database/leber-congenital-amaurosis/). All these
genes were identified to cause LCA but few of them are rare sometimes identified in very
early onset.
Figure 2: Schematic representation of the human retina - showing photoreceptors (PRs),
muller glia, microglia, astrocytes, and vessels. The outer nuclear layer (ONL) is composed of
the cell bodies of rod and cone PRs, the inner nuclear layer (INL) contains the cell bodies of
several types of neurons (horizontal cells, bipolar cells, amacrine cells) as well as the bodies
of Muller glia. The ganglion cell layer (GCL) contains ganglion cells. Left panel indicates the

5
list of genes underlying LCA. (Fig modfied from : http://www.retina-international.org/sci-
news/databases/disease-database/leber-congenital-amaurosis/)
1.3 Aryl Hydrocarbon receptor Interacting Protein Like 1 (AIPL1)
AIPL1 is the fourth gene linked with LCA [88]. The share of AIPL1 in LCA is about 7 %.
Main features of AIPL1 are three tetratricopeptide repeat (TPR) domains, a poly proline rich
region, and a FKBP506 binding domain.
AIPL1 expression is limited to photoreceptors and the pineal gland, the gene consists of 6
exons which encodes a 384 amino acid protein containing three tetratricopeptide (TPR)
motifs [81,88,97] and belongs to FK506-binding protein (FKBP) family. [88]. Early studies
revealed that AIPL1 is expressed only in rods and performs a function essential for the
maintenance of rod photoreceptor [97]. Further studies revealed the presence of AIPL1 in rod
and cone photoreceptors of the developing human retina but absent from cone photoreceptors
in adult human retina [99]. Later it was disclosed that the presence of AIPL1 is endogenous
in adult mouse and human cones, albeit the expression is very low in cone cells compared to
rod cells [51]. Human AIPL1 protein sequence contains three tetratricopeptide (TPR) motifs,
34 amino acid motifs that are thought to serve as interfaces for protein-protein interactions
[7,20]. TPR motifs are found in proteins that mediate a variety of functions, including protein
trafficking or protein folding. These proteins are usually associated with multiprotein
complexes [7]. In addition, a Proline-rich region is present at the carboxyl-terminus of the
protein, in humans. Similar sequences are found in situations requiring rapid recruitment or
interchange of several proteins, such as signaling cascades or initiation of transcription [46].

6
Figure 3: Schematic representation of AIPL1 protein [62]
(Fig modified from: Biochemistry. 2013 Mar 26;52(12):2089-96. doi: 10.1021/bi301648q.
Epub 2013 Mar 13)
1.3.1 Role of TPR motifs in AIPL1
The presence of TPR motifs downstream from a Peptidylprolyl isomerase (PPIase) domain in
AIPL1 makes it a close relative of the larger members of the FK-506 binding protein (FKBP)
family such as FKBP52 and AIP, which function in the maturation or translocation of steroid
receptors and dioxin, respectively [50,78]. The TPR motif is an evolutionary and functionally
conserved but degenerate motif found in a number of structurally unrelated proteins. It
mediates the binding of specific protein-interaction partners [98]. The TPR motif consists of a
34 aminoacid sequence comprising a pair of anti-parallel alpha helices that are arranged in
large superhelical arrays of tandem repeats, forming a contiguous concave surface suitable
for binding to a peptide ligand. Proteins containing TPR motifs are widely distributed across
multiple classes of proteins involved in a variety of cellular functions [14,87].
The importance of the TPR domain in AIPL1 and its role in protein interactions were
investigated by analyzing the mutations within the TPR domain of AIPL1, located between
amino acid residues 181 and 330. At this site many LCA-associated mutations of AIPL1 were
found [43]. Along with mutations the other aspect which abolished interactions is the removal
of the chaperone TPR acceptor site (residues 329-384) (figure 4).

7
1.3.2 Chaperone role of AIPL1
AIPL1 role as a chaperone was indicated by aligning of AIPL1 with the aryl hydrocarbon
receptor interacting protein (AIP), in which AIPL1 shares 49% similarity with AIP [88]. The
proteins of the FKBP family function as chaperones and typically do not act at the step of
initial polypeptide folding. Rather, these proteins are “specialized chaperons” that assist
specific client proteins in later stages of maturation, subunit assembly, transport, and
degradation [7,9,106]. AIPL1 interacts with the molecular chaperones Hsp70 and Hsp90.
Probing the role of these chaperons in AIPL1 chaperone activity showed that AIPL1
cooperated with Hsp70, but not with Hsp90, to suppress the formation of NUB1 inclusions. It
was shown that AIPL1 may use components of the Hsp70 and Hsp90 chaperone machineries
to fulfill its important photoreceptor-specific functions [37].
1.3.3 Role of phosphodiesterase 6 (PDE6) in retina and influence of AIPL1 on PDE6
In the retina phosphodiesterase 6 (PDE6) is highly represented and controls cytoplasmic
levels of cyclic guanosine monophosphate (cGMP) in outer segments of the rods and cones in
response to light [12]. Retinae lacking AIPL1 showed rod photoreceptor degeneration which
is due to massive reduction of rod cGMP phosphodiesterase (PDE6) subunits (α, β and ) but
the link between AIPL1 and the stability of PDE6 subunits is not known. Ex-vivo pulse label
analysis demonstrated that AIPL1 is not involved in the synthesis of PDE6 subunits [54].
Instead, rod PDE6 subunits are rapidly degraded by proteasomes in the absence of AIPL1.
This rapid degradation of PDE6 is due to the essential role of AIPL1 in the proper assembly
of synthesized individual PDE6 subunits. It was shown that the catalytic subunit (α) of PDE6
associates with AIPL1 in retinal extracts and is needed for the proper assembly of functional
rod PDE6 subunits. [54]

8
Figure 4: Potential AIPL1 photoreceptor functions
(Fig reproduced with kind permission of : Prog Retin Eye Res. Jul 2008; 27(4): 434–449.
doi: 10.1016/j.preteyeres.2008.03.001)
Schematic representation showing potential roles of AIPL1 within photoreceptors. AIPL1 is
able to modulate the nuclear localization of NUB1, which may affect the NUB1 NEDD8 and
FAT10 ‘busting’ activity (1) AIPL1 interacts with and enhances stability of the PDE
holoenzyme (2) AIPL1 may enhance transport and stability of farnesylated proteins to the ER
(3) or other target membranes (4). AIPL1 is likely to utilize the Hsp70 and Hsp90 chaperone
machinery to execute its cellular functions [55].
Through Yeast two-hybrid analysis it was demonstrated that AIPL1 is able to interact with
and aid in the processing of farnesylated proteins in a farnesyltransferase-dependent manner
[98]. Protein prenylation directs protein-membrane interactions and is important for the
maintenance of retinal and photoreceptor cytoarchitecture. AIPL1 may protect the
9
farnesylated protein from proteasomal degradation, or chaperone the targeted translocation of
the farnesylated protein to an appropriate target membrane or to the ER for further
processing.
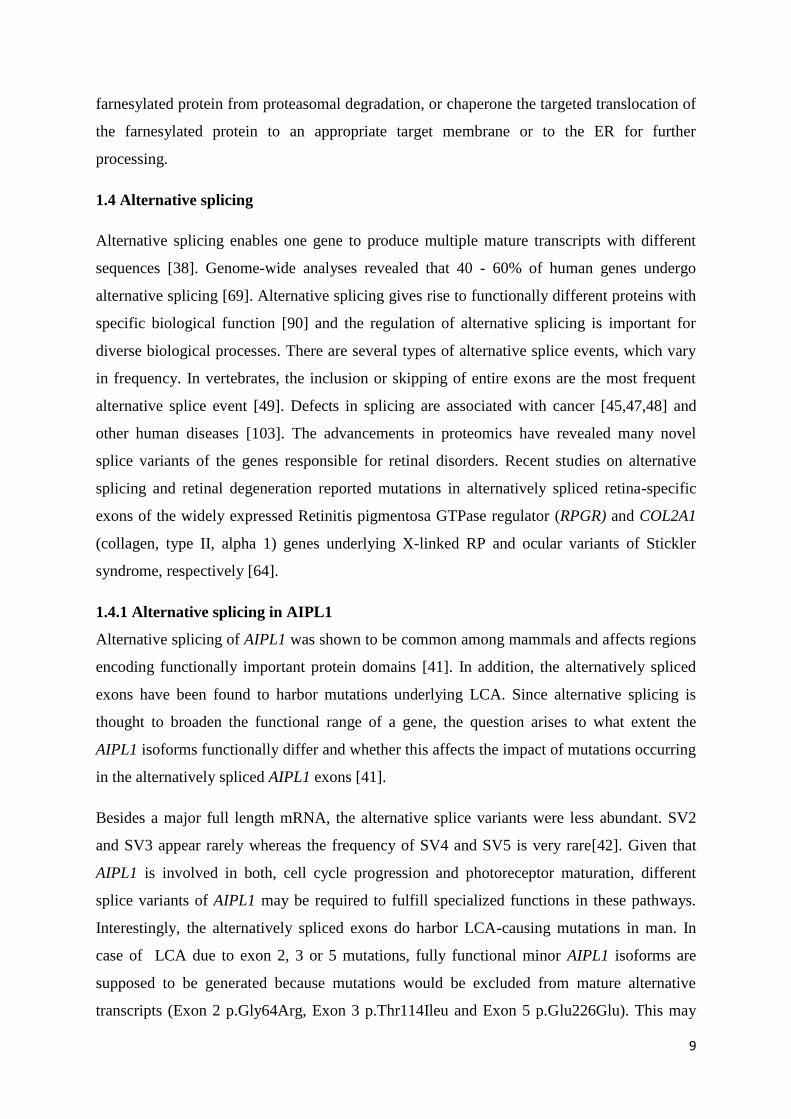
1.4 Alternative splicing
Alternative splicing enables one gene to produce multiple mature transcripts with different
sequences [38]. Genome-wide analyses revealed that 40 - 60% of human genes undergo
alternative splicing [69]. Alternative splicing gives rise to functionally different proteins with
specific biological function [90] and the regulation of alternative splicing is important for
diverse biological processes. There are several types of alternative splice events, which vary
in frequency. In vertebrates, the inclusion or skipping of entire exons are the most frequent
alternative splice event [49]. Defects in splicing are associated with cancer [45,47,48] and
other human diseases [103]. The advancements in proteomics have revealed many novel
splice variants of the genes responsible for retinal disorders. Recent studies on alternative
splicing and retinal degeneration reported mutations in alternatively spliced retina-specific
exons of the widely expressed Retinitis pigmentosa GTPase regulator (RPGR) and COL2A1
(collagen, type II, alpha 1) genes underlying X-linked RP and ocular variants of Stickler
syndrome, respectively [64].
1.4.1 Alternative splicing in AIPL1
Alternative splicing of AIPL1 was shown to be common among mammals and affects regions
encoding functionally important protein domains [41]. In addition, the alternatively spliced
exons have been found to harbor mutations underlying LCA. Since alternative splicing is
thought to broaden the functional range of a gene, the question arises to what extent the
AIPL1 isoforms functionally differ and whether this affects the impact of mutations occurring
in the alternatively spliced AIPL1 exons [41].
Besides a major full length mRNA, the alternative splice variants were less abundant. SV2
and SV3 appear rarely whereas the frequency of SV4 and SV5 is very rare[42]. Given that
AIPL1 is involved in both, cell cycle progression and photoreceptor maturation, different
splice variants of AIPL1 may be required to fulfill specialized functions in these pathways.
Interestingly, the alternatively spliced exons do harbor LCA-causing mutations in man. In
case of LCA due to exon 2, 3 or 5 mutations, fully functional minor AIPL1 isoforms are
supposed to be generated because mutations would be excluded from mature alternative
transcripts (Exon 2 p.Gly64Arg, Exon 3 p.Thr114Ileu and Exon 5 p.Glu226Glu). This may

10
attenuate the resulting disease phenotype in comparison with mutations occurring in
constitutively spliced exons (Exon 2 p.W178* and Exon 5 p.Gly262Ser). Recently the
prevalence of sequence variants in AIPL1 was presented [95]. The study investigated the
likelihood of disease causation of the identified variants, subsequently undertaking a detailed
assessment of the phenotype of patients with disease causing mutations. The study reported
that despite the associated phenotype being characterized by early onset severe visual loss in
patients there was some evidence of a degree of retinal structure and functional preservation,
which was most marked in the youngest patient. It was suggested that there are patients who
have a reasonable window of opportunity for gene therapy in childhood. The identified splice
variants of AIPL1 present transcriptional in–frame deletions of the protein coding region,
presumably
giving rise to different isoforms of the AIPL1 protein. Interestingly, the
alternative splicing events seem to affect important protein functions since the peptidyl–
prolyl–isomerase domain and the binding site of cell cycle regulator NUB1 are involved
[2,40].
1.4.2 Splicing pattern in AIPL1
Gene expression analysis with qPCR revealed the presence of six different splice variants in
AIPL1 [41].
Splice
variant Sequence features (skipped peptide)
% of total
transcript* ORF length
MW of predicted
isoform
1 All 6 exons included 50-80 1.155 bp / 384 aa 43.9 kd
2 Exclusion of exon 2 (aa 33-92) 10-20 975 bp / 324 aa 36.8 kd
3 Exclusion of exon 3 (aa 93-155) 10-20 966 bp/ 321 aa 35.0 kd
4 Exclusion of exon 5 part (aa 215-238) 5-10 1.083 bp / 360 aa 40.9 kd
5 Exclusion of exon 2 part (aa 33-54) Rare 1.089 bp / 362 aa 41.2 kd
6 Exclusion of exon 2 part (aa 33-40),
Exclusion of exon 5 part (aa 215-238) Very rare 1.059 bp / 352 aa 39.9 kd
*estimated from RT-PCR and cloning frequency
Table 2: Splicing pattern in AIPL1

11
1.5 Centromere Protein F
The centromere is an essential structure that is required for the accurate segregation of
genetic material during mitosis and meiosis. It serves as a platform upon which the
kinetochore assembles, thus, it is a vital structure for mitotic spindle attachment that is
required to guide chromosomal movements during cell division [32]. CENP-F, also named as
mitosin, is a large human protein of 3113 amino acid residues initially identified as cell-cycle
dependent kinetochore-associated protein in human cells using human autoimmune serum
[83]. Its expression and localization is cell cycle dependent [22]. The protein level is low in
G1 phase but elevated from S to early M phase [110].
CENP-F is a large protein interacting with different partners through distinct protein
domains. It posses 11 leucine zipper motifs [110], which are potential dimerization motifs
found in DNA-binding proteins [60]. Several such motifs in the C-terminus are involved in
its kinetochore-targeting and interaction with Activating Transcription Factor 4 (ATF4)
[107,108]. Residues 2961-3001 of CENP-F bind to Retinoblastoma protein(Rb) [5,110]
whereas residues 2930-2958 contain a strong nuclear localization signal (NLS) [109].

12
Figure 5: Schematic illustration of important functional regions of CENP-F [101]
(Fig reproduced with kind permission of : Chromosoma. 2006 Aug;115(4):288-95. Epub
2006 Mar 25)
CENP-F encodes a protein that associates with the centromere-kinetochore complex [66,101].
The protein is a component of the nuclear matrix during the G2 phase of interphase. In late
G2, the protein associates with the kinetochore and maintains this association through early
anaphase. Small GTpase Rab5 takes part in chromosome congression and regulates
localization of CENP-F to the kinetochores [86]. CENP-F localizes to the spindle midzone
and the intracellular bridge in late anaphase and telophase, respectively, and is predicted to be
subsequently degraded [63].The localization of this protein suggests that it may play a role in
chromosome segregation during mitotis. It is thought to form either a homodimer or
heterodimer. CENP-F represents the first transiently associated kinetochore protein that has
been identified acting as an antigen in autoimmune disease [83]. Autoantibodies against this
protein have been found in patients with cancer or graft versus host disease [10].

13
Figure 6: Schematic illustration of CENP-F in cell cycle
(Fig according to: Ref: http://www.ncbi.nlm.nih.gov/gene/1063)
1.5.1 Leucine Zipper Motifs role in protein interactions
In mitosin/CENP-F family proteins, one of the striking structural characteristics is the
richness in leucine zipper motifs [33,63,109]. These motifs may mediate protein-protein
interactions with other proteins. Leucine heptad repeats are frequently involved in protein-
protein interactions and are found three times in the mitosin C terminus. The C terminus of
mitosin is essential for its role in influencing cell cycle progression [110]. They may regulate
the signaling for kinetochore localization by conveying a conformational change within
mitosin. Removal of the region containing the leucine heptad repeats abolishes the
homodimerization and heterodimerization capacity of the C terminus. Protein-protein
interactions via leucine heptads in the C terminus may regulate the signaling for kinetochore
localization by conveying a conformational change within mitosin.
Nuclear matrix
G2 phase of Interphase
Late G2 to Early anaphase
Late anaphase and telophase
Localization Intracellular bridge
CENP-F
Protein
CENP-F
CENP-F
CENP-F
Degraded
Centromere
Kinetochore
Kinetochore
Spindle midzone

14
1.6 Relationship between AIPL1 and cell cycle regulatory proteins
During photoreceptor maturation, retinal degeneration observed in LCA patients with AIPL1
mutations may result from a defect in the regulation of cell cycle progression. AIPL1
interaction with NUB1 may function in the regulation of cell cycle progression and mutation
in AIPL1 may lead to photoreceptor cell death by disrupting the normal regulation of the cell
cycle [1]. The expression of AIPL1 in developing photoreceptors and the early onset of
vision loss in patients with LCA suggests that AIPL1 function is critical during the period of
rod and cone photoreceptor development [99].
For maintenance of the retinal cytoarchitecture and photoreceptor structure, protein
modification by prenylation is essential in vision. AIPL1 interacts with farnesylated proteins
and is important in the processing of farnesylated proteins in the retina [81]. Farnesylation is
a specific type of prenylation, the addition of a farnesyl or geranylgeranyl residue to specific
proteins. Several retinal proteins, cGMP phosphodiesterase (PDE), transducin, and rhodopsin
kinase (RK) are known to be farnesylated [3,30,39,58]. The second possible role of AIPL1 is
the control of photoreceptor proliferation and differentiation. AIPL1 plays a dual role during
retinal development, regulating retinal progenitor cell proliferation and or cell fate
specification during early stages of development and rod morphogenesis during later stages
of development. This hypothesis is consistent with the severity and timing of onset of the
AIPL1-associated LCA in children.

15
1.7 Aim of the study:
Previous studies of Aryl hydrocarbon interacting protein like 1 (AIPL1) revealed several
splice variants at the mRNA level of AIPL1 in human tissue samples [41]. In these studies
the splice variants could not be resolved at the protein level. Here a differentiation of the
splice variants at the protein level was approached by separated expression of cloned splice
variants compared to human tissue samples.
Further an interaction with the cell cycle regulator protein NUB1 (NEDD8 Ultimate Buster
1), which plays a role in controlling many biological events, particularly cell cycle
progression, by down regulating NEDD8 expression was reported[1]. Yeast two hybrid
studies identified the C-terminal portion of another cell cycle protein - Centromere protein F
(CENP-F) - to interact with AIPL1 [41]. Interaction of AIPL1 and CENP-F would support an
early onset of disease like in LCA. In addition, various molecular features of both AIPL1 and
CENP-F further supported such an interaction. Investigations of an interaction between these
two proteins using both prokaryotic and eukaryotic models were approached using expression
of AIPL1 in human cell lines with intrinsic expression of the housekeeping gene CENP-F.
16
CHAPTER 2
2. MATERIALS AND METHODS
2.1 Materials
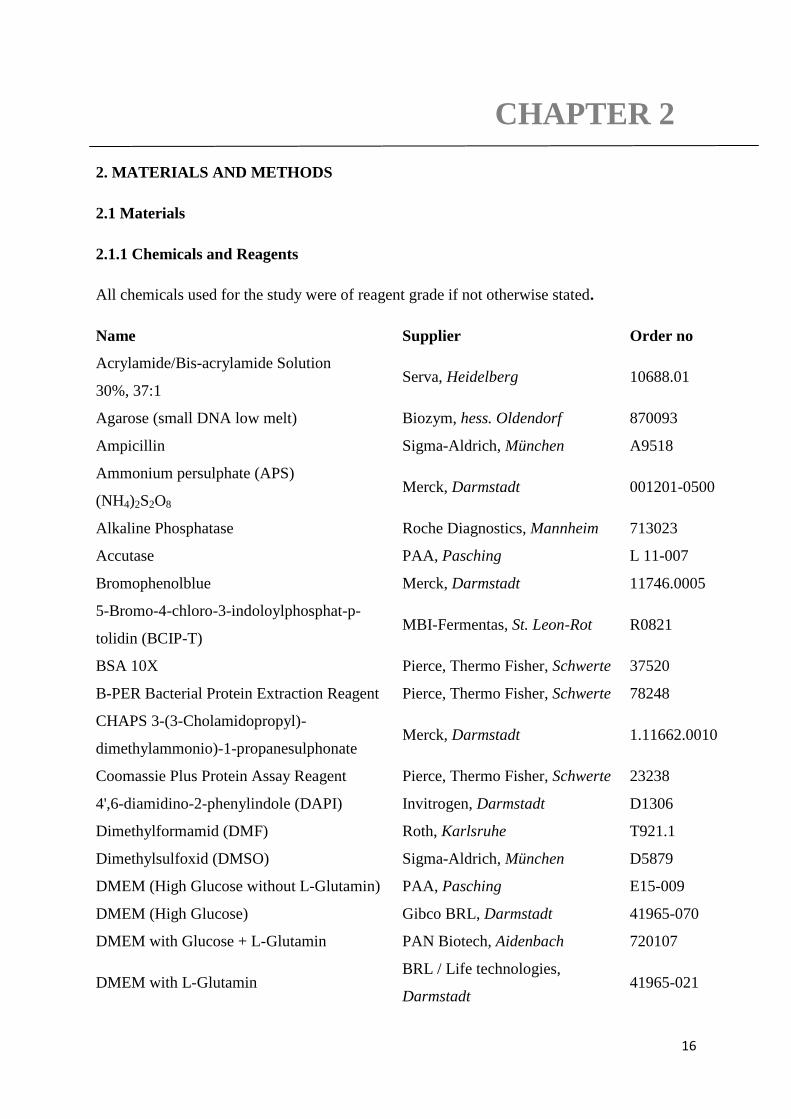
2.1.1 Chemicals and Reagents
All chemicals used for the study were of reagent grade if not otherwise stated.
Name Supplier Order no
Acrylamide/Bis-acrylamide Solution
30%, 37:1 Serva, Heidelberg 10688.01
Agarose (small DNA low melt) Biozym, hess. Oldendorf 870093
Ampicillin Sigma-Aldrich, München A9518
Ammonium persulphate (APS)
(NH4)2S2O8 Merck, Darmstadt 001201-0500
Alkaline Phosphatase Roche Diagnostics, Mannheim 713023
Accutase PAA, Pasching L 11-007
Bromophenolblue Merck, Darmstadt 11746.0005
5-Bromo-4-chloro-3-indoloylphosphat-p-
tolidin (BCIP-T) MBI-Fermentas, St. Leon-Rot R0821
BSA 10X Pierce, Thermo Fisher, Schwerte 37520
B-PER Bacterial Protein Extraction Reagent Pierce, Thermo Fisher, Schwerte 78248
CHAPS 3-(3-Cholamidopropyl)-
dimethylammonio)-1-propanesulphonate Merck, Darmstadt 1.11662.0010
Coomassie Plus Protein Assay Reagent Pierce, Thermo Fisher, Schwerte 23238
4',6-diamidino-2-phenylindole (DAPI) Invitrogen, Darmstadt D1306
Dimethylformamid (DMF) Roth, Karlsruhe T921.1
Dimethylsulfoxid (DMSO) Sigma-Aldrich, München D5879
DMEM (High Glucose without L-Glutamin) PAA, Pasching E15-009
DMEM (High Glucose) Gibco BRL, Darmstadt 41965-070
DMEM with Glucose + L-Glutamin PAN Biotech, Aidenbach 720107
DMEM with L-Glutamin BRL / Life technologies,
Darmstadt 41965-021

17
Ethidium bromide Sigma-Aldrich, München E 8751
Ethylenediaminetetraacetic acid (EDTA) Roth, Karlsruhe 8043.2
ECL Plus Western Blotting Detection
Reagents GE Healthcare, Solingen RPN2209
Ethanol abs. p.A., 99.8% (C2H6O) Roth, Karlsruhe 9065.2
Formaldehyde (CH2O) Merck, Darmstadt 1.04003.1000
Formamid (CH3NO) Merck, Darmstadt 822279.100
Fluorescence Mounting Medium DAKOCytomation, Hamburg S3023
Glycerine (C3H8O3) Roth, Karlsruhe 7530.1
Glycin (C2H5NO2) Roth, Karlsruhe 3908.2
Hydrochloric acid (HCL) Merck, Darmstadt 1.00317.1000
Imidazol (C3H4N2) Merck, Darmstadt 8.14223.0250
Isopropyl β-D-1-thiogalactopyranoside
(IPTG) MBI-Fermentas, St. Leon-Rot R0392
Isopropanol (C3H8O) Roth, Karlsruhe 6752.1
Kannamycin Sigma-Aldrich, München K1377
Lipofectamine® LTX and PLUS
TM Reagents Invitrogen, Darmstadt 15338-100
Lumi-Phos WB Chemiluminescent Substrate
(AP) Pierce, Thermo Fisher, Schwerte 34150
Luminol Sigma-Aldrich, München A4685
Luria Broth Base Invitrogen, Darmstadt 12795027
Lysozyme Sigma-Aldrich, München L 6876
3-(N-morpholino) propanesulfonic acid
(MOPS, C7H15NO4S) Fluka, München 69947-100G
Methanol (CH4O) Roth, Karlsruhe 4627.2
M-PER Mammalian Protein Extraction
Reagent Pierce, Thermo Fisher, Schwerte 78503
Sodium Chloride (NaCl) Merck, Darmstadt 1.06404.5000
4 Nitroblue-tetrazolium chloride (NBT) MBI-Fermentas, St Leon-Roth R0841
Sodium hydroxide (NaOH) Roth, Karlsruhe 6771.1
Nitrocellulose Transfer Membrane
300 mm x 3 m, 0.2 µm Whatman, Dassel 10401396
NucleoSpin Extract II Macherey Nagel, Hilden 740609.250

18
Phenol (C6H5OH) Roth, Karlsruhe 0038.1
Paraformaldehyde Merck, Darmstadt 8.18715.0100
Ponceau S Solution Sigma-Aldrich, München P 7170
Para Hydroxy Coumarin acid (C9H8O3) Sigma-Aldrich, München C9008
Roti Load 1 reducing Roth, Karlsruhe K929.1
Roti load 2 Non reducing Roth, Karlsruhe K930.1
Sodium dodecyl sulphate (SDS), Ultra pure Roth, Karlsruhe 232601
Tetracycline Sigma-Aldrich, München T3383
Tetra methylene diamine (TEMED) Roth, Karlsruhe 2367.01
Thiourea (CH4N2S) Roth, Karlsruhe HN37.2
Triton X-100 Roth, Karlsruhe 3051.3
Tris (hydroxymethyl) aminomethane Merck, Darmstadt 1.08382.2500
Tween 20 Roth, Karlsruhe 9127.1
Xylenecyanol Merck, Darmstadt 10590.0005
Xylol (C8H10) Roth, Karlsruhe 9713.3
2.1.2 Oligonucleotides
Primers for PCR
Gene Primer Nr Seq
AIPL1 AIPL1-For 787 GATCCGAATTCGCATGGATGCCGCTCTGCTC
AIPL1 AIPL1-Rev 788 TGGTGAAGCTTGTGCTGCAGCGAGTGCCCTG
2.1.3 Vectors
Vector Order no
pCR2.1 TOPO Invitrogen, Darmstatd K4560.01 TA cloning
pQE-TriSystem His-Strep 2 Qiagen, Hilden 32942 Over expression
pCMV6-AC-GFP Origene, Rockville, USA PS100010 Expression mammalian cells

19
2.1.4 Cell lines
HEK293 Cell line LGC standards (ATCC), Wesel CRL-1573
HeLa Cell line LGC standards (ATCC), Wesel CCL-2.1
2.1.5 Competent cells
Type of cells Genotype Supplier Order no
E.Coli XL1 Blue recA1 endA1 gyrA96 thi-1 hsdR17 supE44
relA1 lac [F´ proAB lacIqZΔM15 Tn10 (Tetr)]
Stratagene,
Heidelberg 200249
E.Coli M15 NaI
S, Str
S, Rif
S, Thi
-, Lac
-, Ara
+, Gal
+, Mtl
-, F
-,
RecA+, Uvr
+, Lon
+.
Qiagen,
Hilden 34210
One Shot® TOP10
cocompTM
E.coli
electrocomp. E.coli
F- mcrA Δ(mrr-hsdRMS-mcrBC)
φ80lacZΔM15 ΔlacX74 recA1 araD139
Δ(ara-leu)7697 galU galK rpsL (StrR) endA1
nupG
Invitrogen,
Karlsruhe
C 4040-52
2.1.6 Enzymes
Function Enzyme Supplier Order no
DNA-
Amplification
Phusion® Hot Start II
DNA Polymerase
Thermo Scientific,
Schwerte
F-549S
DNA-Restriction EcoRI NEB, Frankfurt R0101
HindIII NEB, Frankfurt R0104
DNA-Ligation T4-DNA-Ligase NEB, Frankfurt M0202S

20
2.1.7 Antibodies
Antibody Lable Host Type Supplier Order No
Mouse polyclonal to AIPL1 Mouse Polyclonal Abcam,
Cambridge, UK
ab68636
His Ab-Rabbit polyclonal to 6X His tag HRP Rabbit Polyclonal Abcam,
Cambridge, UK
ab 1187
Chicken anti human AIPL1 Chicken Polyclonal,
Egg yolk
Davids Biotech,
Regensburg
Anti-Human Full length AIPL1 Ab Rabbit Polyclonal,
Serum
[81]
Anti-Human C-terminus CENP-F Ab Rabbit Polyclonal Santa Cruz
Biotechnology,
Heidelberg
sc-22791
Anti-Rabbit IgG (whole molecule) –
peroxidase conjugated
HRP Goat Sigma-Aldrich,
München
A0545
Anti-Mouse IgG (whole molecule) HRP Rabbit Sigma-Aldrich,
München
A9044
Anti-Chicken IgY (IgG) (whole molecule) HRP Rabbit Sigma-Aldrich,
München
A 9046
Donkey anti-rabbit IgG (H+L) Alexa
Fluor 488
Donkey Invitrogen,
Darmstadt
A21206
Goat anti-chicken IgG (H+L) Alexa
Fluor 488
Goat Invitrogen,
Darmstadt
A11039
Goat IgG anti-chicken IgY Alexa
Fluor 564
Goat Invitrogen,
Darmstadt
A11040
Goat anti-rabbit IgG (H+L) Alexa
Fluor 546
Rabbit Invitrogen,
Darmstadt
A11010

21
Goat anti- mouse IgG (H+L) Alexa
Fluor 488
Mouse Invitrogen,
Darmstadt
A11001
2.1.8 BUFFERS
10x PBS 1.37 M NaCl (80g/l)
27 mM KCl (2g/l)
100 mM Na2HPO4 (14.4g/l)
18 mM KH2PO4 (2.4 g/l)
ad 1 l Aq. dest
pH adjusted to 7.2 with HCl
Sterilized and autoclaved.
5x SDS-PAGE sample buffer
0.225 M Tris (2.72g/100 ml)
50% glycerol (50ml/100 ml)
5% SDS (5g/100 ml)
0.05% bromophenol blue (0.05g/100 ml)
0.25 M DTT (3.8 g/100 ml)
dissolved in Aq. bidest, pH 6.8
22
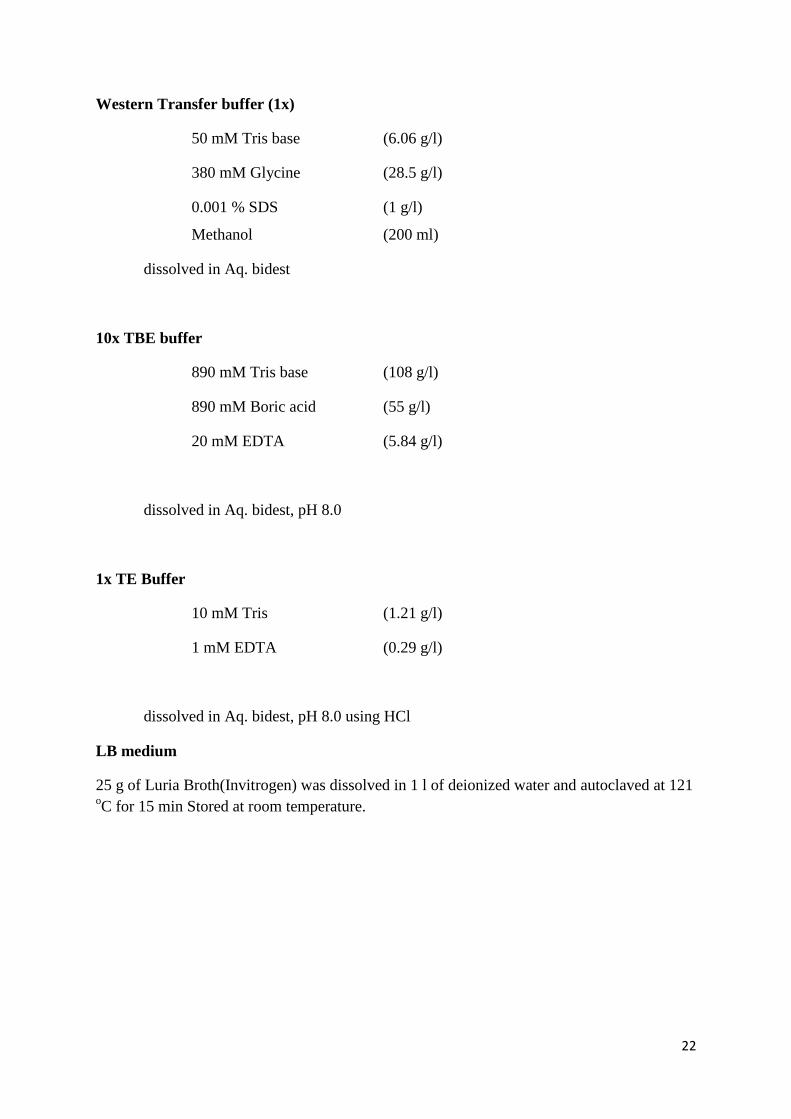
Western Transfer buffer (1x)
50 mM Tris base (6.06 g/l)
380 mM Glycine (28.5 g/l)
0.001 % SDS (1 g/l)
Methanol (200 ml)
dissolved in Aq. bidest
10x TBE buffer
890 mM Tris base (108 g/l)
890 mM Boric acid (55 g/l)
20 mM EDTA (5.84 g/l)
dissolved in Aq. bidest, pH 8.0
1x TE Buffer
10 mM Tris (1.21 g/l)
1 mM EDTA (0.29 g/l)
dissolved in Aq. bidest, pH 8.0 using HCl
LB medium
25 g of Luria Broth(Invitrogen) was dissolved in 1 l of deionized water and autoclaved at 121 oC for 15 min Stored at room temperature.

23
2.1.9 READY KITS
Name Supplier Order no
OneStep RT-PCR Kit Qiagen, Hilden 210210
Long range two step RT-PCR kit Qiagen, Hilden 205922
TOPO-TA Cloning Kit Invitrogen, Darmstadt K4560-01
Illustra triplePrep Kit GE Healthcare, Solingen 28-9454-34
Just Spin Gel Extraction Genaxxon Bioscience, Ulm S5337.0250
Ni-NTA agarose Qiagen, Hilden 30210
Espresso tabletised media sets Enbase, Biosilta, Oulu, Suomi ENP1000
Pierce®
BCA Protein Assay Kit Thermo Scientific, Schwerte 23236
His Mag Sepharose Ni GE-Healthcare, Solingen 28-9799-17
6x DNA Loading Dye Fermentas, St. Leon-Rot #R0611
Resuspension Buffer S1 Macherey-Nagel, Hilden 740516.1
Lysis Buffer S2 Macherey-Nagel, Hilden 740517.1
Neutralization Buffer S3 Macherey-Nagel, Hilden 740518.1
Qiagen Plasmid Mini Kit Qiagen, Hilden 12123
QIAfilter Plasmid Midi Kit Qiagen, Hilden 12243
Qiagen Plasmid Maxi Kit Qiagen, Hilden 12163
NucleoSpin Extract II Macherey-Nagel, Hilden 740609.250
2.1.10 Molecular weight standards
Name Supplier Order no
SpectraTM
Multicolor Broad Range Fermentas SM1841
GeneRuler 1kb DNA Ladder Fermentas SM3011

24
2.2 Equipment and devices
Function Type Supplier
Blotelutor B44 Biometra®, Göttingen
Centrifuge 4K15 Sigma, Osterode, Harz
Rotor 12169-H
Centrifuge 1-15 PK Sigma, Osterode, Harz
Rotor 12024-H
Electrophoresis chambers Compact S Biometra®, Göttingen
Electrophoresis power supply Model PS9009 Biometra®, Göttingen
Balances ALC models 98648-012-74 ACCULAB, Sartorius, Göttingen
Fluorescence microscope BZ-8100E Keyence, Neu-Isenburg Hessen
Geldryer Mididry D62 Biometra® , Göttingen
Inverted Microscope Model IT400 VWR, Darmstadt
Incubator CO2 Incubator C150 Binder , Tuttlingen
Ice machine AF80 Scotsman, Berlin
Laminar air flow MSC ADVANTAGE 1.2 Fischer scientific , Langenselbold
Photometer Biophotometer Eppendorf, Hamburg
Mini Centrifuge MCF-2360 LMS, Tokyo, Jp
ROTATOR STR4 Stuart Scientific, Chelmsford, UK
Magnetic stirrer RCT CL IKAMAG®
RCT CLASSIC,
Staufen
Mini Rocking Platform WT16 Biometra®, Göttingen
Mini-Tumbling Table WT17 Biometra®, Göttingen
Multiporator®
Electrofusion Eppendorf, Hamburg
Themocycler T Professional Basic Biometra®, Göttingen
T-Professional Gradient
Power Pack P25 T Biometra®, Göttingen
Polyacrylamide Gel
electrophoresis Apparatus
Minigel-Twin Biometra®, Göttingen
PAGE Apparatus for precast
gels
E260 SERVA, Heidelberg
Homogenizer Precellys®
peQLab Biotechnologie, Erlangen

25
Shaker CERTOMAT® MO II Sartorius, Göttingen
Blockthermostat TB2 Thermoblock Biometra®, Göttingen
Thermomixer Thermomixer Comfort Eppendorf, Hamburg
UV-Illuminator BioDoc Analyze Gel
Analysis (BDA)
Biometra®, Göttingen
Water bath TW12 Julabo, Seelbach
2.2.1 Computer aided data processing
Software Web links
Chromas lite http://www.mybiosoftware.com/sequence-analysis/1979
Gentle http://gentle.magnusmanske.de/
Vector NTI 11 http://de-de.invitrogen.com/site/de/de/home/Products-and-
Services/Applications/Cloning/vector-nti-software.html
Image J http://imagej.en.softonic.com/
CLC work bench 6 http://www.clcbio.com/products/clc-genomics-workbench/
BZ-II Analyzer http://www.keyence.de/

26
2.3 Methods of molecular biology
2.3.1 Polymerase chain reaction (PCR)
The polymerase chain reaction (PCR) is used to amplify DNA to generate millions of copies
of a particular DNA sequence. PCR relies on thermal cycling, consisting of cycles of repeated
heating and cooling of the reaction for DNA melting and enzymatic replication of the DNA.
Primers (oligonucleotides) complementary to the margins of the target sequence along with a
DNA polymerase are key components to enable selective and repeated amplification. Almost
all PCR applications employ a heat-stable DNA polymerase, such as Taq polymerase, an
enzyme originally isolated from the bacterium Thermus aquaticus. The PCR involves three
temperature incubation steps that are repeated. In the first step called denaturation, the two
strands of the target DNA molecule are separated (denatured) by heating the DNA up to 98
°C. This breaks the hydrogen bonds between the bases, yielding two separate strands. In the
second step, called annealing, two primers forward and reverse hybridize to complementary
sequences on the single strands. Annealing temperatures range between 50 °C and 72 °C.
During the third step, called extension, the primers are extended by a thermostable DNA
polymerase at 72 °C. As PCR progresses, the DNA generated itself is used as a template for
replication, setting in motion a chain reaction in which the DNA template is exponentially
amplified. PCR can be extensively modified to perform a wide array of genetic
manipulations. PCR amplified DNAs, were used for cloning to generate recombinant
molecules. Further used to study the functional genomics, gene expression, protein structure–
function relationships and protein-protein interactions.

27
Phusion® Hot Start II
Component 20µl reaction Final conc.
Aq. bidest 13.4µl
5x Phusion® HF Buffer 4 µl 1 x
10 mM dNTPs 0.4 µl 200 µM each
Primer a (AIPL1-F) 0.5 µl 0.5 µM
Primer b (AIPL1-R) 0.5 µl 0.5 µM
Template DNA 0.4 µl (150 ng/µl)
DMSO 0.6 µl (3%)
Phusion® Hot Start II
DNA Polymerase (2 U/µl) 0.2 µl 0.02 U/µl
Cycle step Temp. Time Cycles
Initial denaturation 98oC 30 s 1
Denaturation
Annealing
Extension
98oC
60oC
72oC
5-10 s
30 s
40 s
30
Final extension 72
oC
4oC
10 min
Hold 1

28
2.3.2 Agarose gel electrophoresis
Gel electrophoresis is the standard lab procedure for separating DNA by size for visualization
and purification.
Preparation of a Standard 1% Agarose Gel
1g of agarose powder was mixed in an Erlenmeyer flask along with 100 ml of 1x TBE buffer.
The flask was heated in microwave for 2 min until the agarose was completely dissolved.
Later agarose solution was cooled down for 5 min and ethidium bromide (EtBr) was added to
a final concentration of approximately 0.3 μg/ml. EtBr binds to the DNA and allows
visualization of the DNA under ultraviolet (UV) light. Agarose was poured into a gel tray
with the well comb and placed the gel at 4 °C for 15 minutes until it had completely
solidified.
Loading Samples and Running an Agarose Gel
To all the samples 6x DNA Loading dye (Fermentas) at 20% of the sample volume was
added and vortexed. Once solidified, the agarose gel was placed into the gel chamber
(electrophoresis unit) and filled with 1x TBE buffer until the gel was covered. Molecular
weight ladder of 350 ng was loaded into the first lane of the gel followed by samples into
the additional wells of the gel. Gel run was carried at 100 V for 1 h until the dye line was
approximately 80% of the way down the gel. Then the gel was carefully removed from the
gel chamber. DNA fragments were visualized using the BioDocAnalyze Gel Analysis (BDA)
with UV light.
2.3.3 Isolation of DNA from agarose gels
For isolation of DNA from agarose gels, Genaxxon’s justSpin® columns were chosen due to
the following advantages.
The columns did not require special agaroses. No melting or lysation procedures are
necessary to dissolve the agarose. There was no requirement of additional buffers or
solutions, vacuum manifolds or repeated centrifugation procedures. No desalting procedures
were necessary and the columns could be used for small- and big-sized DNA.

29
The isolated DNA could be used directly for subsequent experiments.
The DNA band was excised from the agarose gel with a clean, sharp scalpel (as the volume
of the elute is proportional to the gel slide dimensions, the excised gel block was kept as
small as possible). The excised agarose slice was placed in the spin column on top of the
column media in a 1.5 ml tube. The tube was placed in a centrifuge (Sigma, type model 1-
15PK, rotor 12024-H) and centrifuged at 5867 g for 10 min at room temperature. The elute
containing the DNA could be used directly for cloning experiments or other applications
without further purification or precipitation steps.
2.3.4 Cloning
PCR products were cloned into plasmid vectors using specific restriction endonuclease sites.
Isolated vector plasmid DNA was digested by restriction enzymes and analyzed by gel
electrophoresis. Glycerol stocks were prepared for positive clones.
2.3.4.1 Restrictionendonuclease digestion
Double stranded DNA molecules hydrolyze at specific sites with the help of restriction
endonucleases. Endonucleases recognize specific sequences in a DNA sequence and cut at
these sites in a reproducible fashion hydrolyzing the backbone of DNA between deoxyribose
and phosphate groups. Amplification of DNA was done with a primer set possessing an
EcoRI site in the forward and a HindIII site in the reverse primer. Amplified PCR products
were cloned into the expression vector digested with the same restriction sites EcoRI and
HindIII. Restriction digestion of recombinant DNA with EcoRI and HindIII confirmed the
presence of all the inserts and the vector backbone.
Reaction mix – Table
Sample 7.5 µl
Restriction endonuclease 1 (5 U) 0.5 µl
Restriction endonuclease 2 (5 U) 0.5 µl
Restriction buffer 1.0 µl
Aq. Bidest 10.5 µl
Total 20.0 µl

30
Restrictionendonuclease digestion was carried out for 1 hr at 37 °C the temperature optimum
of endonucleases.
2.3.4.2 Dephosphorylation
To prevent self ligation of a vector dephosphorylation was carried out using Antartic
phosphatase.
Restriction digestion mix 20 µl
Antartic phosphatase (5U) 1 µl
Antartic phosphatase buffer 2.5 µl
Aq. Bidest 1.5 µl
Total 25.0 µl
Dephosphorylation was carried out for 30 min at room temperature. For inactivating the
restriction enzyme the assay was kept in a heat block at 65 °C for 5 min.
2.3.4.3 Ligation
Two crucial procedures in cloning are ligation of insert to the vector DNA and transformation
of the ligation product i.e. the recombinant molecule into bacteria. Ligation was
accomplished using the enzyme DNA ligase, usually from the bacteriophage T4. It requires
ATP and magnesium ions to catalyze the formation of phosphodiester bond between
juxtaposed 5’ phosphate and 3’ hydroxyl termini in double-stranded DNA or RNA. T4 DNA
ligase will join blunt end and cohesive end termini as well as repair single stranded nicks in
duplex DNA, RNA or DNA/RNA hybrids.

31
Reaction mix – Table
Vector 1.0 µl
Insert 5.0 µl
5 X ligase buffer 4.0 µl
T4 DNA ligase 1.0 µl
Aq. Bidest 9.0 µl
Total 20.0 µl
Ligation was carried out at room temperature for 1 hour.
2.3.4.4 Transformation
2.3.4.5 Preparation of competent bacterial cells
In a 15 ml reaction tube 5 µl Glycerol stock (XL1-Blue) and 5 ml LB medium as given in
(2.1.8) supplemented with a bacterial strain specific antibiotic (tetracycline resistance coded
on the F plasmid) were incubated at 37 °C for overnight in an orbital shaker at 180 rpm.
100 ml LB medium in a 500 ml Erlenmeyer flask supplemented with the required antibiotic
were inoculated with 2 ml overnight culture and were grown at 37 °C and 180 rpm in an
orbital shaker for 2 hours until an OD600 of 0.6 was reached. The OD600 was tested for every
30 minutes using a spectrophotometer. Later, the cell suspension was filled into 50 ml tubes
and kept on ice for 30 min. Subsequently the reaction tubes were placed in a centrifuge
(Sigma, model 4K15, rotor 12169-H) and centrifuged at 5100 g for 5 min at 4 °C. Afterwards
the supernatant was discarded.
The pellet was resuspended in 50 ml ice cold 1 mM HEPES and centrifuged at 5100 g for 5
min at 4 °C. The supernatant was discarded and the pellet resuspended in 25 ml cold 1 mM
HEPES. The pellet was centrifuged for 5 min at 5100 g and 4 °C. The supernatant was
discarded, and the pellet was resuspended in 10 ml cold 10% glycerine.
Centrifugation was repeated and the pellet was resuspended in 5 ml cold 10% glycerine.
After a further centrifugation the pellet was resuspended in 1 ml cold 10 % glycerine. The
cells could be used directly for transformation. 100 µl aliquots were prepared from the rest of

32
the cell suspension and froze them in liquid nitrogen and stored at -80 °C for later
applications.
2.3.4.6 Bacterial transformation by electroporation:
Plasmid DNA was diluted to 5 ng/µl with Aq. bidest, and competent cells were thawed on
ice. 1.5 µl (7.5 ng DNA) were incubated with 50 µl competent E.coli cells on ice in 0.2 ml
tubes for 15 - 30 min. Electroporation cuvettes were cooled on ice. After incubation, the
suspension was filled into the cooled (cuvettes avoiding any air bubbles). The transformation
was performed at 2000 V using a multiporator (Eppendorf), and the transformed sample was
flushed out of the cuvette with 1 ml LB-medium into a 1.5 ml tube. The transformed sample
was incubated at 37 °C for 1 hour, 180 rpm and 100 µl of the sample was plated on LB-Agar
supplemented with vector specific antibiotic. LB-agar plates were incubated overnight at 37o
C
2.3.5 Preparation of plasmid DNA
2.3.5.1Preparation of plasmid DNA (Miniprep)
Overnight cultures were prepared by picking bacterial colonies from an LB plate into 5 ml of
LB medium supplemented with appropriate antibiotics. Bacterial cultures were incubated
overnight at 37 °C with shaking.
DNA was extracted from 1.5 ml of bacterial culture using the Macherey and Nagel Mini Prep
buffers. Bacterial culture was taken into a 1.5 ml reaction tube and pelleted at 5000 g for 5
min in a centrifuge. The supernatant was discarded and the pellet was resolved in 100 µl of
resuspension buffer (S1). 100 µl of lysis buffer (S2) was added, and the tube was inverted
once. In the next step 100 µl of neutralization buffer (S3) was added, and the tube was
inverted once again. The set up was centrifuged at 10,000 g for 10 min, and the supernatant
was removed into a fresh tube. 700 µl of ice cold absolute ethanol was added to the
supernatant and centrifuged for 30 min at maximum speed 15,000 g at 4 °C.
Later the supernatant was discarded and 200 µl of 70% ethanol were added to the pellet and
centrifuged for 5 min at full speed and 4 °C. Next the supernatant was discarded and the
pellet was air dried for 5 min. The pellet was dissolved into 40 µl of TE buffer and proceeded
for measuring DNA concentration and analytical digestion.
33
2.3.5.2 Preparation of plasmid DNA (Maxiprep)
Maxi preps were prepared according to the manufacturer's instructions using the Qiagen
Plasmid Maxi kit from 500 ml (low copy) bacterial overnight culture. Bacterial culture was
collected into a reaction tube and pelleted at 6000 x g for 15 min at 4 oC in a centrifuge. The
supernatant was discarded and the bacterial pellet was homogeneously resuspend in 10 ml
buffer P1. 10 ml buffer P2, was added and mixed thoroughly by vigorously inverting 4 - 6
times, and incubated at room temperature for 5 min. 10 ml buffer P3, was added and mixed
thoroughly by vigorously inverting 4 - 6 times and incubated on ice for 20 min.
The lysate was centrifuged at 20,000 x g for 30 min at 4oC and the supernatant was
recentrifuged at 20,000 x g for 15 min at 4 °C.
Qiagen-tip 500 was equilibrated by applying 10 ml buffer QBT and allowed the column to
empty by gravity flow. The supernatant was applied to the Qiagen-tip and allowed to enter
the resin by gravity flow. The Qiagen tip was washed with 2 x 30 ml buffer QC. Buffer QC
was allowed to move through the Qiagen-tip by gravity flow. DNA was eluted with 15 ml
buffer QF into a clean 50 ml tube.
The DNA was precipitated by adding 10.5 ml room temperature isopropanol to the eluted
DNA and mixed. The precipitation was centrifuged at 15,000 x g for 30 min at 4oC and
carefully the supernatant was decanted. The DNA pellet was washed with 5 ml room
temperature 70% ethanol and centrifuged at 15,000 g for 10 min. Carefully the supernatant
was decanted. The pellet was air dried for 5-10 min and redissolved DNA in a suitable
volume of buffer.

34
2.3.6 Quantification of nucleic acid
The quality and quantity of isolated nucleic acids were determined spectrophotometrically,
using an Eppendorf biophotometer. The A260/ A280 ratio was indicative of the degree of purity
of the nucleic acid. Aq. bidest was used as solvent to suspend the nucleic acids and each
sample was placed in a quartz cuvette. With a sample of solvent spectrophotometer was set at
zero. For more accurate readings of the nucleic acid sample of interest, the samples were
diluted to give readings between 0.1 and 1.0. Contamination of nucleic acid solutions makes
spectrophotometric quantitation inaccurate. For an indication of nucleic acid purity
OD260/OD280 ratio is calculated. Purified DNA has an OD260/OD280 ratio of ~1.8. Low ratios
could be caused by protein or phenol contamination.
2.3.7 Sequence analysis of plasmids:
Sequencing of the samples was carried out to verify positive clones. DNA sequencing
reactions were performed at Seqlab, Göttingen using Sanger sequencing with dye terminator
technology. Seven micro litre containing 700 ng of sample were used for sequencing.
Sequences were aligned using Vector NTI and chromatograms were analysed using Chromas
lite.
Reaction set up for sequencing:
Sample 5 µl
Forward Primer 2 µl
Total 7 µl
2.3.8 Preparation of Glycerol stocks
For long-term storage and to increase shelf life bacterial cultures were stored using glycerol.
200 µl of pure glycerol along with 800 - 1000 µl of bacterial solution was added into a
cryotube and mixed thoroughly by inverting the tube. The mixture was frozen in liquid
nitrogen for 4 - 5 min and then stored at -80 °C.

35
2.3.9 Overexpression of recombinant proteins
2.3.9.1 Growth of standard E.coli expression cultures (100 ml)
10 ml of the culture medium was inoculated containing both ampicillin (100 μg/ml) and
kanamycin (25 μg/ml) in a 50 ml flask, and the cultures were grown overnight at 37 °C. 100
ml of prewarmed media (with antibiotics) was inoculated with 5 ml of overnight cultures and
grown at 37 °C with vigorous shaking until an OD600 of 0.6 was reached. 1 ml sample was
taken immediately before induction. This sample was the noninduced control; Cells were
pelleted and resuspend in 50 μl 5x SDS-PAGE sample buffer (reducing) and stored frozen (-
20 °C) until SDS-PAGE analysis. Expression of the protein was induced by adding 1 M IPTG
to a final concentration of 1 mM. Cultures were incubated for an additional 4 – 5 h. A second
1 ml aliquot was collected. This was the induced sample, Cells were pelleted and resuspended
in 100 μl 5x SDS-PAGE sample buffer (reducing) and stored frozen at –20 °C until SDS-
PAGE analysis. The cells were harvested by centrifugation at 4000 x g for 20 min. Further
extraction of protein was carried out from the harvested cell pellet using B-PER kit
(PIERCE). Initially 1 ml fractions of the pellets of non-induced control and induced sample
were resuspended in 5x SDS-PAGE sample buffer for performing SDS-PAGE. At the end the
whole bacterial culture was centrifuged and the pellet was resuspended in B-PER. The
supernatant with extracted protein was used for protein purification using Ni_NTA agarose.
Further these samples were dissolved in 5x SDS-PAGE sample buffer before loading.
2.3.9.2 Over expression with EnPressoTM
Tablet cultivation set
For expressing recombinant protein in bacteria enpresso Enbase® kits were used because
higher volumetric yields of soluble recombinant proteins could be obtained due to controlled
physiological state. The higher volumetric yields enabled the use of lower culture volumes
and could thus significantly reduce the amount of time and effort needed for downstream
processing or process optimization.
Enbase® Medium contained two tablets with media components and a polysaccharide
complex as substrate, a booster tablet with complex additives for optimal pH conditions and
EnZ I’m: mixture of filter sterilized enzymes.
Preculture was set up in a 1.5 ml reaction tube with 1 ml LB medium including Ampicillin
(100 µg/ml), Kanamycin (50 µg/ml) and 1 µl of glycerol stock. The culture set up was
incubated at 37 °C and vigorous shaking for 6 hours. The Enbase
® medium tablets were
resolved in 50 ml of sterile water in a sterile 500 ml flask until tablets were dissolved. The

36
required antibiotics were added to the medium that was inoculated with 500 μl of the pre-
culture and 25 μl of EnZ l’m from the kit. The flask was fastened with an AirOtop seal.
Further the culture was incubated at 30 °C at 200 rpm overnight. After overnight culture,
inducing agent (IPTG), booster tablet (black bag) and 50 μl of EnZ l’m were added and
incubation continued for protein production. Protein was harvested after 6 hours of
cultivation.
2.3.10 Protein extraction
2.3.10.1 Protein extraction from tissue
Protein extraction from tissue was carried out using the GE Healthcare illustra triplePrep Kit.
According to the manufacturer’s instructions with illustra triple prep DNA, RNA and protein
can be isolated simultaneously. Tissue homogenization and lysis were carried out using
Precellys 24 homogenizer in precellys-glas-kit 0.5 mm beads in 2.0 ml tubes. The mini
column (orange o-ring) was placed into a 2 ml collection tube provided. Homogenized lysate
was transferred into the mini column and spun it for 1 min at 11000 g. The entire flow
through was transferred to a new 1.5 ml micro centrifuge tube and 600 µl of protein
precipitation buffer type 1 were added and mixed vigorously and incubated for 5 min at room
temperature to precipitate the proteins. Further spun it for 10 min at 16000 g. As much
supernatant as possible was carefully removed by pipetting and protein wash was done by
adding 1 ml of distilled water to the protein pellet. The pellet was actively dispersed by
pipetting up and down for 5 times and spun for 1 min at 16 000 g. Protein resuspension was
carried out by adding 300 µl of 2-D DIGE buffer for easy protein re-suspension and
incubated for 5 min at room temperature. Protein resuspended in 2-D DIGE buffer was used
for SDS-PAGE by mixing with 1 volume of 20% SDS. Sample loading buffer (i.e 1 volume
of 2x Laemmli buffer) was added and incubated at 70 oC for 10 min before gel loading.
2.3.10.2 Bacterial protein extraction:
After overexpression of protein in bactrerial cells using 1 M IPTG 1 ml of the culture was
collected and centrifuged at 8000 g for 5 min and pelleted. Later, the pellet was processed
towards extraction of protein using B-PER Bacterial protein Extraction Reagent (Pierce). The
cells were resuspended in 300 µl of B-PER reagent by vigorous vortexing the mixture until
the cell suspension was homogeneous. The suspension was centrifuged (Sigma, type model
4K15, rotor Nr.12169-H) at 11,627 g for 8 min to separate the soluble proteins from the

37
insoluble proteins. Collect the supernatant (soluble fraction) and resuspend pellet (insoluble
fraction) in 300 µl of B-PER reagent. To determine the solubility of recombinant protein, 10
µl of each the soluble and insoluble fractions were used for SDS-PAGE and western blotting
assays
2.3.10.3 Mammalian protein extraction:
Protein was expressed in HEK293 cell lines in 6 well plates for 24 hrs. A GFP probe
(pCMV6-AC-GFP) was used as a positive control to determine transfection efficiency
Depending on the transfection efficiency protein extraction was carried out using Mammalian
Protein Extraction reagent (M-PER®) from PIERCE. Culture medium was carefully removed
from the adherent cells and 200 - 400 µl of M-PER were added per well. The lysate was
collected and transferred to a microcentrifuge tube. Samples were centrifuged at 14,000g for
5 - 10 min to pellet the cell debris. The supernatant was transferred to a fresh tube for further
analysis.
2.3.11 Determination of protein concentration by Bradford Assay
The Bradford protein assay is a spectroscopic analytical method used to measure the protein
concentration in a solution. The concentration of the protein is measured dependent on the
amino acid composition of the protein. This assay is a colorimetric protein assay, which is
based on absorbance shift of the dye Coomassie Brilliant Blue G-250 in which under acidic
conditions the red form of the dye is converted into its blue form by assaying the binding to
the protein.
The concentration of protein in each sample was measured using the Coomassie Plus Kit. A
50 µl aliquot of unknown sample was diluted into a cuvette with 1.5 ml of Coomassie Plus
reagent and mixed well. The reaction mix was incubated for 10 min at room temperature.
Subsequently the absorbance of dye was measured at 595 nm with a spectrophotometer. The
photometer was set zero with buffer according to the extraction technique, used as blank and
subsequently absorbance of the samples was measured to calculate the protein concentration
against a standard. Equal amounts of protein were loaded in subsequent assays.

38
2.3.12 Purification of His tagged proteins using Ni-NTA resin under native conditions.
2.3.12.1 Buffers for purification under native conditions
Lysis buffer
50 mM NaH2PO4 (6.90 g/l)
300 mM NaCl (17.54 g/l)
10 mM imidazole (0.68 g/l)
ad 1 l Aq. dest
pH adjusted to 8.0 using NaOH.
Wash buffer
50 mM NaH2PO4 (6.90 g/l)
300 mM NaCl (17.54 g/l)
20 mM imidazole (1.36 g/l)
ad 1 l Aq. dest
pH adjusted to 8.0 using NaOH.
Elution buffer
50 mM NaH2PO4 (6.90 g/l)
300 mM NaCl (17.54 g/l)
250 mM imidazole (17.00 g/l)
ad 1 l Aq. dest
pH adjusted to 8.0 using NaOH.
2.3.12.2 Purification of over expressed and extracted recombinant proteins using
Ni_NTA resin
After over expression and protein extraction the desired products were purified using Ni/NTA
resin. 500 µl of lysis buffer with a concentration of 20 mM imidazole was added to 4 ml of
B-PER extracted protein lysate followed by the addition of 1.2 ml of 50% Ni-NTA slurry and
mixed gently at 4 °C for 1 h. Imidazole in the lysis buffer suppressed the binding of non-
tagged contaminating proteins and lead to increased purity after fewer wash steps. If the
tagged protein did not bind under these conditions, the concentration of imidazole was
reduced to 1 - 5 mM.

39
A 5 ml pipette tip was packed with glass wool, which acted as a filter. Later, the protein
lysate with Ni-NTA slurry mixture was loaded onto the column and the flow through was
collected. The flow-through was saved for SDS-PAGE analysis.
The column was washed twice with wash buffer (4 ml) and the wash fractions W1 and W2
were collected for further analysis. In the final step the elution of protein was carried out four
times using 0.5 ml elution buffer. Finally 10 % of glycerol was added to the samples and
stored at -20 till performing a SDS-PAGE. For lysis and washing the buffer contained 20 mM
imidazole and for elution 500 mM, immidazole were used. Based on the results the
concentration of the immidazole was adjusted.
2.3.13 Concentrating protein samples using the centriprep® centrifugal filter devices
Centriprep centrifugal filter devices are disposable ultrafiltration devices used for purifying,
concentrating, and desalting biological samples. Centriprep devices consist of a sample
container with a twist-lock cap, a filtrate collector containing a low adsorptive Ultracel YM
regenerated cellulose membrane, plus an air-seal cap for sample isolation.
A centriprep device with Ultracel YM-30 membrane was used for concentrating the samples.
Samples were centrifuged twice for 5 min at 1500 g. After the second centrifugation
concentrate is collected into a suitable container. Protein concentration of the samples was
measured and further analysis of samples was performed.
10x SDS Running buffer: (1 liter)
250 mM Tris (30.2 g/l)
1.92 M Glycine (144.0 g/l)
1 % SDS (10 g/l)
pH 8.3

40
1x SDS-PAGE sample buffer
0.045 M Tris.Cl (0.5 g / 100 ml)
10% glycerol (10 ml / 100 ml)
1% SDS (1 g / 100 ml)
0.01% bromophenol blue (0.01 g / 100 ml)
0.05 M DTT (0.7 g / 100 ml)
Preparation of 6x His Protein Ladder
6x His Protein Ladder (lyophilized, 250 µg)
1x SDS-PAGE sample buffer 250 µl
2.3.14 Gel electrophoresis of proteins - SDS-PAGE
Polyacrylamide gel electrophoresis in the presence of SDS (Sodium dodecyl sulphate) is the
most common form of protein gel electrophoresis. SDS is an anionic detergent applied to
linearize proteins and to impart a negative charge to linearized proteins. SDS binds to the
unfolded proteins giving all proteins a similar shape i.e random coil or extend conformation
and a uniform charge-to-mass ratio. Coating proteins with a negatively charged detergent
minimizes the effects of a protein’s net charge. Therefore, during electrophoresis in the
presence of SDS, the mobility of a protein depends primarily upon its size. i.e., mobility is
inversely proportional to protein mass.
2.3.14.1 Preparation of His tagged marker
250 µl of 1x SDS-PAGE sample buffer containing the reducing agent dithiothreitol (DTT)
were added to lyophilized 6x His Protein ladder (Qiagen, Hilden) and proteins were allowed
to dissolve at room temperature for 30 min. After the proteins were dissolved the whole set
up was transferred to a micro centrifuge tube and heated at 98o
C for 10 min. Appropriate
aliquots were prepared and stored at -20 oC. Any applied aliquot was heated immediately
before loading the gel. It is important to perform this heating step for the time, and at the
temperature recommended. Insufficient heating leads to detection of protein aggregates as
extra bands.

41
2.3.14.2 Protein electrophoresis using manually pepared acrylamide gels
Table 3: Gel mixture
Resolving gel Final
conc.
Stacking gel Final conc.
1.5 M Tris/HCl pH
8.8
3.13 ml 400 mM 0.5 M Tris/HCl pH 6.8 2.5 ml 200 mM
20% SDS 62.5 µl 3.5 mM 20% SDS 25 µl 3.1 mM
30% Acrylamide 5 ml 1.7 M 30% Acrylamide 1.1 ml 844.1 mM
Aq. Dest 4.37 ml 19.4 M Aq. Dest 1.4 ml 13.9 M
10% APS 100 µl 3.5 mM 10% APS 50 µl 3.9 mM
TEMED 10 µl 6.9 mM TEMED 7.5 µl 12.9 mM
2.3.14.3 Loading and running:
After the preparation of stacking gel and resolving gel, the gel was placed into the
electrophoresis chamber (Compact S Biometra®
, Göttingen) so that the open side of the
cassette is facing towards the cathode buffer tank. Electrophoresis buffer is added and the
comb was pulled steadily out of the gel. Remaining gel rests above the sample wells were
removed eventually. The sample wells were rinsed thoroughly avoiding any air bubbles.
Before loading the samples the wells were loaded with 1x sample buffer for the confirmation
of lanes and loading the samples proceeded further. 20 - 50 µg of protein sample were loaded
per lane, along with suitable positive and negative controls. The gels were run at 120 volts for
90 min. After the gel run was finished electrophoresis chamber, power supply,
electrophoresis buffer and the gel cassette were removed. Subsequently gels could be stained
or used for blotting.
2.3.14.4 SDS-PAGE using precast 8 - 16% gradient SERVAGelTM
TG
SERVAGelTM
TG gels are ready to use Tris-Glycine gels, which are designed for vertical
slab gel electrophoresis and suited for discontinuous separation of proteins. These pre-cast
gels help in achieving high resolution with excellent band sharpness in less time period. Gel
loading and running was carried out as mentioned in 2.3.15.3.

42
2.3.15 Polyacrylamide Gel Staining Protocol
For staining the SDS-PAGE gels, LabSafe™ GEL Blue was used, which is based on
coomassie dye and only stains proteins, leaving a clear background resulting in high band
visibility. After SDS-PAGE the gel was washed three times for 5 min in a large volume of
deionized water. Subsequently an adequate volume of LabSafe™ GEL Blue stain was added
to cover the gel. The gel was shaken gently for 1 hour. Later the stained gel was rinsed in a
large volume of deionized water, three times for 10 min each to remove background colour.
The stained gel was stored in deionized water.
2.3.16 Western Blotting
Western transfer buffer:
50 mM Tris base (6.06 g/l)
380 mM Glycine (28.5 g/l)
0.001 % SDS (1 g/l)
20% w/v Methanol (200 ml/l)
dissolved in Aq. bidest
Nitrocellulose Transfer Membrane
300 mm x 3 m, 0,2 µm
Whatman, Thermo Scientific,
Schwerte
10401396
Gel Blotting Paper 460 x 570 mm, 1 mm
GB003
Whatman, Thermo Scientific,
Schwerte
09-301-404
Gel Blotting Paper 580 x 580 mm, 3 mm
GB005
Whatman, Thermo Scientific,
Schwerte
09-301-199
Proteins were transfered to nitrocellulose membranes by semi-dry blotting
The order of the blotting filter papers (thick 3 mm GB005 and thin 1 mm GB004),
Nitrocellulose Transfer Membran 0.2 µm and gel are as follows

43
Figure 7: Western blotting transfer order. Arrow shows direction of transfer
Following gel electrophoresis, the separated proteins were transferred to a solid support for
further analysis. Electroblotting was used due to the speed and efficiency of transfer. The gel
and blotting membrane were assembled into a sandwich along with several sheets of filter
paper which protected the gel and blotting membrane and helped to ensure close contact
between their surfaces. 1x western transfer buffer was used for blotting. Filter papers and
membrane were precisely cut to the size of the gel and nitrocellulose was prewetted in
transfer buffer. Thick and thin filter papers were soaked in transfer buffer and applied directly
to the surface of the gel. Blotting was carried out for 1 h at 200 mA followed by confirmation
of protein transfer by Ponceau S staining.
2.3.17 Ponceau S staining of proteins on nitrocellulose membranes
To estimate the efficiency of protein transfer after blotting, the membrane was stained with
Ponceau S. This stain is reversible and produces pink bands on a light background. The
nitrocellulose membrane was washed with Millipore water for 1 min, incubated in Ponceau S
solution for 2 - 3 min with constant shaking at room temperature. Subsequently, the
membrane was destained by washing with demineralized water to the desired contrast.
Finally, it was documented by a digital camera. To remove the stain completely, the
membrane was washed again with TBS-T under constant shaking.

44
2.3.18 Antibody Hybridization on nitrocellulose membranes
Buffers for antibody hybridization
TBST
10% 10X TBS (100 ml/l)
0.1% Tween® 20 (1 ml/l)
ad 1 l Aq. bidest.
Blocking buffer
5% milk powder in TBST
TBS-Triton X 100 (1 liter)
10% 10x TBS (100 ml/l)
0.2 % Triton X 100 (2 ml/l)
ad 1 l Aq. bidest.
Blocking buffer for primary and secondary antibodies
5% Nonfat Dried Milk in 100 ml of 1x TBST/TBS-Triton X 100
Dissolved with gentle stirring.
Stored at 4oC
Chemiluminiscence detection buffers for horse radish peroxidase (HRP)
Solution A (stored at 4oC)
100 mM Tris-HCl (200 ml pH 8.6)
1.4 mM Luminol (0.05 g / 200 ml)
Solution B (stored at room temperature in the dark)
6.7 mM Para Hydroxy Coumarin acid (0.011g)
ad 10 ml of DMSO
H2O2 (30%)
1 ml of Solution A was mixed with 0.3 µl H2O2 (30%) and 100 µl Solution B. The solution
mix was distributed well on the membrane and incubated for 2 min. For small membranes
(Length 7 cm x Width 8 cm) 4 ml Solution A + 1.2 µl H2O2 (30%) + 400 µl Solution B was
used.

45
All incubation and wash steps were performed on a rocking platform or orbital shaker. The
membrane was washed twice for 10 min each with TBS buffer at room temperature and
subsequently incubated for 1 h in blocking buffer at room temperature.
The membrane was washed twice for 10 min each in TBS-Triton X 100 buffer at room
temperature and afterwards for 10 min with TBS buffer at room temperature. The blot was
incubated with a primary antibody solution of optimized antibody dilution at room
temperature for 1 h. Subsequently the membrane was washed twice for 10 min each time in
TBS-Tween/Triton buffer at room temperature. Washing of the membrane was repeated
twice for 10 min in TBS buffer at room temperature. The membrane was incubated with an
optimized dilution of secondary antibody in blocking buffer for 1 h at room temperature.
Milk powder was used to reduce background. The blot was washed 4 times for 10 min each
in TBST at room temperature. Chemiluminescent detection was carried out by reaction,
Afterwards the membrane was covered with a thin clear plastic foil, and exposed to X-ray
film.
2.3.19 Stripping and reprobing Western blots
Western blot stripping buffer
Mild stripping:
Stripping buffer:
0,25 mM Glycine (15 g/l)
0.001 % w/v SDS (1 g/l)
0.01 % Tween 20 (10 ml/l)
ad 1 l Aq. bidest.
pH adjusted to 2.2
Removal of primary and secondary antibodies from a western blot membrane is carried out
with stripping. It is useful to investigate more than one protein on the same blot.
100 ml of stripping buffer was used to cover the membrane. The blot was incubated at room
temperature for 5 – 10 min. The buffer was discarded and the membrane was washed for two
times 10 min each with 1x PBS and two times 5 min each with 1x TBS-Tween®20.
Subsequently the membrane was further proceeded to blocking.

46
2.3.20 Mammalian Cell culture:
Complete DMEM (Culture medium)
435 ml DMEM (high glucose)
5 ml Pencillin/Streptomycin (100x) (Final concentration 1x)
10 ml L-Glutamin (4 mM)
50 ml Fetal calf serum (FCS) (Final concentration 10%)
500 ml
Freezing medium
90 ml FBS
10 ml DMSO
100 ml
2.3.20.1 HEK 293 - cell line
HEK293 is a human embryonic kidney cell line (HEK), the wild type has been transformed
by transfection with the adenovirus 5 to a permanently culturable form (293). In 1977, the
cell line was established for the first time [34]. The cell line is considered to be well
cultivated and is a good basis for studies of proteins expressed by transfection. The cells have
an epithelial morphology and grow in an adherent cell layer. The cells were obtained from
LGC standards (ATCC) and were cultured in complete DMEM. HEK293 cells were used for
overexpression of AIPL1.
2.3.20.2 HeLa cell line
Hela cells are adherently growing human carcinoma cells, which were isolated in 1951 from
a cervix epithelial carcinoma of an American patient Henrietta Lacks. This cell line was the
first epithelial cell line that has been cultivated continuously and is now known as the
standard cell line. The cells were obtained from LGC standards (ATCC) and were cultured in
complete DMEM. HeLa cells were used to avoid cell stacks and allowed spreading of cells or
extended areas of cytoplasm. HeLa cell lines were used for immunocyctochemistry studies.
47
2.3.20.3 Culture of cell lines:
All cell culture work was done under a clean bench. The cultivation of cells was carried out
in 100 mm cell culture dishes by adding 10 ml complete DMEM medium to the cells. Cells
were grown in an incubator maintained at 37 °C, 5% CO2, and 95% humidity. For passage of
adherent cells, the medium was removed with sterile glass pipettes and washed once with 5
ml of 1x PBS. 2 ml of accutase were added to the cells and were incubated for 2 - 5 min. 8 ml
of medium was added to the cells detached from the bottom of the cell suspension and
approximately 1x 10⁶ cells were transferred into a new cell culture dish with 5 ml of medium
and placed in an incubator (37 °C, 5% CO2 and 95% humidity).
2.3.20.4 Long term storage of cell lines:
For storage, the cell lines were frozen. The medium was removed with a sterile glass pipette
and 5 ml of accutase was added to the cells. The plates were placed in an incubator for 2 - 5
min. 10 ml of medium were added to the detached cells und cells were resuspended. The cell
suspension was transferred to a 15 ml centrifugation tubes and pelleted at 125 g for 10 min.
The cell pellet was resuspended at a concentration of about 1x10⁶ cells in freezing medium
This suspension was aliquoted (1 ml) in cryotubes. The cryotubes were stored for 24 h at -80
°C and then transferred to liquid nitrogen at -196 °C. Frozen cells could be re-cultured by
thawing the cryovials in a water bath at 37 °C. Cells were then pelleted by centrifugation and
the DMSO containing medium was removed. The process was repeated washing the cells
with 1X PBS before resuspending them in the appropriate medium.
2.3.21 Heterologous expression in HeLa cells for immunocytochemistry
HeLa cells were seeded with sufficient space to spread in eight imaging chamber microscopic
slide bottom (PAA, Pasching). The cells were grown in complete DMEM medium at 37 °C
and 5% CO2 over night in an incubator.
2.3.21.1 Transfection of HeLa cells using lipofectamin®
250 ng of pQE-TriSystem His.Strep 1 constructs were transiently transfected into 50 - 60%
confluent HeLa cells. By using LipofectamineTM
(Invitrogen, Darmstadt) reagent according
to the manufacturer's protocol for HeLa cells.

48
Plasmid DNA (250 ng) was diluted in 100 µl DMEM medium and vortexed thoroughly.
Followed by the addition of 0.5 µl PLUS reagent gently mixed and incubated for 5 min at
room temperature. 1.5 µl of Lipofectamine was added to the mix and incubated at room
temperature for 30 min, DNA-Lipid complexes were added dropwise to the cells, and the
plate was shaken for 10 minutes at 80 rpm. The cells were incubated at 37 °C and 5% CO2.
Transfected cells were examined 24 hours after transfection.
2.3.21.2 Transfection of HeLa cells using Roti®-Fect PLUS
The cells were incubated for 18 - 24 hours at 37 °C at 5% CO2 in an incubator until they grew
50 - 60% confluent. Nucleic acid and transfection reagent stock solutions were thawed to
room temperature and gently swirled. The following solutions were prepared in reaction
tubes:
A: 0.5 µg DNA dissolved in 30 µl DMEM medium, which contained neither serum nor
antiobiotics.
B: 2.5 µl Roti®-Fect PLUS dissolved in 30 µl DMEM medium, which contains neither serum
nor antibiotics.
Set ups were mixed carefully by pipetting.
Solution A and B were bought together without mixing them and incubated at room
temperature for 15 - 20 min so that the nucleic acid/lipid complexes could form. Nucleic
acid/lipid complexes were added after 20 min to the cells, and mixed carefully by swivelling
gently. The cells were incubated at 37° C in a CO2 incubator and the transfection medium
was replaced with fresh complete medium after 4 hours. pCMV6-AC-GFP was used as a
transfection efficiency control vector expressing Green fluorescent protein (GFP). GFP
expression and transfection rate were tested 24 hours after transfection. At a transfection rate
of more than 70% of the cells immunocytochemistry was subsequently performed.
2.3.22 Immunocytochemistry
4% Paraformaldehyde (PFA) (4.0 g/100 ml)
ad 100 ml 1x PBS
Paraformaldehyde was solved in 1x PBS in a covered flask at 70°C. The solution was swirled
for a couple of hours until all the paraformaldehyde was dissolved. Further the solution was

49
allowed to cool down to room temperature and filtered through a 0.22 μm filter to remove
any particulate matter and stored at 4°C.
3% Blocking buffer
BSA 0.3 g
Triton X 100 200 µl
1x PBS 10 ml
1X PBS
137 mM NaCl (8.0g/l)
2.7 mM KCl (0.2g/l)
10 mM Na2HPO4 (1.44g/l)
1.8 mM KH2PO4 (0.24 g/l)
dissolved in 1 l Aq. bidest and pH adjusted to 7.2 with HCl
Sterilized and autoclaved.
HeLa cells were harvested 24 h after transfection, fixed in 4% PFA for 10 min, and washed 3
times with 1x PBS each for 10 min. Fixed cells were incubated overnight with primary
antibody. After extensive washing in 1x PBS for 3 times slides were incubated in secondary
antibody solution for 1 h at room temperature in dark conditions. Later, the wells were
washed twice with 1x PBS for every 10 min in the dark. Staining with DAPI (4’,6-diamidino-
2-phenylindole, dihydrochloride) followed. DAPI is a nuclear counterstain for use in
multicolour fluorescent techniques. The blue fluorescence of DAPI stands out in vivid
contrast to green, yellow, or red fluorescent probes of other structures. DAPI stains nuclei
specifically, with little or no cyctoplasmic labeling.
2.3.23 Heterologous expression in HEK293 cells and mammalian protein extraction
HEK293 cells were seeded with sufficient space to spread in 6 well plate (Greiner bio-one,
CELLSTAR®
). The cells were grown in complete DMEM medium at 37 °C and 5% CO2 over
night in an incubator. Further the transfection process was carried out as given in 2.3.21.1
and 2.3.21.2 for HeLa cells. Transfected cells were examined 24 hours after transfection.
The cells were further proceeded with protein extraction using M-PER kit as given in
2.3.10.3.
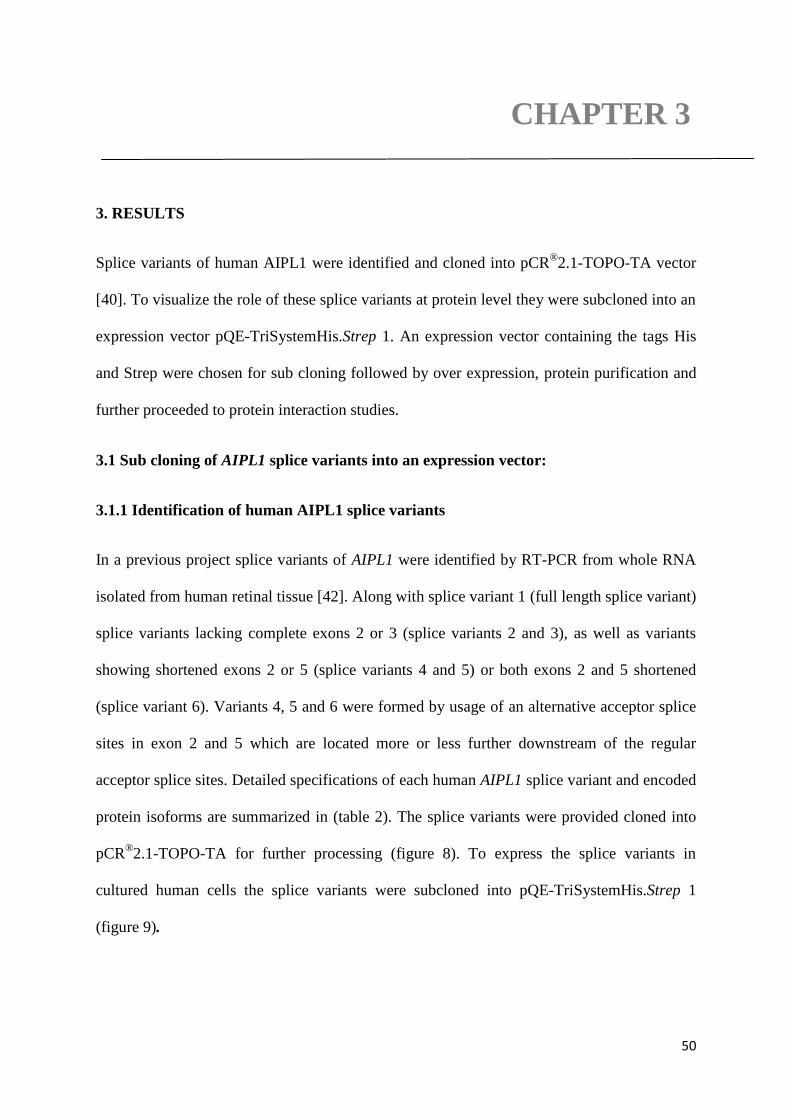
50
CHAPTER 3
3. RESULTS
Splice variants of human AIPL1 were identified and cloned into pCR®2.1-TOPO-TA vector
[40]. To visualize the role of these splice variants at protein level they were subcloned into an
expression vector pQE-TriSystemHis.Strep 1. An expression vector containing the tags His
and Strep were chosen for sub cloning followed by over expression, protein purification and
further proceeded to protein interaction studies.
3.1 Sub cloning of AIPL1 splice variants into an expression vector:
3.1.1 Identification of human AIPL1 splice variants
In a previous project splice variants of AIPL1 were identified by RT-PCR from whole RNA
isolated from human retinal tissue [42]. Along with splice variant 1 (full length splice variant)
splice variants lacking complete exons 2 or 3 (splice variants 2 and 3), as well as variants
showing shortened exons 2 or 5 (splice variants 4 and 5) or both exons 2 and 5 shortened
(splice variant 6). Variants 4, 5 and 6 were formed by usage of an alternative acceptor splice
sites in exon 2 and 5 which are located more or less further downstream of the regular
acceptor splice sites. Detailed specifications of each human AIPL1 splice variant and encoded
protein isoforms are summarized in (table 2). The splice variants were provided cloned into
pCR®2.1-TOPO-TA for further processing (figure 8). To express the splice variants in
cultured human cells the splice variants were subcloned into pQE-TriSystemHis.Strep 1
(figure 9).
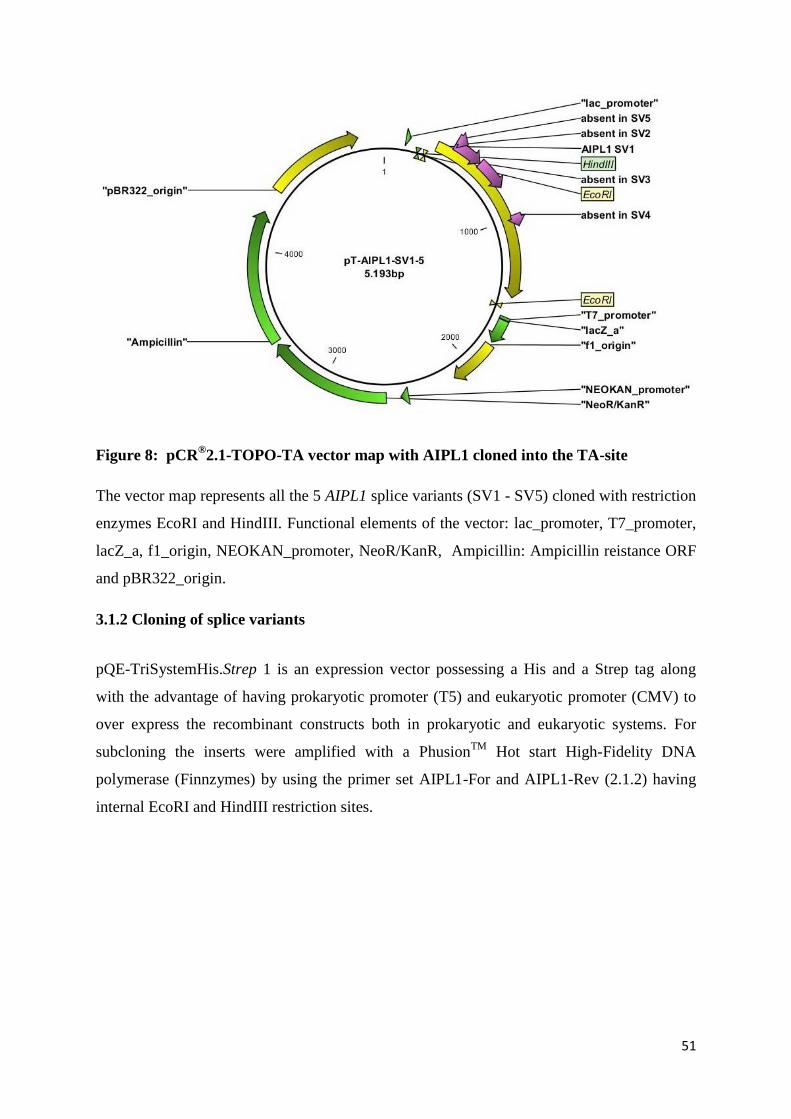
51
Figure 8: pCR®2.1-TOPO-TA vector map with AIPL1 cloned into the TA-site
The vector map represents all the 5 AIPL1 splice variants (SV1 - SV5) cloned with restriction
enzymes EcoRI and HindIII. Functional elements of the vector: lac_promoter, T7_promoter,
lacZ_a, f1_origin, NEOKAN_promoter, NeoR/KanR, Ampicillin: Ampicillin reistance ORF
and pBR322_origin.
3.1.2 Cloning of splice variants
pQE-TriSystemHis.Strep 1 is an expression vector possessing a His and a Strep tag along
with the advantage of having prokaryotic promoter (T5) and eukaryotic promoter (CMV) to
over express the recombinant constructs both in prokaryotic and eukaryotic systems. For
subcloning the inserts were amplified with a PhusionTM
Hot start High-Fidelity DNA
polymerase (Finnzymes) by using the primer set AIPL1-For and AIPL1-Rev (2.1.2) having
internal EcoRI and HindIII restriction sites.
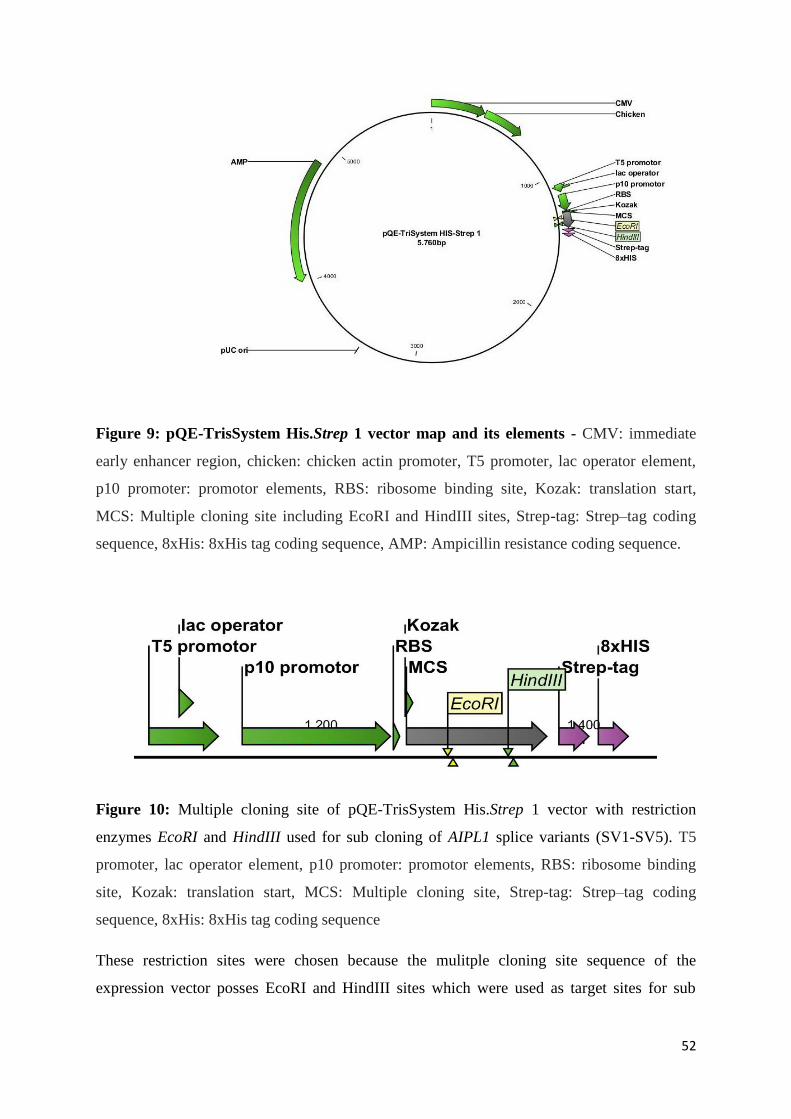
52
Figure 9: pQE-TrisSystem His.Strep 1 vector map and its elements - CMV: immediate
early enhancer region, chicken: chicken actin promoter, T5 promoter, lac operator element,
p10 promoter: promotor elements, RBS: ribosome binding site, Kozak: translation start,
MCS: Multiple cloning site including EcoRI and HindIII sites, Strep-tag: Strep–tag coding
sequence, 8xHis: 8xHis tag coding sequence, AMP: Ampicillin resistance coding sequence.
Figure 10: Multiple cloning site of pQE-TrisSystem His.Strep 1 vector with restriction
enzymes EcoRI and HindIII used for sub cloning of AIPL1 splice variants (SV1-SV5). T5
promoter, lac operator element, p10 promoter: promotor elements, RBS: ribosome binding
site, Kozak: translation start, MCS: Multiple cloning site, Strep-tag: Strep–tag coding
sequence, 8xHis: 8xHis tag coding sequence
These restriction sites were chosen because the mulitple cloning site sequence of the
expression vector posses EcoRI and HindIII sites which were used as target sites for sub

53
cloning the amplified PCR products of AIPL1. The PCR products were cut out from an
agarose gel and purified with the NucleoSpin® Extract II kit (Macherey Nagel). Later the
purified pCR2.1-TOPO®
-AIPL1 splice variant clones were digested with EcoRI and HindIII
(NEB) restriction enzymes according to chapter 2.3.4.1 and dephosphorylation was done as
mentioned in chapter 2.3.4.2 Dephosphorylated products were ligated according to chapter
2.3.4.3 into EcoRI and HindIII sites of the expression vector pQE-TriSystem His.Strep 1
(Qiagen, Hilden) that codes for an additional C-terminal 8xHis tag. The ligated products were
transformed into XL1-Blue competent cells as mentioned in chapter 2.3.4.5 and 100 µl of the
transformation set up was plated on LB-Agar supplemented with ampicillin. LB-agar plates
were incubated overnight at 37 °C. Positive clones were picked and grown in overnight
cultures in LB medium with ampicillin followed by plasmid mini preps. 1.5 µg of each
plasmid mini prep was checked using restriction digestion of constructs with EcoRI and
HindIII and were analysed on 1% agarose gel (figure 12).
Figure 11: Vectormap of pQE-Tri-SystemHis.Strep 1 Vector containing AIPL1 splice
variants SV1 - SV5
The vector map represents all five AIPL1 splice variants (SV1 - SV5) cloned with restriction
enzymes EcoRI and HindIII. AI1 - AI6 represent AIPL1 exons (1 - 6). Functional elements of
the vector are named in (Figure. 9).

54
3.1.3 Restriction digestion and sequence analysis
All cloned splice variants were analysed through restriction endonuclease digestion using
EcoRI and HindIII. pQE-Tris-system His.Strep 1 empty vector was used as a control. All
plasmids were examined after restriction digestion on a 1% (w/v) agarose and gel
electrophoresis performed for 1 hour at 100 V to assure that splice variants were cloned at the
right size. The expected sizes of the insert were as follows, and empty vector pQE-TriSystem
His.Strep 1 at 5.8 kb.
Splice variant Insert size Construct size
SV1 1,155 bp 6873 bp
SV2 975 bp 6693 bp
SV3 966 bp 6684 bp
SV4 1,083 bp 6801 bp
SV5 1,089 bp 6807 bp
Table 4: Expected sizes of cloned AIPL1 splice variant fragments.
Figure 12: Restriction endonuclease analysis of AIPL1 splice variant pQE-TriSystem 1
His.Strep clones (SV1 - SV5). Vector backbone size was 5718 bp and the inserts were sized
according to table 4.

55
PCR and restriction enzyme analysis of the constructs of pQE-Tris_AIPL1 on 1% agarose
gel. Lane 1 and 8, M: DNA 1 kb molecular weight standard; lane 2, pQE-Tris plasmid with
SV1 insert (pQE-Tris_SV1); lane 3, pQE-Tris_SV2; lane 4, pQE-Tris_SV3; lane 5, pQE-
Tris_SV4; lane 6, pQE-Tris_SV5; lane 7, pQE-Tris plasmid without insert.
Plasmid mini preps showing the expected fragment sizes of vector and insert were sequenced
which revealed that all splice variants were cloned in frame along with the specified
restriction enzymes added and with the His tag.
A
B
Figure 13: A. Verification of forward frame conservation of the inserts towards start codon
of the vector with chosen restriction site EcoRI.
B. Verification of reverse frame conservation of the inserts towards stop codon of the vector
with tags 8x His and Strep along with the chosen restriction site HindIII. SV1_R to SV5_R:
splice variant specific clone for SV1 - SV5.

56
3.2 Over expression of AIPL1 splice variants in a prokaryotic expression system using
the Enbase® Flo cultivation system:
For purification of His tagged proteins high amounts of protein yield were required. The
Enbase® Flo cultivation system was used to over express the probes for achieving a higher
yield of protein as mentioned in chapter 2.3.9.2.
3.2.1 Recombinant protein purification and pull down experiments
3.2.1.1 SDS-PAGE of Ni-NTA agarose purified probes of SV1 - SV5
All identified AIPL splice variants (SV1 - SV5) were purified using Ni_NTA agarose as
mentioned in chapter 2.3.12. All purification steps (Flow-through FT, wash 1, wash 2, elution
1, elution 2, elution 3, and elution 4) were tested for AIPL1 by SDS-page. Equal volumes of
the protein sample were loaded in all lanes. Proteins were analysed on SDS-PAGE and
stained with LabSafe™ GEL Blue (figure 14) as given in methods section chapter 2.3.14 and
2.3.15.
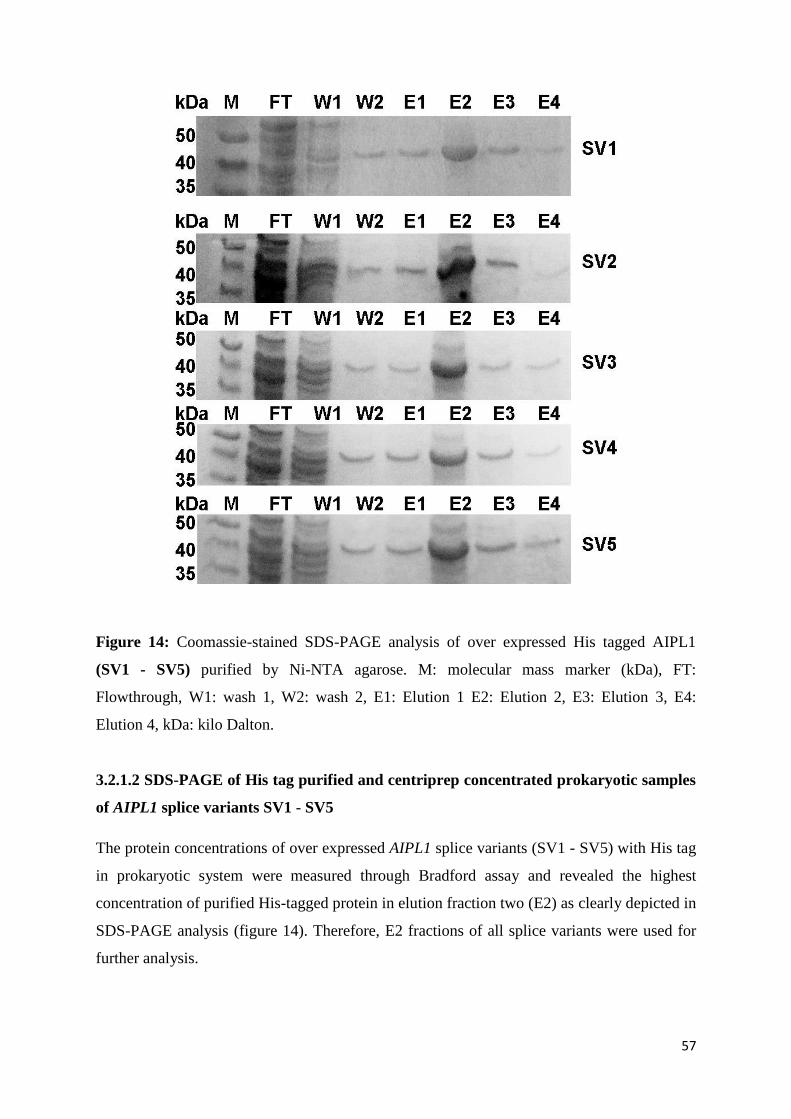
57
Figure 14: Coomassie-stained SDS-PAGE analysis of over expressed His tagged AIPL1
(SV1 - SV5) purified by Ni-NTA agarose. M: molecular mass marker (kDa), FT:
Flowthrough, W1: wash 1, W2: wash 2, E1: Elution 1 E2: Elution 2, E3: Elution 3, E4:
Elution 4, kDa: kilo Dalton.
3.2.1.2 SDS-PAGE of His tag purified and centriprep concentrated prokaryotic samples
of AIPL1 splice variants SV1 - SV5
The protein concentrations of over expressed AIPL1 splice variants (SV1 - SV5) with His tag
in prokaryotic system were measured through Bradford assay and revealed the highest
concentration of purified His-tagged protein in elution fraction two (E2) as clearly depicted in
SDS-PAGE analysis (figure 14). Therefore, E2 fractions of all splice variants were used for
further analysis.

58
To further increase the concentration of recombinant protein, E2 fractions were concentrated
using centiprep columns (Millipore) as given in 2.3.19. The concentrated E2 fractions were
analysed by SDS-PAGE with comassie blue staining (figure 15). The results shown in the
SDS_PAGE (figures: 14 & 15) revealed that the chosen expression system was suitable for
expressing the AIPL1 splice variants. The bands seen on the PAGE geles support that the
expressed and purified proteins are of the expected size from the group of endogenous
proteins produced along with the His tagged AIPL1 splice variants during the process of
protein over expression. Further analysis was carried out by Western-blot.
Figure 15: Coomassie-stained SDS-PAGE analysis of His tagged AIPL1 purified by Ni-
NTA agarose and concentrated samples of E2 fractions of (SV1 - SV5). Equal amounts of
protein (10 µg) from each indicated extract were separated on SDS-PAGE. Lane 1: Molecular
mass marker (kDa). SV1 – SV5: Elution step E2 from overexpressed and purified AIPL1.
3.2.3 Immunoblot analysis of AIPL1 splice variants
All overexpressed, purified, and concentrated AIPL1 splice variants were validated through
Western blotting to confirm correct expression and to reveal size differences in splice
variants.. The expression pattern of splice variants was analyzed both in a prokaryotic
expression system and an eukaryotic expression system. Protein extracted from human retinal
tissue as given in chapeter 2.3.10.1 was used as a positive control in the western blots.
3.2.3.1 Western blot analysis of AIPL1 splice variants (SV1 - SV5) expressed in
prokaryotic system
The protein concentration of all splice variants from the prokaryotic expression system was
measured using a Bradford assay and equal amounts of the protein (10 µg) were loaded on to
each lane. Human protein from a retinal tissue sample was used as positive control and
protein extract from HEK293 non-transfected cells was used as negative control. SDS PAGE
was performed using the gradient SERVAGelTM
TG gels. Fermentas broad range

59
multispectrum colour marker was applied as molecular weight marker. Electrophoresis was
performed at 50 V for 30 min until the protein samples entered the stacking gel. The
electrophoresis proceeded further at 120 volts for 90 min.
After electrophoresis the gel was transferred onto a Protan®
nitrocellulose membrane
(Whatman®) using the blotelutor (Biometra). Blotting was performed for 45 min at 200 mA.
Transfer of proteins was confirmed through Ponceau S staining as given in chapter 2.3.17.
Here a Ponceau S staining is exemplified and will not be shown in further chapters.
Immunoblot detection of AIPL1 was carried out according to chapter 2.3.18 with a primary
antibody against human AIPL1 [81]. The antibody was applied in 1% milk powder in 1x
TBS-0.2% Triton X 100 blocking solution at a dilution of 1:5000. Secondary peroxidase-
conjugated Anti-Rabbit IgG (whole molecule) antibody from goat (SIGMA A0545) was
applied at a dilution of 1:80,000 in 1% milk powder in 0.2% 1x TBS-Triton X 100 blocking
solution. The blot was developed using the luminol reagent according to chapter 2.3.18.
Figure 16: Western blot analysis of overexpressed and purified His tagged AIPL1 splice
variants SV1 - SV5 in prokaryotic system.
Equal amounts of protein from each splice variant extract were separated on SDS-PAGE and
transferred onto nitrocellulose membrane. A: Ponceau S staining of the nitrocellulose
membrane following electrophoretic transfer of proteins by SDS-PAGE gel separation.
B: Western blot probed with an affinity purified rabbit anti-AIPL1 antibody at 1:5000
dilution & Secondary Ab: Peroxidase-conjugated Anti-Rabbit IgG (whole molecule) antibody
from goat (SIGMA A0545) at 1:80,000 dilution. M: molecular mass marker (kDa), +tive:
retina protein as positive control, -tive: HEK293 non-transfected as negative control), AIPL1
Splice Variants (SV1 - SV5). Note: A subtle difference in size could be seen for splice
variansts SV1 vs SV2 and SV3 as well as SV4 and SV5.

60
3.2.3.2 Immunoblot detection of His tags in AIPL1 splice variants from SV1-SV5
After over expression of recombinant AIPL1 with His tag in prokaryotic system the raw
lysate contained the recombinant AIPL1 protein along with many other proteins originating
from the bacterial host. To detect the His tagged proteins from raw lysate affinity purification
was carried out using Ni-NTA agarose according to chapter 2.3.12. Ni-NTA agarose binds
His-tagged fusion proteins from a mixture of endogenous proteins. The elute obtained from
purification was used to detect the AIPL1 proteins with His tag using immunoblot analysis.
Immunoblot detection of His tag was carried out according to chapter 2.3.16 with a
polyclonal HRP tagged Rabbit anti-His antibody to 6X His (Abcam ab 1187). The antibody
was applied in 1% milk powder in 1x TBS-0.2% Triton X 100 blocking solution at a dilution
of 1:5000. The blot was developed using the luminol reagent according to chapter 2.3.18.
Figure 17: Western blot analysis of over expressed and purified His tagged AIPL1 splice
variants (SV1 - SV5) in prokaryotic system:
6x: His-tagged molecular mass protein ladder as positive control, SV1 – SV5: AIPL1 Splice
Variants (SV1 - SV5). Equal amounts of protein (10 µg) from each indicated extract were run
on SDS-PAGE and were blotted onto nitrocellulose membranes. The blot was probed with
HRP tagged His Ab-Rabbit polyclonal to 6X His (Abcam ab 1187) at 1:5000 dilution. Protein
molecular mass markers (in kDa) are indicated on the left.
From the immunoblot it was revealed that all the splice variants (SV1 - SV5) were possessing
the His-tag since anti-His antibody detected all the splice variants of AIPL1. The size of the
bands on the blot (figure 17) reveals all splice variants of AIPL1 were fully expressed
including His tag within the limits of their sequence but did not show detectable size
differences in this separation system.

61
3.2.3.3 Expression and purification of recombinant proteins in eukaryotic HEK293 cell
lines
All splice variants (SV1 - SV5) of AIPL1 were expressed in HEK293 cell lines. The reason
for choosing HEK293 cell line was that AIPL1 is not expressed endogenously in this cell line
[81] and that transfection levels are higher in this cell line, resulting in a higher level of
AIPL1 expression. Protein extraction was carried out using M-PER (PIERCE) kit according
to chapter 2.3.10.3. The concentrations of the extracted protein were measured by Bradford
assay and equal amounts of protein (10 µg) were loaded onto each well. Bradford assay
revealed the highest concentration of purified His-tagged protein in elution fraction two (E2)
as clearly depicted in SDS-PAGE analysis (figure 18). Therefore, E2 fractions of all splice
variants were used for further analysis. Human retinal protein was used as positive control
and non transfected HEK293 cell were used as negative control.
Figure 18: SDS-PAGE of Ni-NTA agarose purified probes (SV1 - SV5) from expression
in eukaryotic HEK293 cell lines
Coomassie-stained SDS-PAGE analysis of over expressed His tagged AIPL1 purified by Ni-
NTA agarose. M: Molecular mass marker (kDa), FT: Flowthrough, W1: wash 1, W2: wash 2,
E1: Elution1 E2: Elution, E3:Elution 3, E4:Elution 4, kDa: Kilodalton.

62
Figure 19: SDS-PAGE of centriprep concentrated probes of AIPL1 SV1 - SV5 from
expression in eukaryotic HEK293 cell lines
Coomassie-stained SDS-PAGE analysis of His tagged AIPL1 purified by Ni-NTA agarose
and concentrated samples of E2 fractions of (SV1 - SV5). M: Molecular mass markers (kDa).
SV1 - SV5: Elution step E2 of eukaryotic SV1 - SV5 expression.
Figure 20: Western blot analysis of AIPL1 splice variants (SV1 - SV5) (Eukaryotic)
Western blot analysis of His tag purified protein from total cell extracts expressed in HEK293
cells. Western blot probed with an affinity purified rabbit anti-AIPL1 antibody at 1:5000
dilution & Secondary Ab: Peroxidase-conjugated Anti-Rabbit IgG (whole molecule) antibody
from goat (SIGMA A0545) at 1:80,000 dilution. -tive: non transfected HEK293 cells as
negative control, +tive: retinal protein extract as positive control, SV1 - SV5: expressed His
tagged AIPL1. Equal amount sof protein (10 µg) from each extract were loaded onto each
lane. Protein molecular mass markers (in kDa) are indicated on the left.
Immunoblot results conclude the expression of all the AIPL1 splice variants (SV1 - SV5) in
HEK293 cell lines. Anti-AIPL1 antibody detected all the splice variants over expressed and
purified in mammalian cell lines HEK293. Compared to the prokaryotic protein expression
system the mammalian protein expression system was less effective because The pQE-Tri-
SystemHis.Strep 1 system is optimized for bacterial culture and expresses suboptimal in
human cells. In both systems double bands (figure 16 B, 17 and 20) were seen with Anti-
AIPL1 and Anti-His antibodies. The post translational modifications or the antibody used
which is not a splice variant specific antibody could be possible reasons for the appearance of
double bands. A subtle difference in size could be seen for splice variansts SV1 vs SV2 and
SV3 as well as SV4 and SV5 (Figure 16 B, 17 & 20)

63
3.3. Intracellular localization of human AIPL1 splice variants SV1-SV5 in HeLa cells:
The pQE-TrissystemHis.Strep 1 based His tagged recombinant AIPL1 expression constructs
(SV1 - SV5) were prepared to transfect HeLa cells to locate the expression of AIPL1 at the
cellular level. Transfection of all the five splice variants, SV1 - SV5 was carried out as given
in methods 2.3.21.1 and 2.3.21.2. Initially lipofectamine was used. It was substituted by
Roti®-Fect PLUS in repeat applications. For detection, hybridization with primary antibodies
against AIPL1 and His-tag were carried out independently to confirm that the
immunoreactivity was not specific to the AIPL1 antibody compared to the anti-His-tag
antibody. Alexa Fluor labeled secondary antibodies were used to visualize bound primary
antibodies. HeLa cells were examined on a Keyence (BZ-8100E) fluorescence microscope
after 24 hrs of transfection and immunocytochemistry was performed as given in chapter
2.3.22. DAPI was used as a nuclear counterstain as described.
Chicken anti-human AIPL1-Ab was applied at a dilution of 1:100 and probed with a
secondary Alexa Fluor® 488-labled goat anti-chicken IgG (H+L) antibody (Invitrogen,
Darmstadt A11039) at 1:1000 dilution. Incubation was carried out for 1 h. His-tagged AIPL1
was detected by an anti-His antibody (ab1187, Rabbit, Abcam, Cambridge UK) and an Alexa
Fluor® 488-labled secondary antibody donkey anti-rabbit IgG (H+L) (Invitrogen, Darmstadt
A11039). Incubation of both primary and secondary antibody was done for 1 h each. All
procedures were carried out at room temperature. Finally, slides were covered with Dako
Fluorescence Mounting Medium (DAKO, Hamburg) and immunoreactivity (IR) was
recorded on a Keyence (BZ-8100E) wide-field microscope with epifluorescence.
Transient expression of splice variants SV1 - SV5 was detected in HeLa cells transfected
with pQE-TriSystemHis.Strep 1 constructs. Fluorescent immunohistochemical labeling
disclosed expression throughout the cytoplasm as could be seen by AIPL1-specific antibody
and His-tag specific antibody (fig. 21 and 22). A splice variant specific localization pattern
could not be obtained from evaluation of AIPL1 expression alone.

64

65
Figure 21: Heterologous expression of AIPL1 splice variants in HeLa cells:
Immunofluorescent images showing intracellular localisation of AIPL1 proteins expressed in
HeLa cells. Cells transfected with pQE-TriSystemHis.Strep 1-AIPL1 splice variant constructs
(SV1 - SV5) were cultured for 24 h and then processed for immunofluorescence using
Chicken anti-human AIPL1-Ab followed by Alexa Fluor® 488-labled goat anti-chicken IgG
(H+L) antibody (Invitrogen, Darmstadt A11039). Nuclei were counterstained with DAPI
(blue). A: SV1, B: SV2 C: SV3, D: SV4, E:SV5. Fluorescent labeling disclosed expression of
AIPL1 throughout the cytoplasm. The scale bar represents 20 µm. Arrows: Indicate AIPL1
expression throughout the cytoplasm.
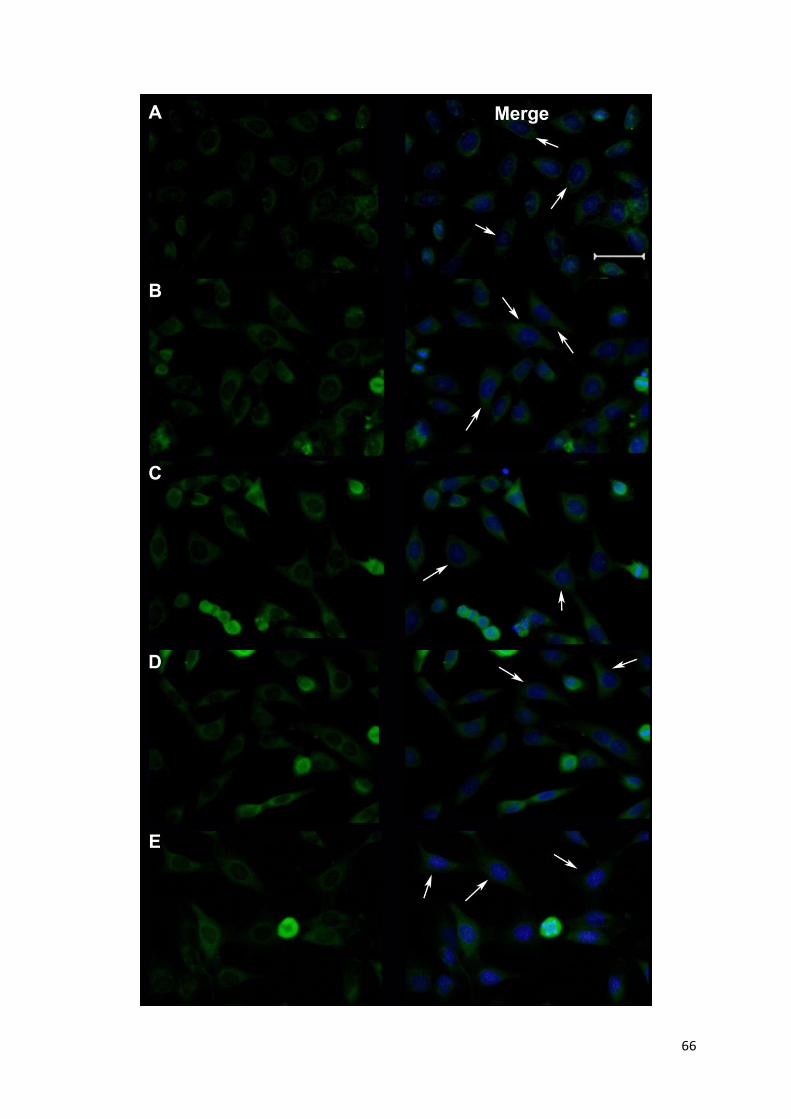
66

67
Figure 22: Heterologous expression of His-tagged AIPL1: Immunofluorescent images
showing cellular localisation of AIPL1 proteins expressed in HeLa cells. Cells transfected
with pQE-TriSystemHis.Strep 1-AIPL1 splice variant constructs (SV1 - SV5) were cultured
for 24 h and then processed for immunofluorescence using anti-His antibody followed by
Alexa Fluor® 488-labled secondary antibody donkey anti-rabbit IgG (H+L) (Invitrogen,
Darmstadt A21206). Nuclei were counterstained with DAPI (blue). A: SV1, B: SV2 C: SV3,
D: SV4, E:SV5 Fluorescent labeling disclosed expression throughout the cytoplasm as could
be seen by His-tag specific antibody. The scale bar represents 20 µm. Arrows: Indicate His-
tagged AIPL1 expression throughout the cytoplasm.
3.3.1 Immunohistochemical co-detection of heterologously expressed AIPL1 and
intrinsic CENP-F
To check whether AIPL1 is colocalizing with CENP-F inside the cell transfection studies
were performed in HeLa cell lines and transfected cells were probed for AIPL1 expression
and CENP-F expression by immunohistochemistry. Colocalization between AIPL1 and
CENP-F was evaluated for full length AIPL1 and different splice variants of AIPL1. The
transfected recombinant AIPL1 and the intrinsic CENP-F were detected using AIPL1 and
CENP-F antibodies.
HeLa cells were seeded in silicone frames on microscope slides (PAA, Cölbe) and grown at
37 °C and 5% CO2 over night in an incubator. Full length AIPL1 cloned in pQE-
TriSystemHis.Strep 1 vector (Qiagen) with a His-tag added at the C-terminus was transfected
and expressed in HeLa cells as mentioned in chapter 2.3.21. His-tagged AIPL1 was detected
by Anti-HIS antibody (ab1187, Abcam) and anti-AIPL1-ab (Chicken IgY against purified
whole protein). CENP-F was detected by anti-CENPF-ab (sc-135865, Santa Cruz).
Immunoreactivity (IR) was recorded on a Keyence (BZ-8100E) microscope by
epifluorescence using the Z-stack feature. Digital images were evaluated for co-localization
by Pearson‘s coefficient using the JACoP plugin in ImageJ (V. 1.44p).

68
SV1 SV2 SV3 SV4 SV5
Pearson’s coefficient r = 0.735 r = 0.836 r = 0.795 r = 0.675 r = 0.655

69
Figure 23: Immunohistochemical detection of intrinsic CENPF expression and transient
AIPL1 expression in HeLa cells
First column shows intrinsic CENPF expression, second column shows heterologous AIPL1
expression, third column shows digital overlays of the single coloured images. Antibodies
used- Primary: anti-AIPL1-ab (Chicken IgY against purified whole protein) & Primary Ab:
anti-CENPF-ab (sc-135865, Santa Cruz). Secondary (for AIPL1)-red lable: goat IgG anti-
chicken IgY (Alexa Fluor 564, Invitrogen A11040) & (For CENP-F) Secondary Ab-green
lable: Goat anti- mouse IgG (H+L), Alexa Fluor 488, Invitrogen A11001). A: SV1, B: SV2
C: SV3, D: SV4, E:SV5. The scale bar represents 20 µm. Arrows indicate: White - dividing
cell, Yellow - pre-division cell and light Blue - resting cell.
In HeLa cells heterogeneously expressed AIPL1 is spread for all splice variants throughout
the cytoplasm in all stages of the cell cycle (figure 23A-E). Intrinsically expressed CENP-F is
localized in the nucleus of the cells and to a lesser extent in the perinuclear cytoplasm
especially during certain stages of cell divison (figure 23A-E). In the resting phase of cell
divison CENP-F is almost absent. Co-localization of AIPL1 and CENP-F is seen in the
perinuclear region and in the nucleus at certain stages of the cell cycle.
Immunoreactivity (IR) against the AIPL1-specific antibody and the His-tag-specific antibody
for AIPL1 was seen in the cytoplasm of HeLa cells. IR to intrinsically expressed CENP-F
also localized to the cytoplasm in HeLa cells overlapping with the IR of AIPL1.

70
SV1 SV2 SV3 SV4 SV5
Pearson’s coefficient r = 0.694 r = 0.558 r = 0.434 r = 0.543 r = 0.658

71
Figure 24: Immunohistochemical detection of intrinsic CENPF expression and transient
expression of His-tagged AIPL1 in HeLa cells
First column shows intrinsic CENP-F expression by a CENP-F specific antibody (green),
second column shows heterologous expression of His-tagged AIPL1 by a His-tag-specific
antibody (red), third column shows digital overlays of single coloured images. Antibodies
used- Primary: polyclonal HRP tagged Rabbit anti-His antibody to 6X His (Abcam ab 1187)
& anti-CENPF-ab (sc-135865, Santa Cruz). Secondary (for His)-red lable: goat anti-rabbit
IgG(H+L), Alexa Fluor 546, Invitrogen A11010 & (For CENP-F)-green lable: Goat anti-
mouse IgG (H+L), Alexa Fluor 488, Invitrogen A11001). A: SV1, B: SV2 C: SV3, D: SV4,
E:SV5. The scale bar represents 20 µm. Arrows indicate: white -dividing cell, yellow - pre-
division cell, and light blue - resting cell.
CENP-F, as stated earlier, takes part in cell cycle regulation. The influence of cell cycle
regulating check points on CENP-F is huge. They control the vital functions of CENP-F, in
other words they decide the fate of CENP-F. These check points control the CENP-F
functions like stability, delay to the next phase or sometimes leads to depletion of CENP-F.
During the co-localization studies it was seen that few cells were prepared to divide (Figure
23 A,B & C yellow arrows) and few of them showed cell divison (Figure 23 A,B,C & D
white arrows) and the remaining cells are in the resting phase (Figure 23 A,B,C & D light
blue arrows). It was envisaged that splice variants (SV1 - SV5) of AIPL1 are colocalizing
with CENP-F at different stages of cell cycle.

72
CHAPTER 4
4. Discussion
The research of the past two decades on both AIPL1 and CENP-F has revealed various roles
of these genes in retinal dystrophies and cell cycle activities respectively. This is the first
study on human AIPL1 splice variants. The existence of splice variants identified in AIPL1
was investigated through various biochemical techniques at the molecular level.
With approximately 7% AIPL1 mutations cover a major share of mutations causing Leber
congenital amaurosis (LCA) compared to other known LCA genes. [17,20,89]. Knowledge
on AIPL1 has progressed through various steps, from gene identification [88,89] followed by
the clinical characterization of the phenotype [20,31,72,102] towards an increasing
understanding of the molecular mechanism [37,54,65,67,80,99,100] cummulating in a
treatment strategy [91,96]. AIPL1 mutations have been described to cause several types of
retinal dystrophies such as LCA, juvenile Cone-rod dystrophy (CRD) and milder forms of
EOSRD [20,89]. The prevalence of AIPL1 mutations in LCA and the severity of the resulting
phenotype generate an interest in the function and pathofunction of AIPL1. The results
obtained in this study provide information on AIPL1 interaction with centromere protein
CENP-F and opens perspectives for further research on AIPL1 interactions with centromere
genes.
4.1 Impact of splicing on AIPL1 protein fucntion
The splicing pattern observed in AIPl1 lead into the question what impact this splicing will
have on the function of the AIPL1 protein. The identified alternative exons are encoding
presumptively important structural domains. In exons 2 and 3 (Figure 3) this is a
peptidylprolyl isomerase domain, that may act in folding of nascent proteins. So skipping of
exon 2 or 3 could result in AIPL1 protein isoforms with diminished or even without
chaperone function which was suggested to play a role in rod phosphodiesterase activation.
The alternatively expressed aminoacids encoded from the beginning of exon 5 lie within the
binding site of one established interaction partner of AIPL1, the NUB1 protein and their
exclusion might change the affinity for NUB1. So minor AIPL1 isoforms derived from the
identified alternative transcripts are supposed to have individual properties and might even
possess mutually exclusive chaperone and NUB1-binding activity.

73
4.2 Protein expression and purification studies of AIPL1
As described in the introduction about the importance of splicing and identification of the
AIPL1 splice variants, various molecular biology techniques were used to validate these
identified splice variants. To study the role of splice variants of AIPL1 at protein level splice
variants (SV1 - SV5) were sub cloned from pCR®2.1-TOPO-TA vector to pQE-
TriSystemHis.Strep 1. The idea behind sub cloning the splice variants into the Tris-System is
to use them for expressing in both prokaryotic and eukaryotic systems. For recombinant
protein expression studies the QIAexpress System (pQETriSystemHis.Strep 1) has been
chosen. In this system genes could be expressed in prokaryotic and eukaryotic systems due to
the presence of both T7 (prokaryotic) and CMV (eukaryotic) promoters. For over expression
of proteins in prokaryotic system an enzyme-based glucose release system (EnBase®) was
opted [56]. Enbase system boosts the production of proteins in higher amounts when
compared to the normal prokaryotic protein production. The higher amounts of the crude
protein could be used in protein purification assays to achieve the higher amounts of His-
tagged AIPL1 protein.The presence of His tag helps in producing the proteins with high
purity. To pick only the His tagged AIPL1 proteins from the pellet of endogenous proteins
produced during the expression, purification of expressed proteins was carried out by Ni-
NTA agarose where the divalent Ni ions bind specially to the His tagged AIPL1 proteins. The
expressed proteins were purified and the concentration of protein fractions (FT, W1, W2, E1,
E2, E3 & E4) revealed that E2 fraction possess the highest amount of protein. To analyze
whether the system opted for expressing the AIPL1 splice variants yielded the right sized His
tagged AIPL1 proteins, SDS-PAGE was performed from the various fractions obtained in the
Ni-NTA agarose purification (FT, W1, W2, E1, E2, E3 & E4) (Figure 14 &18).
Further the eluted E2 fractions (Figure 15 & 19) were concentrated using the centripreps for
Western blot studies. In the prokaryotic system the cultures could be done in bulk amount and
the production of protein in the system would be higher compared to the eukaryotic system.
The expression of each splice variant was tested individually and all the splice variants were
expressed in the similar fashion. In human cell lines, like HEK293 which was used in this
study for eukaryotic protein expression, the enhancement of protein production in higher
amounts was not possible like in the prokaryotic system. Therefore, the quantity of the
expressed protein from whole cell pellet possess less AIPL1 protein. Quantity of protein is
always directly proportional to the transfection rate. Repeated transfections were carried out
by optimizing the conditions to obtain a good transfection efficiency. That was the one major

74
issue faced when expression studies were done in the eukaryotic system. Compared to the
prokaryotic protein expression system the mammalian protein expression system was
additional less effective because The pQE-Tri-SystemHis.Strep 1 system is optimized for
bacterial culture and expresses suboptimal in human cells. All the expressed proteins were
validated using the anti-AIPL1 antibodies as well as anti-His antibodies (Figure 16B, 17 &
20). In both systems, double bands (Figure 16 B, 17 and 20) were seen with Anti-AIPL1 and
Anti-His antibodies. Post translational cleavage is one of the reasons for the appearance of
double bands. In this study double bands were seen in immunoblot detection with all the
splice variants (SV1-SV5). Sometimes the double bands were not detected, it was envisaged
that splice variants are acting differently during protein expression based on the protein
domains present in these splice variants.
4.2.1 Role of imidazole and FKBPs in protein purification
Further to perform protein interaction studies a purified AIPL1 protein in higher amounts is
required.To purify a desired protein, His-tagged AIPL1 in this study from a complex mixture,
various factors play role in the protein purification. Among these factors protein domains
and buffers used for protein purification play vital role in obtaining a high quality protein.
Previously a contamination of the elute with increased imidazole concentrations was reported
using Ni-NTA spin columns. The studies identified an E. coli protein containing a domain
homologous to FK506-binding proteins (FKBPs) as a persistent contaminant in immobilized
metal affinity chromatography of recombinant proteins that were expressed in E. coli [36]. A
band of the expected size 44 kDa and the other band of 30 kDa are observed frequently in our
study. A cocktail of protease inhibitors was suggested to solve the problem of extra bands,
later optimization of the imidazole concentrations and application of a cocktail of protease
inhibitors solved this problem (figure 16B, 17 & 20).
4.3 Immunoblot analysis of AIPL1 splice variants
The presence of all splice variants was demonstrated through immunoblot analysis, both in
the prokaryotic and eukaryotic systems (Figures: 16, 17 & 20). All splice variants expressed
and analyzed through the western blot migrated at about the same size corresponding to full
length of AIPL1. The various size differences SV1 - 43.9 kd, SV2 - 36.8 kd, SV3 - 35.0 kd,
SV4 - 40.9 kd and SV5 - 41.2 kd of the AIPL1 splice variants could not be separated. The
size difference between the splice variants varies from 0.3 kDa to 8.9 kDa. The small size
differences of the splice variants may explain why the splice variants could not be separated

75
on PAGE gels using in vivo samples. This could be one major reason why the various splice
variants were not identified in previous studies [23]. When observed in the positive control
used for all the immunoblots a slightly bigger size of the wild type protein compared to the
splice variants could be shown (Figure 16). The positive control sample was extracted from
protein from human retinal tissue which is eukaryotic. Eukaryotic proteins are post
translationally modified. This may be the reason for the greater molecular weight of human
retinal protein and compared to proteins expressed in a prokaryotic host.
4.4 Choosing CENP-F as a possible interaction partner of AIPL1
In a preceding study using a Yeast two hybrid system an interaction of the C-terminal 120
amino acids of CENP-F with AIPL1 was shown [40]. It arose interest in the influence of
centromere proteins on photoreceptor maturation, while AIPL1 playing a key role in
maintaining the morphology of the neuroretina by processing farnesylated proteins [81] and
CENP-F playing a role in the segregation of cells. The interest lies in knowing what happens
if AIPL1 is interacting with CENP-F and the influence of interaction on retinal
cytoarchitecture.
4.5 Features that support interaction between AIPL1 and CENP-F
Prenylation is important for protein interaction and function. Protein farnesylation plays
important roles in the membrane association and protein-protein interaction of a number of
eukaryotic proteins[94]. During Farnesylation which is catalyzed through Farnesyltransferase
(FTase) an isoprenoid is added to proteins terminating in a CAAX motif at the carboxyl
terminus of the protein. Previous studies concluded that AIPL1 may interact with the C-
terminal prenylation motif in the cytosol dependent on the presence of farnesyltransferase
[51]. CENP-F has a C-terminal CAAX motif [4] which is required for isoprenylation and
carboxy methylation. It was shown that AIPL1 interaction enhanced the post translational
farnesylation of proteins in the retina [81]. Various functions were assigned to AIPL1 which
include protection of farnesylated proteins from proteasomal degradation in the cytosol,
facilitated targeting of the protein to the ER for further protection or chaperone the
farnesylated proteins to the target membrane. From this it was envisaged that AIPL1
farnesylation could initiate protein interaction with CENP-F through C-terminal CAAX motif
during photoreceptor proliferation, which protects and guide CENP-F towards its target.

76
Further Yeast-two hybrid studies, determined that AIPL1 interacts with NUB1 (NEDD8
Ultimate Buster-1), a protein involved in regulating cell-cycle progression and proliferation
[2]. In cell cycle progression NUB1 functions through down-regulating NEDD8 expression
post-translationally by targeting NEDD8 and its conjugates for proteasomal degradation [52].
NEDD8 is involved in the degradation of many proteins including Cyclin D1 and p27kip1,
acting in the regulation of cell cycle progression in the developing retina [24,25]. Recent
studies suggested that AIPL1 regulates the ubiquitin like FAT10 pathway by interaction with
FAT10 E1 activating enzyme UBA6 [6]. Ubiquitin which is a house keeping gene and plays
role in cell cycle regulation, which supports the hypothesis that AIPL1 may show partial or
complete interaction with cell cycle regulating proteins.
4.6 Colocalization studies of AIPL1 and CENP-F
Transfection studies were carried out to check the subcellular localization of AIPL1 and
CENP-F using HeLa and HEK293 cell lines, which are not expressing AIPL1 intrinsically.
CENP-F is a housekeeping gene, therefore a heterologous expression of AIPL1 should be
able to show colocalization in these cell lines. The intrinsic expression of CENP-F in HeLa
and HEK293 cells was expected to produce sufficient protein for interaction studies. The
mammalian expression studies revealed that cytoplasmic localization of CENP-F and AIPL1
was overlapping upon heterologous expression of AIPL1 in HeLa cells indicating a possible
interaction. Cytoplasmic localization of CENP-F and AIPL1-SV1 were overlapping upon
heterologous expression of AIPL1 in HeLa cells in perinuclear positions and in the nucleus
(Figure 23 and 24). From the expression level of CENP-F it may be interpreted that
colocalization occurs during cell division indicating a restricted interaction at certain stages
of the cell cycle. Nuclear morphology implies colocalization of AIPL1 and CENP-F in
dividing cells. Possibly pre-dividing and resting cells do not show colocalization indicating a
function of AIPL1 upon proteins active during cell division. The reduced Pearson’s
coefficient for SV3 (Figure 25) may indicate important domains of AIPL1 are involved in
interacting with CENP-F due to the missing colocalization in the cyctoplasm. From (Figure
23 and 24) it was clear that the expression of CENP-F differs in the cells based on the
developmental stages of the pre-dividing, diving and resting. These images emphasize the
redistribution of CENP-F and distinct punctate CENP-F patterns proximally located in
relation to the centromeres can be seen. The interaction studies performed between AIPL1
and CENP-F through immunoblot analysis did not show any interaction. May be that the
interaction is transient between AIPL1 and CENP-F or that there are technical reasons that

77
hampered detection of interaction. The system used for the interaction studies had some
limitations. An first hand the size of CENP-F (350 kDa) has to be mentioned which causes a
problem in blotting with AIPL1 by overblotting of the smaller AIPL1 protein in parallel
transfer. Further CENP-F may not well enter the denaturating PAGE gel and thus is not
represented on the blotted gel. Finally, the interaction may be too weak and underrepresented
compared to interactions of AIPL1 with other cellular proteins. In this case the detection limit
of the method would be insufficient.
4.7 Future aspects in validating AIPL1 splice variants and protein interaction studies
This study revealed the presence of splice variants (SV1 - SV5) in AIPL1 gene expression
studies. One drawback to the functional studies of the variants at the protein level is the lack
of specific antibodies recognizing certain variants exclusively, which would be extremely
useful for delineating their overlapping and distinct functions. Further investigations are
required to check the role of these splice variants in interaction studies with centromere
proteins and for the maintenance of photoreceptor development. For performing interaction
studies between AIPL1 and CENP-F full length cloning of CENP-F into an expression vector
could be one option to add a tag to the protein which may ease the access to the interaction
studies. On the other hand a tag may also interrupt important protein-protein or protein-
membrane interactions and may interfere with its physiological function.

78
CHAPTER 5
SUMMARY
In this study an investigation of splice variants in human AIPL1, the fourth gene underlying
Leber Congenital Amurosis (LCA), in relation to cell cycle regulating centromere protein
CENP-F was accessed.
The study addressed the presence of the splice variants (SV1 - SV5) of AIPL1 at the protein
level and the activity of these splice variants in relation to CENP-F. The existence of these
splice variants may play a vital role in interactions of AIPL1 with other proteins in retinal
cells and may influence the activity of some AIPL1 mutations at various developmental
stages of the retina.
AIPL1 splice variants (SV1 - SV5) were cloned into an expression vector possessing an
8xHis-tag and their expression was validated by transformation of prokaryotic cells and
transient transfection into eukaryotic cells. The evaluation of the splice variants was assessed
using protein over expression, purification by Ni-NTA agarose, and immunoblot studies. Ni-
NTA agarose was used to purify the expressed splice variants by their His-tag. The study
confirmed that the splice variants were not prone to removal by protein quality control
mechanisms of eukaryotic cells indicating a functional relevance. Unfortunately, the splice
variants could not be distinguished by polyacrylamide gel electrophoresis hampering their
proof in tissue samples. Colocalization between AIPL1 and CENP-F was shown in human
cell lines probably upon cell division but the envisaged interaction between these two
proteins could not be confirmed in immunoblot studies.
CENP-F interaction with AIPL1 may open new views in revealing the link between
photoreceptor maturation and segregation. Functional studies will have to clarify whether
AIPL1 function is influenced by these variants in the development and maintenance of
photoreceptors as well as to the pathogenicity of mutations located within the alternatively
spliced exons.

79
CHAPTER 6
Zusammenfassung
In dieser Studie wurden Spleißvarianten des AIPL1, dem vierten Gen das mit der Leberschen
kongenitalen Amaurose (LCA) assoziiert ist, auf ihre Beziehung zum Zellzyklusregulator
Zentromerprotein F (CENP-F) untersucht.
Die Studie befasste sich mit der Darstellung der AIPL1 Spleißvarianten (SV1 - SV5) auf
Proteinebene und deren Aktivität in Bezug auf CENP-F. Die Existenz der Spleißvarianten
könnte einen grundlegenden Einfluß auf die Interaktionen des AIPL1 mit anderen Proteinen
der retinalen Zellen haben und die Funktion von AIPL1 Mutationen in verschiedenen
Entwicklungstadien der Netzhaut beeinflußen.
AIPL1 Spleißvarianten (SV1 - SV5) wurden in einen Expressionsvektor kloniert, der einen
8xHis-tag exprimiert und ihre Expression wurde durch Transformation in prokaryotische
Zellen und transiente Transfektion in eukaryotische Zelle bewertet. Dies wurde mittels
Proteinüberexpression, Aufreinigung mit Ni-NTA Agarose und Immunoblotstudien
untersucht. Ni-NTA Agarose wurde zur Aufreinigung der exprimierten Proteine über den
8xHis-tag angwandt. Es zeigte sich, dass die Spleißvarianten expriomiert wurden und nicht in
Proteinqualitätskontrollen der eukaryotischen Zellen entfernt wurden. Dies unterstützte die
funktionelle Relevanz der Spleißvarianten. Eine Unterscheidung der Spleißvarianten über
polyacrylamidgelelektrophoretische Auftrennungsverfahren konnte nicht durchgeführt
werden, was die Möglichkeit eines Nachweises in Gewebeproben deutlich einschränkte.
Eine Kolokalisation von AIPL1 und CENP-F konnte in humanen Zellinien mutmaßlich
während der Zellteilung gezeigt werden. Eine direkte Interaktion zwischen diesen beiden
Proteinen konnte im Immunoblot nicht bestätigt werden.
Die Interaktion von CENP-F und AIPL1 eröffnet neue Interpretationsmöglichkeiten über die
Verknüpfung von AIPL1 mit der Photorezeptorreifung und -verteilung. Funktionelle Studien
werden klären müssen, ob AIPL1-Spleißvarianten die Funktion von AIPL1 in der
Entwicklung und Unterhaltung der Photorezeptoren beeinflussen und inwieweit Mutationen
in den alternativ gespleißten Exons Einfluß auf deren Pathogenität nehmen.

80
References
1 Akey DT, Zhu X, Dyer M, Li A, Sorensen A, Blackshaw S et al. The inherited blindness
associated protein AIPL1 interacts with the cell cycle regulator protein NUB1. Hum Mol Genet
2002; 11(22):2723-2733
2 Akey DT, Zhu X, Dyer M, Li A, Sorensen A, Fukada-Kamitani T et al. Functional studies of
AIPL1: potential role of AIPL1 in cell cycle exit and/or differentiation of photoreceptors. Adv
Exp Med Biol 2003; 533:287-95.:287-295
3 Anant JS, Ong OC, Xie HY, Clarke S, O'Brien PJ, Fung BK. In vivo differential prenylation of
retinal cyclic GMP phosphodiesterase catalytic subunits. J Biol Chem 1992; 267(2):687-690
4 Ashar HR, James L, Gray K, Carr D, Black S, Armstrong L et al. Farnesyl transferase inhibitors
block the farnesylation of CENP-E and CENP-F and alter the association of CENP-E with the
microtubules. J Biol Chem 2000; 275(39):30451-30457
5 Ashe M, Pabon-Pena L, Dees E, Price KL, Bader D. LEK1 is a potential inhibitor of pocket
protein-mediated cellular processes. J Biol Chem 2004; 279(1):664-676
6 Bett JS, Kanuga N, Richet E, Schmidtke G, Groettrup M, Cheetham ME et al. The Inherited
Blindness Protein AIPL1 Regulates the Ubiquitin-Like FAT10 Pathway. PLoS One 2012;
7(2):e30866
7 Blatch GL, Lassle M. The tetratricopeptide repeat: a structural motif mediating protein-protein
interactions. Bioessays 1999; 21(11):932-939
8 Bowne SJ, Sullivan LS, Mortimer SE, Hedstrom L, Zhu J, Spellicy CJ et al. Spectrum and
frequency of mutations in IMPDH1 associated with autosomal dominant retinitis pigmentosa
and leber congenital amaurosis. Invest Ophthalmol Vis Sci 2006; 47(1):34-42
9 Carver LA, Bradfield CA. Ligand-dependent interaction of the aryl hydrocarbon receptor with a
novel immunophilin homolog in vivo. J Biol Chem 1997; 272(17):11452-11456
10 Casiano CA, Humbel RL, Peebles C, Covini G, Tan EM. Autoimmunity to the cell cycle-
dependent centromere protein p330d/CENP-F in disorders associated with cell proliferation. J
Autoimmun 1995; 8(4):575-586
11 Chiang PW, Wang J, Chen Y, Fu Q, Zhong J, Chen Y et al. Exome sequencing identifies
NMNAT1 mutations as a cause of Leber congenital amaurosis. Nat Genet 2012; 44(9):972-974
12 Cote RH. Characteristics of photoreceptor PDE (PDE6): similarities and differences to PDE5.
Int J Impot Res 2004; 16 Suppl 1:S28-33.:S28-S33
13 Cremers FP, van den Hurk JA, den Hollander AI. Molecular genetics of Leber congenital
amaurosis. Hum Mol Genet 2002; 11(10):1169-1176
14 D'Andrea LD, Regan L. TPR proteins: the versatile helix. Trends Biochem Sci 2003;
28(12):655-662

81
15 den Hollander AI, Koenekoop RK, Mohamed MD, Arts HH, Boldt K, Towns KV et al.
Mutations in LCA5, encoding the ciliary protein lebercilin, cause Leber congenital amaurosis.
Nat Genet 2007; 39(7):889-895
16 den Hollander AI, Koenekoop RK, Yzer S, Lopez I, Arends ML, Voesenek KE et al. Mutations
in the CEP290 (NPHP6) Gene Are a Frequent Cause of Leber Congenital Amaurosis. Am J
Hum Genet 2006; 79(3):556-561
17 den Hollander AI, Roepman R, Koenekoop RK, Cremers FP. Leber congenital amaurosis:
genes, proteins and disease mechanisms. Prog Retin Eye Res 2008; 27(4):391-419
18 den Hollander AI, ten Brink JB, de Kok YJ, van Soest S, van den Born LI, van Driel MA et al.
Mutations in a human homologue of Drosophila crumbs cause retinitis pigmentosa (RP12). Nat
Genet 1999; 23(2):217-221
19 den Hollander AI, van Lith-Verhoeven JJ, Arends ML, Strom TM, Cremers FP, Hoyng CB.
Novel compound heterozygous TULP1 mutations in a family with severe early-onset retinitis
pigmentosa. Arch Ophthalmol 2007; 125(7):932-935
20 Dharmaraj S, Leroy BP, Sohocki MM, Koenekoop RK, Perrault I, Anwar K et al. The
phenotype of Leber congenital amaurosis in patients with AIPL1 mutations. Arch Ophthalmol
2004; 122(7):1029-1037
21 Dryja TP, Adams SM, Grimsby JL, McGee TL, Hong DH, Li T et al. Null RPGRIP1 alleles in
patients with leber congenital amaurosis. Am J Hum Genet 2001; 68(5):1295-1298
22 Du J, Zhang Y, Liu Y, Li Y, Zhu X. Involvement of Cenp-F in interphase chromatin
organization possibly through association with DNA-dependent protein kinase. Acta Biochim
Biophys Sin (Shanghai) 2010; 42(12):839-846
23 Du Z, Zhao D, Zhao Y, Wang S, Gao Y, Li N. Identification and characterization of bovine
regulator of telomere length elongation helicase gene (RTEL): molecular cloning, expression
distribution, splice variants and DNA methylation profile. BMC Mol Biol 2007; 8:18.:18
24 Dyer MA, Cepko CL. p57(Kip2) regulates progenitor cell proliferation and amacrine
interneuron development in the mouse retina. Development 2000; 127(16):3593-3605
25 Dyer MA, Cepko CL. p27Kip1 and p57Kip2 regulate proliferation in distinct retinal progenitor
cell populations. J Neurosci 2001; 21(12):4259-4271
26 Falk MJ, Zhang Q, Nakamaru-Ogiso E, Kannabiran C, Fonseca-Kelly Z, Chakarova C et al.
NMNAT1 mutations cause Leber congenital amaurosis. Nat Genet 2012; 44(9):1040-1045
27 Franceschetti A, MONNIER M, Dieterle P. [Analysis of oculomotor disorders with electro-
oculography]
Analyse des troubles de l'appareil oculo-moteur par l'electro-oculographie (EOG). Bull Schweiz
Akad Med Wiss 1954; 10(2):124-134

82
28 Freund CL, Wang QL, Chen S, Muskat BL, Wiles CD, Sheffield VC et al. De novo mutations
in the CRX homeobox gene associated with Leber congenital amaurosis. Nat Genet 1998;
18(4):311-312
29 Friedman JS, Chang B, Kannabiran C, Chakarova C, Singh HP, Jalali S et al. Premature
truncation of a novel protein, RD3, exhibiting subnuclear localization is associated with retinal
degeneration. Am J Hum Genet 2006; 79(6):1059-1070
30 Fukada Y, Kokame K, Okano T, Shichida Y, Yoshizawa T, McDowell JH et al.
Phosphorylation of iodopsin, chicken red-sensitive cone visual pigment. Biochemistry 1990;
29:10102-10106
31 Galvin JA, Fishman GA, Stone EM, Koenekoop RK. Clinical phenotypes in carriers of Leber
congenital amaurosis mutations. Ophthalmology 2005; 112(2):349-356
32 Gonzalez-Barrios R, Soto-Reyes E, Herrera LA. Assembling pieces of the centromere
epigenetics puzzle. Epigenetics 2012; 7(1):3-13
33 Goodwin RL, Pabon-Pena LM, Foster GC, Bader D. The cloning and analysis of LEK1
identifies variations in the LEK/centromere protein F/mitosin gene family. J Biol Chem 1999;
274(26):18597-18604
34 Graham FL, Smiley J, Russell WC, Nairn R. Characteristics of a human cell line transformed by
DNA from human adenovirus type 5. J Gen Virol 1977; 36(1):59-74
35 Gu S, Thompson DA, Srisailapathy Srikumari CR, Lorenz B, Finckh U, Nicoletti A et al.
Mutations in RPE65 cause autosomal recessive childhood-onset severe retinal dystrophy. Nat
Genet 1997; 17(2):194-197
36 Hengen P. Purification of His-Tag fusion proteins from Escherichia coli. Trends Biochem Sci
1995; 20(7):285-286
37 Hidalgo-de-Quintana J, Evans RJ, Cheetham ME, van der SJ. The Leber congenital amaurosis
protein AIPL1 functions as part of a chaperone heterocomplex. Invest Ophthalmol Vis Sci
2008; 49(7):2878-2887
38 Hiller M, Platzer M. Widespread and subtle: alternative splicing at short-distance tandem sites.
Trends Genet 2008; 24(5):246-255
39 Inglese J, Glickman JF, Lorenz W, Caron MG, Lefkowitz RJ. Isoprenylation of a protein
kinase. Requirement of farnesylation/alpha-carboxyl methylation for full enzymatic activity of
rhodopsin kinase. J Biol Chem 1992; 267(3):1422-1425
40 Janke B, Lorenz B, Preising M. Functional Analysis of AIPL1 Mutations and Splice Variants.
ARVO Meeting Abstracts 48[5], 4667. 10-5-2007.
41 Janke B, Lorenz B, Preising MN. Alternative Splicing in AIPL1 - Implications On Function
And The Mutational Spectrum. (Abstract) ARVO Meeting Abstracts (Abstract) 45(5), 2481. 1-
5-2004. Online Reference: http://abstracts.iovs.org/cgi/content/abstract/45/5/2481.

83
42 Janke B, Lorenz B, Preising MN. Alternative Splicing of LCA Gene AIPL1 Is Conserved in
Mammals. (Abstract) ARVO Meeting Abstracts (Abstract) 46(5), 3101. 1-5-2005. Online
Reference: http://abstracts.iovs.org/cgi/content/abstract/46/5/3101.
43 Kanaya K, Sohocki MM, Kamitani T. Abolished interaction of NUB1 with mutant AIPL1
involved in Leber congenital amaurosis. Biochem Biophys Res Commun 2004; 317(3):768-773
44 Kaplan J, Bonneau D, Frezal J, Munnich A, Dufier JL. Clinical and genetic heterogeneity in
retinitis pigmentosa. Hum Genet 1990; 85:635-642
45 Karni R, de SE, Lowe SW, Sinha R, Mu D, Krainer AR. The gene encoding the splicing factor
SF2/ASF is a proto-oncogene. Nat Struct Mol Biol 2007; 14(3):185-193
46 Kay BK, Williamson MP, Sudol M. The importance of being proline: the interaction of proline-
rich motifs in signaling proteins with their cognate domains. FASEB J 2000; 14(2):231-241
47 Kim E, Goren A, Ast G. Alternative splicing and disease. RNA Biol 2008; 5(1):17-19
48 Kim E, Goren A, Ast G. Alternative splicing: current perspectives. Bioessays 2008; 30(1):38-47
49 Kim E, Magen A, Ast G. Different levels of alternative splicing among eukaryotes. Nucleic
Acids Res 2007; 35(1):125-131
50 Kimmins S, MacRae TH. Maturation of steroid receptors: an example of functional cooperation
among molecular chaperones and their associated proteins. Cell Stress Chaperones 2000;
5(2):76-86
51 Kirschman LT, Kolandaivelu S, Frederick JM, Dang L, Goldberg AF, Baehr W et al. The Leber
congenital amaurosis protein, AIPL1, is needed for the viability and functioning of cone
photoreceptor cells. Hum Mol Genet 2010; 19(6):1076-1087
52 Kito K, Yeh ET, Kamitani T. NUB1, a NEDD8-interacting protein, is induced by interferon and
down-regulates the NEDD8 expression. J Biol Chem 2001; 276(23):20603-20609
53 Koenekoop RK, Wang H, Majewski J, Wang X, Lopez I, Ren H et al. Mutations in NMNAT1
cause Leber congenital amaurosis and identify a new disease pathway for retinal degeneration.
Nat Genet 2012; 44(9):1035-1039
54 Kolandaivelu S, Huang J, Hurley JB, Ramamurthy V. AIPL1, a protein associated with
childhood blindness, interacts with alpha-subunit of rod phosphodiesterase (PDE6) and is
essential for its proper assembly. J Biol Chem 2009; 284(45):30853-30861
55 Kosmaoglou M, Schwarz N, Bett JS, Cheetham ME. Molecular chaperones and photoreceptor
function. Prog Retin Eye Res 2008; 27(4):434-449
56 Krause M, Ukkonen K, Haataja T, Ruottinen M, Glumoff T, Neubauer A et al. A novel fed-
batch based cultivation method provides high cell-density and improves yield of soluble
recombinant proteins in shaken cultures. Microb Cell Fact 2010; 9:11
57 Kuksa V, Imanishi Y, Batten M, Palczewski K, Moise AR. Retinoid cycle in the vertebrate
retina: experimental approaches and mechanisms of isomerization. Vision Res 2003;
43(28):2959-2981

84
58 Lai RK, Perez-Sala D, Canada FJ, Rando RR. The gamma subunit of transducin is farnesylated.
Proc Natl Acad Sci U S A 1990; 87(19):7673-7677
59 Lamb TD, Pugh EN, Jr. Dark adaptation and the retinoid cycle of vision. Prog Retin Eye Res
2004; 23(3):307-380
60 Landschulz WH, Johnson PF, McKnight SL. The leucine zipper: a hypothetical structure
common to a new class of DNA binding proteins. Science 1988; 240(4860):1759-1764
61 Leber T. Über Retinitis pigmentosa und angeborene Amaurose. Albrecht von Graefes Arch
Ophthal 1869; 15:1-25
62 Li J, Zoldak G, Kriehuber T, Soroka J, Schmid FX, Richter K et al. Unique proline-rich domain
regulates the chaperone function of AIPL1. Biochemistry 2013; 52(12):2089-2096
63 Liao H, Winkfein RJ, Mack G, Rattner JB, Yen TJ. CENP-F is a protein of the nuclear matrix
that assembles onto kinetochores at late G2 and is rapidly degraded after mitosis. J Cell Biol
1995; 130(3):507-518
64 Liu M, Zack D. Alternative splicing and retinal degeneration. Clin Genet 2013;10
65 Liu X, Bulgakov OV, Wen XH, Woodruff ML, Pawlyk B, Yang J et al. AIPL1, the protein that
is defective in Leber congenital amaurosis, is essential for the biosynthesis of retinal rod cGMP
phosphodiesterase. Proc Natl Acad Sci U S A 2004; 101(38):13903-13908
66 Ma L, Zhao X, Zhu X. Mitosin/CENP-F in mitosis, transcriptional control, and differentiation. J
Biomed Sci 2006; 13(2):205-213
67 Makino CL, Wen XH, Michaud N, Peshenko IV, Pawlyk B, Brush RS et al. Effects of low
AIPL1 expression on phototransduction in rods. Invest Ophthalmol Vis Sci 2006; 47(5):2185-
2194
68 Mataftsi A, Schorderet DF, Chachoua L, Boussalah M, Nouri MT, Barthelmes D et al. Novel
TULP1 mutation causing leber congenital amaurosis or early onset retinal degeneration. Invest
Ophthalmol Vis Sci 2007; 48(11):5160-5167
69 Modrek B, Lee CJ. Alternative splicing in the human, mouse and rat genomes is associated with
an increased frequency of exon creation and/or loss. Nat Genet 2003; 34(2):177-180
70 Palczewski K, Kumasaka T, Hori T, Behnke CA, Motoshima H, Fox BA et al. Crystal structure
of rhodopsin: a G protein-coupled receptor. Science 2000; 289:739-745
71 Parker RO, Fan J, Nickerson JM, Liou GI, Crouch RK. Normal cone function requires the
interphotoreceptor retinoid binding protein. J Neurosci 2009; 29(14):4616-4621
72 Pasadhika S, Fishman GA, Stone EM, Lindeman M, Zelkha R, Lopez I et al. Differential
macular morphology in patients with RPE65-, CEP290-, GUCY2D-, and AIPL1-related Leber
congenital amaurosis. Invest Ophthalmol Vis Sci 2010; 51(5):2608-2614
73 Perrault I, Hanein S, Gerard X, Delphin N, Fares-Taie L, Gerber S et al. Spectrum of SPATA7
mutations in Leber congenital amaurosis and delineation of the associated phenotype. Hum
Mutat 2010; 31(3):E1241-E1250

85
74 Perrault I, Hanein S, Gerber S, Barbet F, Ducroq D, Dollfus H et al. Retinal dehydrogenase 12
(RDH12) mutations in leber congenital amaurosis. Am J Hum Genet 2004; 75(4):639-646
75 Perrault I, Hanein S, Zanlonghi X, Serre V, Nicouleau M, foort-Delhemmes S et al. Mutations
in NMNAT1 cause Leber congenital amaurosis with early-onset severe macular and optic
atrophy. Nat Genet 2012; 44(9):975-977
76 Perrault I, Rozet JM, Calvas P, Gerber S, Camuzat A, Dollfus H et al. Retinal-specific
guanylate cyclase gene mutations in Leber's congenital amaurosis. Nat Genet 1996; 14(4):461-
464
77 Perrault I, Rozet JM, Gerber S, Ghazi I, Leowski C, Ducroq D et al. Leber Congenital
Amaurosis. Mol Genet Metab 1999; 68(2):200-208
78 Petrulis JR, Perdew GH. The role of chaperone proteins in the aryl hydrocarbon receptor core
complex. Chem Biol Interact 2002; 141(1-2):25-40
79 Preising MN, Hausotter-Will N, Solbach MC, Friedburg C, Rüschendorf F, Lorenz B.
Mutations in RD3 are associated with an extremely rare and severe form of early onset retinal
dystrophy EOSRD. Invest Ophthalmol Vis Sci 2012; 53(7):3463-3472
80 Ramamurthy V, Niemi GA, Reh TA, Hurley JB. Leber congenital amaurosis linked to AIPL1: a
mouse model reveals destabilization of cGMP phosphodiesterase. Proc Natl Acad Sci U S A
2004; 101(38):13897-13902
81 Ramamurthy V, Roberts M, Van Den AF, Niemi G, Reh TA, Hurley JB. AIPL1, a protein
implicated in Leber's congenital amaurosis, interacts with and aids in processing of farnesylated
proteins. Proc Natl Acad Sci U S A 2003; 100(22):12630-12635
82 Rando RR. The biochemistry of the visual cycle. Chem Rev 2001; 101(7):1881-1896
83 Rattner JB, Rao A, Fritzler MJ, Valencia DW, Yen TJ. CENP-F is a .ca 400 kDa kinetochore
protein that exhibits a cell-cycle dependent localization. Cell Motil Cytoskeleton 1993;
26(3):214-226
84 SCHAPPERT-KIMMIJSER J, HENKES HE, Van Den Bosch J. Amaurosis congenita (Leber).
AMA Arch Ophthalmol 1959; 61(2):211-218
85 Sergouniotis PI, Davidson AE, Mackay DS, Li Z, Yang X, Plagnol V et al. Recessive Mutations
in KCNJ13, Encoding an Inwardly Rectifying Potassium Channel Subunit, Cause Leber
Congenital Amaurosis. Am J Hum Genet 2011; 89(1):183-190
86 Serio G, Margaria V, Jensen S, Oldani A, Bartek J, Bussolino F et al. Small GTPase Rab5
participates in chromosome congression and regulates localization of the centromere-associated
protein CENP-F to kinetochores. Proc Natl Acad Sci U S A 2011; 108(42):17337-17342
87 Smith RL, Redd MJ, Johnson AD. The tetratricopeptide repeats of Ssn6 interact with the homeo
domain of alpha 2. Genes Dev 1995; 9(23):2903-2910

86
88 Sohocki MM, Bowne SJ, Sullivan LS, Blackshaw S, Cepko CL, Payne AM et al. Mutations in a
new photoreceptor-pineal gene on 17p cause Leber congenital amaurosis. Nat Genet 2000;
24(1):79-83
89 Sohocki MM, Perrault I, Leroy BP, Payne AM, Dharmaraj S, Bhattacharya SS et al. Prevalence
of AIPL1 mutations in inherited retinal degenerative disease. Mol Genet Metab 2000;
70(2):142-150
90 Stamm S, Ben-Ari S, Rafalska I, Tang Y, Zhang Z, Toiber D et al. Function of alternative
splicing. Gene 2005; 344:1-20
91 Sun X, Pawlyk B, Xu X, Liu X, Bulgakov OV, Adamian M et al. Gene therapy with a promoter
targeting both rods and cones rescues retinal degeneration caused by AIPL1 mutations. Gene
Ther 2010; 17(1):117-131
92 Swaroop A, Kim D, Forrest D. Transcriptional regulation of photoreceptor development and
homeostasis in the mammalian retina. Nat Rev Neurosci 2010; 11(8):563-576
93 Sweeney MO, McGee TL, Berson EL, Dryja TP. Low prevalence of lecithin retinol
acyltransferase mutations in patients with Leber congenital amaurosis and autosomal recessive
retinitis pigmentosa. Mol Vis 2007; 13:588-593
94 Tamanoi F, Kato-Stankiewicz J, Jiang C, Machado I, Thapar N. Farnesylated proteins and cell
cycle progression. J Cell Biochem Suppl 2001; Suppl 37:64-70.:64-70
95 Tan MH, Mackay DS, Cowing J, Tran HV, Smith AJ, Wright GA et al. Leber Congenital
Amaurosis Associated with AIPL1: Challenges in Ascribing Disease Causation, Clinical
Findings, and Implications for Gene Therapy. PLoS One 2012; 7(3):e32330
96 Tan MH, Smith AJ, Pawlyk B, Xu X, Liu X, Bainbridge JB et al. Gene therapy for retinitis
pigmentosa and Leber congenital amaurosis caused by defects in AIPL1: effective rescue of
mouse models of partial and complete Aipl1 deficiency using AAV2/2 and AAV2/8 vectors.
Hum Mol Genet 2009; 18(12):2099-2114
97 van der Spuy J, Chapple JP, Clark BJ, Luthert PJ, Sethi CS, Cheetham ME. The Leber
congenital amaurosis gene product AIPL1 is localized exclusively in rod photoreceptors of the
adult human retina. Hum Mol Genet 2002; 11(7):823-831
98 van der Spuy J, Cheetham ME. The chaperone function of the LCA protein AIPL1. AIPL1
chaperone function. Adv Exp Med Biol 2006; 572:471-476
99 van der Spuy J, Kim JH, Yu YS, Luthert PJ, Chapple JP, Cheetham ME. Spatial and Temporal
Expression of AIPL1 and NUB1 Protein in Human Retina (Abstract). Ft. Lauderdale, 4. -
9.5.2003: The Association For Research In Vision And Ophthalmology (ARVO), 2003.
100 van der Spuy J, Kim JH, Yu YS, Szel A, Luthert PJ, Clark BJ et al. The expression of the Leber
congenital amaurosis protein AIPL1 coincides with rod and cone photoreceptor development.
Invest Ophthalmol Vis Sci 2003; 44(12):5396-5403

87
101 Varis A, Salmela AL, Kallio MJ. Cenp-F (mitosin) is more than a mitotic marker. Chromosoma
2006; 115(4):288-295
102 Walia S, Fishman GA, Jacobson SG, Aleman TS, Koenekoop RK, Traboulsi EI et al. Visual
acuity in patients with Leber's congenital amaurosis and early childhood-onset retinitis
pigmentosa. Ophthalmology 2010; 117(6):1190-1198
103 Wang GS, Cooper TA. Splicing in disease: disruption of the splicing code and the decoding
machinery. Nat Rev Genet 2007; 8(10):749-761
104 Wang H, den Hollander AI, Moayedi Y, Abulimiti A, Li Y, Collin RW et al. Mutations in
SPATA7 cause Leber congenital amaurosis and juvenile retinitis pigmentosa. Am J Hum Genet
2009; 84(3):380-387
105 Wright AF, Chakarova CF, bd El-Aziz MM, Bhattacharya SS. Photoreceptor degeneration:
genetic and mechanistic dissection of a complex trait. Nat Rev Genet 2010; 11(4):273-284
106 Young JE, Gross KG, Khani SC. A Short Enhancer Segment of the Human Rhodopsin Kinase
(Rk) Promoter Drives Robust Expression of Green Fluorescent Protein and Other Reporters in
Transgenic Mouse Photoreceptors and Retinoblastoma Cell Lines (Abstract). Ft. Lauderdale, 4.
- 9.5.2003: The Association For Research In Vision And Ophthalmology (ARVO), 2003.
107 Zhou X, Wang R, Fan L, Li Y, Ma L, Yang Z et al. Mitosin/CENP-F as a negative regulator of
activating transcription factor-4. J Biol Chem 2005; 280(14):13973-13977
108 Zhu X. Structural requirements and dynamics of mitosin-kinetochore interaction in M phase.
Mol Cell Biol 1999; 19(2):1016-1024
109 Zhu X, Chang KH, He D, Mancini MA, Brinkley WR, Lee WH. The C terminus of mitosin is
essential for its nuclear localization, centromere/kinetochore targeting, and dimerization. J Biol
Chem 1995; 270(33):19545-19550
110 Zhu X, Mancini MA, Chang KH, Liu CY, Chen CF, Shan B et al. Characterization of a novel
350-kilodalton nuclear phosphoprotein that is specifically involved in mitotic-phase
progression. Mol Cell Biol 1995; 15(9):5017-5029

88
Acknowledgements
First and foremost I express special thanks to my principal supervisor, PD Dr. Dipl-Biol.
Markus Preising, who provided me the opportunity to pursue my research and for his
professional guidance throughout my doctoral endeavor.
My sincere thanks go to Professor Birgit Lorenz for providing lab space and funding for my
research. I would like to thank Prof Dr. Dr. Jürgen Henning who is my co-supervisor for my
PhD studies. I would like to thank PD Dr. Dr. med. vet. Knut Stieger for his valuable
suggestions in the lab meetings during my research career. I thank Dr. P Sundaresan with
whom I had a wonderful time during his visit to Giessen, Germany as well my visits to the
Aravida eye clinic Madhurai, India.
My special thanks go to Anabella who helped me in getting acquainted with the equipment
and softwares in the lab during my early days of PhD. My heartfelt thanks go to Tobias
Wimmer, whose suggestions helped in solving various technical aspects of my research work.
A word of gratitude goes to all my colleagues for their insightful discussions and cooperation
throughout my research work.
I would like to extend my sincere thanks to “Giessen Graduate College of Life sciences”
(GGL), where I had the opportunity to acquire scientific knowledge as well as soft skills. I
thank all my wg-mates who are very cheerful and made my life all the time happening. I
would like to thank my grandfather who always encouraged me in choosing the path for
higher studies. I take this as an opportunity to thank my beloved parents Parise Satya Vara
Prasad & Krishna Kumari, brothers Ajay Kumar and Chaitanya Kishore living miles away in
my home country but still extending their immense support, constant encouragement, love
and affection.
I am greatly indebted to my beloved wife Devi for her huge support during tough times of my
career. I thank my dear friends Ramesh, P.V, Purushotham, Neelam, Balaji, Ravi Kumar, Raj
Kumar, Kokila, Seemun Ray and all my buddies who gave immense support during my
research.

89
Declaration
I declare that I have completed this dissertation single-handedly without the unauthorized
help of a second party and only with the assistance acknowledged therein. I have
appropriately acknowledged and referenced all text passages that are derived literally from or
are based on the content of published or unpublished work of others, and all information that
relates to verbal communications. I have abided by the principles of good scientific conduct
laid down in the charter of the Justus Liebig University of Giessen in carrying out the
investigations described in the dissertation.
Place and Date Bhupesh Parise