Embed Size (px)
Citation preview
SPLASH! Your Way Into Modeling Page | 1
SPLASH! Your Way Into Modeling
Created by Anne Gallagher
Modeling Process
Lesson 1: Keeping Cool: Exploration of Linear Functions
Lesson 2: The Immortal HeLa Cells: Exploration of Exponential Functions
Lesson 3: Does Everything Grow Forever?
References and Attribution
Except where otherwise noted, this work by Anne Gallagher, is available under a Creative Commons
Attribution-NonCommercial international License. All logos and trademarks are property of their
respective owners.
Image by Clker-Free-Vector-Images from Pixabay
The development of these lessons was made possible by a generous grant from the Rita Lowe
Washington State Math Council Scholarship.
Lesson 1
SPLASH! Your Way Into Modeling Page | 2
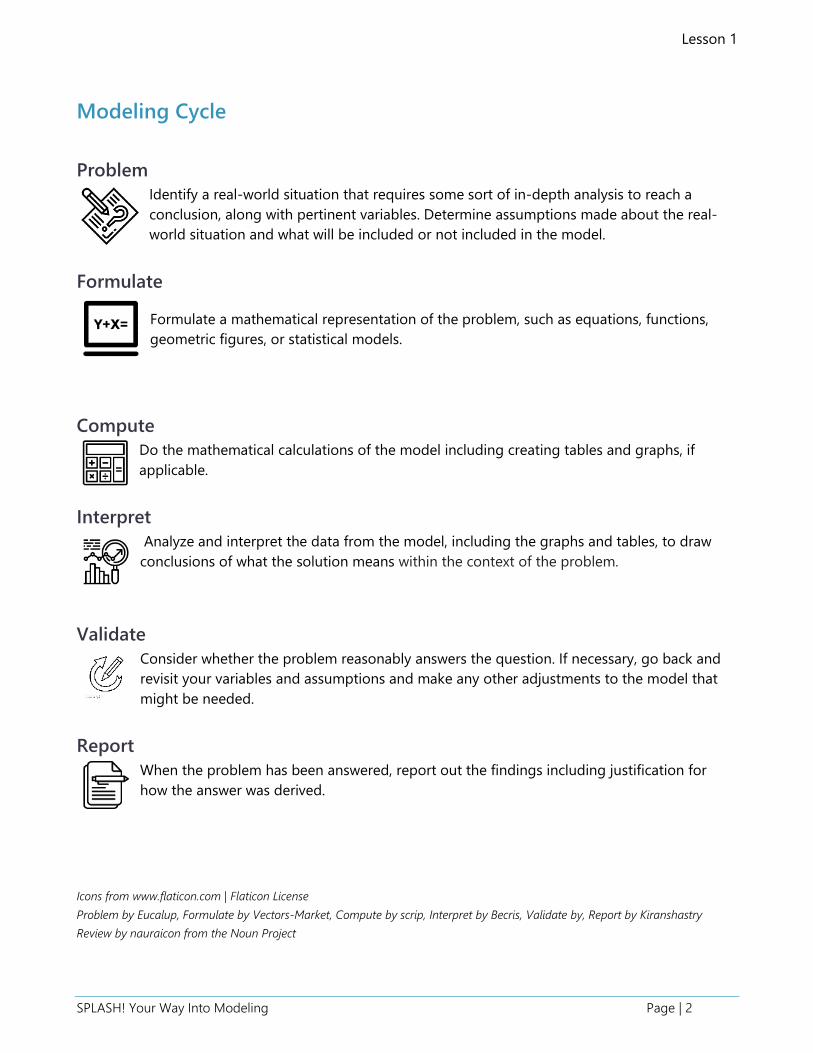
Modeling Cycle
Problem
Identify a real-world situation that requires some sort of in-depth analysis to reach a
conclusion, along with pertinent variables. Determine assumptions made about the real-
world situation and what will be included or not included in the model.
Formulate
Formulate a mathematical representation of the problem, such as equations, functions,
geometric figures, or statistical models.
Compute
Do the mathematical calculations of the model including creating tables and graphs, if
applicable.
Interpret
Analyze and interpret the data from the model, including the graphs and tables, to draw
conclusions of what the solution means within the context of the problem.
Validate
Consider whether the problem reasonably answers the question. If necessary, go back and
revisit your variables and assumptions and make any other adjustments to the model that
might be needed.
Report
When the problem has been answered, report out the findings including justification for
how the answer was derived.
Icons from www.flaticon.com | Flaticon License
Problem by Eucalup, Formulate by Vectors-Market, Compute by scrip, Interpret by Becris, Validate by, Report by Kiranshastry
Review by nauraicon from the Noun Project
Lesson 1
SPLASH! Your Way Into Modeling Page | 3
SPLASH! Your Way Into Modeling
Lesson 1: Keeping Cool: Exploration of Linear Functions
1.1 Matching Graphs – Filling Containers
In your group, review the containers and the graphs showing how the volume of the water changes as
the height of the water increases. Match the shape with the graph. There is one graph per shape.
Be prepared to explain your reasoning.
For the remaining graphs, draw what the container could look like.
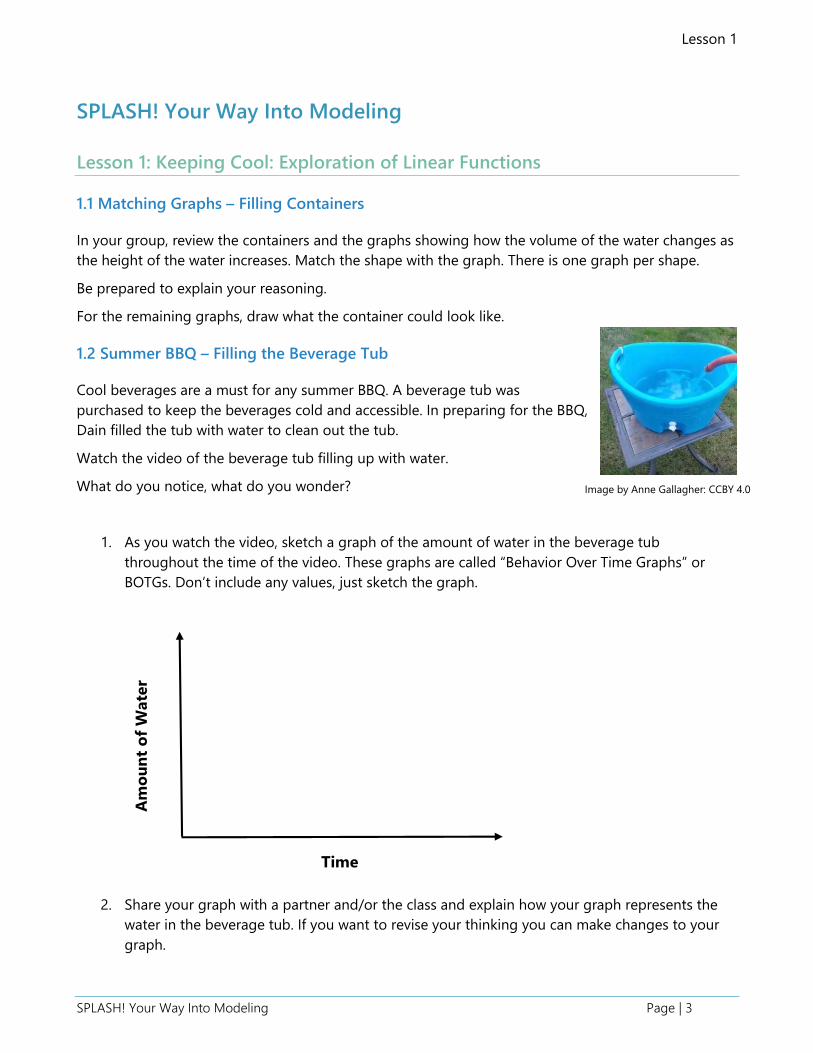
1.2 Summer BBQ – Filling the Beverage Tub
Cool beverages are a must for any summer BBQ. A beverage tub was
purchased to keep the beverages cold and accessible. In preparing for the BBQ,
Dain filled the tub with water to clean out the tub.
Watch the video of the beverage tub filling up with water.
What do you notice, what do you wonder?
1. As you watch the video, sketch a graph of the amount of water in the beverage tub
throughout the time of the video. These graphs are called “Behavior Over Time Graphs” or
BOTGs. Don’t include any values, just sketch the graph.
2. Share your graph with a partner and/or the class and explain how your graph represents the
water in the beverage tub. If you want to revise your thinking you can make changes to your
graph.
Time
Am
ou
nt
of
Wate
r
Image by Anne Gallagher: CCBY 4.0
Lesson 1
SPLASH! Your Way Into Modeling Page | 4
3. Now you will be more precise and add values to the graph. Think about what values you would
put on the x-axis (Time) and the y-axis (Amount of Water) based on the video.
Collaborate with your group and discuss what values you would put on the graph for Time and
Amount of Water. These values should reasonably match with the video. Discuss how you determined
these values and if your group agrees they are accurate. You can make any revisions to the values in
your graph based on your discussion.
4. Create a table of values that represents the data from your graph.
Lesson 1
SPLASH! Your Way Into Modeling Page | 5
5. What is the rate of the water flowing from the hose? How did you determine this? Revise your
rate to gallons/minute.
1.3 Creating a SPLASH! Mathematical Model - Simulation of the Filling Beverage Tub
Simulations are like the real event, but not the real event.
You are going to build a mathematical model of the beverage tub filling up with water using an app
called “SPLASH!”.
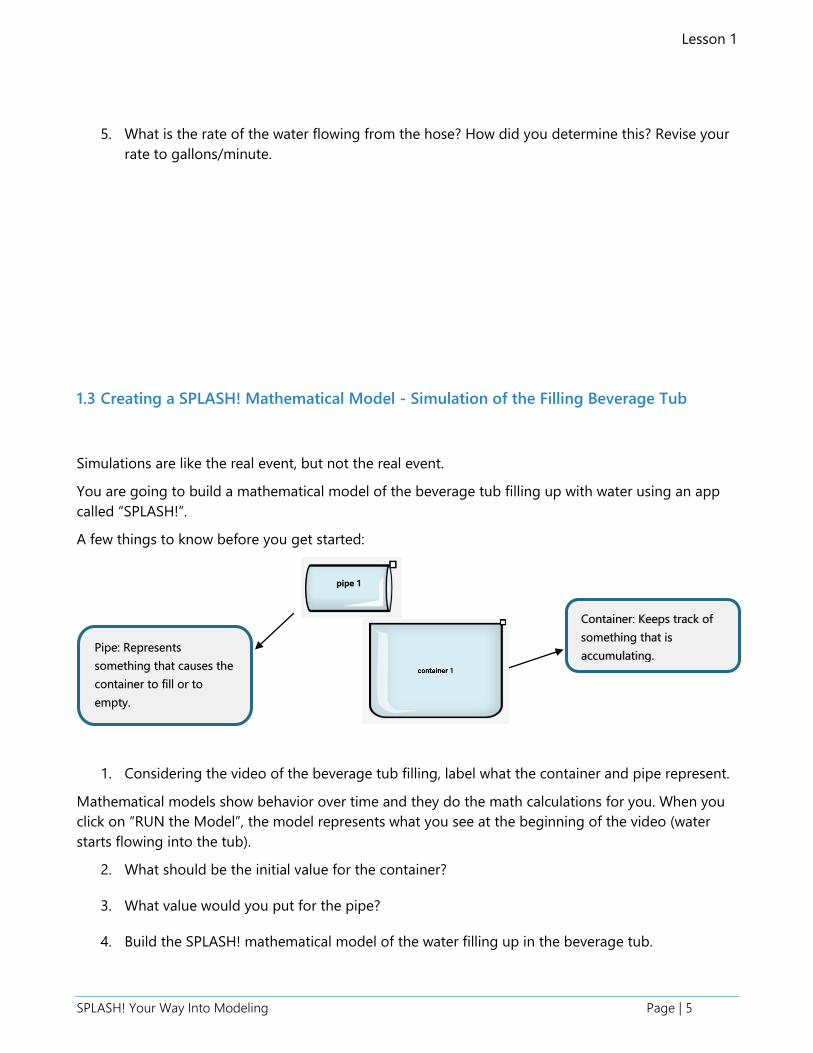
A few things to know before you get started:
1. Considering the video of the beverage tub filling, label what the container and pipe represent.
Mathematical models show behavior over time and they do the math calculations for you. When you
click on “RUN the Model”, the model represents what you see at the beginning of the video (water
starts flowing into the tub).
2. What should be the initial value for the container?
3. What value would you put for the pipe?
4. Build the SPLASH! mathematical model of the water filling up in the beverage tub.
Container: Keeps track of
something that is
accumulating. Pipe: Represents
something that causes the
container to fill or to
empty.
Lesson 1
SPLASH! Your Way Into Modeling Page | 6
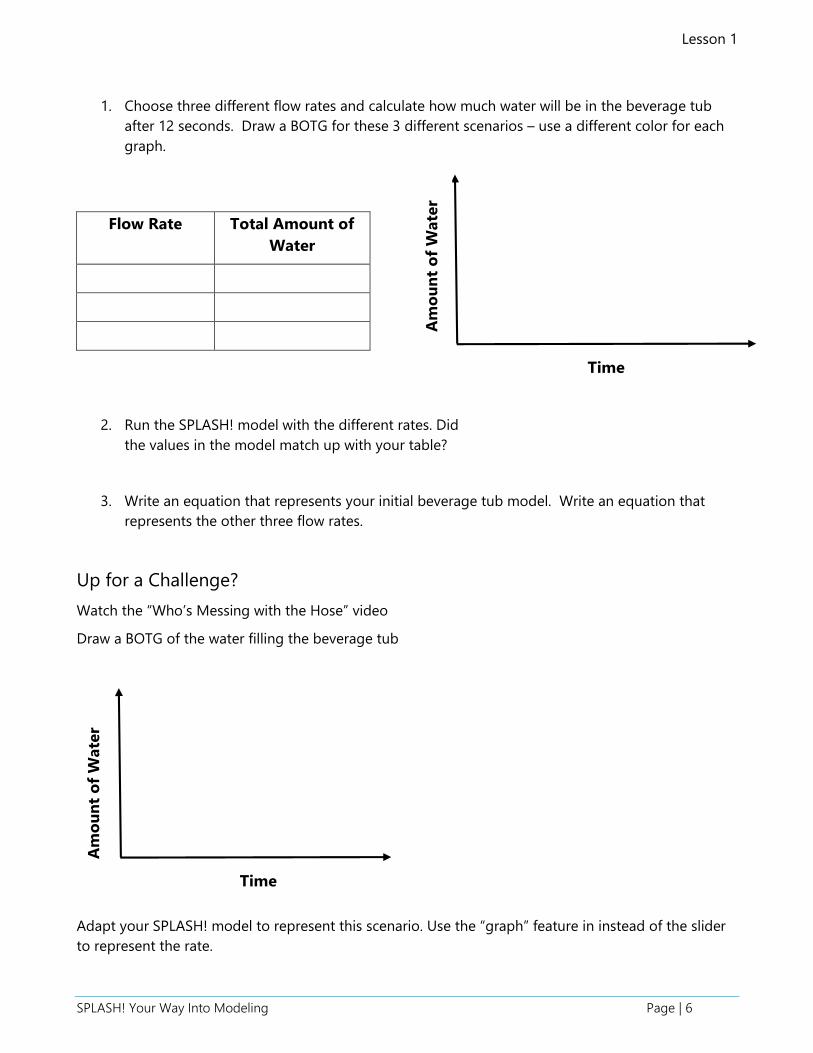
1. Choose three different flow rates and calculate how much water will be in the beverage tub
after 12 seconds. Draw a BOTG for these 3 different scenarios – use a different color for each
graph.
Flow Rate Total Amount of
Water
2. Run the SPLASH! model with the different rates. Did
the values in the model match up with your table?
3. Write an equation that represents your initial beverage tub model. Write an equation that
represents the other three flow rates.
Up for a Challenge?
Watch the “Who’s Messing with the Hose” video
Draw a BOTG of the water filling the beverage tub
Adapt your SPLASH! model to represent this scenario. Use the “graph” feature in instead of the slider
to represent the rate.
Time
Am
ou
nt
of
Wate
r
Time
Am
ou
nt
of
Wate
r
Lesson 1
SPLASH! Your Way Into Modeling Page | 7
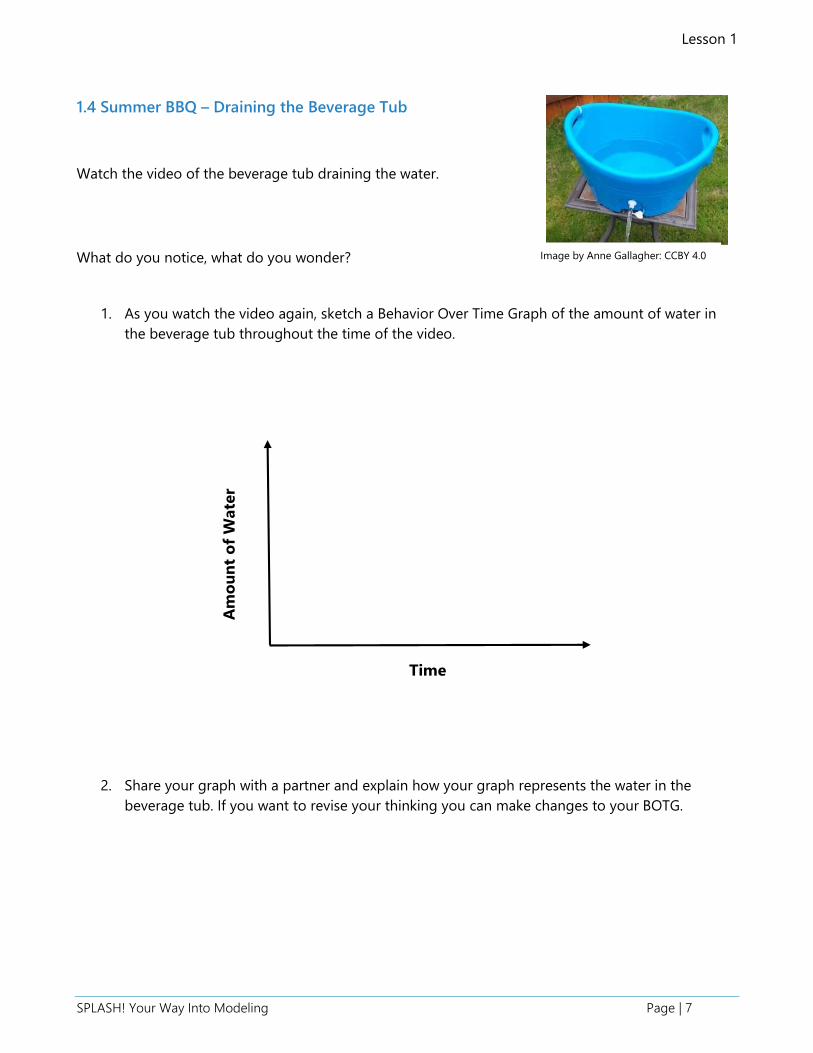
1.4 Summer BBQ – Draining the Beverage Tub
Watch the video of the beverage tub draining the water.
What do you notice, what do you wonder?
1. As you watch the video again, sketch a Behavior Over Time Graph of the amount of water in
the beverage tub throughout the time of the video.
2. Share your graph with a partner and explain how your graph represents the water in the
beverage tub. If you want to revise your thinking you can make changes to your BOTG.
Time
Am
ou
nt
of
Wate
r
Image by Anne Gallagher: CCBY 4.0
Lesson 1
SPLASH! Your Way Into Modeling Page | 8
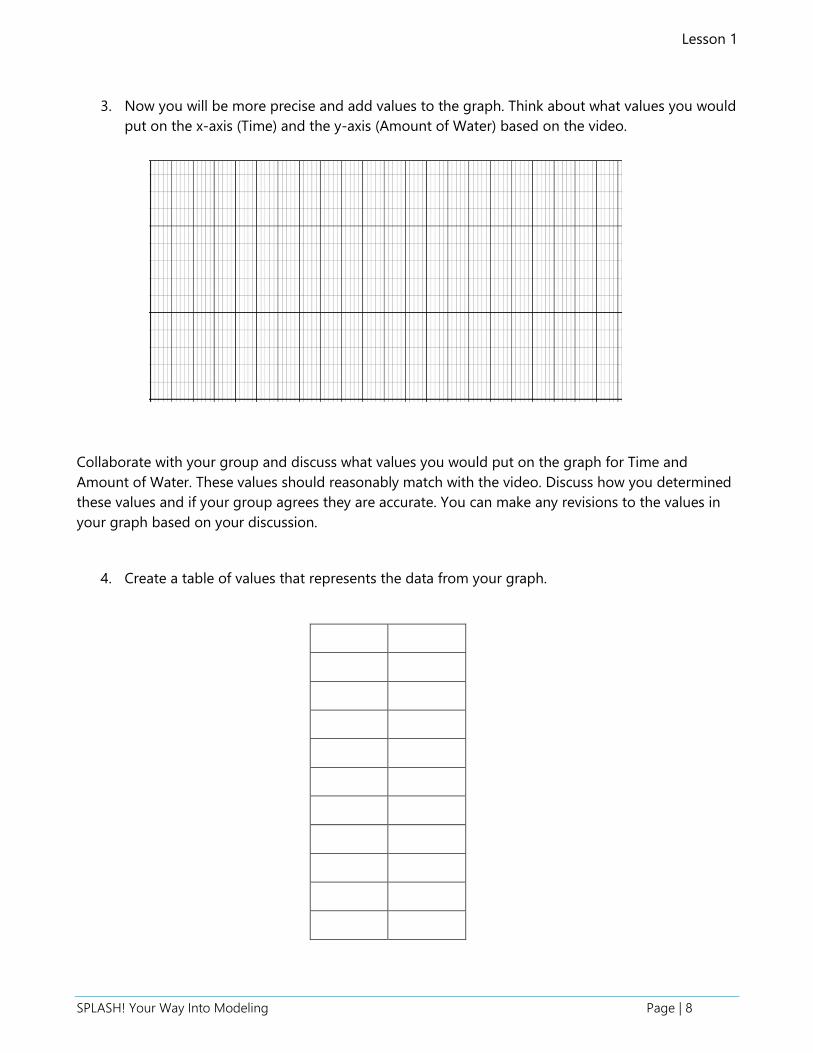
3. Now you will be more precise and add values to the graph. Think about what values you would
put on the x-axis (Time) and the y-axis (Amount of Water) based on the video.
Collaborate with your group and discuss what values you would put on the graph for Time and
Amount of Water. These values should reasonably match with the video. Discuss how you determined
these values and if your group agrees they are accurate. You can make any revisions to the values in
your graph based on your discussion.
4. Create a table of values that represents the data from your graph.
Lesson 1
SPLASH! Your Way Into Modeling Page | 9
5. What is the rate of the water draining from the beverage tub? How did you determine this?
1.5 Creating a SPLASH! Mathematical Model - Simulation of the Draining Beverage Tub
Create a new SPLASH! mathematical model or adapt your current SPLASH! model to simulate the
water draining out of the beverage tub.
1. What should be the initial value for the container?
2. What value would you put for the pipe?
1.6 Inflows and Outflows - The World Around Us
Each student will be given a scenario card. Get into partners. Partner #1 will share an example
of what would be an inflow and outflow for their scenario. Partner #2 has to come up with a
different example of an inflow and outflow. Partner #2 will share the inflow and outflow for
their scenario. Partner #1 has to come up with a different example of an inflow and outflow.
Find a new partner and exchange cards. Repeat.
Lesson 1
SPLASH! Your Way Into Modeling Page | 10
1.7 Creating a SPLASH! Mathematical Model - Simulation of the Filling and Draining
Beverage Tub
Watch the 3rd video of the water flowing in and out of the beverage tub at the same time.
1. How does the behavior or graph of this scenario of the beverage tub compare to the previous
graphs?
Revise your SPLASH! model to reflect the water flowing into AND out of the beverage tub.
Determine your initial value, the rate of the water flowing out and your units.
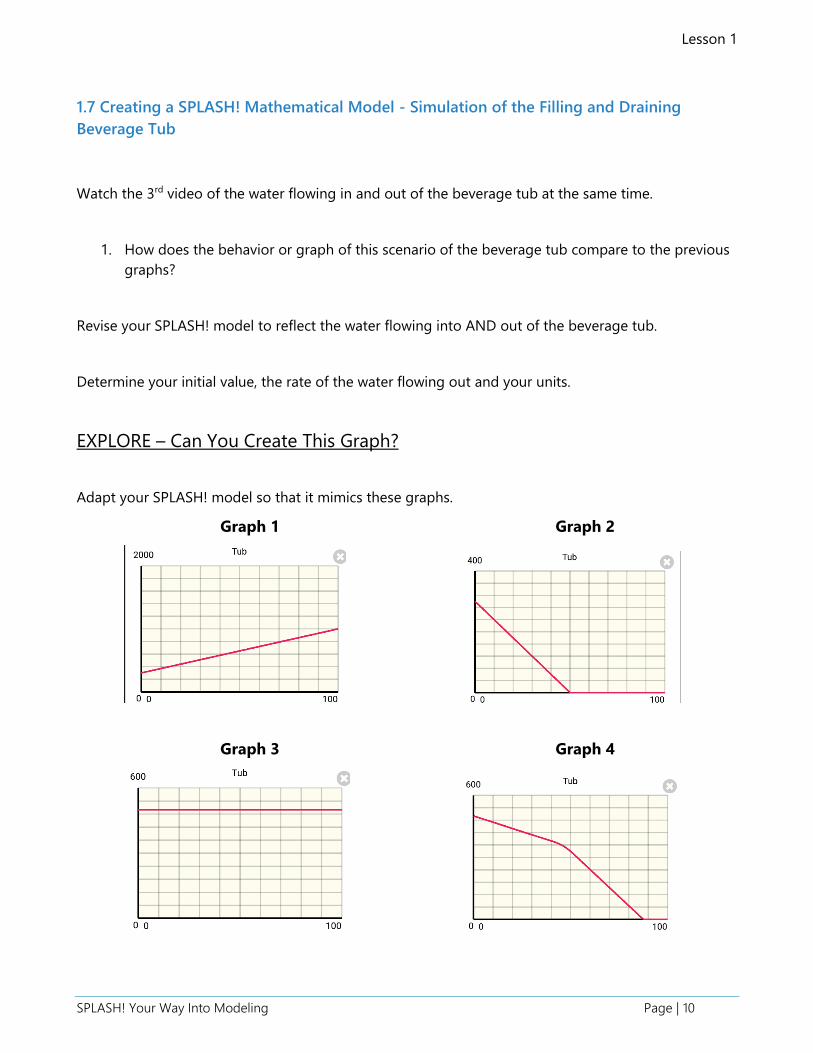
EXPLORE – Can You Create This Graph?
Adapt your SPLASH! model so that it mimics these graphs.
Graph 1 Graph 2
Graph 3 Graph 4
Lesson 1
SPLASH! Your Way Into Modeling Page | 11
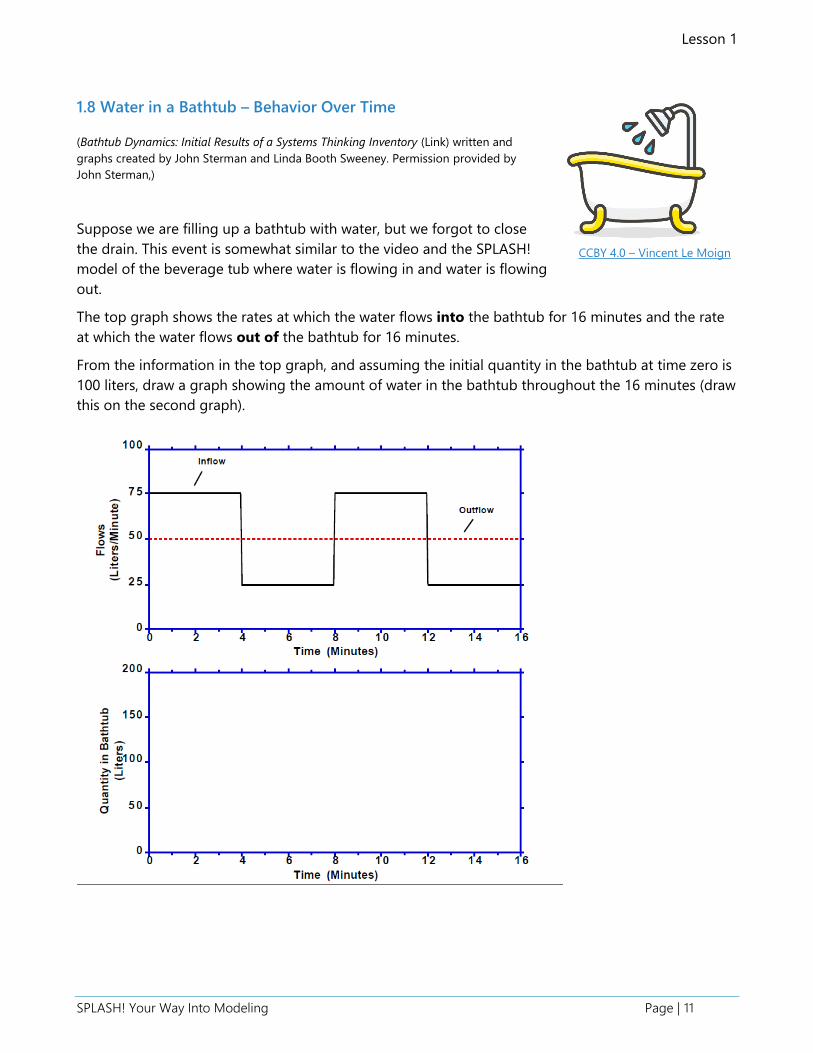
1.8 Water in a Bathtub – Behavior Over Time
(Bathtub Dynamics: Initial Results of a Systems Thinking Inventory (Link) written and
graphs created by John Sterman and Linda Booth Sweeney. Permission provided by
John Sterman,)
Suppose we are filling up a bathtub with water, but we forgot to close
the drain. This event is somewhat similar to the video and the SPLASH!
model of the beverage tub where water is flowing in and water is flowing
out.
The top graph shows the rates at which the water flows into the bathtub for 16 minutes and the rate
at which the water flows out of the bathtub for 16 minutes.
From the information in the top graph, and assuming the initial quantity in the bathtub at time zero is
100 liters, draw a graph showing the amount of water in the bathtub throughout the 16 minutes (draw
this on the second graph).
CCBY 4.0 – Vincent Le Moign

Lesson 1
SPLASH! Your Way Into Modeling Page | 12
BOTGs in Your World – Follow Up Activities
A. Create a video of something that represents a linear function. Explain how you know that the
event represents a linear function.
B. Create your own inflow and outflow graph of the beverage tub.
C. Create your own inflow and outflow graph.
SPLASH! Your Way Into Modeling Page | 13
Lesson 2: The Immortal HeLa Cells: Exploration of Exponential Functions
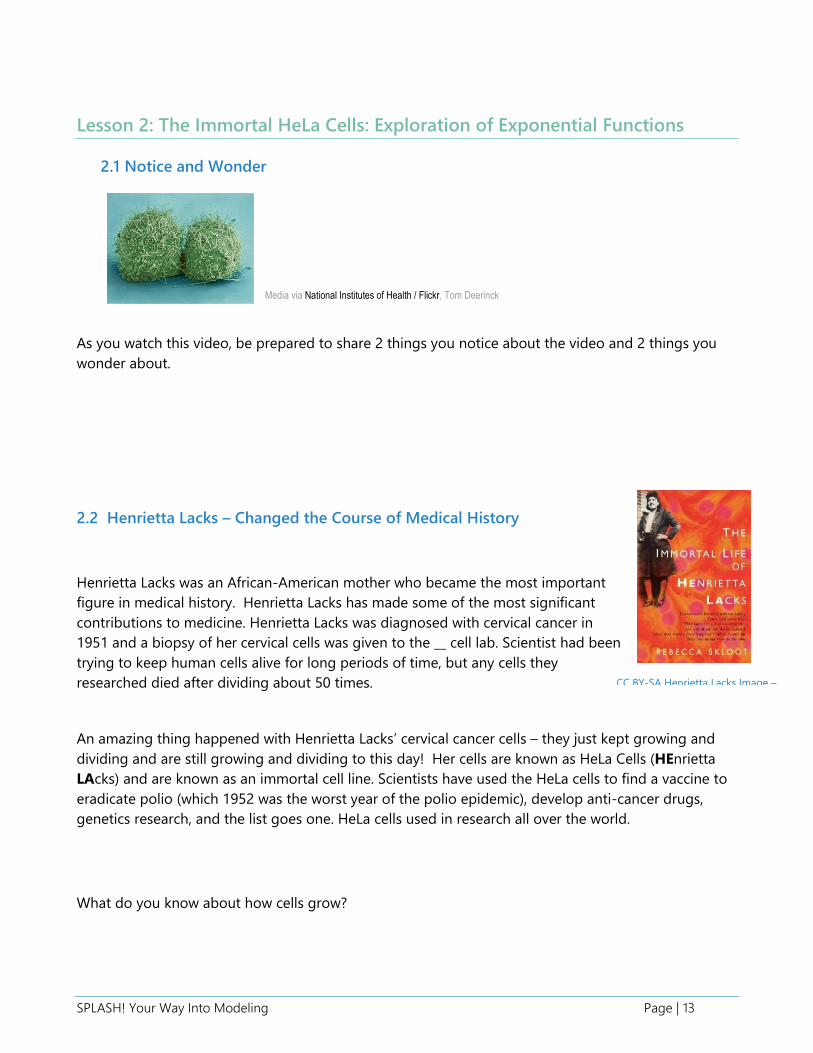
2.1 Notice and Wonder
As you watch this video, be prepared to share 2 things you notice about the video and 2 things you
wonder about.
2.2 Henrietta Lacks – Changed the Course of Medical History
Henrietta Lacks was an African-American mother who became the most important
figure in medical history. Henrietta Lacks has made some of the most significant
contributions to medicine. Henrietta Lacks was diagnosed with cervical cancer in
1951 and a biopsy of her cervical cells was given to the __ cell lab. Scientist had been
trying to keep human cells alive for long periods of time, but any cells they
researched died after dividing about 50 times.
An amazing thing happened with Henrietta Lacks’ cervical cancer cells – they just kept growing and
dividing and are still growing and dividing to this day! Her cells are known as HeLa Cells (HEnrietta
LAcks) and are known as an immortal cell line. Scientists have used the HeLa cells to find a vaccine to
eradicate polio (which 1952 was the worst year of the polio epidemic), develop anti-cancer drugs,
genetics research, and the list goes one. HeLa cells used in research all over the world.
What do you know about how cells grow?
CC BY-SA Henrietta Lacks Image –
OSU
Media via National Institutes of Health / Flickr, Tom Deerinck
Lesson 1
SPLASH! Your Way Into Modeling Page | 14
1. Draw a BOTG graph of the total number of cells in the video over time. Label the graph.
2. Create a table of values that show how many cells there would be after 10 time periods.
Lesson 1
SPLASH! Your Way Into Modeling Page | 15
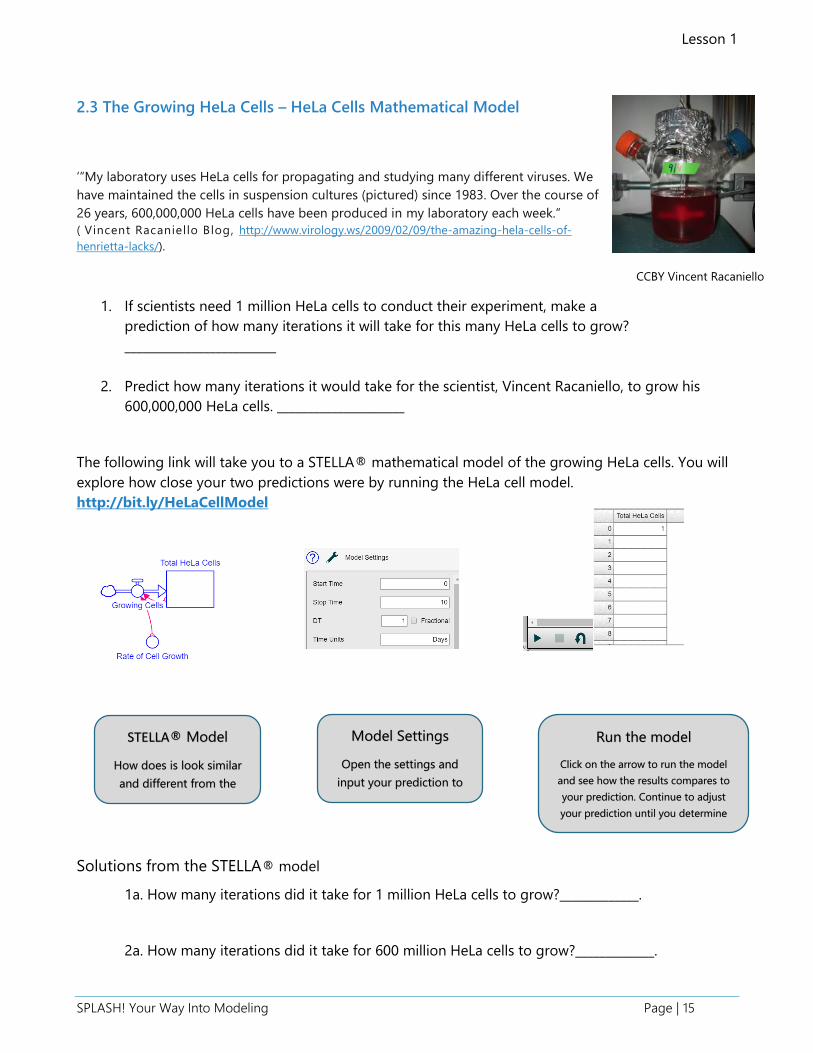
2.3 The Growing HeLa Cells – HeLa Cells Mathematical Model
’”My laboratory uses HeLa cells for propagating and studying many different viruses. We
have maintained the cells in suspension cultures (pictured) since 1983. Over the course of
26 years, 600,000,000 HeLa cells have been produced in my laboratory each week.”
( Vincent Racaniello Blog, http://www.virology.ws/2009/02/09/the-amazing-hela-cells-of-
henrietta-lacks/).
1. If scientists need 1 million HeLa cells to conduct their experiment, make a
prediction of how many iterations it will take for this many HeLa cells to grow?
_________________________
2. Predict how many iterations it would take for the scientist, Vincent Racaniello, to grow his
600,000,000 HeLa cells. _____________________
The following link will take you to a STELLA® mathematical model of the growing HeLa cells. You will
explore how close your two predictions were by running the HeLa cell model.
http://bit.ly/HeLaCellModel
Solutions from the STELLA® model
1a. How many iterations did it take for 1 million HeLa cells to grow?_____________.
2a. How many iterations did it take for 600 million HeLa cells to grow?_____________.
CCBY Vincent Racaniello
STELLA® Model
How does is look similar
and different from the
SPLASH! models?
Model Settings
Open the settings and
input your prediction to
question #1 into the
Run the model
Click on the arrow to run the model
and see how the results compares to
your prediction. Continue to adjust
your prediction until you determine
the answer to question #1 and #2.
Lesson 1
SPLASH! Your Way Into Modeling Page | 16
2.5 Modeling Task – The Infinite HeLa Cells:
How long would it take for HeLa cells to cover the floor of your classroom?
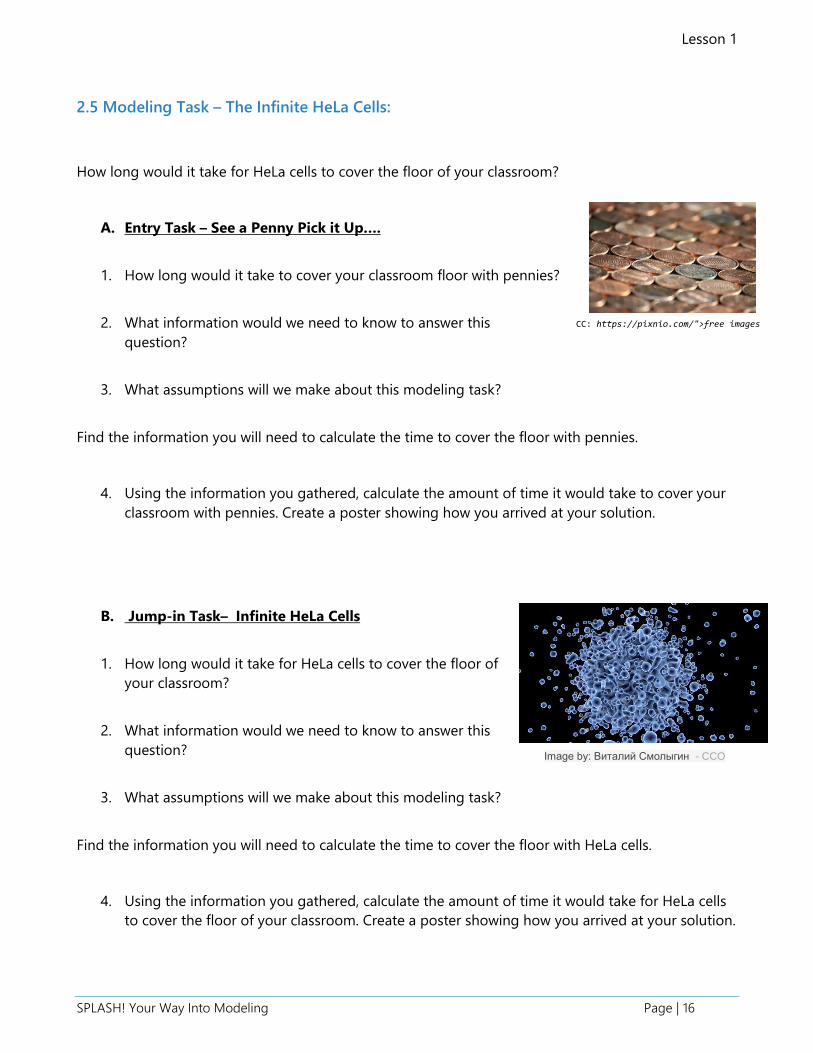
A. Entry Task – See a Penny Pick it Up….
1. How long would it take to cover your classroom floor with pennies?
2. What information would we need to know to answer this
question?
3. What assumptions will we make about this modeling task?
Find the information you will need to calculate the time to cover the floor with pennies.
4. Using the information you gathered, calculate the amount of time it would take to cover your
classroom with pennies. Create a poster showing how you arrived at your solution.
B. Jump-in Task– Infinite HeLa Cells
1. How long would it take for HeLa cells to cover the floor of
your classroom?
2. What information would we need to know to answer this
question?
3. What assumptions will we make about this modeling task?
Find the information you will need to calculate the time to cover the floor with HeLa cells.
4. Using the information you gathered, calculate the amount of time it would take for HeLa cells
to cover the floor of your classroom. Create a poster showing how you arrived at your solution.
CC: https://pixnio.com/">free images
Image by: Виталий Смолыгин - CCO
Lesson 1
SPLASH! Your Way Into Modeling Page | 17
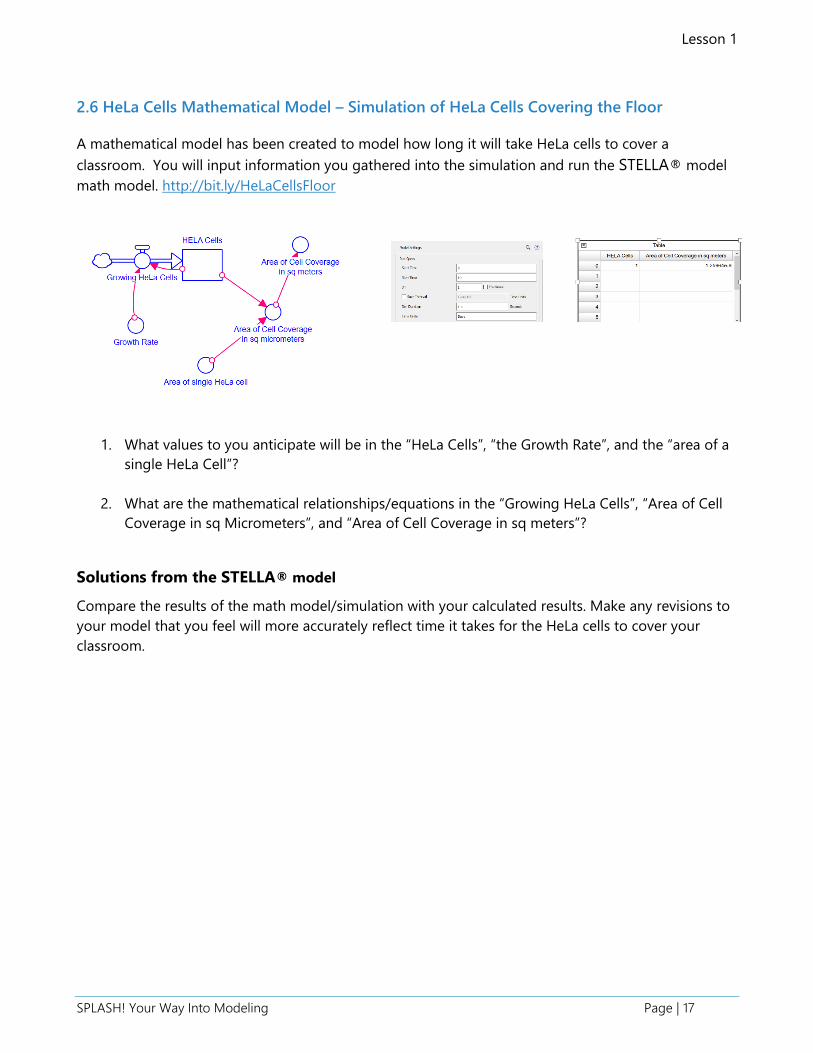
2.6 HeLa Cells Mathematical Model – Simulation of HeLa Cells Covering the Floor
A mathematical model has been created to model how long it will take HeLa cells to cover a
classroom. You will input information you gathered into the simulation and run the STELLA® model
math model. http://bit.ly/HeLaCellsFloor
1. What values to you anticipate will be in the “HeLa Cells”, “the Growth Rate”, and the “area of a
single HeLa Cell”?
2. What are the mathematical relationships/equations in the “Growing HeLa Cells”, “Area of Cell
Coverage in sq Micrometers”, and “Area of Cell Coverage in sq meters”?
Solutions from the STELLA® model
Compare the results of the math model/simulation with your calculated results. Make any revisions to
your model that you feel will more accurately reflect time it takes for the HeLa cells to cover your
classroom.
Lesson 1
SPLASH! Your Way Into Modeling Page | 18
Lesson 3 - Does Everything Grow Forever?
1. What would be some factors that would keep the HeLa cells from growing indefinitely?
Cells, like any living organism, need nutrients to live and propagate. HeLa cells are kept alive to divide
and growth within a cell culture medium. With a limited amount of space, as the cells divide, there is
more demand for the nutrients. At some point, there will not be enough nutrients for the number of
cells, limited the growth of the HeLa cells. This is known as limits to growth. Can you name other
examples from the real world that demonstrate a limits to growth behavior?
2. Name some videos that have gone viral.
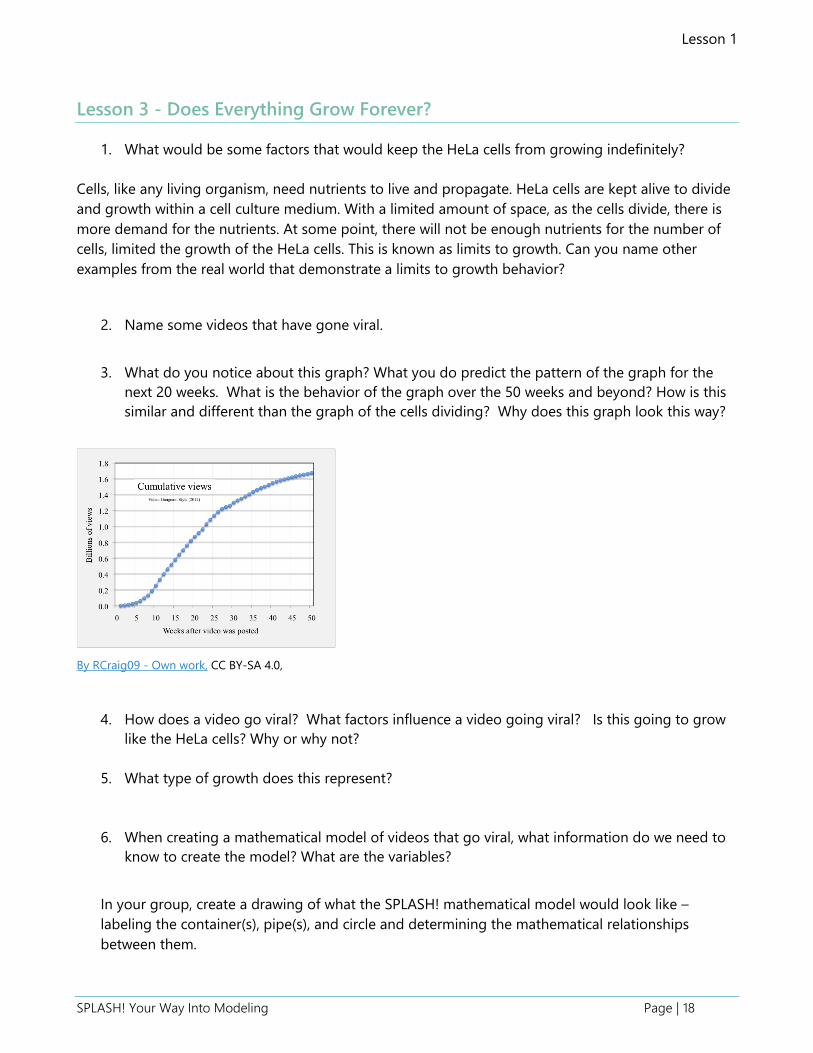
3. What do you notice about this graph? What you do predict the pattern of the graph for the
next 20 weeks. What is the behavior of the graph over the 50 weeks and beyond? How is this
similar and different than the graph of the cells dividing? Why does this graph look this way?
By RCraig09 - Own work, CC BY-SA 4.0,
4. How does a video go viral? What factors influence a video going viral? Is this going to grow
like the HeLa cells? Why or why not?
5. What type of growth does this represent?
6. When creating a mathematical model of videos that go viral, what information do we need to
know to create the model? What are the variables?
In your group, create a drawing of what the SPLASH! mathematical model would look like –
labeling the container(s), pipe(s), and circle and determining the mathematical relationships
between them.
Lesson 1
SPLASH! Your Way Into Modeling Page | 20
Additional MIT Graph
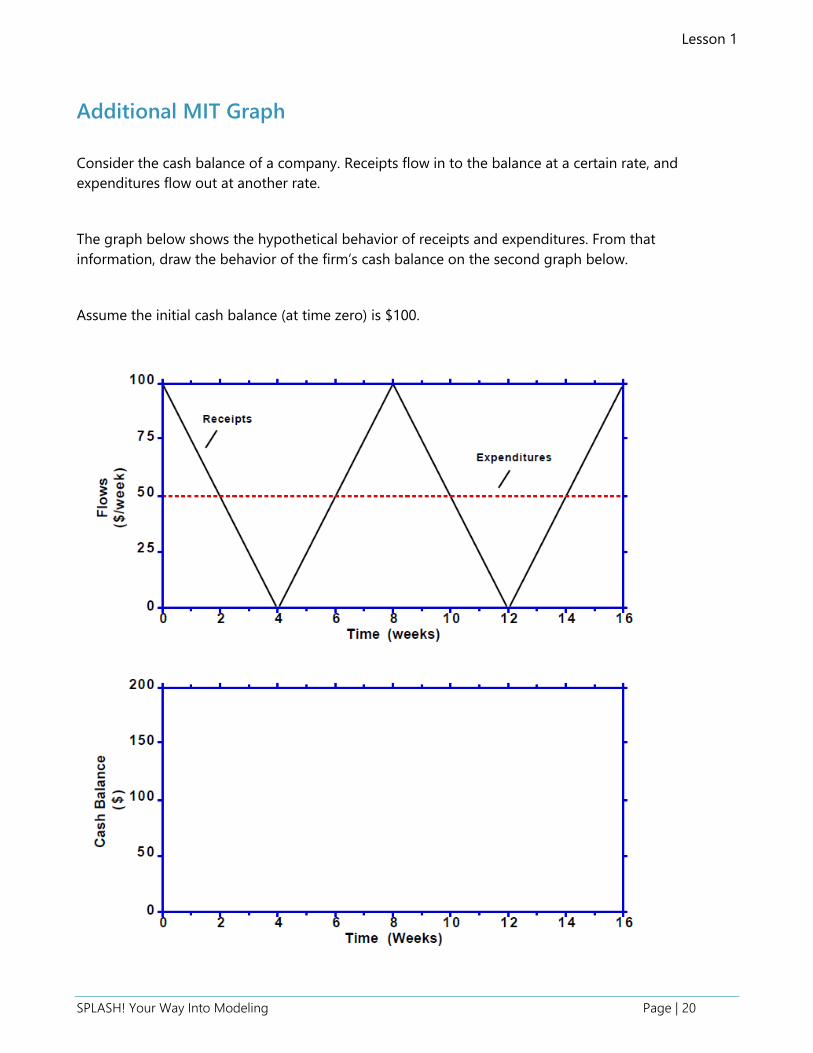
Consider the cash balance of a company. Receipts flow in to the balance at a certain rate, and
expenditures flow out at another rate.
The graph below shows the hypothetical behavior of receipts and expenditures. From that
information, draw the behavior of the firm’s cash balance on the second graph below.
Assume the initial cash balance (at time zero) is $100.
![Content Modeling Fundamentals Storyboard · Content Modeling Fundamentals Storyboard 1.0 Lesson Introduction 1.1 Scene Intro (Splash screen) Lesson Title Slide Needed [Corporte Music]](https://img.pdfslide.us/doc/110x75/5fc63bcde5d00a0bc7253cc8/content-modeling-fundamentals-storyboard-content-modeling-fundamentals-storyboard.jpg)