Embed Size (px)
Citation preview

Splash Screen
Chapter 11Lesson 11-2
A. AB. BC. CD. D
(over Lesson 10-7)
A. –2v8z 13
B. –2v15z 40
C. –32v8z 13
D. –32v15z 40
Simplify (–2v3z 8)5.
1. A2. B3. C4. D
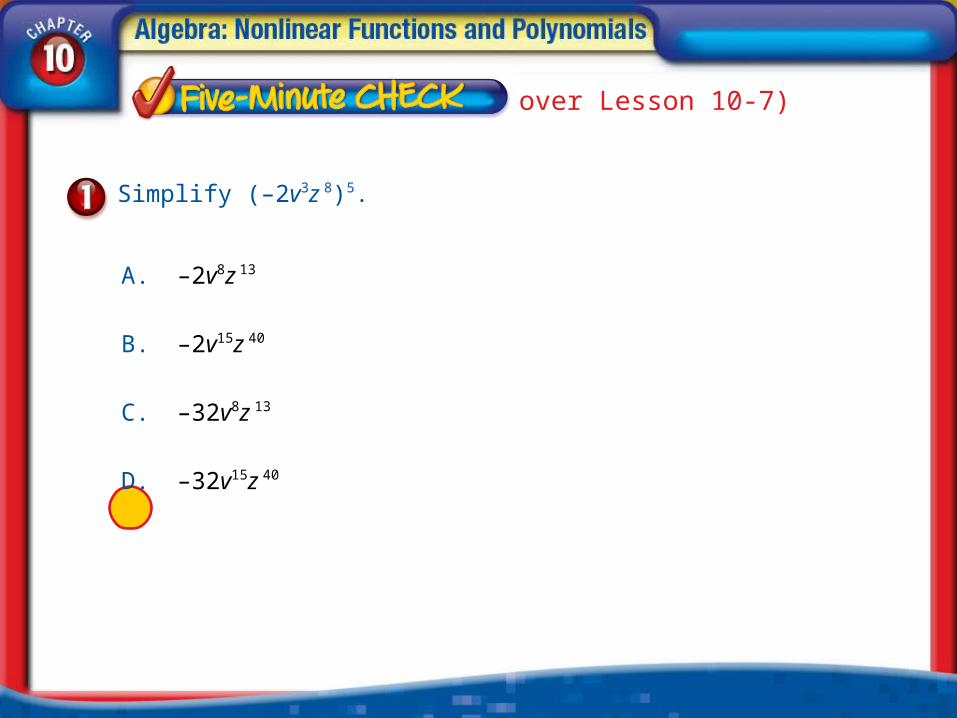
A. –20x–8x15
B. –20x7
C. 32,000x7
D. –32,000x7
Simplify (4x–2)4(–5x5)3.
(over Lesson 10-7)
1. A2. B3. C4. D
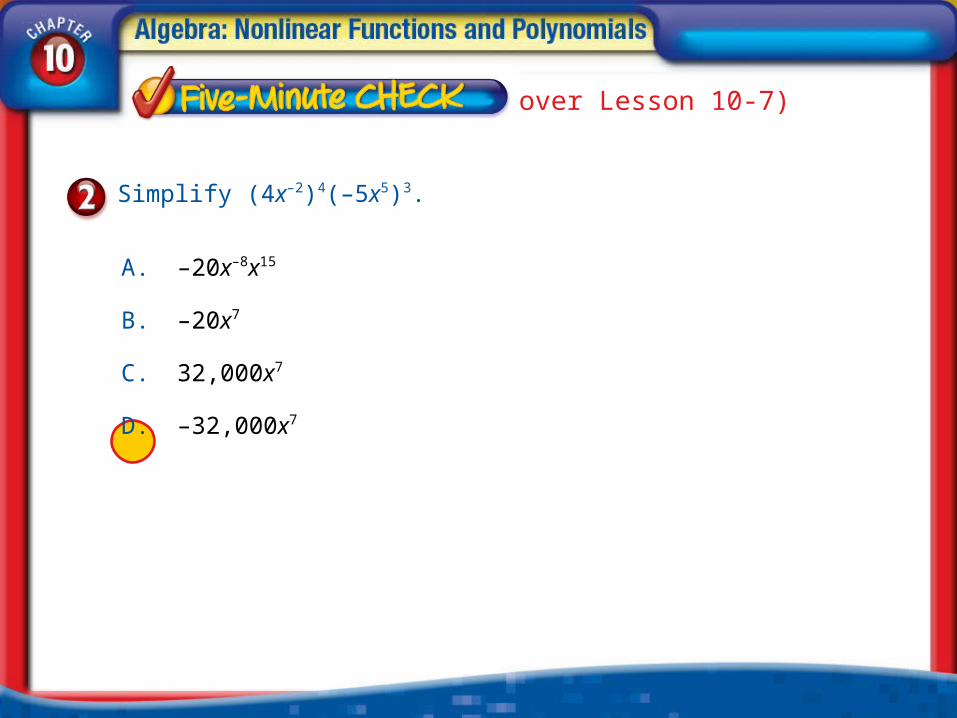
A. (3a2b4)3
B. (3a3b9)3
C. (9a2b4)3
D. (9a4b10)2
Which of the following has the same value as (27a6b12)?
(over Lesson 10-7)
A. AB. BC. CD. D
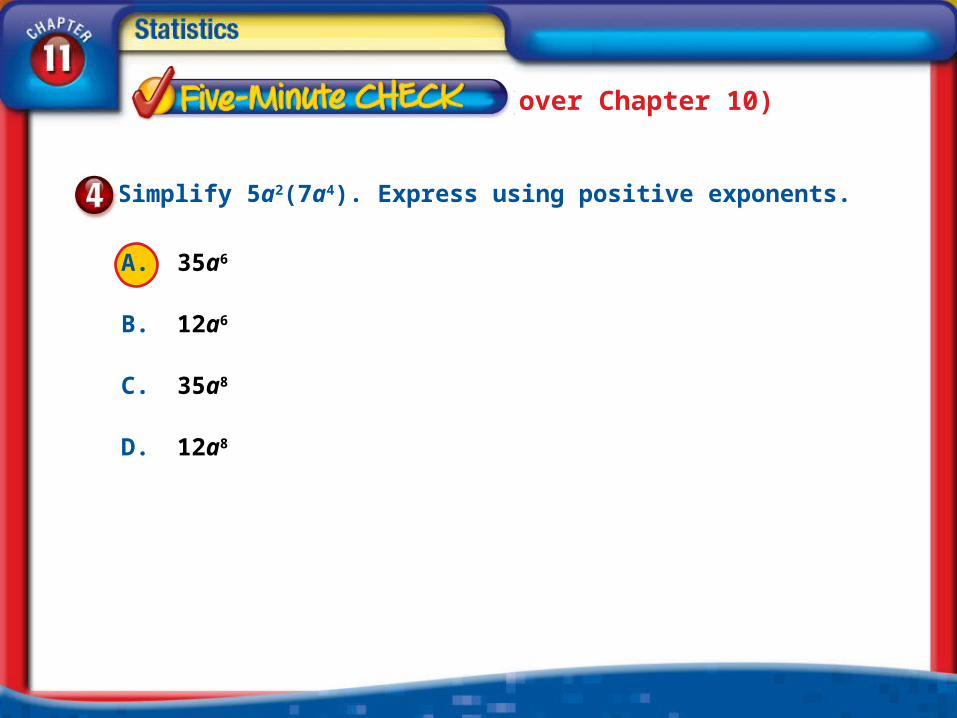
Simplify 5a2(7a4). Express using positive exponents.
(over Chapter 10)
A. 35a6
B. 12a6
C. 35a8
D. 12a8
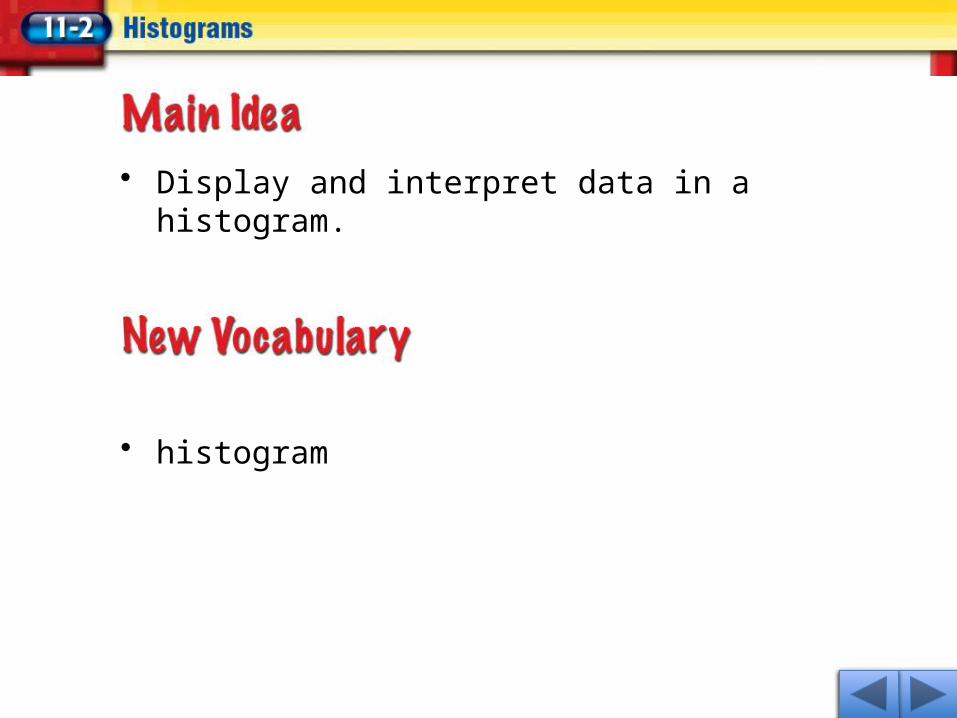
• histogram
• Display and interpret data in a histogram.
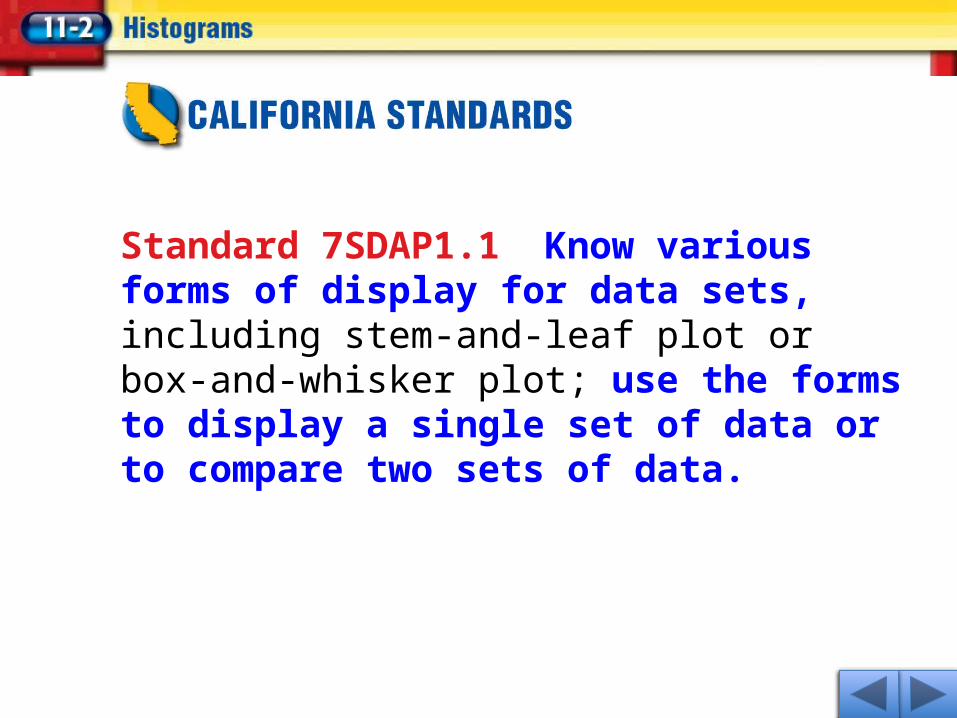
Standard 7SDAP1.1 Know various forms of display for data sets, including stem-and-leaf plot or box-and-whisker plot; use the forms to display a single set of data or to compare two sets of data.

Forever you were taught that this
was called a “Bar Graph”.
Forget about it!
From this point on they areto be called
a “Histogram”.
1-10 11-20 21-30 31-40 41-50
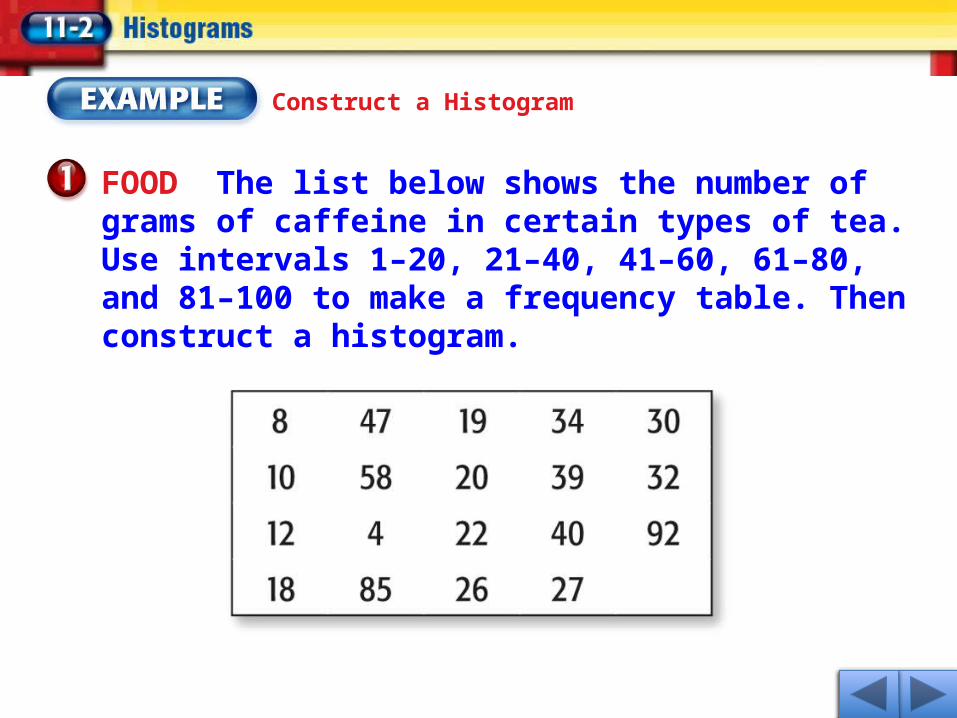
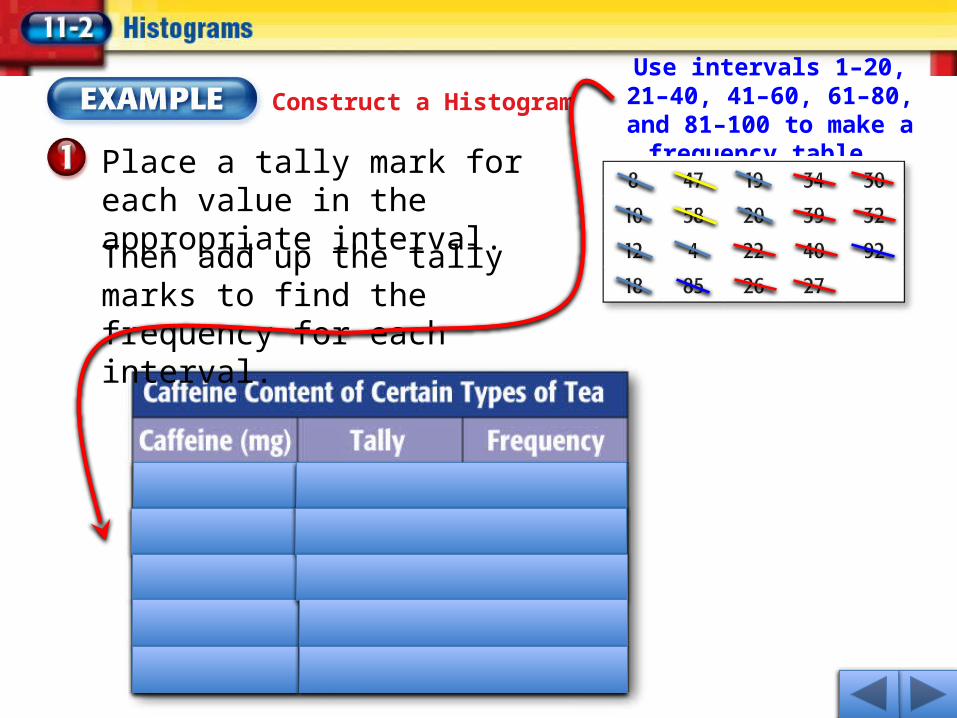
Construct a Histogram
FOOD The list below shows the number of grams of caffeine in certain types of tea. Use intervals 1–20, 21–40, 41–60, 61–80, and 81–100 to make a frequency table. Then construct a histogram.
Construct a Histogram
Place a tally mark for each value in the appropriate interval.
Use intervals 1–20, 21–40, 41–60, 61–80, and 81–100 to make a
frequency table.
Then add up the tally marks to find the frequency for each interval.
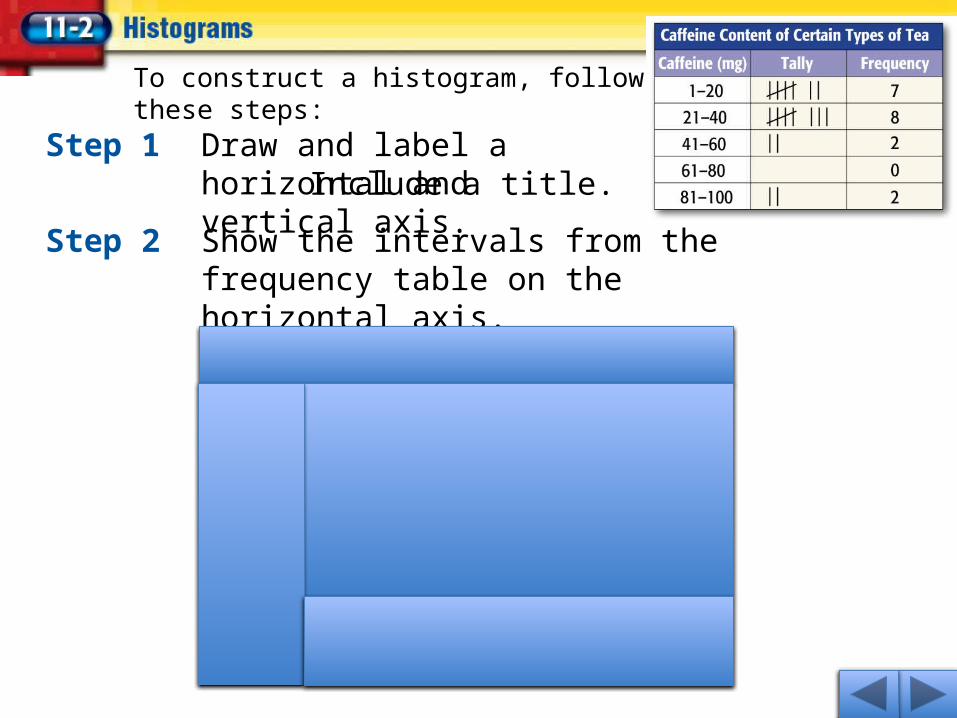
Step 1 Draw and label a horizontal and vertical axis.
Step 2 Show the intervals from the frequency table on the horizontal axis.
To construct a histogram, follow these steps:
Include a title.
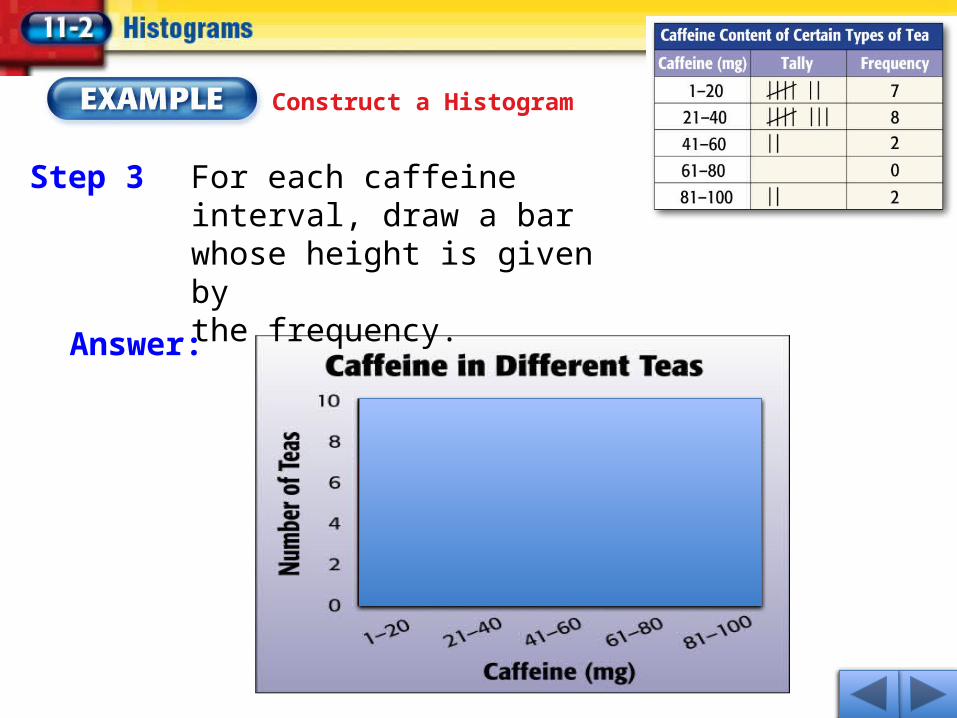
Construct a Histogram
Answer:
Step 3 For each caffeine interval, draw a bar whose height is given bythe frequency.
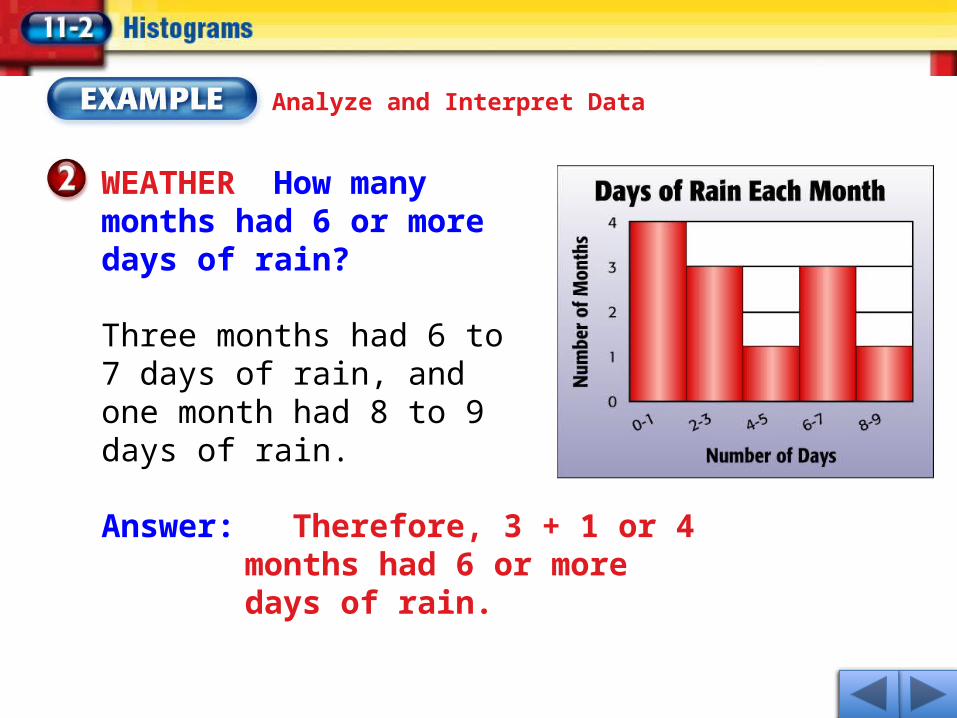
Analyze and Interpret Data
WEATHER How many months had 6 or more days of rain?
Three months had 6 to 7 days of rain, and one month had 8 to 9 days of rain.
Answer: Therefore, 3 + 1 or 4 months had 6 or more days of rain.
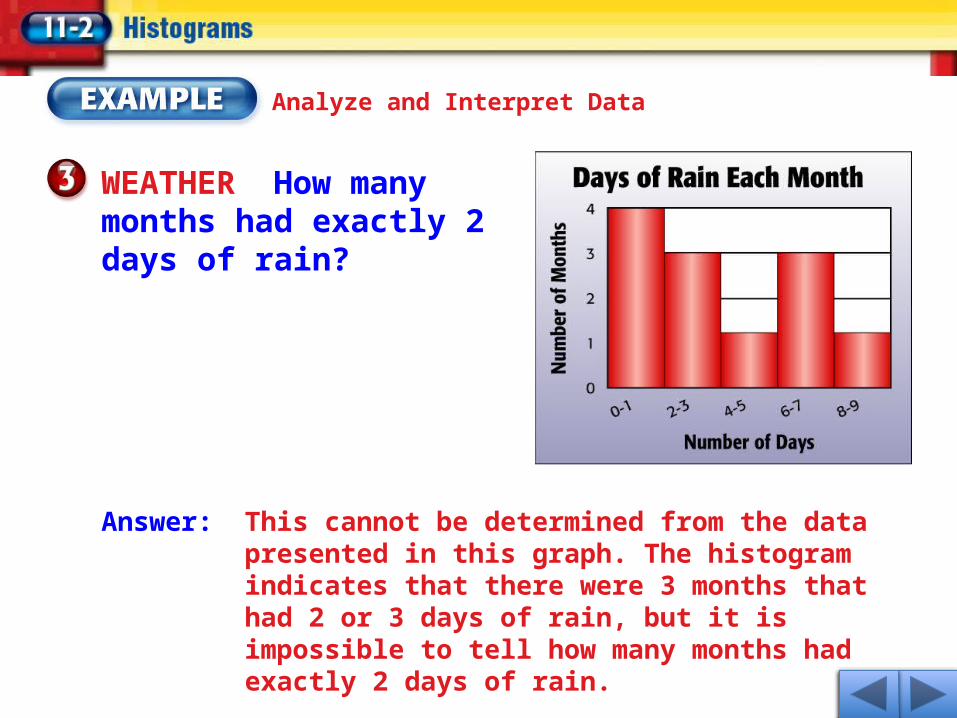
Analyze and Interpret Data
WEATHER How many months had exactly 2 days of rain?
Answer: This cannot be determined from the data presented in this graph. The histogram indicates that there were 3 months that had 2 or 3 days of rain, but it is impossible to tell how many months had exactly 2 days of rain.
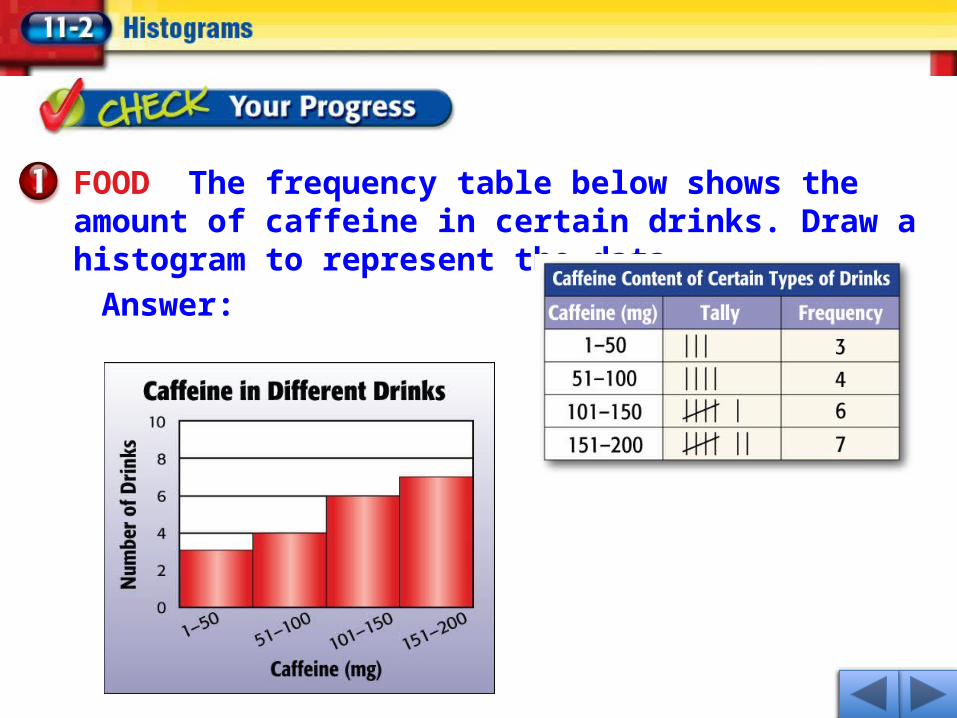
FOOD The frequency table below shows the amount of caffeine in certain drinks. Draw a histogram to represent the data.
Answer:
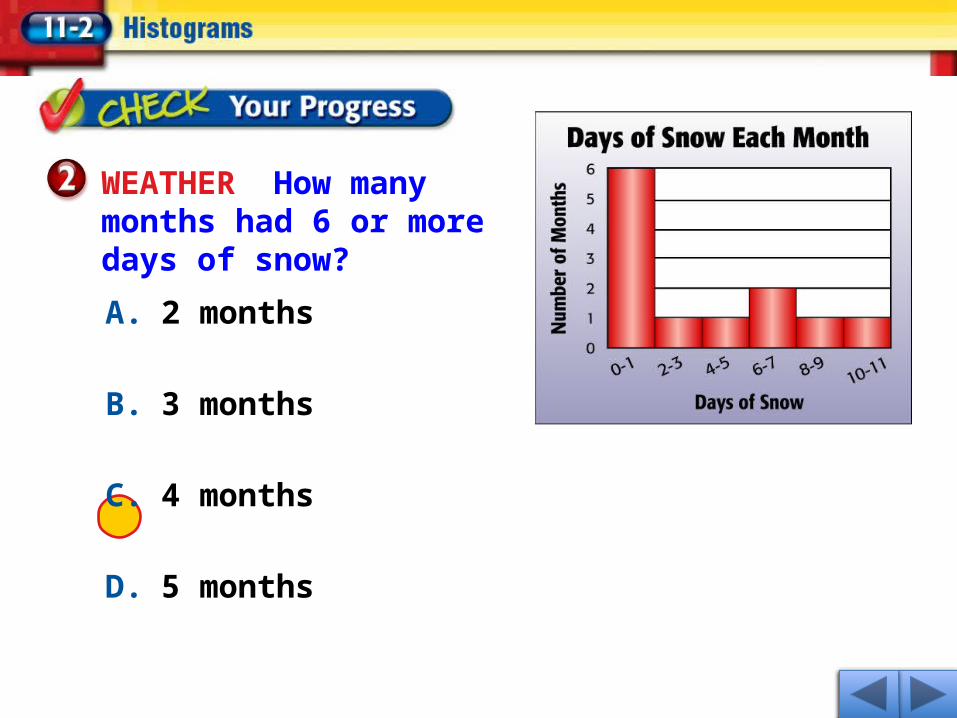
1. A2. B3. C4. D
A. 2 months
B. 3 months
C. 4 months
D. 5 months
WEATHER How many months had 6 or more days of snow?
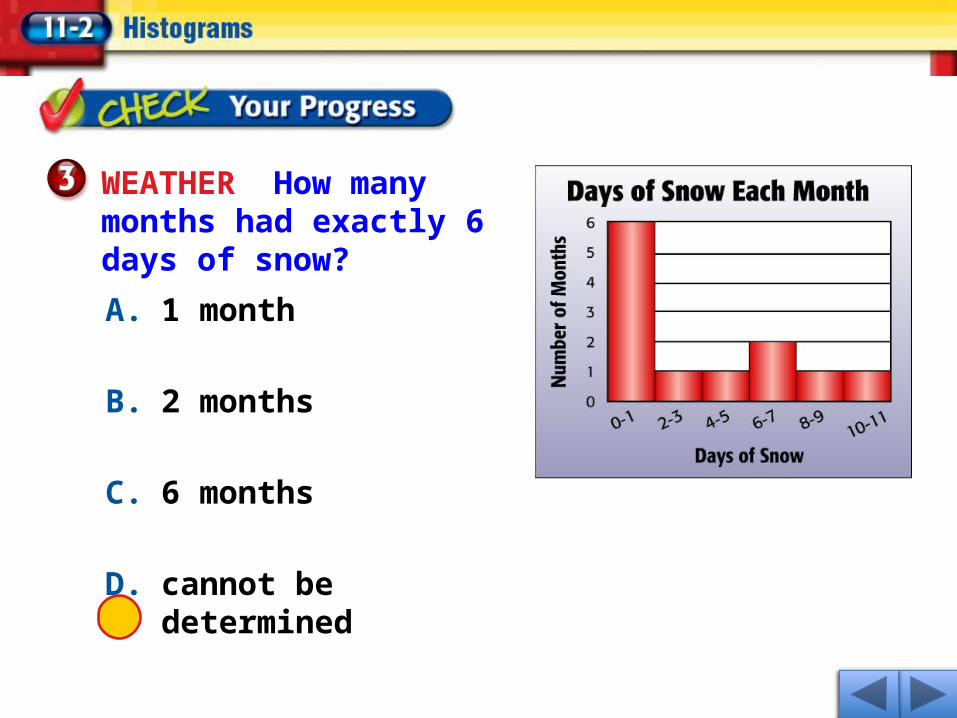
1. A2. B3. C4. D
A. 1 month
B. 2 months
C. 6 months
D. cannot be determined
WEATHER How many months had exactly 6 days of snow?