Embed Size (px)
Citation preview

Sitapuram Power Limited
Balance sheet
(All amounts are in � Crores, unless otherwise stated)
Note 31 Mar 2017 31 Mar 2016 01 Apr 2015
I ASSETS
1 Non-current assets
(a) Property, Plant and Equipment 5 119.47 120.87 126.63
(b) Capital work in progress 5 0.31 0.00 -
(c) Intangible assets 6 0.22 0.00 0.01
(d) Intangible assets under development 6 - 0.25 0.25
(e) Financial Assets
(i) Trade receivables 7 9.94 8.65 7.52
(ii) Loans 8 22.55 19.48 21.25
(iii) Other financial assets 9 7.65 7.10 6.64
(f) Other non-current assets 10 0.64 0.46 0.52
160.78 156.80 162.83
2 Current assets
(a) Inventories 11 5.94 9.29 9.66
(b) Financial assets
(i) Trade receivables 7 14.46 20.92 18.09
(ii) Loans 8 4.80 3.50 -
(iii) Cash and cash equivalents 12 0.81 2.95 2.85
���� Other bank balances 13 0.69 0.63 12.02
��� Other financial assets 9 0.06 0.05 0.27
(c) Other current assets 10 8.28 4.99 5.39
35.04 42.34 48.28
TOTAL 195.83 199.14 211.10
I EQUITY AND LIABILITIES
Equity
(a) Equity Share capital 14 1.00 1.00 1.00
(b) Other Equity (7.43) (5.78) (4.83)
(6.43) (4.78) (3.83)
1 Non-current liabilities
(a) Financial Liabilities
(i) Borrowings 15 81.52 91.46 101.52
(ii) Other financial liabilities 20 36.81 33.36 29.91
(b) Provisions 17 0.25 0.32 0.15
(c) Deferred tax liabilities, net 16 8.46 6.81 4.50
(d) Other liabilities 18 21.19 23.23 25.26
148.23 155.18 161.34
2 Current liabilities
(a) Financial Liabilities
(i) Borrowings 15 11.31 13.06 10.81
(ii) Trade payables 19 19.64 16.10 24.43
(iii) Other financial liabilities 20 17.67 15.15 15.10
(b) Other liabilities 18 4.05 3.76 3.20
(c) Current Tax Liabilities, net 1.36 0.67 0.05
54.03 48.75 53.59
TOTAL 195.83 199.14 211.10
See accompanying notes ot financial statements
for and on behalf of the Board
S.Venkatesh S. Kishore
Managing Director & CFO Director
DIN: 05267026 DIN: 00006627
Place: Hyderabad Subir Boity
Date: Company Secretary06-09-2017

Sitapuram Power Limited
Statement of profit and loss
(All amounts are in � Crores, unless otherwise stated)
Note Year ended
31 Mar 2017
Year ended
31 Mar 2016
Revenue from operations 21 124.16 154.39
Other income 22 4.80 5.12
Total revenue 128.96 159.50
Expenses
Cost of fuel consumed 23 85.46 108.12
Employee benefits expenses 24 3.75 3.45
Finance costs 25 16.32 17.57
Other expenses 26 15.57 21.87
Depreciation and amortisation expenses 5&6 6.47 6.27
Total expenses 127.57 157.29
Profit before tax 1.39 2.22
Tax expense 28 3.04 3.06
Loss for the year after tax (1.65) (0.84)
Other comprehensive Income
(i) �������� �����������������������������
Remeasurement of defined benefit plans 27 (0.00) (0.12)
��������������� �������� (0.00) (0.12)
(1.65) (0.96)
Earning / (loss) per share (per value of � 10 each) 30
Basic (16.49) (8.40)
Diluted (16.49) (8.40)
See accompanying notes ot financial statements
for and on behalf of the Board
S.Venkatesh S. Kishore
Managing Director & CFO Director
DIN: 05267026 DIN: 00006627
Place: Hyderabad Subir Boity
Date: Company Secretary
�������������� ��������������������
06-09-2017

Sitapuram Power Limited
Statement of Changes in Equity
(All amounts are in � Crores, unless otherwise stated)
A.Equity Share Capital
Particulars No of Shares Amount
Balance as at 1 April, 2015 1,000,000 1.00
Changes in equity share capital during the year : - -
Balance as at 31 March 2016 1,000,000 1.00
Balance as at 1 April, 2016 1,000,000 1.00
Changes in equity share capital during the year : - -
Balance as at 31 March 2017 1,000,000 1.00
B.Other Equity
Particulars Retained earnings Total
Balance as at 1st April, 2015 (4.83) (4.83)
(Loss) profit for the year (0.84) (0.84)
Remeasurement of defined benefit plans, net of tax (0.12) (0.12)
Total comprehensive (loss) profit for the year (0.96) (0.96)
Balance as at 31 March 2016 (5.78) (5.78)
Balance as at 1 April, 2016 (5.78) (5.78)
(Loss) profit for the year (1.65) (1.65)
Remeasurement of defined benefit plans, net of tax (0.00) (0.00)
Total comprehensive (loss) profit for the year (1.65) (1.65)
Balance as at 31 March 2017 (7.43) (7.43)
See accompanying notes ot financial statements
for and on behalf of the Board
S.Venkatesh S. Kishore
Managing Director & CFO Director
DIN: 05267026 DIN: 00006627
Place: Hyderabad Subir Boity
Date: Company Secretary06-09-2017

Sitapuram Power Limited
Cash flow statement
(All amounts are in � Crores, unless otherwise stated)
Particulars 31 March 2017 31 March 2016
A. CASH FLOW FROM OPERATING ACTIVITIES
Profit before taxation 1.39 2.22
Adjustments for:
Depreciation and amortisation 6.47 6.27
Profit on sale of fixed assets (0.02)
Interest income (0.72) (1.15)
Deferred revenue (2.74) (2.74)
Unwiding of discount (1.30) (1.13)
Other compressive inome/(loss) (0.00) (0.12)
Provision for dividend distribution tax 0.70 0.70
Bad debts/receivable written off 0.00 6.97
Finance cost 16.32 17.57
Operating profit before working capital changes 20.11 28.60
Working capital changes:
(Increase) / decrease in trade receivables 6.46 (2.83)
(Increase) / decrease in other current assets (3.56) 0.50
(Increase) / decrease in inventories 3.35 0.37
(Increase) / decrease in loans and advances (0.00) (5.19)
Increase / (decrease) in trade payables 3.53 (8.33)
Increase / (decrease) other liabilities and provisions 0.51 1.14
Cash generated from operations 30.40 14.26
Taxes (paid) / refund (0.60) (0.12)
Net cash from operating activities (A) 29.79 14.15
B. CASH FLOW FROM INVESTING ACTIVITIES
Purchase of fixed assets including capital work-in-progress (3.02) (0.66)
Investment/redemption of deposits (held as margin money) (0.05) 11.46
Sale of fixed assets 0.04 0.00
Loans / advances, net (4.37) (3.50)
Interest income 0.15 0.83
Net cash from / (used in) investing activities (B) (7.25) 8.13
C. CASH FLOW FROM FINANCING ACTIVITIES
Proceeds from / (repayment of) short-term borrowings, net (1.74) 2.25
Repayment of long term borrowings (11.00) (11.00)
Payment of finance costs (11.95) (13.42)
Net cash from/(used in) financing activities (C) (24.69) (22.17)
Net increase / (decrease) in cash and cash equivalents (A+B+C) (2.15) 0.11
Cash and cash equivalents at the beginning of the year 12 2.95 2.85
Cash and cash equivalents at the end of the year 12 0.81 2.95
See accompanying notes ot financial statements
for and on behalf of the Board
S.Venkatesh S. Kishore
Managing Director & CFO Director
DIN: 05267026 DIN: 00006627
Place: Hyderabad Subir Boity
Date: Company Secretary06-09-2017

Sitapuram Power Limited
Notes to Financial Statements
(All amounts are in � Crores, unless otherwise stated)
1 Company Information
2 Basis of preparation
2.1 Statement of Compliance
The financial statements were authorised for issue by the Board of Directors on 06-09-2017
2.2 Functional and presentation currency
2.3 Basis of measurement
•
•
3 Significant Accounting Policies
3.1 Property, plant and equipment
Nature of asset Useful life (years)
Buildings 10-60
Plant and equipment 2-30
Furntiture & fixtures 1-10
Vehicles 8-10
Office equipment & computers 3-6
Assets in the course of construction are stated at cost and not depreciated until commissioned.
Sitapuram Power Limited (“the Company”) was incorporated on 18 July 2005 and is engaged in the business of generation of electricity. The
Registered Office of the Company is located at Dondapadu Village,Mellacheruvu Mandal, Nalgonda Dist.Telangana. Company is engaged in the
business of generating and selling power to various customers. The Company commenced its business operations with a coal based power plant of
43 MW capacities at Dondapadu, Telangana.
Property, plant and equipment are stated at cost, net of accumulated depreciation and/or accumulated impairment losses, if any. The cost
includes expenditures that are directly attributable to property plant and equipment such as employee cost, borrowing costs for long-term
construction projects etc., if recognition criteria are met. Likewise, when a major inspection is performed, its costs are recognised in the
carrying amount of the plant and equipment as a replacement if the recognition criteria are satisfied. Subsequent expenditure is capitalised
only when it is probable that the future economic benefits associated with the expenditure will flow to the Company. All other repairs and
maintenance costs are recognised in statement of profit and loss.
Depreciation is computed, based on technical assessment made by technical expert and management estimate, on straight-line basis over the
estimated useful life which are different from the useful life prescribed in Schedule II to the Companies Act, 2013. The management
believes that these estimated useful lives are realistic and reflect fair approximation of the period over which the assets are likely to be used
as follows:
An item of property, plant and equipment is derecognised upon disposal or when no future economic benefits are expected from its use or
disposal. Any gain or loss arising on derecognition of the asset (calculated as the difference between the net disposal proceeds and the
carrying amount of the asset) is included in statement of profit and loss in the year the asset is derecognised.
The assets residual values, useful lives and methods of depreciation are reviewed at each financial year end, and adjusted prospectively if
appropriate.
These financial statements of the Company have been prepared in accordance with Indian Accounting Standards (Ind AS) as per the Companies
(Indian Accounting Standards) Rules, 2015 notified under Section 133 of Companies Act, 2013, (the 'Act') and other relevant provisions of the
Act.
The Company's financial statements up to and for the year ended 31 March 2016 were prepared in accordance with the Companies (Accounting
Standards) Rules, 2006, notified under Section 133 of the Act and other relevant provisions of the Act.
As these are the Company's first financial statements prepared in accordance with Indian Accounting Standards (Ind AS), Ind AS 101, ‘First-time
adoption of Indian Accounting Standards’ has been applied. An explanation of how the transition to Ind AS has affected the previously reported
financial position, financial performance and cash flows of the Company is provided in Note.31
These financial statements are presented in Indian Rupees (INR), which is also the Company's functional currency. Amounts in the financial
statements are presented in Indian Rupees in crore rounded off to two decimal places as permitted by Schedule III to the Companies Act, 2013.
These financial statements have been prepared on historical cost basis except for the following items:
Net employee defined benefit (asset) / liability that is measured based on actuarial valuation.
Financial instruments that are designated as being at fair value through profit or loss account or through other comprehensive income
upon initial recognition are measured at fair value;
For transition to Ind AS, the Company has elected to continue with the carrying value of all of its property, plant and equipment recognised
as of 1st April, 2015 (transition date) measured as per the previous GAAP and use that carrying value as its deemed cost as of the transition
date.

Sitapuram Power Limited
Notes to Financial Statements
(All amounts are in � Crores, unless otherwise stated)
3.2 Intangible assets
Nature of assetUseful life
(years)
Software 3
3.3 Financial Instruments
3.4 Financial assets
Initial recognition & measurement
All regular way purchases or sales of financial assets are recognised/derecognised on a trade date basis.
Subsequent measurement
For the purposes of subsequent measurement, financial assets are classified in four categories:
• Debt instrument at amortised cost
• Debt instrument at fair value through other comprehensive income (FVTOCI).
• Equity Instruments measured at fair value through other comprehensive income (FVTOCI)
• Debt instrument, derivatives and equity instruments at fair value through profit or loss (FVTPL).
Debt instruments at amortised cost
A ‘debt instrument’ is measured at the amortised cost if both the following conditions are met:
• The asset is held within a business model whose objective is to hold assets for collecting contractual cash flows, and
•
Debt instrument at FVTOCI
A ‘debt instrument’ is classified as at the FVTOCI if both of the following criteria are met:
• The objective of the business model is achieved both by collecting contractual cash flows and selling the financial assets, and
• The asset’s contractual cash flows represent SPPI.
Debt instrument at FVTPL
Intangible assets with finite lives are amortised over the useful economic life and assessed for impairment whenever there is an indication
that the intangible asset may be impaired. The amortisation period and the amortisation method for an intangible asset with a finite useful
life are reviewed at least at the end of each reporting period. Changes in the expected useful life or the expected pattern of consumption of
future economic benefits embodied in the asset is accounted for by changing the amortisation period or method, as appropriate, and are
treated as changes in accounting estimates. The amortisation expense on intangible assets with finite lives is recognised in the statement of
profit and loss.
After initial measurement, such financial assets are subsequently measured at amortised cost using the effective interest rate (EIR) method.
Amortised cost is calculated by taking into account any discount or premium on acquisition and fees or costs that are an integral part of the
EIR. The EIR amortisation is included in finance income in the profit or loss. The losses arising from impairment are recognised in the
profit or loss. This category generally applies to trade and other receivables.
Debt instruments included within the FVTOCI category are measured initially as well as at each reporting date at fair value. Fair value
movements are recognized in the other comprehensive income (OCI). However, the Company recognizes interest income, impairment
losses & reversals and foreign exchange gain or loss in the P&L. On derecognition of the asset, cumulative gain or loss previously
recognised in OCI is reclassified from the equity to P&L. Interest earned whilst holding FVTOCI debt instrument is reported as interest
income using the EIR method.
FVTPL is a residual category for debt instruments. Any debt instrument, which does not meet the criteria for categorization as at amortized
cost or as FVTOCI, is classified as at FVTPL.
In addition, the Company may elect to designate a debt instrument, which otherwise meets amortized cost or FVTOCI criteria, as at
FVTPL. However, such election is allowed only if doing so reduces or eliminates a measurement or recognition inconsistency (referred to
as ‘accounting mismatch’). The Company has not designated any debt instrument as at FVTPL.
Debt instruments included within the FVTPL category are measured at fair value with all changes recognized in the P&L.
Intangible assets acquired separately are measured on initial recognition at cost. Following initial recognition, intangible assets are carried
at cost less any accumulated amortisation and accumulated impairment losses.
Gains or losses arising from derecognition of an intangible asset are measured as the difference between the net disposal proceeds and the
carrying amount of the asset and are recognised in the statement of profit and loss when the asset is derecognised.
For transition to Ind AS, the Company has elected to continue with the carrying value of all of its Intangible asset recognised as of 1st
April, 2015 (transition date) measured as per the previous GAAP and use that carrying value as its deemed cost as of the transition date.
Financial assets and financial liabilities are recognised when an entity becomes a party to the contractual provisions of the instruments.
Financial assets and financial liabilities are initially measured at fair value. Transaction costs that are directly attributable to the acquisition
or issue of financial assets and financial liabilities (other than financial assets and financial liabilities at fair value through profit or loss) are
added to or deducted from the fair value of the financial assets or financial liabilities, as appropriate, on initial recognition. Transaction
costs directly attributable to the acquisition of financial assets or financial liabilities at fair value through profit or loss are recognised
immediately in profit or loss
Contractual terms of the asset give rise on specified dates to cash flows that are solely payments of principal and interest (SPPI) on the
principal amount outstanding.

Sitapuram Power Limited
Notes to Financial Statements
(All amounts are in � Crores, unless otherwise stated)
Equity investments
Derecognition
• The rights to receive cash flows from the asset have expired� or
•
Impairment of financial asset
•
•
3.5 Financial liabilities
Initial recognition
Financial liabilities within the scope of IND AS 109 are classified as
• Fair value through profit or loss
• Other financial liability at amortised cost
Subsequent measurement
The subsequent measurement of financial liabilities depends on their classification as follows:
Financial liabilities at fair value through profit or loss
Loans and borrowings at amortised cost
All equity investments in scope of Ind AS 109 are measured at fair value. For the equity instruments Company may make an irrevocable
election to present in other comprehensive income subsequent changes in the fair value. The Company makes such election on an
instrument by-instrument basis. The classification is made on initial recognition and is irrevocable.
If the Company decides to classify an equity instrument as at FVTOCI, then all fair value changes on the instrument, excluding dividends,
are recognized in the OCI. There is no recycling of the amounts from OCI to P&L, even on sale of investment. However, the group may
transfer the cumulative gain or loss within equity.
Equity instruments included within the FVTPL category are measured at fair value with all changes recognized in the P&L.
A financial asset (or, where applicable a part of a financial asset or part of a group of similar financial assets) is derecognised when:
The Company has transferred its rights to receive cash flows from the asset or has assumed an obligation to pay the received cash flows
in full without material delay to a third party under a ‘pass-through’ arrangement� and either (a) the Company has transferred
substantially all the risks and rewards of the asset, or (b) the Company has neither transferred nor retained substantially all the risks and
rewards of the asset, but has transferred control of the asset
The Company determines the classification of its financial liabilities at initial recognition. Financial liabilities are recognised initially at fair
value and in the case of loans and borrowings, net of directly attributable transaction costs.
Financial liabilities at fair value through profit or loss include financial liabilities held for trading and financial liabilities designated upon
initial recognition as at fair value through profit or loss.
Financial liabilities are classified as held for trading if they are acquired for the purpose of selling in the near term. This category includes
derivative financial instruments entered into by the Company that are not designated as hedging instruments in hedge relationships as
defined by IND AS 109. Separated embedded derivatives are also classified as held for trading unless they are designated as effective
hedging instruments.
Financial liabilities designated upon initial recognition at fair value through profit and loss are designated at the initial date of recognition,
and only if criteria of IND AS 109 are satisfied.
After initial recognition, loans and borrowings are subsequently measured at amortised cost using the effective interest rate method. Gains
and losses are recognised in the statement of profit and loss when the liabilities are derecognised as well as through the amortisation
process.
Gains or losses on liabilities held for trading are recognised in the statement of profit and loss.
The Company applies the expected credit loss model for recognising impairment loss on financial assets measured at amortised cost, trade
receivables and other contractual rights to receive cash or other financial asset.
For recognition of impairment loss on other financial assets and risk exposure, the group determines that whether there has been a
significant increase in the credit risk since initial recognition. If credit risk has not increased significantly, 12-month ECL is used to provide
for impairment loss. However, if credit risk has increased significantly, lifetime ECL is used. If, in a subsequent period, credit quality of the
instrument improves such that there is no longer a significant increase in credit risk since initial recognition, then the entity reverts to
recognising impairment loss allowance based on 12-month ECL.
Lifetime ECL are the expected credit losses resulting from all possible default events over the expected life of a financial instrument. The
12-month ECL is a portion of the lifetime ECL which results from default events that are possible within 12 months after the reporting
date.
ECL is the difference between all contractual cash flows that are due to the group in accordance with the contract and all the cash flows
that the entity expects to receive (i.e., all cash shortfalls), discounted at the original EIR. When estimating the cash flows, an entity is
required to consider:
All contractual terms of the financial instrument (including prepayment, extension, call and similar options) over the expected life of
the financial instrument. However, in rare cases when the expected life of the financial instrument cannot be estimated reliably, then the
entity is required to use the remaining contractual term of the financial instrument.
Cash flows from the sale of collateral held or other credit enhancements that are integral to the contractual terms.
For trade receivables or any contractual right to receive cash or another financial asset that result from transactions that are expedient as
permitted under Ind AS 109. This expected credit loss allowance is computed based on a provision matrix which takes into account
historical credit loss experience and adjusted for forward looking information.
Sitapuram Power Limited
Notes to Financial Statements
(All amounts are in � Crores, unless otherwise stated)
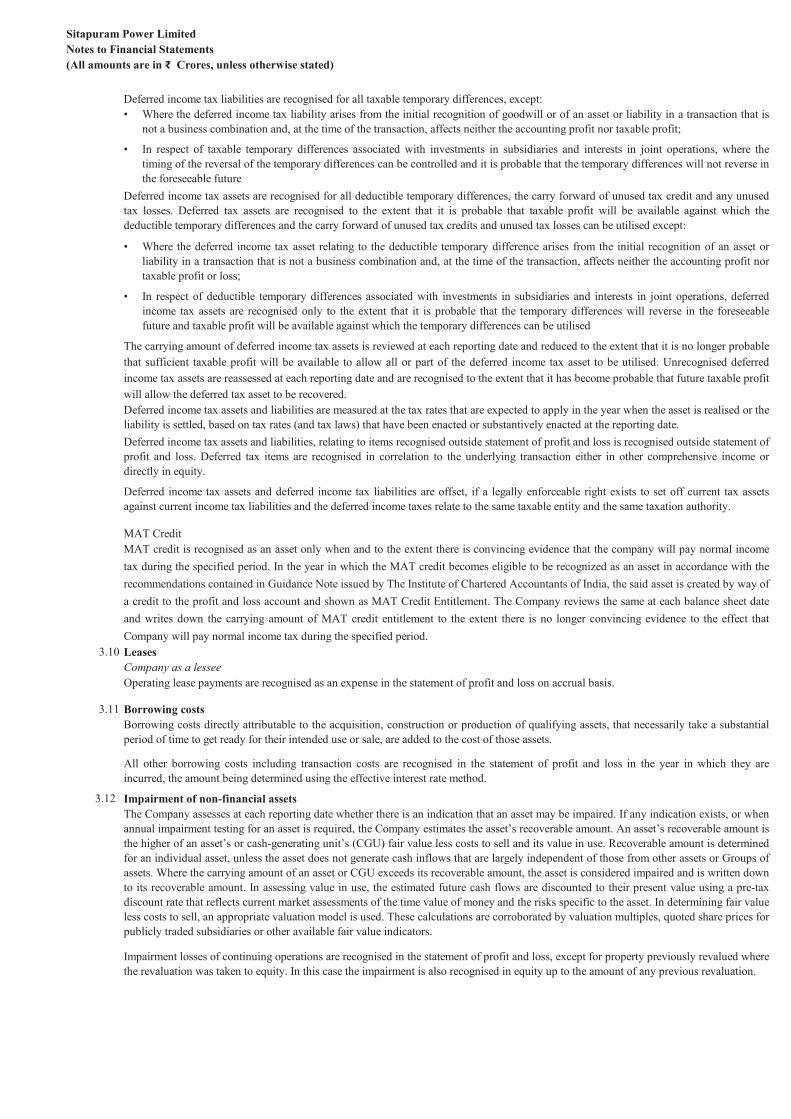
Offsetting of financial instruments
Amortised cost of financial instruments
Derecognition
3.6 Fair value measurement
•
•
•
•
•
3.7 Inventories
• Raw materials - purchase cost on Weighted average basis.
• Stores and spares - purchase cost on a first in, first out basis.
3.8 Revenue recognition
3.9 Taxes
Revenue is recognised to the extent that it is probable that the economic benefits associated with the transaction will flow to the Company,
and revenue can be reliably measured. Revenue is measured at the fair value of the consideration received or receivable in accordance with
the relevant agreements, net of discounts, rebates and other applicable taxes and duties.
Sale of electricity : Sale of energy is recognized on accrual basis in accordance with the relevant agreements. Revenue in excess of billing
is disclosed as unbilled revenue.
Interest and dividend income : Revenue from interest is recognised on an accrual basis (using the effective interest rate method). Revenue
from dividends is recognised when the right to receive the payment is established.
Current income tax : Current income tax assets and liabilities for the current and prior periods are measured at the amount expected to be
recovered from or paid to the taxation authorities. The tax rates and tax laws used to compute the amount are those that are enacted or
substantively enacted by the reporting date. Tax relating to items recognised directly in equity is recognised in equity and not in the
statement of profit and loss.
Deferred income tax : Deferred income tax is provided using the liability method on temporary differences at the reporting date between the
tax bases of assets and liabilities and their carrying amounts for financial reporting purposes.
Net realisable value is the estimated selling price in the ordinary course of business, less estimated costs of completion and the estimated
costs necessary to make the sale.
Inventories are stated at the lower of cost and net realisable value. Costs incurred in bringing each product to its present location and
conditions are accounted for as follows:
Level 2 — Valuation techniques for which the lowest level input that is significant to the fair value measurement is directly or
indirectly observable
Level 3 — Valuation techniques for which the lowest level input that is significant to the fair value measurement is unobservable
At each reporting date, the Management analyses the movements in the values of assets and liabilities which are required to be remeasured
or re-assessed as per the Company’s - accounting policies.
For the purpose of fair value disclosures, the Company has determined classes of assets and liabilities on the basis of the nature,
characteristics and risks of the asset or liability and the level of the fair value hierarchy as explained above.
Fair value is the price that would be received to sell an asset or paid to transfer a liability in an orderly transaction between market
participants at the measurement date, regardless of whether that price is directly observable or estimated using another valuation technique.
In estimating the fair value of an asset or a liability, the Company takes into account the characteristics of the asset or liability at the
measurement date. The fair value measurement is based on the presumption that the transaction to sell the financial asset or settle the
financial liability takes place either:
In the principal market, or
In the absence of a principal market, in the most advantageous market
The principal or the most advantageous market must be accessible by the Company. A fair value measurement of a non-financial asset takes
into account a market participant’s ability to generate economic benefits by using the asset in its highest and best use. Fair value
measurement and / or disclosure purposes in these financial statements is determined on such a basis, except for measurements that have
some similarities to fair value but are not fair value, such as net realisable value in Ind AS 2 or value in use in Ind AS 36.
The Company- uses valuation techniques that are appropriate in the circumstances and for which sufficient data are available to measure
fair value, maximising the use of relevant observable inputs and minimising the use of unobservable inputs.
All assets and liabilities for which fair value is measured or disclosed in the financial statements are categorised within the fair value
hierarchy, described as follows, based on the lowest level input that is significant to the fair value measurement as a whole:
Level 1 — Quoted (unadjusted) market prices in active markets for identical assets or liabilities
Financial assets and financial liabilities are offset and the net amount reported in the Balance sheet if, and only if, there is a currently
enforceable legal right to offset the recognised amounts and there is an intention to settle on a net basis, or to realise the assets and settle the
liabilities simultaneously.
Amortised cost is computed using the effective interest method less any allowance for impairment and principal repayment or reduction.
The calculation takes into account any premium or discount on acquisition and includes transaction costs and fees that are an integral part
of the EIR.
A financial liability is derecognised when the obligation under the liability is discharged or cancelled or expires.When an existing financial
liability is replaced by another from the same lender on substantially different terms, or the terms of an existing liability are substantially
modified, such an exchange or modification is treated as a derecognition of the original liability and the recognition of a new liability, and
the difference in the respective carrying amounts is recognised in the P&L.
Sitapuram Power Limited
Notes to Financial Statements
(All amounts are in � Crores, unless otherwise stated)
•
•
•
•
3.10 Leases
Company as a lessee
Operating lease payments are recognised as an expense in the statement of profit and loss on accrual basis.
3.11 Borrowing costs
3.12 Impairment of non-financial assets
MAT Credit
MAT credit is recognised as an asset only when and to the extent there is convincing evidence that the company will pay normal income
tax during the specified period. In the year in which the MAT credit becomes eligible to be recognized as an asset in accordance with the
recommendations contained in Guidance Note issued by The Institute of Chartered Accountants of India, the said asset is created by way of
a credit to the profit and loss account and shown as MAT Credit Entitlement. The Company reviews the same at each balance sheet date
and writes down the carrying amount of MAT credit entitlement to the extent there is no longer convincing evidence to the effect that
Company will pay normal income tax during the specified period.
The Company assesses at each reporting date whether there is an indication that an asset may be impaired. If any indication exists, or when
annual impairment testing for an asset is required, the Company estimates the asset’s recoverable amount. An asset’s recoverable amount is
the higher of an asset’s or cash-generating unit’s (CGU) fair value less costs to sell and its value in use. Recoverable amount is determined
for an individual asset, unless the asset does not generate cash inflows that are largely independent of those from other assets or Groups of
assets. Where the carrying amount of an asset or CGU exceeds its recoverable amount, the asset is considered impaired and is written down
to its recoverable amount. In assessing value in use, the estimated future cash flows are discounted to their present value using a pre-tax
discount rate that reflects current market assessments of the time value of money and the risks specific to the asset. In determining fair value
less costs to sell, an appropriate valuation model is used. These calculations are corroborated by valuation multiples, quoted share prices for
publicly traded subsidiaries or other available fair value indicators.
Impairment losses of continuing operations are recognised in the statement of profit and loss, except for property previously revalued where
the revaluation was taken to equity. In this case the impairment is also recognised in equity up to the amount of any previous revaluation.
Borrowing costs directly attributable to the acquisition, construction or production of qualifying assets, that necessarily take a substantial
period of time to get ready for their intended use or sale, are added to the cost of those assets.
Deferred income tax liabilities are recognised for all taxable temporary differences, except:
Where the deferred income tax liability arises from the initial recognition of goodwill or of an asset or liability in a transaction that is
not a business combination and, at the time of the transaction, affects neither the accounting profit nor taxable profit;
The carrying amount of deferred income tax assets is reviewed at each reporting date and reduced to the extent that it is no longer probable
that sufficient taxable profit will be available to allow all or part of the deferred income tax asset to be utilised. Unrecognised deferred
income tax assets are reassessed at each reporting date and are recognised to the extent that it has become probable that future taxable profit
will allow the deferred tax asset to be recovered.
Deferred income tax assets and liabilities are measured at the tax rates that are expected to apply in the year when the asset is realised or the
liability is settled, based on tax rates (and tax laws) that have been enacted or substantively enacted at the reporting date.
Deferred income tax assets and liabilities, relating to items recognised outside statement of profit and loss is recognised outside statement of
profit and loss. Deferred tax items are recognised in correlation to the underlying transaction either in other comprehensive income or
directly in equity.
Deferred income tax assets and deferred income tax liabilities are offset, if a legally enforceable right exists to set off current tax assets
against current income tax liabilities and the deferred income taxes relate to the same taxable entity and the same taxation authority.
In respect of taxable temporary differences associated with investments in subsidiaries and interests in joint operations, where the
timing of the reversal of the temporary differences can be controlled and it is probable that the temporary differences will not reverse in
the foreseeable future
Deferred income tax assets are recognised for all deductible temporary differences, the carry forward of unused tax credit and any unused
tax losses. Deferred tax assets are recognised to the extent that it is probable that taxable profit will be available against which the
deductible temporary differences and the carry forward of unused tax credits and unused tax losses can be utilised except:
Where the deferred income tax asset relating to the deductible temporary difference arises from the initial recognition of an asset or
liability in a transaction that is not a business combination and, at the time of the transaction, affects neither the accounting profit nor
taxable profit or loss;
All other borrowing costs including transaction costs are recognised in the statement of profit and loss in the year in which they are
incurred, the amount being determined using the effective interest rate method.
In respect of deductible temporary differences associated with investments in subsidiaries and interests in joint operations, deferred
income tax assets are recognised only to the extent that it is probable that the temporary differences will reverse in the foreseeable
future and taxable profit will be available against which the temporary differences can be utilised

Sitapuram Power Limited
Notes to Financial Statements
(All amounts are in � Crores, unless otherwise stated)
3.13 Cash and short-term deposits
3.14 Earnings per share
3.15 Provisions
3.16 Employee benefits
Gratuity
Provident fund
Eligible employees of Company receive benefits from a provident fund, which is a defined contribution plan. Both the employee and the
Company make monthly contributions to the provident fund plan equal to a specified percentage of the covered employee's salary and the
employer contribution is charged to statement of profit and loss. The benefits are contributed to the government administered provident
fund, which is paid directly to the concerned employee by the fund. The Company has no further obligation to the plan beyond its monthly
contributions.
Some employees of the Company are covered under “Employees State Insurance Scheme Act 1948”, which are also defined contribution
schemes recognized and administered by Government of India.
The Company's contributions to these schemes are recognized as expense in statement of profit and loss during the period in which the
employee renders the related service. The Company has no further obligation under these plans beyond its monthly contributions
Liabilities with regard to the Gratuity plan are determined by actuarial valuation, performed by an independent actuary, at each reporting
date using the projected unit credit method. The Company fully contributes all ascertained liabilities to the gratuity fund administered and
managed by Life Insurance Corporation of India, a Government of India undertaking which is a qualified insurer.
The Company recognises the net obligation of a defined benefit plan in its Balance sheet as an asset or liability, respectively in accordance
with IND AS 19, Employee benefits. Re-measurements of the net defined benefit liability, which comprise actuarial gains and losses, the
return on plan assets (excluding interest) and the effect of the asset ceiling (if any, excluding interest), are recognised immediately in OCI.
The Company determines the net interest expense / (income) on the net defined benefit liability (asset) for the period by applying the
discount rate used to measure the defined benefit obligation at the beginning of the annual period to the then-net defined benefit liability
(asset), taking into account any changes in the net defined benefit liability / (asset) during the period as a result of contributions and benefit
payments. Net interest expense and other expenses related to defined benefit plans are recognised in profit or loss
The earnings considered in ascertaining the Company’s earnings per share (EPS) comprise the net profit or loss for the period attributable
to equity holders. The number of shares used for computing the basic EPS is the weighted average number of shares outstanding during the
year.
Diluted earnings per share amounts are calculated by dividing the net profit attributable to equity holders (after adjusting for effects of all
dilutive potential equity shares) by the weighted average number of ordinary shares outstanding during the year plus the weighted average
number of shares that would be issued on conversion of all the dilutive potential shares into equity shares.
Employee state Insurance Scheme
Provisions are recognised when the Company has a present obligation (legal or constructive) as a result of a past event, it is probable that
an outflow of resources embodying economic benefits will be required to settle the obligation and a reliable estimate can be made of the
amount of the obligation. Where the Company expects some or all of a provision to be reimbursed, for example under an insurance
contract, the reimbursement is recognised as a separate asset but only when the reimbursement is virtually certain. The expense relating to
any provision is presented in the statement of profit and loss net of any reimbursement. If the effect of the time value of money is material,
provisions are discounted using a current pre-tax rate that reflects, where appropriate, the risks specific to the liability. Where discounting is
used, the increase in the provision due to the passage of time is recognised as a finance cost.
In accordance with Gratuity laws, the Company provides for gratuity, a defined benefit retirement plan (“the Gratuity Plan”) covering
eligible employees. The Gratuity Plan provides a lump-sum payment to vested employees at retirement, death, incapacitation or termination
of employment, of an amount based on the respective employee's salary and the tenure of employment.
For assets excluding goodwill, an assessment is made at each reporting date as to whether there is any indication that previously recognised
impairment losses may no longer exist or may have decreased. If such indication exists, the Company estimates the asset’s or cash-
generating unit’s recoverable amount. A previously recognised impairment loss is reversed only if there has been a change in the
assumptions used to determine the asset’s recoverable amount since the last impairment loss was recognised. The reversal is limited so that
the carrying amount of the asset does not exceed its recoverable amount, nor exceed the carrying amount that would have been determined,
net of depreciation, had no impairment loss been recognised for the asset in prior years. Such reversal is recognised in the statement of
profit and loss unless the asset is carried at revalued amount, in which case the reversal is treated as a revaluation increase.
Cash and short-term deposits in the Balance Sheet comprise cash at banks and on hand and short-term deposits.
For the purpose of the cash flow statement, cash and cash equivalents consist of cash and readily convertible short-term deposits, net of
restricted cash and outstanding bank overdrafts.

Sitapuram Power Limited
Notes to Financial Statements
(All amounts are in � Crores, unless otherwise stated)
4 Significant accounting judgements, estimates and assumptions
•
•
•
•
Actual results can differ from estimates.
Judgement
•
Short- term benefits
In the process of applying the Company’s accounting policies, management has made the following judgements which have the most
significant effect on the amounts recognised in the financial statements:
Useful lives of depreciable assets: Management reviews the useful lives of depreciable assets at each reporting date, based on the
expected utility of the assets to the Company. Actual results, however, may vary due to technical obsolescence, particularly relating to
software and information technology equipment.
Taxes : Uncertainties exist with respect to the interpretation of complex tax regulations, changes in tax laws, and the amount and timing
of future taxable income. Given the long-term nature and complexity of existing contractual agreements, differences arising between
the actual results and the assumptions made, or future changes to such assumptions, could necessitate future adjustments to tax income
and expense already recorded. The Company establishes provisions, based on reasonable estimates, for possible consequences of
assessment by the tax authorities. The amount of such provisions is based on various factors, such as experience of previous tax
assessment and differing interpretations of tax laws by the taxable entity and the responsible tax authority. The Company assesses the
probability for litigation and subsequent cash outflow with respect to taxes.
Gratuity benefits : The cost of defined benefit plans and the present value of the obligation are determined using actuarial valuations.
An actuarial valuation involves making various assumptions which may differ from actual developments in the future. These include
the determination of the discount rate, future salary increases and mortality rates. Due to the complexity of the valuation, the underlying
assumptions and its long-term nature, a defined benefit obligation is highly sensitive to changes in these assumptions. All assumptions
are reviewed at each reporting date.
The preparation of financial statements in conformity with IND AS requires management to make certain critical accounting estimates and
assumptions that affect the reported amounts of assets and liabilities and the disclosure of contingent assets and liabilities at the date of the
financial statements and the reported amounts of revenues and expenses during the reporting period.
The principal accounting policies adopted by the Company in the financial statements are as set out above. The application of a number of
these policies required the Company to use a variety of estimation techniques and apply judgment to best reflect the substance of
underlying transactions.
The Company has determined that a number of its accounting policies can be considered significant, in terms of the management judgment
that has been required to determine the various assumptions underpinning their application in the financial statements presented which,
under different conditions, could lead to material differences in these statements.
The policies where significant estimates and judgments have been made are as follows:
The key assumptions concerning the future and other key sources of estimation uncertainty at the reporting date, that have a significant risk
of causing a material adjustments to the carrying amounts of assets and liabilities within the next financial year are discussed below:
Estimation of fair value of acquired financial assets and financial liabilities : When the fair value of financial assets and financial
liabilities recorded in the Balance sheet cannot be derived from active markets, their fair value is determined using valuation techniques
including the discounted cash flow model. The inputs to these models are taken from observable markets where possible, but where this
is not feasible, a degree of judgment is required in establishing fair values. The judgments include considerations of inputs such as
liquidity risk, credit risk and volatility. Changes in assumptions about these factors could affect the reported fair value of financial
instruments.
Un-collectability of trade receivables: Analysis of historical payment patterns, customer concentrations, customer credit-worthiness
and current economic trends. If the financial condition of a customer deteriorates, additional allowances may be required. Further
recoverability of various claims as per power purchase agreement are subject to adjudicate at appropriate regulatory authorities.
Estimates and assumptions
Short-term employee benefit obligations are measured on an undiscounted basis and are expensed as the related service is provided. A
liability is recognised for the amount expected to be paid towards bonus if the Company has a present legal or constructive obligation to
pay this amount as a result of past service provided by the employee and the obligation can be estimated reliably.

Sitapuram Power Limited
Notes to Financial statements (continued)
(All amounts are in � Crores, unless otherwise stated)
5 Property, Plant and Equipment
Land-
Freehold
Buildings
& Roads
Plant &
Equipment
Furniture
fixturesVehicles
Office
equipment &
Computer
TotalCapital work
in progress
Deemed cost
As at 01 April 2015 0.13 28.50 97.70 0.02 0.06 0.22 126.63 -
Additions - - 0.47 0.00 - 0.03 0.50 0.00
Disposals/transfers - - - - - (0.02) (0.02) -
As at 31 March 2016 0.13 28.50 98.18 0.03 0.06 0.23 127.12 0.00
As at 01 April 2016 0.13 28.50 98.18 0.03 0.06 0.23 127.12 0.00
Additions - 0.08 4.71 - 0.20 0.06 5.06 0.31
Disposals/transfers - - - - (0.05) - (0.05) (0.00)
As at 31 March 2017 0.13 28.58 102.88 0.03 0.21 0.29 132.13 0.31
Depreciation
As at 01 April 2015 - - - - - - - -
Additions - 1.09 5.08 0.01 0.02 0.07 6.26 -
Disposals/transfers - - - - - (0.01) (0.01) -
As at 31 March 2016 - 1.09 5.08 0.01 0.02 0.05 6.25 -
As at 01 April 2016 - 1.09 5.08 0.01 0.02 0.05 6.25 -
Additions - 1.09 5.27 0.01 0.01 0.07 6.45 -
Disposals/transfers - - - - (0.03) - (0.03) -
As at 31 March 2017 - 2.18 10.36 0.01 0.00 0.12 12.67 -
Net book value
As at 01 April 2015 0.13 28.50 97.70 0.02 0.06 0.22 126.63 -
As at 31 March 2016 0.13 27.41 93.09 0.02 0.04 0.18 120.87 0.00
As at 31 March 2017 0.13 26.41 92.53 0.01 0.21 0.17 119.47 0.31
6 Intagible assets
Computer
softwareTotal
Intangible
assets under
development
Deemed cost
As at 01 April 2015 0.01 0.01 0.25
Additions - - -
As at 31 March 2016 0.01 0.01 0.25
As at 01 April 2016 0.01 0.01 0.25
Additions 0.25 0.25 (0.25)
As at 31 March 2017 0.26 0.26 -
Depreciation
As at 01 April 2015
Additions 0.01 0.01 -
As at 31 March 2016 0.01 0.01 -
As at 01 April 2016 0.01 0.01 -
Additions 0.02 0.02 0
As at 31 March 2017 0.03 0.03 -
Net book value
As at 01 April 2015 0.01 0.01 0.25
As at 31 March 2016 0.00 0.00 0.25
As at 31 March 2017 0.22 0.22 -
Intangible assets with a carrying amount of � 0.22 (31 March 2016: � 0.25, 01 April 2015: � 0.25) is subject to security restrictions (refer note.15)
7 Trade receivables
31 Mar 2017 31 Mar 2016 01 Apr 2015
Non-current
Unsecured and considered good 9.94 8.65 7.52
Total (A) 9.94 8.65 7.52
Current
Unsecured, considered good 14.46 20.92 18.09
Total (B) 14.46 20.92 18.09
Total (A+B) 24.40 29.56 25.60
Note:-Property, plant and equipment with a carrying amount of ������������� ����������������������� ������������������������������ ����� ��!�
restrictions. (refer note 15)
Trade receivable of ���"�"������ ������������������������� �������������������# �����$ %��&!���'�����&����()�(�������� ��!�# �� *�&)�� �#� �
note 15)
The Company is having majority of receivables from State distribution company which is Government undertaking and and capative consumer who is
reputed industrial consumer, hence they are secured from credit losses in the future.
Sitapuram Power Limited
Notes to Financial statements (continued)
(All amounts are in � Crores, unless otherwise stated)
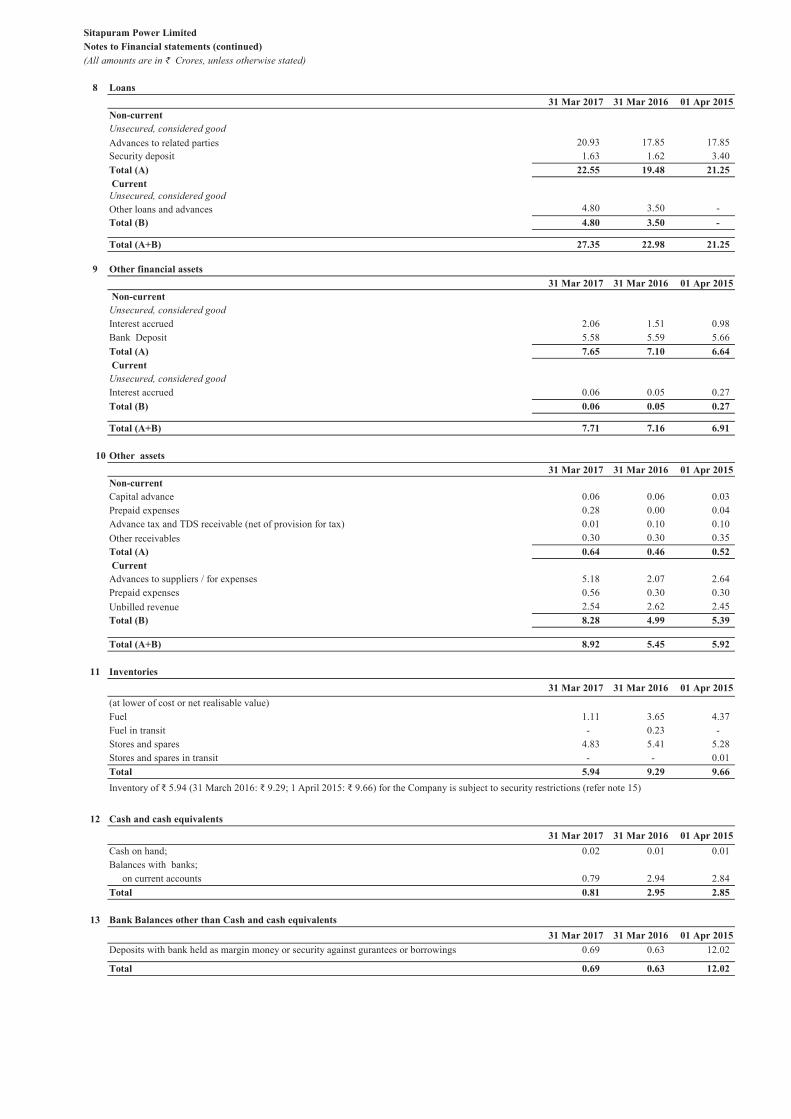
8 Loans
31 Mar 2017 31 Mar 2016 01 Apr 2015
Non-current
Unsecured, considered good
Advances to related parties 20.93 17.85 17.85
Security deposit 1.63 1.62 3.40
Total (A) 22.55 19.48 21.25
Current
Unsecured, considered good
Other loans and advances 4.80 3.50 -
Total (B) 4.80 3.50 -
Total (A+B) 27.35 22.98 21.25
9 Other financial assets
31 Mar 2017 31 Mar 2016 01 Apr 2015
Non-current
Unsecured, considered good
Interest accrued 2.06 1.51 0.98
Bank Deposit 5.58 5.59 5.66
Total (A) 7.65 7.10 6.64
Current
Unsecured, considered good
Interest accrued 0.06 0.05 0.27
Total (B) 0.06 0.05 0.27
Total (A+B) 7.71 7.16 6.91
10 Other assets
31 Mar 2017 31 Mar 2016 01 Apr 2015
Non-current
Capital advance 0.06 0.06 0.03
Prepaid expenses 0.28 0.00 0.04
Advance tax and TDS receivable (net of provision for tax) 0.01 0.10 0.10
Other receivables 0.30 0.30 0.35
Total (A) 0.64 0.46 0.52
Current
Advances to suppliers / for expenses 5.18 2.07 2.64
Prepaid expenses 0.56 0.30 0.30
Unbilled revenue 2.54 2.62 2.45
Total (B) 8.28 4.99 5.39
Total (A+B) 8.92 5.45 5.92
11 Inventories
31 Mar 2017 31 Mar 2016 01 Apr 2015
(at lower of cost or net realisable value)
Fuel 1.11 3.65 4.37
Fuel in transit - 0.23 -
Stores and spares 4.83 5.41 5.28
Stores and spares in transit - - 0.01
Total 5.94 9.29 9.66
12 Cash and cash equivalents
31 Mar 2017 31 Mar 2016 01 Apr 2015
Cash on hand; 0.02 0.01 0.01
Balances with banks;
on current accounts 0.79 2.94 2.84
Total 0.81 2.95 2.85
13 Bank Balances other than Cash and cash equivalents
31 Mar 2017 31 Mar 2016 01 Apr 2015
Deposits with bank held as margin money or security against gurantees or borrowings 0.69 0.63 12.02
Total 0.69 0.63 12.02
Inventory of �����"����� ��������������������� �����������������# �����$ %��&!������������� ����� ��!� ��� ���� &�� �#� �& ������
Sitapuram Power Limited
Notes to Financial statements (continued)
(All amounts are in � Crores, unless otherwise stated)
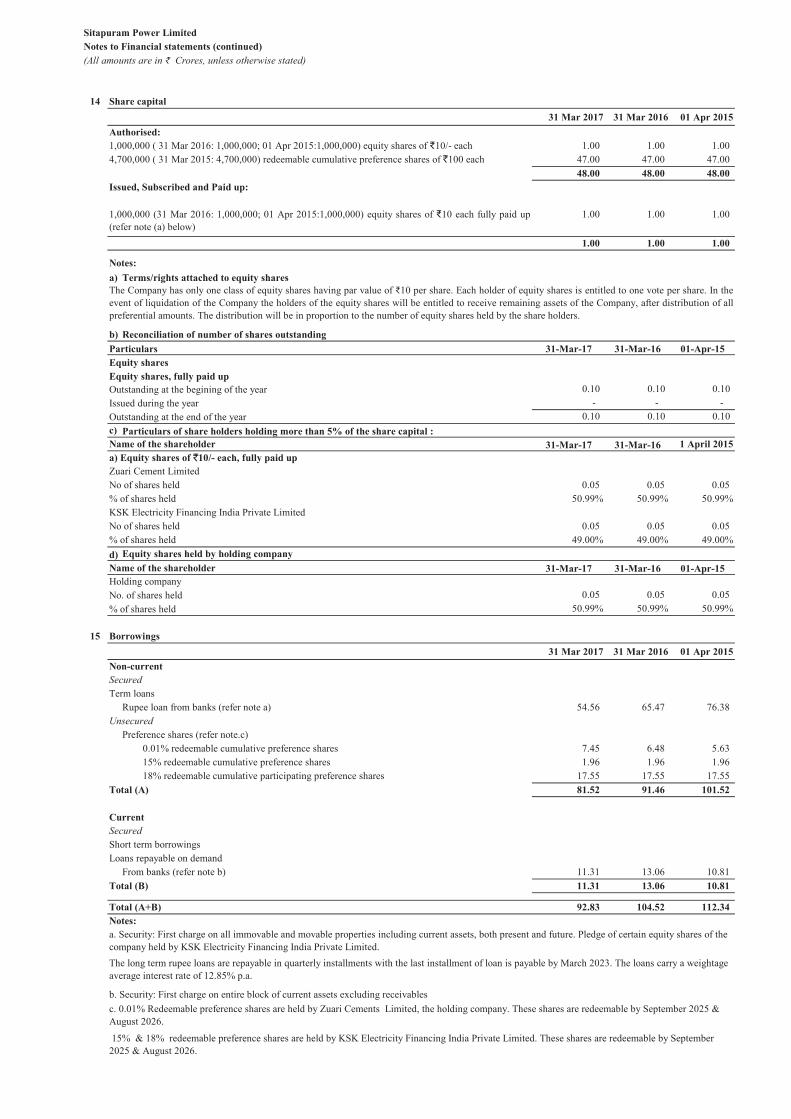
14 Share capital
31 Mar 2017 31 Mar 2016 01 Apr 2015
Authorised:
1.00 1.00 1.00
47.00 47.00 47.00
48.00 48.00 48.00
Issued, Subscribed and Paid up:
1.00 1.00 1.00
1.00 1.00 1.00
Notes:
a) Terms/rights attached to equity shares
b) Reconciliation of number of shares outstanding
Particulars 31-Mar-17 31-Mar-16 01-Apr-15
Equity shares
Equity shares, fully paid up
Outstanding at the begining of the year 0.10 0.10 0.10
Issued during the year - - -
Outstanding at the end of the year 0.10 0.10 0.10
c) Particulars of share holders holding more than 5% of the share capital :
Name of the shareholder 31-Mar-17 31-Mar-16 1 April 2015
a) Equity shares of �10/- each, fully paid up
Zuari Cement Limited
No of shares held 0.05 0.05 0.05
% of shares held 50.99% 50.99% 50.99%
KSK Electricity Financing India Private Limited
No of shares held 0.05 0.05 0.05
% of shares held 49.00% 49.00% 49.00%
d) Equity shares held by holding company
Name of the shareholder 31-Mar-17 31-Mar-16 01-Apr-15
Holding company
No. of shares held 0.05 0.05 0.05
% of shares held 50.99% 50.99% 50.99%
15 Borrowings
31 Mar 2017 31 Mar 2016 01 Apr 2015
Non-current
Secured
Term loans
Rupee loan from banks (refer note a) 54.56 65.47 76.38
Unsecured
Preference shares (refer note.c)
0.01% redeemable cumulative preference shares 7.45 6.48 5.63
15% redeemable cumulative preference shares 1.96 1.96 1.96
18% redeemable cumulative participating preference shares 17.55 17.55 17.55
Total (A) 81.52 91.46 101.52
Current
Secured
Short term borrowings
Loans repayable on demand
From banks (refer note b) 11.31 13.06 10.81
Total (B) 11.31 13.06 10.81
Total (A+B) 92.83 104.52 112.34
Notes:
a. Security: First charge on all immovable and movable properties including current assets, both present and future. Pledge of certain equity shares of the
company held by KSK Electricity Financing India Private Limited.
The long term rupee loans are repayable in quarterly installments with the last installment of loan is payable by March 2023. The loans carry a weightage
average interest rate of 12.85% p.a.
b. Security: First charge on entire block of current assets excluding receivables
c. 0.01% Redeemable preference shares are held by Zuari Cements Limited, the holding company. These shares are redeemable by September 2025 &
August 2026.
15% & 18% redeemable preference shares are held by KSK Electricity Financing India Private Limited. These shares are redeemable by September
2025 & August 2026.
1,000,000 ( 31 Mar 2016: 1,000,000; 01 Apr 2015:1,000,000) equity shares of �10/- each
4,700,000 ( 31 Mar 2015: 4,700,000) redeemable cumulative preference shares of �100 each
The Company has only one class of equity shares having par value of �10 per share. Each holder of equity shares is entitled to one vote per share. In the
event of liquidation of the Company the holders of the equity shares will be entitled to receive remaining assets of the Company, after distribution of all
preferential amounts. The distribution will be in proportion to the number of equity shares held by the share holders.
1,000,000 (31 Mar 2016: 1,000,000; 01 Apr 2015:1,000,000) equity shares of �10 each fully paid up
(refer note (a) below)

Sitapuram Power Limited
Notes to Financial statements (continued)
(All amounts are in � Crores, unless otherwise stated)
16 Deferred tax (liability) / assets
01 Apr 2016
Recognised
in the
income
statement
Recognised in
other
comprehensive
income
Others 31 Mar 2017
Deferred income tax assets
MAT credit 11.94 1.38 - - 13.33
11.94 1.38 - - 13.33
Deferred income tax liabilities
Property, plant and equipment 18.75 3.03 - - 21.79
18.75 3.03 - - 21.79
Deferred income tax liabilities, net (6.81) (1.65) - - (8.46)
01 Apr 2015
Recognised
in the
income
statement
Recognised in
other
comprehensive
income
Others 31 Mar 2016
Deferred income tax assets
MAT credit 11.20 0.74 - - 11.94
11.20 0.74 - - 11.94
Deferred income tax liabilities
Property, plant and equipment 15.70 3.06 - - 18.75
15.70 3.06 - - 18.75
Deferred income tax liabilities, net (4.50) (2.32) - - (6.81)
Tax Reconciliation
31 Mar 2017 31 Mar 2016
Accountig Pofit Before tax 1 2
Enacted tax rates 34.61% 34.61%
Tax on Profit at enacted rates 0 1
Expenditure not deductible for tax purpose 1.11 1.16
Unrecognised deferred tax assets on carry forward of losses due to 80 IA period 1.25 0.90
Deferred tax on PPE not recognised due to 80 IA period 0.20 0.23
������ 0.00 -
�������������� 3.04 3.06
17 Provisions
31 Mar 2017 31 Mar 2016 01 Apr 2015
Long-term provisions
For employee benefits 0.25 0.32 0.15
Total 0.25 0.32 0.15
Note
Reconciliation between tax expense and the product of accounting profit multiplied by India’s domestic tax rate for the years ended 31 March 2017 and
31 March 2016 is as follows:
The Company has a defined benefit gratuity plan. Every employee who has completed five years or more of service gets a gratuity on departure at 15 days
salary (last drawn salary) for each completed year of service. The scheme is funded with LIC in the form of a qualifying insurance policy.
The following table sets out the status of the gratuity plan as required under Ind AS 19
Company is entitled to avail exemption under section 80IA of the Income Tax Act, 1961 from income tax on profits of business. Based on the assessment
of the Company, deferred tax as on 31 March 2017 has been recognized only to the extent the timing differences arising in the current period which does
not get reversed within the tax holiday period.
Deferred income tax at 31 March 2017 and 31 March 2016 relates to the following:

Sitapuram Power Limited
Notes to Financial statements (continued)
(All amounts are in � Crores, unless otherwise stated)
������������ ��� �� � ��
31 Mar 2017 31 Mar 2016
Defined benefit obligation 0.58 0.49
Fair value of plan assets (0.33) (0.17)
Benefit Liability 0.25 0.32
31 Mar 2017 31 Mar 2016
��� ��������� ����� ��� ���������������� �� �������������� 0.49 0.31
��������� �� �������������
���������������� 0.05 0.06
���������� 0.04 0.02
0.59 0.39
��������� ���������������� ��� ����
���������������������
������������������������������� 0.01 0.12
0.01 0.12
������
����������������������
����������� (0.01) (0.01)
(0.01) (0.01)
��� ��������� ����� ��� ���������������������������� 0.58 0.49
Changes in the fair value of plan assets are as follows
31 Mar 2017 31 Mar 2016
�� �� ��������!����������
Fair value of plan assets beginning of the year 0.17 0.16
Included in income statement
Interest income 0.01 0.01
0.01 0.01
Included in other comprehensive income
Remeasurement loss / (gain)
Return on plan asset (excluding amounts included in net interest expense) 0.01 0.00
0.01 0.00
������
������������ 0.15 0.01
������� ��� (0.01) (0.01)
0.14 0.00
Fair value of plan assets end of the period 0.33 0.17
Net defined benefit liability (asset)
31 Mar 2017 31 Mar 2016
Balance 0.32 0.15
��������� �� �������������
Current service cost 0.05 0.06
Interest cost / (income) 0.03 0.01
0.08 0.07
Included in other comprehensive income
Remeasurement loss / (gain)
Actuarial losses/(gains) on obligation 0.00 0.12
0.00 0.12
Others
Contributions by employer (0.15) (0.01)
Benefits paid
(0.15) (0.01)
Defined benefit obligation as at the end of the year 0.25 0.32
Asset information
31 Mar 2017 31 Mar 2016
Insurer managed funds 100% 100%
As at
����"������� ����������������������������� ��������� ����� ��� ���������������#�

Sitapuram Power Limited
Notes to Financial statements (continued)
(All amounts are in � Crores, unless otherwise stated)
The principal assumptions used in determining the obligation towards the Group’s plan as shown below:
31 Mar 2017 31 Mar 2016
Discount rate 7.45% 7.80%
Rate of increase in compensation levels 10.00% 10.00%
Sensitivity analysis
Decrease Increase Decrease Increase
Discount Rate (- / + 1% movement) 0.09 (0.07) 0.07 (0.06)
Salary Growth Rate (- / + 1% movement) (0.04) 0.04 (0.04) 0.03
18 Other liabilities
31 Mar 2017 31 Mar 2016 01 Apr 2015
Non-current
13.70 16.44 19.17
Other liabilities 7.49 6.79 6.09
Total (A) 21.19 23.23 25.26
Current
2.74 2.74 2.74
Statutory liabilities 1.31 1.02 0.46
Total (B) 4.05 3.76 3.20
Total (A+B) 25.24 26.99 28.46
19 Trade payables
31 Mar 2017 31 Mar 2016 01 Apr 2015
Dues to other than micro and small enterprises 19.64 16.10 24.43
Total 19.64 16.10 24.43
20 Other financial liabilities
31 Mar 2017 31 Mar 2016 01 Apr 2015
Non-current
Interest accrued 36.81 33.36 29.91
Total (A) 36.81 33.36 29.91
Current
Current maturities of long-term debt 13.66 13.66 13.66
Interest accrued 0.71 0.84 1.08
Creditor for capital goods, including retention money 2.42 0.07 0.19
Salary and bonus payable 0.88 0.58 0.17
Total (B) 17.67 15.15 15.10
Total (A+B) 54.48 48.51 45.01
Trade payable are non-interest bearing and mainly includes amount payable to coal suppliers and operation and maintenance vendors in whose case credit
period allowed is less than 12 months. Since the average credit period is less than 12 months, the trade payable amount has been classified as current.
The company has not received any information from suppliers or service providers, whether they are covered under the ' The Micro, Small and Medium
Enterprises Development Act, 2006". Disclosure relating to amount unpaid at the period/year end together with interest payable, if any, as required under
the said Act are not ascertaiable.
Discount rate: The discount rate is based on the prevailing market yields of Indian government bonds as at the balance sheet date for the estimated term
of the obligations.
Deferred revenue
Deferred revenue
31 Mar 201631 Mar 2017

Sitapuram Power Limited
Notes to Financial statements (continued)
(All amounts are in � Crores, unless otherwise stated)
21 Revenue from operations
Year ended
31 Mar 2017
Year ended
31 Mar 2016
Sale of electricity 124.16 154.04
Other operating income - 0.35
124.16 154.39
22 Other income
Year ended
31 Mar 2017
Year ended
31 Mar 2016
Interest income on financial instrument 0.72 1.15
Profit on sale of assets 0.02 -
Amortisation of deferred revenue 2.74 2.74
Unwiding of discount on deposit & receivable 1.30 1.13
Miscellaneous income 0.02 0.10
4.80 5.12
23 Cost of fuel consumed
Year ended
31 Mar 2017
Year ended
31 Mar 2016
Consumption of coal 85.46 108.12
85.46 108.12
24 Employee benefit expenses
Year ended
31 Mar 2017
Year ended
31 Mar 2016
Salaries, wages and bonus 3.39 3.11
Contribution to provident and other funds 0.18 0.16
Staff welfare expenses 0.18 0.19
3.75 3.45
25 Finance costs
Year ended
31 Mar 2017
Year ended
31 Mar 2016
Interest expense 11.54 12.99
Unwinding of discount on redeemable preference shares 0.97 0.84
Interest on Prefereces shares 3.45 3.45
Other borrowing cost 0.36 0.29
16.32 17.57

Sitapuram Power Limited
Notes to Financial statements (continued)
(All amounts in Indian Rupees, except share data and where otherwise stated)
26 Other expenses
Year ended
31 Mar 2017
Year ended
31 Mar 2016
Stores & spares 1.24 1.66
Cost of import power 1.71 1.52
Raw water charges 0.16 0.30
Rent 0.00 0.00
Rates and taxes 0.79 0.79
Printing and stationery 0.01 0.01
Communication expenses 0.06 0.06
Insurance charges 0.26 0.23
Legal and professional charges 0.68 0.24
Transmission and selling charges 2.17 1.85
Travel and conveyance 0.20 0.21
Repairs and maintenance 0.27 0.30
plant and equipment 6.88 6.57
Corporate support service charges 0.49 0.49
Donation / gifts 0.13 0.03
Loans and receivables written off 0.00 6.97
Corporate social responsibilty 0.29 0.30
Miscellaneous expenses 0.21 0.35
15.57 21.87
27 Other Comprehensive Income
Year ended
31 Mar 2017
Year ended
31 Mar 2016
����������# ����������������� � ��������� ���������
����������������������������������� 0.00 0.12
0.00 0.12
28 Tax expense
Year ended
31 Mar 2017
Year ended
31 Mar 2016
Current tax
For the year 1.38 0.74
Earlier years taxes 0.00 -
Less: MAT credit entitlement (1.38) (0.74)
Deferred tax 3.03 3.06
3.04 3.06

Sitapuram Power Limited
Notes to Financial statements (continued)
(All amounts are in � Crores, unless otherwise stated)
29
31 Mar 2017 31 Mar 2016 01 Apr 2015
a.Contingent liabilities
Claims against the company not acknowledged as debts 0.91 0.91 0.91
b.Capital commitments
31 Mar 2017 31 Mar 2016 01 Apr 2015
Estimated value of contracts reamaning to be executed on capital account not
provided for 0.01 0.66 0.65
30
Year ended
31 Mar 2017
Year ended
31 Mar 2016
Net loss attributable to equity share holders (1.65) (0.84)
Weighted average number of equity shares outstanding during the year 1,000,000 1,000,000
Basic & diluted EPS (16.49) (8.40)
Face value of shares 10/- 10/-
31
Following are the applicable Ind AS 101 optional exemptions and mandatory exceptions applied in the transition from previous GAAP to Ind AS.
a Deemed cost of property, plant and equipment and intangible assets
b Derecognition of financial assets and financial liabilities
c Classification and measurement of financial assets
d Impairment of financial assets
Contingent liabilities & capital commitment
Earning per share
The Company has assessed classification and measurement of financial assets on the basis of facts and circumstances that exist as on
transition date.
The Company has applied impairment requirements of Ind AS 109 retrospectively; however, as permitted by Ind AS 101, it has used
reasonable and supportable information that is available without undue cost or effort to determine the credit risk at the date that
financial instruments were initially recognised in order to compare it with the credit risk at the transition date.
The Company has elected to continue with the carrying value of all its property, plant and equipments and intangible assets recognised
as of 1st April, 2015 measured as per the previous GAAP and use that carrying value as its deemed cost on transition date.
The Company has applied the derecognition requirements of financial assets and financial liabilities prospectively for transactions
occurring on or after transition date.
First-time adoption of Ind-AS
The Company has adopted Ind AS from 1st April, 2016 and the date of transition to Ind AS is 1st April, 2015. These being the first financial
statements in compliance with Ind AS, the impact of transition has been accounted for in opening reserves and comparable periods have been restated
in accordance with Ind AS 101 –“First-time Adoption of Indian Accounting Standards”. An explanation of how the transition from Previous GAAP to
Ind AS has affected the Company's financial position, financial performance and cash flows is set out in the following tables and notes.
Claims against the company not acknowledged as debt ��0.91 (31 March 2016 ��0.91; 01 April 2015 � 0.91)

Sitapuram Power Limited
Notes to financial statements
(All amounts are in � Crores, unless otherwise stated)
31 Reconciliation of equity as at 1 April 2015
Notes to
first-time
adoption
Previous GAAP * Adjustments Ind AS
I. ASSETS
1 Non-current assets
(a) Property plant and equipment 126.63 - 126.63
(b) Other intangible assets 0.01 - 0.01
(c) Intangible assets under development 0.25 - 0.25
(d) Financial asset
(i) Trade receivables 2 23.00 (15.48) 7.52
(ii) Loans 21.25 - 21.25
(iii) Other financial asset 6.64 - 6.64
(e) Other non-current assets 1 11.73 (11.20) 0.52
189.51 (26.68) 162.83
2 Current assets - - -
(a) Inventories 9.66 - 9.66
(b) Financial asset
(i) Trade receivables 18.09 - 18.09
(ii) Cash and bank balances 2.85 - 2.85
(iii) Other bank balances 12.02 - 12.02
(iv) Other financial asset 0.27 - 0.27
(c) Other current assets 5.39 - 5.39
48.28 - 48.28
237.79 (26.68) 211.10
II EQUITY AND LIABILITIES
1 Equity
(a) Equity share capital 5 48.00 (47.00) 1.00
(b) Other equity 9 46.27 (51.10) (4.83)
Total equity 94.27 (98.10) (3.83)
2 Non-current liabilities
(a) Financial liability
(i) Borrowings 3&5 77.00 24.52 101.52
(ii) Other financial liabilities 5 - 29.91 29.91
(b) Provisions 0.15 - 0.15
(c) Deferred tax liabilities (net) 1 15.43 (10.93) 4.50
(d) Other non current liabilities 5 - 25.26 25.26
92.58 68.76 161.34
3 Current liabilities
(a) Financial liability
(i) Borrowings 10.81 - 10.81
(ii) Trade payables 24.43 - 24.43
(iii) Other financial liabilities 3 15.19 (0.09) 15.10
(b) Other current liabilities 5 0.46 2.74 3.20
(c) Current Tax liability (Net) 0.05 - 0.05
50.94 2.65 53.59
237.79 (26.68) 211.10
Ind AS 101 requires an entity to reconcile equity, total comprehensive income and cash flows for the prior periods. The following
tables represents the reconciliations from previous GAAP to Ind AS.

Sitapuram Power Limited
Notes to financial statements
(All amounts are in � Crores, unless otherwise stated)
Reconciliation of equity as at 31 March 16
Notes to
first-time
adoption
Previous GAAP * Adjustments Ind AS
I. ASSETS
1 Non-current assets
(a) Property plant and equipment 120.87 - 120.87
(b) Capital work in progress 0.00 - 0.00
(c) Other intangible assets 0.00 - 0.00
(d) Intangible assets under development 0.25 - 0.25
(e) Financial asset
(i) Trade receivables 2 23.00 (14.35) 8.65
(ii) Loans 19.48 - 19.48
(iii) Other financial asset 7.10 - 7.10
(f) Other non-current assets 1 12.40 (11.94) 0.46
-
183.10 (26.30) 156.80
2 Current assets
(a) Inventories 9.29 - 9.29
(b) Financial asset
(i) Trade receivables 20.92 - 20.92
(ii) Cash and bank balances 2.95 - 2.95
(iii) Other bank balances 0.63 - 0.63
(iv) Loans 3.50 - 3.50
(v) Other financial asset 0.05 - 0.05
(c) Other current assets 4.99 - 4.99
42.34 - 42.34
225.44 (26.30) 199.14
II EQUITY AND LIABILITIES
1 Equity
(a) Equity share capital 5 48.00 (47.00) 1.00
(b) Other equity 9 46.77 (52.55) (5.78)
Total equity 94.77 (99.55) (4.78)
2 Non-current liabilities
(a) Financial liability
(i) Borrowings 3&5 66.00 25.46 91.46
(ii) Other financial liabilities 5 - 33.36 33.36
(b) Provisions 0.32 - 0.32
(c) Deferred tax liabilities (net) 1 18.25 (11.44) 6.81
(d) Other non current liabilities 5 - 23.23 23.23
84.57 70.61 155.18
3 Current liabilities
(a) Financial liability -
(i) Borrowings 13.06 - 13.06
(ii) Trade payables 16.10 - 16.10
(iii) Other financial liabilities 3 15.24 (0.09) 15.15
(b) Other current liabilities 5 1.02 2.74 3.76
(c) Current Tax liability (Net) 0.67 - 0.67
46.10 2.65 48.75
225.44 (26.30) 199.14

Sitapuram Power Limited
Notes to financial statements
(All amounts are in � Crores, unless otherwise stated)
Reconciliation of total comprehensive income for the year ended 31 March 2016.
Notes to
first-time
adoptionPrevious GAAP * Adjustments IND AS
Revenue from operations 8 154.42 (0.03) 154.39
Other income 2&5 1.25 3.87 5.12
Total revenue 155.67 3.83 159.50
Expenses
Cost of fuel consumed 108.12 - 108.12
Employee benefits expenses 4 3.57 (0.12) 3.45
Finance costs 5 13.19 4.39 17.57
Other expenses 5 21.21 0.67 21.87
Depreciation and amortisation expenses 6.27 - 6.27
Total expenses 152.35 4.94 157.29
Profit / (loss) before tax 3.32 (1.11) 2.22
Tax expense / (income)
Current tax
For the year 0.74 - 0.74
Less : MAT credit entitlement (0.74) - (0.74)
Deferred tax 1 2.82 0.24 3.06
Total tax expense / (income) 2.82 0.24 3.06
Profit / (loss) after tax after tax 0.50 (1.34) (0.84)
Other comprehensive income
Items that will not be reclassified to profit or loss 4&6 - (0.12) (0.12)
Other comprehensive loss for the year - (0.12) (0.12)
Total comprehensive income/(loss) 0.50 (1.46) (0.96)
Impact of Ind AS adoption on the statement of cash flows for the year ended 31 March 2016
Notes to
first-time
adoption
Previous GAAP Adjustments Ind AS
Net cash from operating activities 14.15 - 14.15
Net cash from investing activity 8.13 - 8.13
Net cash from financing activities (22.17) - (22.17)
Net increase / (decrease) in cash and cash equivalents 0.00 - 0.11
Cash and cash equivalents as at 1 April 2015 2.85 - 2.85
Cash and cash equivalents as at 31 March 2016 2.85 - 2.95
Notes to First time adoption of Ind AS
1 Deferred taxes:
In addition, the various transitional adjustments lead to temporary differences. According to the accounting policies, the Group has
to account for such differences. Deferred tax adjustments are recognised in correlation to the underlying transaction either in
retained earnings or a separate component of equity. On the date of transition, the net impact on deferred tax liabilities is of � 0.27
(31 March 2016: � 0.24 ).
* The Previous GAAP figures have been reclassified to conform to IND AS presentation requirement for the purpose of this note
Indian GAAP requires deferred tax accounting using the income statement approach, which focuses on differences between taxable
profits and accounting profits for the period. Ind AS 12 requires entities to account for deferred taxes using the balance sheet
approach, which focuses on temporary differences between the carrying amount of an asset or liability in the balance sheet and its
tax base. The application of Ind AS 12 approach has resulted in recognition of deferred tax on new temporary differences which
was not required under Indian GAAP.

Sitapuram Power Limited
Notes to financial statements
(All amounts are in � Crores, unless otherwise stated)
2 Longterm receivable
3 Borrowings:
4 Re-measurements of post-employment benefit obligations:
5 Redeemable preference shares & deferred revenue
6 Other comprehensive income:
7
8
9 Retained earnings:
Moreover as per Ind AS, balance of Mat credit entitlement is recognised under deferred income taxes as the definition of deferred
tax assets includes the amounts of income taxes recoverable in future period in respect of the carry forward of unused tax credits
also. The same under previous GAAP has been recognised under other non-current assets.
Statement of cash flows:
Revenue:
As per definition of Revenue under Ind AS 18, the Company recognises revenue at the fair value of consideration received or
receivable. Any sales incentive, discounts or rebates in any form, including cash discounts given to customers is considered as
selling price reductions and accounted as reduction from revenue. Under previous GAAP, some of these costs were included in
‘Other expenses’.
The transition from previous GAAP to Ind AS has not had a material impact on the statement of cash flows.
Under Ind AS, re-measurements i.e. actuarial gains and losses and the return on plan assets, excluding amounts included in the net
interest expense on the net defined benefit liability are recognised in other comprehensive income instead of profit or loss. Under
the previous GAAP, these re-measurements were forming part of the profit or loss for the year. As a result of this change, the loss
for the year ended March 31, 2016 increased by �.0.12. There is no impact on the total equity as at 31 March 2016 & 01 April
2015.
Under the previous GAAP, interest free longterm receivable (that are refundable in cash on completion of the contract term) are
recorded at their transaction value. Under Ind AS, all financial assets are required to be recognised at fair value.
Accordingly, the group has fair valued these longterm receivable under Ind AS. Difference between the fair value and transaction
value of the longterm receivable has been debited to retain earning. Consequent to this change, the amount of longterm receivable
decreased by � 14.35 as at 31 March 2016 (1 April 2015 � 15.48).
Ind AS 109 requires transaction costs incurred towards origination of borrowings to be deducted from the carrying amount of
borrowings on initial recognition. These costs are recognised in the profit or loss over the tenure of the borrowing as part of the
interest expense by applying the effective interest rate method.
Under previous GAAP, these transaction costs were charged to profit or loss (or capitalised as part of property plant and
equipment) as and when incurred.
Accordingly, borrowings as at 31 March 2016 have been reduced by � 0.62 (1 April 2015 � 0.70 ) with a corresponding adjustment
to prepaid expenses.
As per Ind AS, difference between contributions received from captive consumers of the Company in the form of preference shares
redeemable at the end of the agreement and its fair value are recognised as deferred revenue in the balance sheet and transferred to
statement of profit or loss on a systematic and rational basis over life of the term of the relevant agreement. Accordingly profit for
the year ended 31 March 2016 has been increased by � 2.74.
Retained earnings as at 01 April 2015 and as at 31 March 2016 has been adjusted, consequent to the above Ind AS transition
Under Ind AS, all items of income and expense recognised in a period should be included in profit or loss for the period, unless a
standard requires or permits otherwise. Items of income and expense that are not recognised in profit or loss but are shown in the
statement of profit and loss as ‘other comprehensive income’ includes re-measurements of defined benefit plans, foreign exchange
differences arising on translation of foreign operations, effective portion of gains and losses on cash flow hedging instruments and
fair value gains or (losses) on FVOCI equity instruments. The concept of other comprehensive income did not exist under previous
GAAP.
The Company has in issue redeemable preference shares. The preference shares carry fixed cumulative dividend which is non-
discretionary. Under Indian GAAP, the preference shares were classified as share capital and dividend payable thereon was treated
as distribution of profit.
Under Ind AS, redeemable preference shares are classified as liability based on the terms of the contract. Interest on liability
component is recognised using the effective interest method. Thus the preference share capital is reduced by� 47.00 with a
corresponding increase in borrowings of 31 March 2016 � 25.99 (01 April 2015 � 25.14) and deferred revenue by 31 March 2016 �
19.17 (01 April 2015 � 21.91) the diference � 0.05 taken to retain earning on 01 April 2015.
Accordingly interest expense and dividend tax for the year is recognised under finance costs and other expenses due to which profit
for the year ended 31 March 2016 has reduced by � 4.16 and retained earning by � 41.00 (1 April 2015: � 36.00)

Sitapuram Power Limited
Notes to Financial statements (continued)
(All amounts are in � Crores, unless otherwise stated)
32 Financial risk managament objectives and policies
(a) Interest rate risk
31 March 2017 31 March 2016
INR +50 (0.34) (0.40)
INR (50) 0.34 0.40
(b) Commodity price risk
Credit risk analysis
Note
31 March 2017 31 March 2016 1 April 2015
Trade receivables 7 24.40 29.56 25.60
Loans 8 27.35 22.98 21.25
Short term deposits with banks 12 0.69 0.63 12.02
Other financial asset 9 7.71 7.16 6.91
60.16 60.33 65.79
Liquidity risk analysis
Current
within 12 months 1-5 yearsLater than 5
years
Loan and borrowings 32.92 61.66 86.58 181.16
Trade and other payables 19.64 - - 19.64
Other financial liabilities 4.01 - 36.81 40.82
Total 56.56 61.66 123.40 241.61
The following is an analysis of the Company contractual undiscounted cash flows payable under financial liabilities at 31 March 2017:
Non-current
Total
CurrencyChange in basis
points
Effect on profit after tax / equity
The Company’s main source of liquidity is its operating businesses. The treasury department uses regular forecasts of operational cash flow, investment and
trading collateral requirements to ensure that sufficient liquid cash balances are available to service on-going business requirements. The Company manages
its liquidity needs by carefully monitoring scheduled debt servicing payments for long-term financial liabilities as well as cash-outflows due in day-to-day
business. Liquidity needs are monitored in various time bands, on a day-to-day and week-to-week basis, as well as on the basis of a rolling 90 day projection.
The Company is affected by the price volatility of certain commodities which is moderated by optimising the procurement under fuel supply agreement. Its
operating activities require the on-going purchase or continuous supply of coal. Therefore the Group monitors its purchases closely to optimise the price.
The carrying value of financial assets represents the maximum exposure for credit risk. The maximum exposure to credit risk of each class of financial assets
at the reporting date was as follows:
Carrying value
The Company has exposure to credit risk from a limited customer group on account of supply of power. However, the Company ensures concentration of
credit does not significantly impair the financial assets since the customers to whom the exposure of credit is taken are well established and reputed industries
engaged in their respective field of business. The credit worthiness of customers to which the Company grants credit in the normal course of the business is
monitored regularly. The credit risk for liquid funds and other short-term financial assets is considered negligible, since the counterparties are reputable banks
with high quality external credit ratings.
The Company’s management believes that all the above financial assets are not impaired for each of the reporting dates under review and are of good credit
quality.
Credit risk is the risk that counterparty will not meet its obligations under a financial instrument or customer contract, leading to a financial loss. The
Company is exposed to credit risk from its operating activities (primarily for trade and other receivables) and from its financing activities, including short-
term deposits with banks and financial institutions, and other financial assets.
Interest rate risk is the risk that the fair value or future cash flows of a financial instrument will fluctuate because of changes in market interest rates. The
Company's exposure to the risk of changes in market interest rates relates primarily to the Company's long-term debt obligations with floating interest rates.
The Company manages its interest rate risk by having a balanced portfolio of fixed and variable rate loans and borrowings.
The Company’s risk management activities are subject to the management direction and control. The Management ensures appropriate risk governance
framework for the Company through appropriate policies and procedures and that risks are identified, measured and managed in accordance with the
Company’s policies and risk objectives.
Market risk
Market risk is the risk that the fair values of future cash flows of a financial instrument will fluctuate because of changes in market prices. Market prices
comprise two types of risk: interest rate risk and other price risk, such as commodity risk.
In case of fluctuation in interest rates by 50 basis points and all other variables were held constant, the Company’s profit before tax for the year would
increase or decrease as follows:

Sitapuram Power Limited
Notes to Financial statements (continued)
(All amounts are in � Crores, unless otherwise stated)
The following is an analysis of the Group contractual undiscounted cash flows payable under financial liabilities at 31 March 2016:
Current
within 12 months 1-5 yearsLater than 5
years
Loan and borrowings 35.47 65.78 103.12 204.37
Trade and other payables 16.10 - - 16.10
Other financial liabilities 1.49 - 33.36 34.85
Total 53.06 65.78 136.48 255.32
The following is an analysis of the Company contractual undiscounted cash flows payable under financial liabilities at 1 April 2015:
Current
within 12 months 1-5 yearsLater than 5
years
Loan and borrowings 35.13 72.64 121.47 229.23
Trade and other payables 24.43 - 24.43
Other financial liabilities 1.44 - 29.91 31.35
Total 60.99 72.64 151.38 285.01
Capital management
Capital includes equity attributable to the equity holders of the parent and debt.
• Ensure Company’s ability to meet both its long-term and short-term capital needs as a going concern;
•
No changes were made in the objectives, policies or processes during the year ended 31 March 2017 and 31 March 2016.
The Group net debt to equity ratio at the reporting date is as follows:
31 March 2017 31 March 2016 1 April 2015
Total borrowing 106.49 118.18 126.00
Less : Cash and bank balances (0.81) (2.95) (2.85)
less : Other bank balances (0.69) (0.63) (12.02)
Net debt 105.00 114.59 111.13
Equity (6.43) (4.78) (3.83)
Total equity (6.43) (4.78) (3.83)
Net debt to equity ratio (16.32) (23.95) (29.03)
33 Financial Instruments
Carrying amount Fair value Carrying amount Fair value Carrying amount Fair value
31 March 2017 31 March 2017 31 March 2016 31 March 2016 1 April 2015 1 April 2015
Non- current financial assets
Trade receivables 9.94 9.94 8.65 8.65 7.52 7.52
Loans 22.55 22.55 19.48 19.48 21.25 21.25
Other financial asset 7.65 7.65 7.10 7.10 6.64 6.64
Total non-current 40.14 40.14 35.23 35.23 35.41 35.41
Current financial assets
Trade receivables 14.46 14.46 20.92 20.92 18.09 18.09
Cash and bank balances 0.81 0.81 2.95 2.95 2.85 2.85
Other bank balances 0.69 0.69 0.63 0.63 12.02 12.02
Other financial asset 0.06 0.06 0.05 0.05 0.27 0.27
Total current 16.02 16.02 24.56 24.56 33.23 33.23
Total 56.16 56.16 59.78 59.78 68.64 68.64
Non- current financial liabilities
Borrowings 81.52 81.52 91.46 91.46 101.52 101.52
Other financial liabilities 36.81 36.81 33.36 33.36 29.91 29.91
Total non-current 118.33 118.33 124.82 124.82 131.43 131.43
Current financial liabilities
Borrowings 11.31 11.31 13.06 13.06 10.81 10.81
Trade payables 19.64 19.64 16.10 16.10 24.43 24.43
Other financial liabilities 17.67 17.67 15.15 15.15 15.10 15.10
Total current 48.62 48.62 44.31 44.31 50.34 50.34
Total 166.95 166.95 169.13 169.13 181.77 181.77
The Company maintains a mixture of cash and cash equivalents, long-term debt and short-term committed facilities that are designed to ensure the Company
has sufficient available funds for business requirements.
The fair values of financial assets and financial liabilities, together with the carrying amounts in the Consolidated statement of financial position are as
follows:
Non-current
Total
Non-current
Total
The primary objective of the company's capital management is to ensure that it maintains a strong credit rating and healthy capital ratios in order to support
its business and maximise shareholder value objectives include, among others:
Constantly evolve multiple funding alternatives – equity and /or preference capital, senior and /or subordinated debt, corporate loan facilities to arrive at an
optimal capital mix;

Sitapuram Power Limited
Notes to Financial statements (continued)
(All amounts are in � Crores, unless otherwise stated)
34
Name of the party Relationship
Zuari Cement Limited Holding company
Name of the related party Relationship
KSK Energy Ventures Limited
KSK Electricity Financing India Private Limited
Sai Lilagar Power Generation Limited
V S Lignite Power Private Limited
c. Key Management Personnel
Name of the related party Nature of relationship
S Venkatesh Managing Director & CFO
S Kishore
K A Sastry Director
Particulars Year ended
31 Mar 2017
Year ended
31 Mar 2016
With the Holding Company
Sale of electricity 86.87 86.67
With the Enterprise having significant influence on the Company
Corporate support services fee 0.49 0.49
Advances given 3.07 -
With the entity under common control
Purchase of stores & spares 0.01 0.01
34
Particulars 31 Mar 2017 31 Mar 2016 01 Apr 2015
Holding Company
Trade receivable and unbilled revenue 2.54 5.93 8.93
Amount payable 7.45 8.44 5.63
Enterprise having significant influence on the Company
Amount payable 19.52 19.63 19.73
Interest payable 36.81 33.36 30.00
Advance given 20.93 17.85 17.85
Other receivable (other non-current asset) 9.94 8.65 7.52
d.Particulars of related party transactions
Following is a summary of related party transactions
Related parties
a.Parties where control exists
b.Other related parties with whom transactions have taken place during the period
Director
Enterprise having significant influence on
Related parties (continued)
e. Balances at the year end
Enterprise having significant influence on
Entity under the common control
Entity under the common control

Sitapuram Power Limited
Notes to Financial statements (continued)
(All amounts are in � Crores, unless otherwise stated)
35 Disclosure on Specified Bank Notes (SBN's)
ParticularsSBNs*
Other
Denomination Total
Closing cash in hand as on November 8, 2016 0.01 0.01 0.02
(+) Permitted receipts - 0.04 0.04
(-) Permitted payments - (0.04) (0.04)
(-) Amount deposited in Banks (0.01) - (0.01)
Closing cash in hand as on December 30, 2016 - 0.01 0.01
36 Segment information
for and on behalf of the Board
S.Venkatesh S. Kishore
Managing Director & CFO Director
DIN: 05267026 DIN: 00006627
Place: Hyderabad Subir Boity
Date: Company Secretary06-09-2017
* For the purposes of this clause, the term ‘Specified Bank Notes’ shall have the same meaning provided in the notification of the
Government of India, in the Ministry of Finance, Department of Economic Affairs number S.O. 3407(E), dated the 8th November,
2016.
As the Company is engaged only in the generation and sale of electricity at Telangana state. Considering the nature of Company's business and
operations as well as based on reviews of operating results by the chief operating decision maker to make decisions about resource allocation and
performance measurement, there is only one reportable segment in accordance with the requirements of Ind AS - 108 – '‘Operating Segments’',
prescribed under Companies (Indian Accounting Standards) Rules, 2015.
During the year, the Company had specified bank notes or other denomination note as defined in the MCA notification G.S.R. 308(E) dated March
31, 2017 on the details of Specified Bank Notes (SBN) held and transacted during the period from November 8, 2016 to December, 30 2016, the
denomination wise SBNs and other notes as per the notification is given below: