Embed Size (px)
Citation preview

SP1
Signaling preferences of substituted pyrrole coupled six-membered
spirocyclic rhodamine probes towards Hg2+
ion detection
Biswonath Biswal, Debajani Mallick, Bamaprasad Bag*
Colloids and Materials Chemistry Department, Academy of Scientific and Innovative Research, CSIR-
Institute of Minerals and Materials Technology, P.O.: R.R.L., Bhubaneswar-751 013, Odisha, India.
Fax: (+) 91 674 258 1637; Tel: (+ 91) 674 237 9254, Email: [email protected]
Electronic Supplementary Information
Experimental All the reagent grade chemicals were used without purification unless otherwise specified. 2,4-dimethyl
pyrrole carboxaldehyde, rhodamine B base and the metal-perchlorate salts were obtained from Sigma–
Aldrich (India) and used as received. Anhydrous sodium sulphate, sodium borohydride, silica gel for column
chromatography, acids and the solvents were received from Spectrochem Pvt Ltd (India). All the solvents
were freshly distilled prior to use for absorption and fluorescence measurements.
Fluorescence quantum yields were determined by comparing the corrected spectrum with that of rhodamine
G (φF = 0.95) in EtOH by taking area under total emission using following eqn.,
...... ...... eqn. S1
where φS and φR are radiative quantum yields, FS and FR are area under the fluorescence
spectra, AS and AR are absorbances (at the excited wavelength) of respective samples and the reference
respectively; ηS and ηR are the refractive indices of the solvent used for the sample and the reference. The
quantum yield of Rhodamine G was measured using quinine sulfate in 1N H2SO4 as reference excited at
(λex) 350 nm. The standard quantum yield value thus obtained was used for the calculation of the quantum
yield of the samples.
The graphical representations of synthesized compounds are given in Scheme S1 for quick reference.
O NN
O
O
O NN
O
Cl
1a
O NN
1
N
O
HN
NHN
2a
HN
N
O NN
N
O
2
O
N
O
HN NO2
N N
O
N
NN
HN
NO
H2N
R1R2
Scheme S1: Structure of the compounds
Electronic Supplementary Material (ESI) for Organic & Biomolecular Chemistry.This journal is © The Royal Society of Chemistry 2016

SP2
Fig. S1:
1H-NMR spectrum of 1 in CDCl3.
Fig. S2:
13C-NMR spectrum of 1 in CDCl3.
SP3
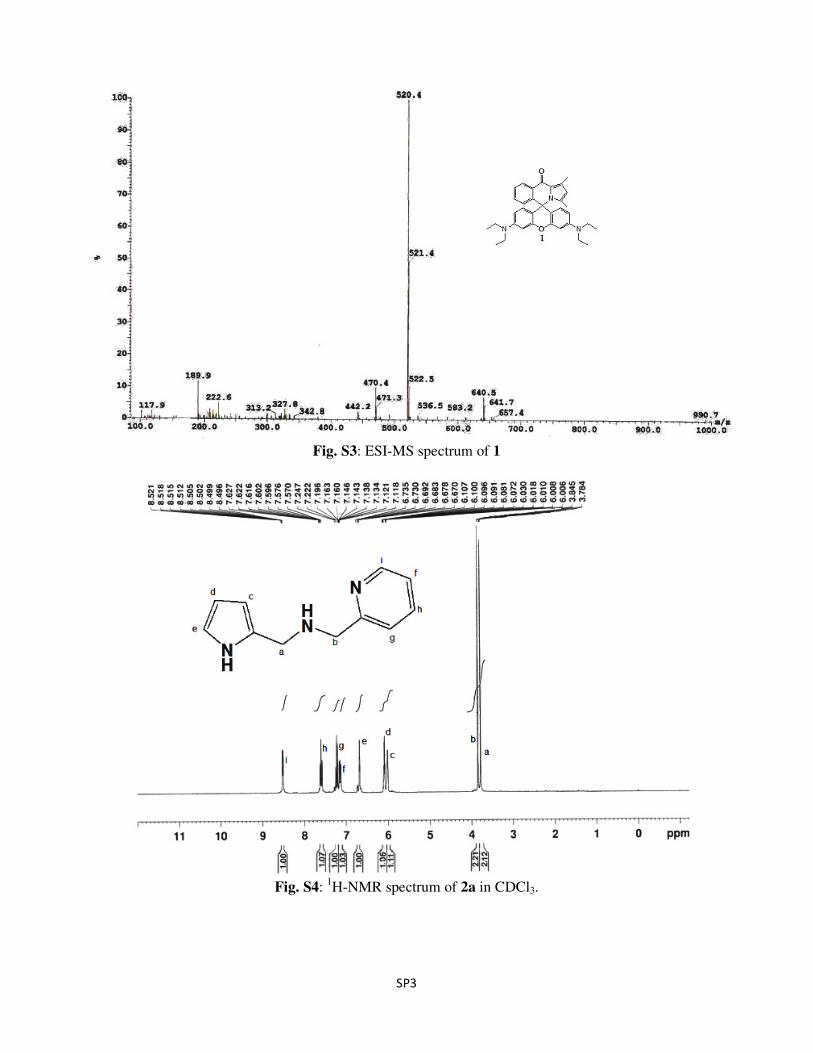
Fig. S3: ESI-MS spectrum of 1
Fig. S4:
1H-NMR spectrum of 2a in CDCl3.

SP4
Fig. S5:
13C-NMR spectrum of 2a in CDCl3.
Fig. S6: ESI-MS spectrum of 2a
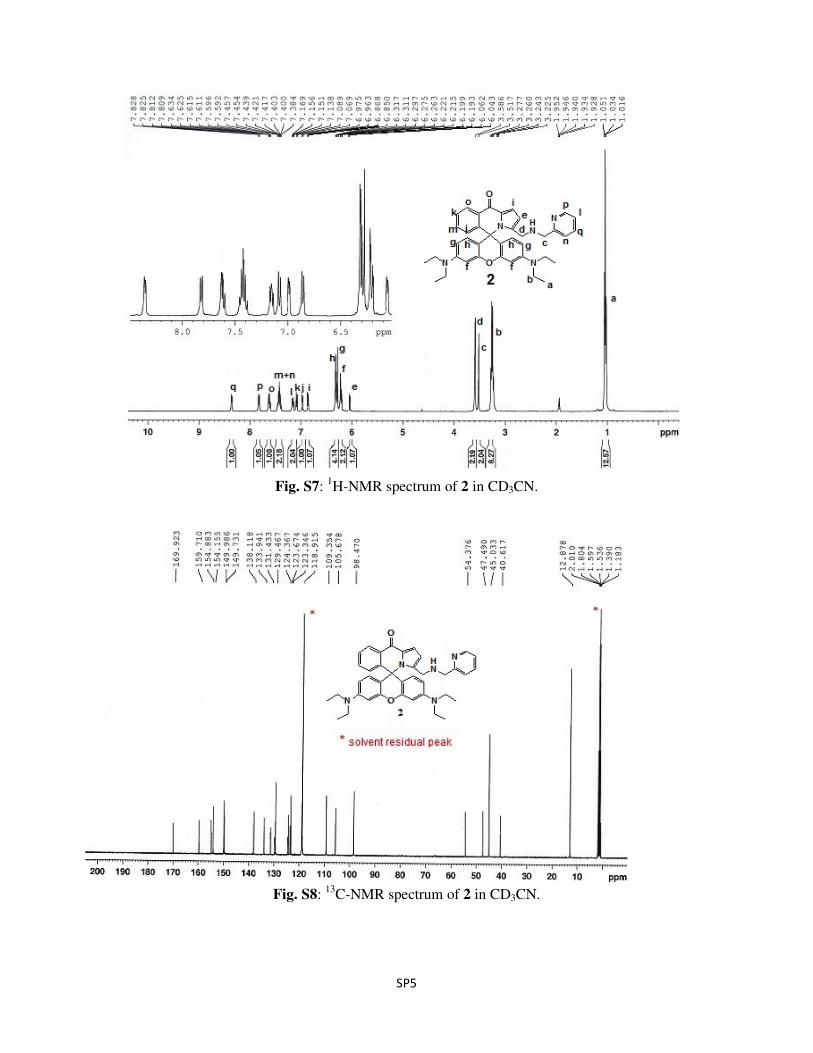
SP5
Fig. S7:
1H-NMR spectrum of 2 in CD3CN.
Fig. S8:
13C-NMR spectrum of 2 in CD3CN.

SP6
Fig. S9: ESI-MS spectrum of 2
300 400 500 600 700
0.0
0.1
0.2
0.3
0.4
Hg2+
Ab
s.
Wavelength(nm)
1 (blank)
1+ Mn2+
1+Fe2+
1+Co2+
1+Ni2+
1+Cu2+
1+Zn2+
1+Ag+
1+Cd2+
1+Pb2+
1+Hg2+
(a)
300 400 500 600 700 8000.0
0.2
0.4
0.6
0.8
1.0
Ab
s.
Wavelength(nm)
2 (blank)
2+Mn2+
2+Fe2+
2+Co2+
2+Ni2+
2+Cu2+
2+Zn2+
2+Ag+
2+Pb2+
2+Cd2+
2+Hg2+
Hg2+
(b)
Fig. S10: Absorption spectra of (a) 1 and (b) 2 in presence of various metal ions. [1 or 2] = 10µM, MeCN-
H2O (1:1 v/v, pH 7.2).
Fig. S11: Change in colour in the solution of 1(2×10⁻⁵
M) in MeCN-H2O (1:1 v/v, pH 7.2) upon addition of
0, 1, 2, 3 and 5 eq. of Hg2+
under (a) normal light and (b) upon irradiation at 450nm.

SP7
Fig. S12: Ground state HOMO and LUMO of 1(left) and 2(right) as elucidated from DFT calculations. The
energies of frontier orbitals and corresponding distribution of π-electrons shows that the electron densities
located over xanthene ring in HOMO while those over spiro-ring in LUMO. The HOMO-LUMO energy
gap shows that these probes do not absorb in the visible region, rather exhibits absorption transitions at 312
nm (1) and 331 nm(2) respectively, which is complemented well to the experimental observations.

SP8
10
0.0
2.0x10³
4.0x10³
6.0x10³
8.0x10³
1.0x10⁴ 1 (MeCN)
1 (MeCN:H2O, 1:1 v/v)
1 (Ethanol)
1+Hg2+
(MeCN)
1+Hg2+
(Ethanol)
1+Hg2+
(MeCN:H2O, 1:1 v/v)
Ph
oto
n c
ou
nts
Time (t) in ns
Fig S13: Time-resolved fluorescence exponentially fitted decay profile of 1 in absence and presence of Hg2+
ion in MeCN, MeCN-H2O (1:1 v/v) and EtOH medium.
Table ST-1: Fit-results to the exponential decay curve obtained with time-correlated single photon counting
technique with single exponential fit equation A+B exp (-t/τ)
Solvent MeCN:H2O (1:1 v/v) MeCN EtOH
1 1+Hg2+
1 1+Hg2+
1 1+Hg2+
τ (av., ns) 1.572 5.682 1.918 6.084 1.465 4.070
A 8.819 16.306 7.532 16.212 9.446 15.806
B 6816.138 10191.604 7875.959 10820.598 9318.325 9312.714
σ (std. dev.) 44.2667 29.4258 54.6974 29.6571 69.8257 59.2583
χ2 1.234 1.075 1.161 1.284 1.179 1.051
0.0 0.2 0.4 0.6 0.8 1.0
0.0
0.1
0.2
0.3
0.4
0.5
Ab
s.
[Hg(II)]/([Hg(II)] + [1])
(a)
λabs
obs = 557 nm
0.0 0.2 0.4 0.6 0.8 1.0
0.00
0.05
0.10
0.15
0.20
0.25
λabs
obs = 557 nm
Abs
Mole fraction [Pb2+
]/ ([Pb2+
]+[2])
(b)
Fig. S14: Change in absorption as a function of mole fraction of added metal ion(Job’s plot) for
determination of complexation stoichiometry, (a) 1 with Hg2+
and (b) 2 with Pb2+
ion respectively.

SP9
0 2 4 6 8 10
0
1
2
3
4
5
Flu
o.
Int.
(a
. u
., x
E6
)
Eq. of Hg2+
added
1000 1500 2000 2500 3000
0.0
4.0x10⁻⁶
8.0x10⁻⁶
1.2x10⁻⁵
1.6x10⁻⁵
1/(
I-I 0
)
1/[Hg(II)]0.5
Eqn. Y = m*X+c
Adj. R sq. 0.9699
Value Std. err.
1/(I-I0) Intercept -6.25322E-6 6.69967E-7
1/(I-I0) Slope 6.24953E-9 4.04586E-10
Fig. S15: (a) Plot of change in fluorescence intensity of 1 as a function of added [Hg(II)] ions in MeCN-
H2O (1:1 v/v). Experimental conditions: [1] = 5 × 10⁻⁷
M, λex = 500 nm, RT, ex. and em. b. p. = 5nm; (b)
Linear regression to the double reciprocal plot of fluorescence intensity change{1/(I-I0)} against added metal
ion (1/[Hg2+
]0.5
) for determination of complex stability constant for 2:1 (1:Hg2+
) complexation
stoichiometry.
SP10
0 2 4 6 8 100.00
0.05
0.10
0.15
0.20
0.25
Ab
s.
Eq. of Hg2+
added
(a)
0 2 4 6 8 10
2
4
6
8
10
12
14
Flu
o.
Int.
(a
. u.,
1E
5)
Eq. of Hg2+
added
(b)
-14.0 -13.5 -13.0 -12.5 -12.0 -11.5 -11.0 -10.5 -10.0
0.00
0.05
0.10
0.15
0.20
0.25
Abs (
A5
57)
ln([Hg2+
])
Equation y = A2 + (A1-A2)/(1 + exp((x-x0)/dx))
Adj. R-Square 0.99713
Value Standard Error
A1 -0.00271 0.00334
A2 0.25063 0.00332
x0 -11.78492 0.01631
dx 0.99207 0.01559
(c)
-16 -15 -14 -13 -12 -11
0.2
0.4
0.6
0.8
1.0
1.2
1.4
Flu
o.
Int.
(arb
. u
nits,
xE
6)
ln([Hg2+
])
Equation y = A2 + (A1-A2)/(1 + exp((x-x0)/dx))
Adj. R-Square 0.9975
Value Std. Err.
E A1 190837.92597 14089.78886
E A2 1.37508E6 8810.92593
E x0 -13.90354 0.01592
E dx 0.95701 0.01375
(d)
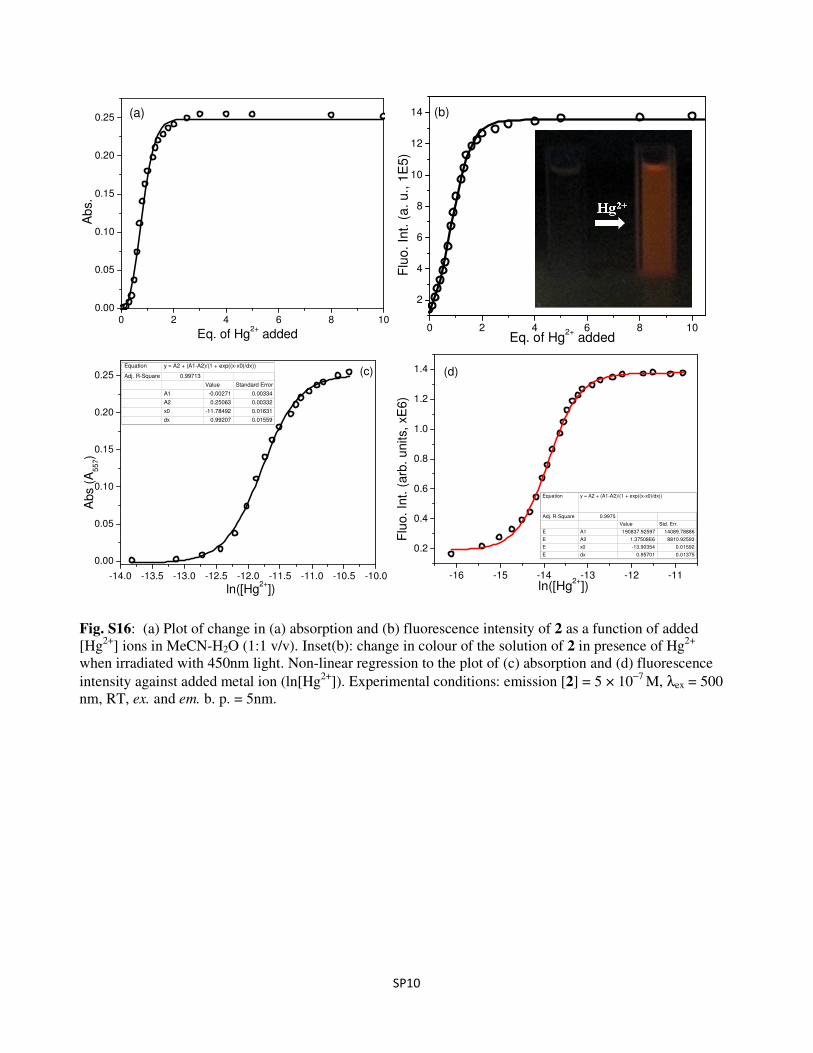
Fig. S16: (a) Plot of change in (a) absorption and (b) fluorescence intensity of 2 as a function of added
[Hg2+
] ions in MeCN-H2O (1:1 v/v). Inset(b): change in colour of the solution of 2 in presence of Hg2+
when irradiated with 450nm light. Non-linear regression to the plot of (c) absorption and (d) fluorescence
intensity against added metal ion (ln[Hg2+
]). Experimental conditions: emission [2] = 5 × 10⁻⁷
M, λex = 500
nm, RT, ex. and em. b. p. = 5nm.

SP11
550 600 650 700 750 800
I572
Flu
o.
Int.
(a
rb u
nits)
Wavelength(nm)
Pb2+
0
7 Eqv.
I544 (a)
0.01.0x10
-6
2.0x10⁻⁶
3.0x10⁻⁶
4.0x10⁻⁶
5.0x10⁻⁶
6.0x10⁻⁶
7.0x10⁻⁶
8.0x10⁻⁶
0
1
2
3
4
5
6
7
0.0 2.0x10⁻⁷
4.0x10⁻⁷
6.0x10⁻⁷
8.0x10⁻⁷
Flo
ur. i
nten
sity
a.u
)
[Pb2+
]
Flo
u.
Int.
(a
rb.u
nits,
xE
6)
[Pb2+
]
I544
I572
(b)
-16.0 -15.5 -15.0 -14.5 -14.00
1
2
3
4
5
6
Flu
o.
Int.
(a
rb.
un
its,
xE
6)
ln([Pb2+
])
Equation y = A2 + (A1-A2)/(1 + exp((x-x0)/dx))
Adj. R-Square 0.99745
Value Standard Error
C A1 187862.30487 115612.52152
C A2 6.04662E6 131241.94292
C x0 -14.78708 0.0227
C dx 0.88214 0.02261
(c)
Fig. S17: (a) Fluorescence spectra of 2 as a function of equivalents of added Pb2+
ion and (b) its
corresponding spectral profile at 644nm and 672nm respectively. (Inset, a) Change in colour of the solution
of 2 in presence of Pb2+
when irradiated with 450 nm light. (c) Non-linear regression to the plot of
corresponding fluorescence intensity against added metal ion (ln[Pb2+
]). Experimental conditions: emission
[2] = 5 × 10⁻⁷
M, λex = 500 nm, RT, ex. and em. b. p. = 5nm.

SP12
400 450 500 550 600 650 700 7500.00
0.05
0.10
0.15
0.20
0.25
0.30
15.0 eq.
Ab
s
Wavelength (nm)
0.0
[Cu2+
]
Fig. S18: Absorption spectra of 2 (1×10⁻⁴
M) in MeCN-H2O (1:1 v/v, PBS, pH 7.2) as a function of
equivalents of added Cu2+
ion.
0.00E+000 5.00E-009 1.00E-008 1.50E-008 2.00E-008
2.0
2.5
3.0
3.5
4.0
Flo
u.
Int.
(arb
. units,
xE
4)
[Hg2+
]
Equation y = a + b*x
Adj. R-Square 0.99359
Value Standard Error
a Intercept 16594.207 261.43208
b Slope 1.17744E12 2.84963E10
(a)
0.0 2.0x10⁻⁸
4.0x10⁻⁸
6.0x10⁻⁸
8.0x10⁻⁸
1.0x10⁻⁷
1.45
1.50
1.55
1.60
1.65F
luo
. In
t. (
arb
. un
its,
E5
)
[Hg2+
]
Equation y = a + b*x
Adj. R-Sq 0.99761
Value Standard Error
I Intercept 143540.22727 199.46205
I Slope 2.1787E11 3.37152E9
(b)
Fig. S19: Linear regression of fluorescence spectral intensities of (a) 1 and (b) 2 with added Hg2+
ion for
determination of sensitivity of Hg2+
detection.
550 600 650 700 750 800
0.0
5.0x10⁵
1.0x10⁶
1.5x10⁶
2.0x10⁶
2.5x10⁶
3.0x10⁶
Flu
o.
Int.
(arb
. un
its)
Wavelength (nm)
MeCN:H2O(9:1 v/v)
MeCN:H2O(8:2 v/v)
MeCN:H2O(7:3 v/v)
MeCN:H2O(6:4 v/v)
MeCN:H2O(5:5 v/v)
MeCN:H2O(4:6 v/v)
MeCN:H2O(3:7 v/v)
MeCN:H2O(2:8 v/v)
MeCN:H2O(1:9 v/v)
Fig. S20: Fluorescence spectra of 1 in presence of Hg(ClO4)2 (5 eq.) in varied proportion of binary solvent
composition (MeCN:H2O, v/v, PBS). [1] = 2�M, λex = 500nm, RT, ex. and em. b p = 5nm.

SP13
1000 1500 2000 2500 3000 3500 4000
75
80
85
T(%
)
Wavenumber (cm 1)
1
1+ Hg(II) [0.5 eq.]
1+ Hg(II) [1.0 eq.]
1+ Hg(II) [2.0 eq.]
1+ Hg(II) [complex]
(a)
1500 1550 1600 1650 1700 1750 1800 1850
75
80
85
T(%
)
Wavenumber (cm 1)
1
1+ Hg(II) [0.5 eq.]
1+ Hg(II) [1.0 eq.]
1+ Hg(II) [2.0 eq.]
1+ Hg(II) [complex]
(b)
2
2+ Hg(II) (0.5 eq.)
2+ Hg(II) (1 eq.)
2+ Hg(II) (complex)
1000 1500 2000 2500 3000 3500 4000
20
40
60
80
100
2100 2150 2200 2250 2300 2350 2400
70
80
90
100
T (
%)
Wavenumber (cm-1)
T (
%)
Wavenumber (cm-1)
(c)
1400 1600 180020
40
60
80
100
T (
%)
Wavenumber (cm-1)
2
2+ Hg(II) (0.5 eq.)
2+ Hg(II) (1 eq.)
2+ Hg(II) (complex)
(d)
Fig. S21: FT-IR spectra of 1 (a and b) and 2 (c and d) alone and in presence of Hg
2+ ion in solution.

SP14
0 500 1000 1500 2000
0.190
0.195
0.200
0.205
0.210
0.215
(d)
(c)
k3
k2
(Ab
s) 5
57
Time(sec.)
(a)
k1
(b)
0 50 100 150 200 250 300 350
-1.66
-1.65
-1.64
-1.63
-1.62
-1.61
-1.60
ln (
A55
7)4
00
0
Time (s)
Equation y = a + b*x
Adj. R-Square 0.9851
Value Standard Error
Intercept -1.64818 1.68137E-4
Slope 1.26687E-4 8.3385E-7
(b)
400 600 800 1000 1200 1400
-1.610
-1.605
-1.600
-1.595
-1.590
-1.585
-1.580
ln (
A5
57)1
450
40
0
Time (s)
Equation y = a + b*x
Adj. R-Square 0.98788
Value Standard Error
Intercept -1.61575 7.7087E-5
Slope 2.31668E-5 7.91865E-8
(c)
1500 1600 1700 1800
-1.585
-1.580
-1.575
-1.570
-1.565
-1.560
-1.555
ln (
A5
57)1
850
14
50
Time (s)
Equation y = a + b*x
Adj. R-Square 0.99569
Value Standard Error
Intercept -1.68028 3.70885E-4
Slope 6.80573E-5 2.24163E-7
(d)
Fig. S22: (a) Change in absorption (A557) in 1(10 �M) when added Hg
2+ ion as a function of time (s) in
MeCN-H2O (1:1 v/v, PBS, pH 7.2). Figures (b), (c) and (d) represents linear regression plots of ln(A557)
against time for determination of rate constant (k) of first-order kinetics at the desired time interval.
0 10 20 30 40 50 60 70
0.054
0.056
0.058
0.060
O
N
O
HN NO2
N N
(Abs.)
55
7
Time(s)
(a)
R1
0 5 10 15 20 25-2.94
-2.92
-2.90
-2.88
-2.86
-2.84
-2.82
ln (
A)2
5
0
Time (s)
Equation y = a + b*x
Adj. R-Square 0.94611
Value Standard Error
Intercept -2.91415 0.0026
Slope 0.0039 1.93708E-4
(b)
Fig. S23: (a) Change in absorption (A557) in a five membered spiro-ring based probe R1 (4 �M) when
Hg2+
ion added (1:1 stoichiometry) as a function of time (s) in MeCN-H2O (1:1 v/v, PBS, pH 7.2).

SP15
0 20 40 60 80 100
0.040
0.042
0.044
0.046
O
N
NN
HN
NO
H2N
Abs
Time (s)
(a)
(R2)
0 5 10 15 20
-3.24
-3.22
-3.20
-3.18
-3.16
-3.14
-3.12
ln (
A)2
0
0
Time (s)
Equation y = a + b*x
Adj. R-Square 0.92661
Value Standard Error
Intercept -3.23836 0.0044
Slope 0.0057 3.67426E-4
(b)
k1
20 40 60-3.24
-3.20
-3.16
-3.12
-3.08
ln (
A)7
0
20
Time (s)
Equation y = a + b*x
Adj. R-Square 0.22071
Value Standard Error
Intercept -3.12913 8.69844E-4
Slope 6.93177E-5 1.85073E-5
(c)
k2
70 75 80 85 90 95 100-3.14
-3.13
-3.12
-3.11
-3.10
-3.09
-3.08
-3.07
-3.06
ln (
A)9
9
70
Time (s)
Equation y = a + b*x
Adj. R-sq. 0.98796
Value Standard Error
Intercept -3.30797 0.00456
Slope 0.00252 5.46483E-5
(d)
k3
Fig. S24: (a) Change in absorption (A557) in another five membered spiro-ring based probe R2 (1 �M)
when Hg2+
ion added in (1:2 ligand-metal stoichiometry) as a function of time (sec) in MeCN-H2O (1:1 v/v,
PBS, pH 7.2). Figures (b), (c) and (d) represents corresponding linear regression plots of ln(A557) against
time(s) for determination of fractional rate constants (k) of first-order kinetics at the desired time interval.
0 200 400 600 800 1000-2.25
-2.20
-2.15
-2.10
-2.05
-2.00
-1.95
-1.90
-1.85
ln (
A55
7)
Time (s)
Equation y = a + b*x
Adj. R-Square 0.82907
Value Standard Error
Intercept -2.14283 0.03223
Slope 3.4831E-4 6.93146E-5
pH 4.0
Fig. S25: Change in absorption (A557) in 1(10 �M) when Hg
2+ ion (1:1 stoichiometry) added as a function of
time (s) in MeCN-H2O (1:1 v/v, PBS) at pH = 4.0.

SP16
0 200 400 600 800 1000
-2.2
-2.0
-1.8
-1.6
-1.4 (a)
pH4.0
ln (
A5
57)
Time (s)
Equation y = a + b*x
Adj. R-Square 0.98152
Value Standard Error
Intercept -2.09704 0.01893
Slope 9.47088E-4 3.4708E-5
0 200 400 600 800 1000
-3.2
-3.0
-2.8
-2.6
-2.4
ln (
A5
57)
Time (s)
Equation y = a + b*x
Adj. R-Square 0.98946
Value Standard Error
Intercept -3.18902 0.01273
Slope 8.463E-4 2.33344E-5
pH 7.0
(b)
0 200 400 600
-4.3
-4.2
-4.1
-4.0
-3.9
-3.8
(c)
pH10.0
ln (
A5
57)
Time (s)
Equation y = a + b*x
Adj. R-Square 0.96737
Value Standard Error
Intercept -4.24244 0.01399
Slope 5.93171E-4 3.43908E-5
500 1000 1500 2000 2500 3000 35000.0
0.1
0.2
0.3
0.4
0.5
pH 4.0
pH 7.0
pH 10.0
A557
Time (s)
(d)
Fig. S26: Determination of rate of first order kinetics between 2 (10 µM) and Hg2+
(1 eq.) in at (a) 4.0, (b)
7.0 and (c) 10.0 pH from linear regression of the plot of log(A-A0) as a function of time (s). λobs(abs)
= 557nm.
(d) Spectral profile of absorbance versus time (as given in Fig. 5b) for immediate reference.
550 600 650 700 750 800
0
1
2
3
4
5
6
7
1+Hg2++++
Flu
o. In
t.(a
rb. u
nits,
xE
6)
Wavelength(nm)
1+Hg2++++
1+Hg2++++
+I-
1+Hg2++++
+SCN-
1+Hg2++++
+AcO-
1+Hg2++++
+En
1+Hg2++++
+EDTA
1+Hg2++++
+AcO-
(b)
Fig. S27: Fluorescence spectra of saturated solution containing 1 (1 eq.) and Hg
2+ (5 eq.) upon addition of
anions and complexing reagents such as, SCN-, EDTA, En, I
-, acetate ion (12eq.) in MeCN-H2O (1:1v/v);
[1] = 1�M, λex = 500nm, RT, ex. and em. b p = 5nm.
SP17
550 600 650 700 750 800F
luo
. In
t. (
arb
. u
nits)
Wavelength(nm)
1
1+ X
1 +Hg2++++
+ X
1+Hg2++++
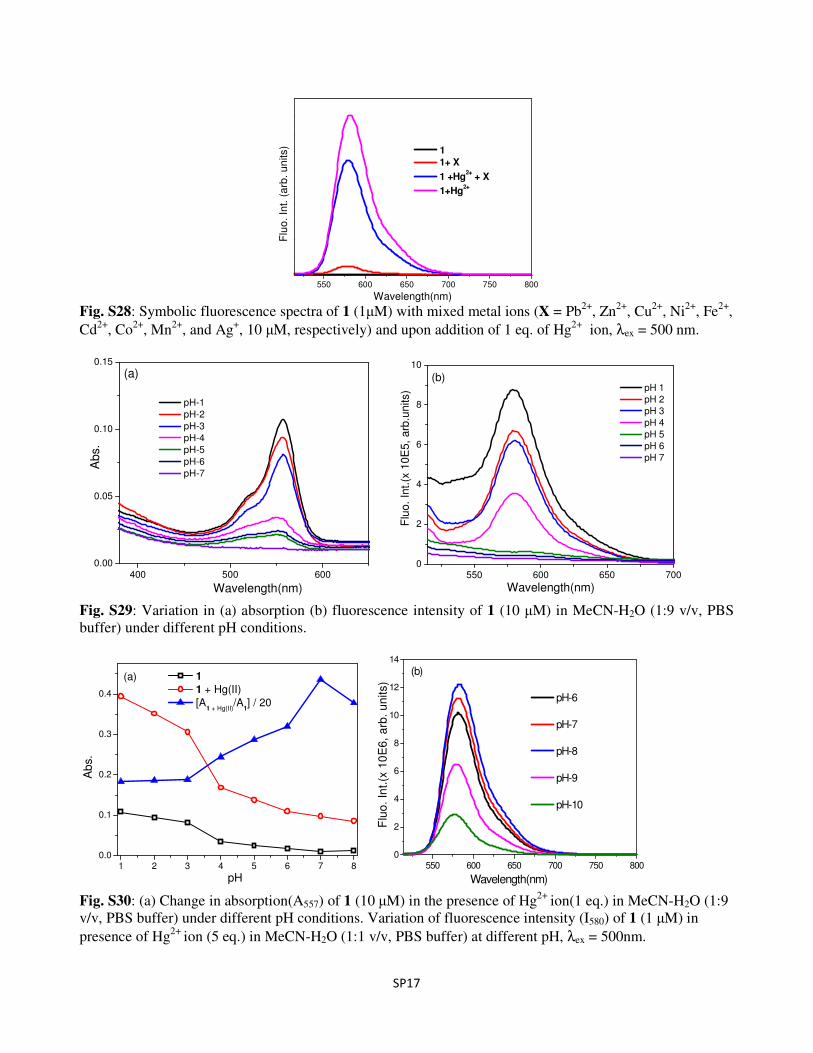
Fig. S28: Symbolic fluorescence spectra of 1 (1�M) with mixed metal ions (X = Pb
2+, Zn
2+, Cu
2+, Ni
2+, Fe
2+,
Cd2+
, Co2+
, Mn2+
, and Ag+, 10 �M, respectively) and upon addition of 1 eq. of Hg
2+ ion, λex = 500 nm.
400 500 6000.00
0.05
0.10
0.15
Abs.
Wavelength(nm)
pH-1
pH-2
pH-3
pH-4
pH-5
pH-6
pH-7
(a)
550 600 650 7000
2
4
6
8
10
Flu
o.
Int.
(x 1
0E
5,
arb
.units)
Wavelength(nm)
pH 1
pH 2
pH 3
pH 4
pH 5
pH 6
pH 7
(b)
Fig. S29: Variation in (a) absorption (b) fluorescence intensity of 1 (10 �M) in MeCN-H2O (1:9 v/v, PBS
buffer) under different pH conditions.
1 2 3 4 5 6 7 80.0
0.1
0.2
0.3
0.4
Ab
s.
pH
1
1 + Hg(II)
[A1 + Hg(II)
/A1] / 20
(a)
550 600 650 700 750 8000
2
4
6
8
10
12
14
Flu
o.
Int.
(x 1
0E
6,
arb
. u
nits)
Wavelength(nm)
pH-6
pH-7
pH-8
pH-9
pH-10
(b)
Fig. S30: (a) Change in absorption(A557) of 1 (10 �M) in the presence of Hg2+
ion(1 eq.) in MeCN-H2O (1:9
v/v, PBS buffer) under different pH conditions. Variation of fluorescence intensity (I580) of 1 (1 �M) in
presence of Hg2+
ion (5 eq.) in MeCN-H2O (1:1 v/v, PBS buffer) at different pH, λex = 500nm.

SP18
400 450 500 550 600 6500.00
0.01
0.02
0.03
pH 1
pH 2
pH 3
pH 4
pH 5
pH 6
pH 7
Ab
s.
Wavelength(nm)
(a)
550 600 650 7000
2
4
6
8
Flu
o.
Int.
(x 1
06,
arb
. u
nits
)
Wavelength(nm)
pH 1
pH 2
pH 3
pH 4
pH 5
pH 6
pH 7
(b)
Fig. S31: Variation in (a) absorption (b) fluorescence intensity of 2 (10 �M) in MeCN-H2O (1:9 v/v, PBS
buffer) under different pH conditions.
Fig. S32: Colorimetric mapping of (a) 1 alone, (b) 1+Hg
2+ and (c) 2+Hg
2+ in MeCN-H2O (1:9 v/v, PBS
buffer) under different pH (pH = 1-8) conditions. [1 or 2] = 10 �M.

SP19
N
O
O NN
OO
N
N
N O O
N
N
N
Hg2+
N
O
O NN
HN
N
OO
N
N
N
NH
N
Hg2+
1
2
Fig. S33: Proposed mechanism of Hg2+
coordination to 1 and 2.
Bio-imaging with 1 for Hg2+
detection in E. Coli
The biomass not treated with Hg2+
shows no fluorescence whereas treated biomass produced high
fluorescence of rhodamine implying the significance of quantification of Hg2+
in biological system. The
figure depicted below shows that Hg2+
could be possibly detected with even a low resolution fluorescence
microscope.
((((a) ((((b)
((((c) ((((d)
Fig. S34: Bright-field images of E. Coli alone (a) and after incubation with 1(b). Their fluorescence image
are on incubation with 1 before (c) and after (d) addition of Hg2+
ion, λex ≈ 500nm.