Embed Size (px)
Citation preview

Seattle Pacific UniversityDigital Commons @ SPU
Education Dissertations Education, School of
Fall February 4th, 2016
Spirituality and Happiness of English-SpeakingSouth African School Children: A PsychometricAnalysis of Spirituality and Well-Being InstrumentsDavid HartmanSeattle Pacific University
Follow this and additional works at: https://digitalcommons.spu.edu/soe_etd
Part of the Student Counseling and Personnel Services Commons
This Dissertation is brought to you for free and open access by the Education, School of at Digital Commons @ SPU. It has been accepted for inclusionin Education Dissertations by an authorized administrator of Digital Commons @ SPU.
Recommended CitationHartman, David, "Spirituality and Happiness of English-Speaking South African School Children: A Psychometric Analysis ofSpirituality and Well-Being Instruments" (2016). Education Dissertations. 9.https://digitalcommons.spu.edu/soe_etd/9

1
Spirituality and Happiness of English-Speaking South African School Children: A
Psychometric Analysis of Spirituality and Well-Being Instruments
Dissertation
David A. Hartman
Seattle Pacific University
School of Education
Committee Chair: Rick Eigenbrod, Ph.D.


CopyrightPage
Inpresentingthisdissertationinpartialfulfillmentoftherequirementsfor
theDoctoraldegreeatSeattlePacificUniversity,Iagreethatthelibraryshallmake
itscopiesfreelyavailableforinspection.Ifurtheragreethatextensivecopyingof
thisdissertationisallowableonlyforscholarlypurposes,consistentwith“fairuse”
asprescribedintheU.S.CopyrightLaw.Requestsforcopyingorreproductionofthis
dissertationmaybereferredtoUniversityMicrofilms,1490EisenhowerPlace,P.O.
Box975,AnnArbor,MI48106,towhomtheauthorhasgranted“therightto
reproduceandsell(a)copiesofthemanuscriptinmicrofilmand/or(b)printed
copiesofthemanuscriptfrommicrofilm.”
Signature ____________________________
Date ____________________________
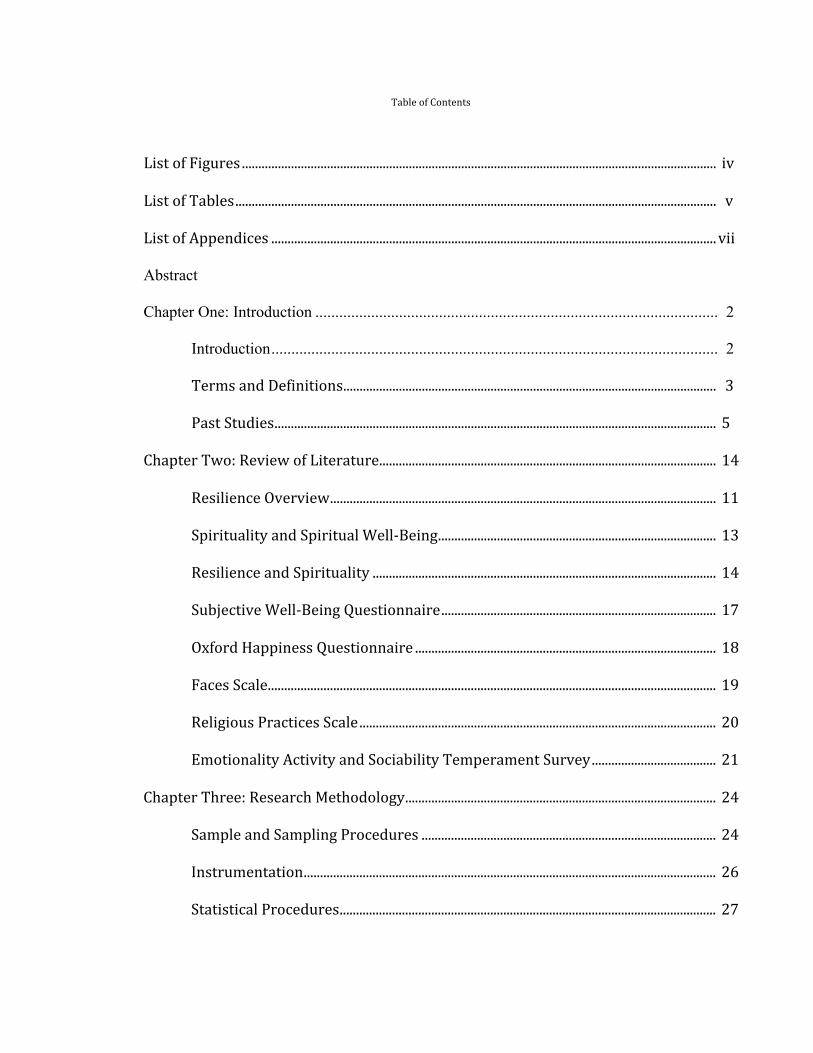
TableofContents
ListofFigures.................................................................................................................................................iv
ListofTables...................................................................................................................................................v
ListofAppendices........................................................................................................................................vii
Abstract
Chapter One: Introduction ..................................................................................................... 2
Introduction ................................................................................................................ 2
TermsandDefinitions..................................................................................................................3
PastStudies.......................................................................................................................................5
ChapterTwo:ReviewofLiterature.......................................................................................................14
ResilienceOverview......................................................................................................................11
SpiritualityandSpiritualWell-Being.....................................................................................13
ResilienceandSpirituality.........................................................................................................14
SubjectiveWell-BeingQuestionnaire....................................................................................17
OxfordHappinessQuestionnaire............................................................................................18
FacesScale.........................................................................................................................................19
ReligiousPracticesScale.............................................................................................................20
EmotionalityActivityandSociabilityTemperamentSurvey......................................21
ChapterThree:ResearchMethodology...............................................................................................24
SampleandSamplingProcedures..........................................................................................24
Instrumentation..............................................................................................................................26
StatisticalProcedures...................................................................................................................27

ii
ExplainingFactorialInvariance...............................................................................................29
Invariance..........................................................................................................................................31
ChapterFour:Results.................................................................................................................................35
AddressingNegativeSkew.........................................................................................................35
PsychometricAnalyses................................................................................................................42
ScaleComparisonsbyGender..................................................................................................48
HierarchalMultipleRegressions.............................................................................................50
InvarianceResults.........................................................................................................................51
ChapterFive:SummaryandDiscussion.............................................................................................57
Introduction.....................................................................................................................................57
ComparingResultswithExistingLiterature......................................................................58
GenderDifferences........................................................................................................................62
SpiritualityorJustTemperament?.........................................................................................65
ImplicationsforPractice.............................................................................................................65
ApplicationtoSouthAfricanEducationalContext..........................................................67
ApplicationtoSchoolCounselingPractice..........................................................................69
RecommendationsforFutureResearch...............................................................................70
References.......................................................................................................................................................74

iii
List of Tables
Table 1 Gender by School and Grade ...................................................................................... 25
Table 2 Descriptive Statistics for SWBQ ................................................................................. 36
Table 3 Descriptive Statistics – FACES, OHQ, SHS ............................................................... 38
Table 4 Descriptive Statistics for EAS ..................................................................................... 38
Table 5 Inter-Item Correlations - SHS ..................................................................................... 39
Table 6 Inter-Item Correlations - SWBQ ................................................................................. 40
Table 7 Inter-Item Correlations - SWBQ ................................................................................. 41
Table 8 Range of Inter-Item Correlations for Instruments ...................................................... 42
Table 9 Cronbach’s Alphas – Internal Consistency ................................................................. 43
Table 10 Indices of Sampling Adequacy .................................................................................. 43
Table 11 SWBQ Factor Inter-Correlation Matrix .................................................................... 46
Table 12 Rotated SWBQ Factor Matrix ................................................................................... 46
Table 13 OHQ Extracted Factor Loadings .............................................................................. 47
Table 14 SHS Extracted Factor Loadings ............................................................................... 47
Table 15 Correlations Between Factor Scores .................... Error! Bookmark not defined.52
Table 16 Hierarchal Regression Model Results ....................................................................... 54
Table 17 Fit Statistics for Gender Group Invariance Tests ..................................................... 56
Table 18 Comparison of Percentage Ratings – Faces Scale ................................................... 58

iv
List of Appendices
Table 1 Student Survey Instrument .......................................................................................... 90

Abstract
This study addresses the role of spirituality in student happiness among intermediate
elementary students. Surveys addressing temperament, spirituality, and happiness were
administered to a sample of South African students. There is a debate in the
developmental literature on whether the effects of spirituality on happiness can be
reduced to temperament in elementary school students. This study helps to establish the
psychometric properties of several instruments and looks for a unique contribution of
spirituality to happiness. The results indicate that most of the instruments used show good
psychometric qualities and that spirituality possesses a statistically significant impact on
happiness independent of temperament.

2
Chapter One: Introduction
Building on the earlier work of Holder, Coleman and Wallace (2010) and
Cleveland (2013), the topic of this paper is spirituality, happiness, and temperament in
intermediate elementary school children. This work is part of a larger endeavor known as
the “Happiness and Meaning-Making Project”, a data collection initiative aimed at
replicating and extending Holder et al.’s (2010) study. This study is an ex post facto
examination of the psychometric properties of several instruments and assesses for
differences in patterns of spirituality and happiness in public and private school students
in South Africa.
A child’s happiness and sense of well-being is linked to positive social, academic,
and interpersonal outcomes (Sink, 2014). Subjective well-being is a construct used to
measure a child’s sense of happiness as well as a partial measure of the presence of
resilience. Spirituality has been found to be a source of resilience, but what aspect of
resilience it influences needs further exploration to understand the spirituality and
resilience connection (Crawford, Wright, & Masten, 2006; Kim & Esquivel, 2011;
Masten, 2007). It is important to establish that resilience and the spirituality that has been
linked with is not an intra-individual trait, the effect of personality or temperament
(Holder et al., 2010). Replicating a study on the effects on happiness (via subjective
well-being) of temperament and spirituality adds support to this body of work. The goals
of this are study are 1) seek to validate the psychometric properties of instruments
measuring subjective well-being, spirituality, and temperament, 2) test the for varying
levels of measured attributes as well as invariance of the factor structures for boys and

3
girls, and 3) establish the unique contribution of spirituality over and above temperament
on student happiness.
Terms and Definitions
As this is a psychometric study addressing the attributes and interrelationships of
instruments attempting to measure vital constructs, the definitions of terms is necessarily
pragmatic. Terms such as spirituality, temperament, and happiness are isomorphic with
their measurement here. Any attempt to define these terms for purposes of this study is
largely redundant, as they are used solely as instruments intended to approximate their
respective constructs. However, a brief sketch of the terms follows to provide a general
context for the instruments in the study.
One major term that needs consideration for proceeding in this study is subjective
well-being. The growing research focus on resilience and strengths has generated the
concept of subjective well-being largely understood as cognitive appraisals of happiness
(Kashdan, 2004). Subjective well-being (and by association, happiness) is often
evidenced by factors of levels of global life satisfaction, the general absence of negative
emotions (anxiety, depression, etc.), and frequent, intense states of positive affect
(Robbins, Francis, & Edwards, 2010). Upon reviewing the literature on subjective well-
being, Cleveland (2013) offered a summative definition of subjective well-being as
“composed of a set of affective and cognitive appraisals evaluating and individual’s life”
(p. 11). Happiness appraisals such as the ones featured in this study fall within this
definition and offer a good proxy measure of subjective well-being.
One author described spirituality as a “glowing and useful term in search of a
meaning” (Bregman, 2006, p. 5). As a concept, it is fuzzy due to its multiple uses and

4
fields that coopt and attempt to define it. Spirituality and religion are pitted as opposing
phenomena in some literature and virtually identical in other writing (Pargament, 2013).
Bregman again noted that its popularity is due to the fact that spirituality is a “non-
contentious term somewhere between religion and scientific psychology” (p. 5). A full
review of the uses, meanings, and connotations of spirituality across all fields would be
interesting but ultimately unhelpful for the present study. To give the greater context of
how spirituality is defined across the context of school counseling research, readers
should consult the excellent overview in Sink and Hyun (2012) as well as Sink and
Devlin (2011). For purposes of this study, the helpful schema of three primary ways that
the relationship of spirituality and religion are understood from Sink and Hyun will be
mentioned here. Sink and Hyun noted that “spirituality is intrinsic to all persons and (a)
inextricably linked with religion; (b) a natural and nonreligious phenomenon; or (c)
psychologically constructed, reflecting both one’s personal and communal faith systems”
(p. 21). The instruments in this study inhere within the third, constructivist understanding
of spirituality, one that “suggests that spirituality is a concept broader than religion,
largely formulated through individual and social processes and influences, and associated
with enriching meaning-making activities” (Sink & Hyun, 2012, p. 22).
Temperament is a construct that is both written about and disagreed upon
extensively. Intimately related with the concept of personality, philosophers and
developmental psychologists alike have weighed in on the origin, influences, impacts,
and trajectory of temperament in humans (Rothbart & Derryberry, 2000). In her review
of four contemporary temperament researchers, Shiner (2012) noted some basic elements
of consensus on temperament’s definitional elements. In particular,
5
(1) temperament consists of individual differences in extraversion, negative
affectivity, and effortful control and is shaped by both genetic and environmental
factors, (2) temperament influences children’s experience of the environment, (3)
temperament interacts with experiences to shape important life outcomes, and (4)
although temperament shows stability, it can change both naturally and through
intervention. (Shiner, 2012, p. 1)
Buss and Plomin (1984), the creators of the measure used in this study to assess
temperament, defined temperament developmentally as “inherited personality traits
present in early childhood” (p. 84). Temperament emerges as a child matures to reflect
three definitional elements: emotionality, activity, and sociability. Emotionality refers to
a child’s tendency to become aroused or distressed; activity refers to all energy output
(vigor and tempo behavioral responses); and finally, sociability is defined as the seeking
out of others (Buss & Plomin, 1984).
Past Studies
Cleveland (2013) examined and demonstrated the psychometric properties of the
Faces Scale (Andrews & Withey, 1976), the Oxford Happiness Questionnaire-Short Form
([OHQ-SF] Hills & Argyle, 2002), the Subjective Happiness Scales ([SHS]
Lyubomirsky & Lepper, 1999), the Spiritual Well-Being Questionnaire ([SWBQ] Gomez
& Fisher, 2003), the Practices and Beliefs Scale – Behaviors ([PBS-B] Holder et al.,
2010), and the Emotionality, Activity and Sociability Temperament Survey ([EAS] Buss
& Plomin, 1984) outlined in Holder et al. (2010) with data from a sample of older
elementary students from US faith-based private schools. In this study, the results of
Cleveland’s (2013) exploratory factor analyses will be extended by examining a sample

6
of South African school students (English is language of learning). Instruments included
in this analysis will include the Faces Scale (Andrews & Withey, 1976), the Oxford
Happiness Questionnaire Short Form (OHQ; Hills & Argyle, 2002), the Subjective
Happiness Scales (SHS; Lyubomirsky & Lepper, 1999), the Spiritual Well-Being
Questionnaire (SWBQ; Gomez & Fisher, 2003), the Religious Practices and Beliefs Scale
(PBS-B) based on the Brief Multidimensional Measurement of Religiousness/Spirituality
(BMMRS; Fetzer Institute, 1999), and the Emotionality, Activity, and Sociability
Temperament Survey (EAS; Buss & Plomin, 1984). Exploratory factor analyses for each
instrument will be run for the full sample of public and private school students to
establish reliability and factorial validity of the instruments. As a follow up,
confirmatory factor analyses will be run to assess the consistency of the factor structures
across male and female students. Where applicable, factorial invariance will be assessed
at incrementally more stringent levels across gender groups. Based on earlier work, it is
theorized that girls will demonstrate higher levels of some forms of spiritual practices
than boys (Seo, Sink, & Cho, 2011; Sink, Kim, Park, & Hyun, 2014). Finally, hierarchal
linear regression models will be run to assess the independent contribution of religious
and spiritual beliefs and practices on their happiness. These analyses will be performed to
answer the following research questions:
1. Are the instruments psychometrically sound [reliability, factorial validity –
Exploratory Factor Analysis (EFA)]
2. Do the overall scale scores differ by gender, and if so, how [Multiple Analysis of
Variance (MANOVA)]?

7
3. Does the factor structure appear the same among boys and girls [Confirmatory
Factor Analysis (CFA), factorial invariance]?
4. After controlling for temperament, do children’s spiritual and religious practices
predict their happiness [Hierarchal Multiple Regression (HMR)]?

8
Chapter Two: Literature Review While academic learning is still firmly in the education spotlight with
contemporary debates about Common Core standards and testing, there is another
growing force in education. Social-emotional learning competence has been cited
anecdotally over the years as lacking in many K-12 students, and a 2014 survey of US
teachers’ perceptions confirms this with empirical data (Scholastic and the Bill &
Melinda Gates Foundation, 2014). There is an interest both domestically and abroad for
schools to foster children’s well-being and social-emotional learning (SEL) competence
(Farrington et al., 2012; Payton et al., 2008). Educators are making vital connections
between students’ well-being and social-emotional competences and their ability to learn
in the classroom (Scholastic and the Bill & Melinda Gates Foundation, 2014). Social
emotional learning training in schools utilizes strengths-based school-wide programs like
Response to Intervention (RTI; American Institiutes for Research National Center on
Response to Intervention, 2014) and Positive Behavioral Interventions and Supports
(PBIS; US Department of Education’s Office of Special Education Programs, 2014).
Approaches like PBIS and RTI can help lessen risk factors linked to school failure and
help increase positive adjustment and emotions (Elbertson, Brackett, & Weissberg,
2009).
Subjective well-being (SWB) involves emotional and cognitive appraisals of
happiness, and happiness and its measurement construct (SWB) are considered important
to child development in the SEL and positive psychology literature (Holder, Coleman, &
Singh, 2012; Kashdan, 2004; Nelson & Lyubomirsky, 2014). Subjective well-being is
multifaceted and complex in its full complement. Well-being can pertain to political,

9
communal, and economic factors (King, Reno, & Novo, 2014). Subjective well-being is
“subjective” in the sense that it looks at well being from the self-perceptions, and in this
way it is related to happiness (if a person perceives him or herself as doing well, they can
be construed as happy) (Diener, 2000; Kashdan, 2004). Subjective well-being (and by
extension happiness) is commonly assessed by examining the following three domains:
the overall absence of negative feelings (such as anxiety, depression), levels of global life
satisfaction, and the frequency/intensity of experiencing states of positive affect (Argyle
& Crossland, 1987; Kashdan, 2004; Robbins, Francis, & Edwards, 2010). Resilience,
which pertains to protective factors that permit healthy functioning even amidst
challenging circumstances, can be said to exist based on limited fluctuations of SWB.
South African Context
Authors that are part of the Happiness and Meaning-Making Project, of which this
study and its analyses are a part, have examined the links between spirituality and
subjective well-being in elementary students in American (Cleveland, 2014) and Korean
(Sink et al., 2014) students. One of the key features of the Happiness and Meaning-
Making Project is to assess this link, but of similar importance is to see how the
relationship between spirituality and subjective well-being vary by national context.
Hence, it is important to review what is known about spirituality, well-being, and the
broader educational context in South Africa.
South Africans consistently report high levels of well-being (Møller, 2013).
Perhaps more so than what is typically thought of traditional Western societies, South
Africans draw a strong connection between social interaction and their perceived SWB
(Westway, Olorunju, & Rai, 2007). This emphasis on community involvement is

10
ubiquitous in South Africa, and it is thought of as essential for ongoing SWB or
happiness. Transcending the individual level, this “public happiness” (Roodt, 2014)
resides in the society as a whole, benefiting individuals’ sense of SWB via the collective.
Møller (2013) noted that despite South Africans generally reporting high levels of SWB,
they often also report contrasting low levels of hope that the future contains opportunities
to grow and flourish. What then causes the high levels of reported SWB in the face of
pessimistic views of the future? While temperament and personality have been
investigated for their contribution to predicting SWB (DeNeve & Cooper, 1998), the
explanation is far from complete. The results of this study will contribute to existing
work to see what role spirituality may serve in explaining additional variance in SWB for
South African schoolchildren.
South Africa is religiously diverse with widespread acceptance of the fact that
spirituality is an essential aspect of existence (Mnyaka & Motlhabi, 2005). To illustrate
this, Ubuntu ngumntu ngabantu is advanced as a common way of seeing life in South
Africa. Ubuntu maintains that everything is spiritual and sacred, and that each person is
therefore spiritually connected (Mnyaka & Motlhabi, 2005; Tutu, 1999). The dualism
between the sacred and the secular is not recognized in the Ubuntu concept. While
Ubuntu is difficult to define (even by South Africans), but it involves “the most important
quality of a human being, which transcends the surface to the very essence of a person
and how people relate with each other in community” (Sink, Blackshire, Osterdahl, &
Hartman, 2015). Individual motivation to pursue each person’s ultimate potential is
motivated by the collective benefit in Ubuntu (Mnyaka & Motlhabi, 2005), and Tutu
(1999) noted that a popular synopsis of Ubuntu is “I am because we are.”

11
In a post-apartheid setting, South Africa has not settled on an approach to
addressing spirituality in education. Children are culturally and religiously diverse
(Christianity, 68%; Indigenous beliefs, 28%; Islam, 2%; and Hinduism, 2%; “South
Africa: Country Review,” 2015), lending credence to a non-denominational spirituality
approach. Some authors (e.g., Jacobs, 2012) noted, in the spirit of Ubuntu, that
spirituality should be retained in education in a manner that serves all. Roux (2007)
suggested a social constructivist approach to addressing spirituality in education.
Children under this approach would be motivated to understand themselves and others
and to explore different religions, arriving at their own spiritual conclusions (Roux,
2007). This study can aid South African educators by illustrating the potential impact that
developing non-denominational spirituality can have on students’ sense of SWB.
Resilience Overview
Resilience is a construct that is used by multiple disciplines and across many
different layers of research focus (Masten, 2011). Due to the disciplinary range of
projects examining resilience, the construct has been variously and sometimes
ambiguously defined (Barber, 2013). Resilience as a construct emerged as an outgrowth
of von Bertalanffy’s (1968) general systems theory. Bronfenbrenner’s (1979) ecological
theory of human development was foundational to the systemic focus and evolution of
the definition of resilience.
The definition of resilience has seen various expansions and contractions over the
past four decades (Masten, 2011). Initially, researchers characterized resilience as an
inferential construct with a focus on two essential components: 1) positive adaptation by
a person to a 2) risk or threat (Luthar & Ciccehetti, 2000; Masten & Coatsworth, 1998).

12
Early research was largely descriptive and focused on measuring the two aforementioned
aspects, looking for idiosyncratic intrapersonal qualities of “resilient” people, and also
describing their relational contexts in attempts to isolate differences in adaptation to
adversity (Masten, 2011). Gradually, resilience research moved to a more dynamic,
process-oriented criteria (Luther & Ciccheti, 2000; Masten, Best, & Garmezy, 1990).
This move toward dynamism and process orientation was required to achieve integration
in defining the resilience construct. Multiple disciplines conduct studies across myriad
levels and types of systems and without an integrated definition, resilience was in
jeopardy of becoming untenable as a concept (Masten, 2011).
Due to the current state of the field, then, any credible definition of resilience
must pay credence to “integrated constructs and the shared context of dynamic systems
theory” (Masten, 2011, p. 494). Masten (2011), as one of the most significant
contributors to the field of resilience research, recently offered the following definition:
“The capacity of a dynamic system to withstand or recover from significant challenges
that threaten its stability, viability, or development” (p. 494). While many of the sources
consulted for this study discussed the problems in defining the construct of resilience
(Barber, 2013; Bornstein, Hahn, & Suwalsky, 2013; Jones, 2012), very few attempted
such a concise definition and instead focused on laying out various components of the
construct. Masten’s (2011) definition captures what is most essential across the bulk of
the research examined.
A recent summary of resilience research (Ungar, Ghazinour, & Richter, 2013)
noted that the majority of studies are dominated by a systems approach. This is true
regardless of whether the unit of analysis is an individual person or a swath of their larger

13
social ecology (Ungar et al., 2013). The origin of this focus can be traced back to von
Bertalanffy’s (1968) general systems theory (Masten, 2011). However, von Bertalanffy’s
work was adapted for human development by Bronfenbrenner throughout the 1970s
(Bronfenbrenner, 1974; Bronfenbrenner, 1976; Bronfenbrenner, 1977) culminating in the
landmark book, The Ecology of Human Development (Bronfenbrenner, 1979).
Bronfenbrenner’s theory has expanded subsequently, with the final exposition of his
theory published posthumously (Bronfenbrenner & Morris, 2006). The final adaptation of
Bronfenbrenner’s theory culminated in what is credited as the most comprehensive
account of contextual influences on human development, bio-psycho-social-ecological
systems theory (Berk, 2006).
Spirituality and Spiritual Well-Being
Spirituality and religion have been found to be resilience factors offering potential
protective elements at the individual, family, and community levels like other resilience
elements (Kim & Esquivel, 2011). While various theorists define religion and spirituality
as constructs that are separate or overlapping to various degrees (see Sink & Hyun,
2012), the definition in this analysis is embedded in the administered instruments. For
instance, Gomez and Fisher (2003) utilized a non-religious conceptualization of
spirituality as the backbone the Spiritual Well-being Questionnaire (SWBQ). This
definition reflects a spirituality that is “the affirmation of life in a relationship with God,
self, community and environment that nurtures and celebrates wholeness” (National
Interfaith Coalition on Aging [NICA], 1975, p. xiii). Bregman (2006) described
spirituality as a “glowing and useful term in search of meaning” (p. 5); this paper only

14
takes up the meaning of spirituality from a pragmatic perspective, as it is used in the
instruments measuring spirituality.
In the age cohort studied here, it is anticipated that there may be statistically
significant gender differences in ratings of spirituality and happiness. Based on findings
from previous studies (Sink & Hartman, 2014; Sink et al., 2014), it is anticipated that
girls of this age cohort will rate themselves more highly on measures of happiness and
spirituality. While the previous studies examined students in differing cultural contexts,
the results were consistent across them and used the same survey instruments used in this
study.
Resilience and Spirituality
The field of resilience research has long considered and validated religion and
spirituality as factors associated with resilience (Werner, 1984). As Dillen (2012) noted,
“Resilience can be seen as a specific form of agency possessed by children, although it is
at the same time highly influenced by other conditions of the ecological context of
children (e.g., family, church, society, culture, etc.)” (p. 62). Accordingly, researchers
distilled spiritual and religious protective aspects at each of these ecological levels
(Crawford et al., 2006). A contemporary definition of resilience (see above) is used in
this study that includes, but does not limit, the protective aspects of religiosity and
spirituality to some innate or even individualized characteristics. The resilience afforded
by spirituality and religiosity, in that spirituality has to do with meaning making and
meaning is typically bound up in relationships, must be viewed from an
ecological/systems perspective. Despite the fact that the unit of analysis for this study is
15
individual students, it would be misguided to conflate the unit of analysis with the
location of the potential protective effects of religiosity and spirituality.
While spirituality and religiosity are frequently identified as resilience factors, it
is important to examine the theorized mechanisms inherent in spirituality and religiosity
that make them so. Crawford et al. (2006) theorize four ways spirituality and religiosity
may enhance resilience: attachment relationships, general social support, guidelines for
conduct and moral values, and personal growth and development. Crawford et al. also
cite human adaptational systems that seem to facilitate adaptation (and hence, resilience):
“attachment, self-regulation, motivation for learning and engaging successfully with the
environment, beliefs that life has meaning and hope, a sense of belonging, opportunities
to learn from prosocial peers and adults, social support, and the benefits afforded by
social order and cohesion” (p. 357). The four ways that Crawford et al. proposed that
religion and spirituality can enhance resilience are clearly seen in these adaptational
systems.
Smith (2003) also proposed a framework of causal factors by which religion (and
by extension some forms of spirituality) may promote prosocial outcomes. Religion “may
exert positive, constructive influences in the lives of American youth through nine
distinct but connected and potentially reinforcing factors” (Smith, 2003; p. 19). These
nine factors are grouped in threes under three subheadings: moral order, learned
competencies, and social/organizational ties. Below is a list of Smith’s (2003) factors:
I. Moral Order
1. Moral directives 2. Spiritual experiences

16
3. Role models
II. Learned Competencies
4. Community and leadership skills 5. Coping skills 6. Cultural capital
III. Social and Organizational Ties
7. Social capital 8. Network closure 9. Extra-community links
Qualitative analysis of mechanisms by which spirituality is seen by adolescents as
promoting resilience overlap quite well with the factors or mechanisms promoted by
Crawford et al. (2006) and Smith (2003). Raftopoulos and Bates (2011) performed in-
depth interviews with adolescents about the role spirituality played in their lives. The
interview data were analyzed to isolate dimensions of spirituality reflected in the
adolescents’ statements. The authors further questioned how these dimensions fostered
resilience. The three dimensions of spirituality the authors isolated were: a
transcendental perspective (i.e., a relationship with God or a higher power), a sense of
meaning, and a connection with the inner self. Raftopolous and Bates (2011) found that
these dimensions of spirituality promoted resilience by equipping the adolescents with
“1) a sense of protection, 2) a sense of meaning, coherence, and optimism; and 3) the
opportunity for increased self-awareness and self-efficacy” (p. 151).
Subjective Well-Being Questionnaire
17
Intended to measure spiritual well-being, the Spiritual Well-Being Questionnaire
(SWBQ) comprised of twenty questions representing four different spiritual domains.
The four domains theorized to be assessed in the SWBQ are personal, environmental,
communal, and transcendental, according to the original SWBQ study by Gomez and
Fisher (2003). Gomez and Fisher (2003: 2005: 2005b) and others demonstrated good
internal consistency (α = .76 to .94) both for the subscales and the entire instrument
(American Psychological Association, 2013; Cleveland, 2013; Rowold, 2011; Sink et al.,
2014). Cleveland (2013) found the measure to have good validity, both with children and
adolescents (Moodley, Esterhuyse, & Beukes, 2012). Researchers have established both
construct validity (using factor analysis – Gomez & Fisher, 2003; 2005b) and
discriminant validity (Sink et al., in press; Rowold, 2011) of the SWBQ. The SWBQ has
been held up as promising in a recent review of spirituality measures (de Jager
Meezenbroek et al., 2012). However, de Jager Meezenbroek et al. (2012) also encourage
caution regarding the validity and some items of the SWBQ, noting a need for greater
breadth in samples used to assess the SWBQ.
Gomez and Fisher (2003; 2005a; 2005b) established the SWBQ through a
rigorous psychometric process. In their initial study, Gomez and Fisher (2003) piloted a
64-item version of the SWBQ with samples of 248 Australian secondary school students
(age range 11-16 years; M = 13.8, SD = 1.33) from public, Catholic, Christian
Community, and other independent schools. Using exploratory factor analysis (EFA)
with principal components analysis (PCA) and Oblimin rotation, Gomez and Fisher
(2003) found a four-factor solution. The authors retained the five highest loadings on the
four factors, rendering twenty questions of the present SWBQ (Gomez & Fisher, 2003).

18
Subsequently, Gomez and Fisher (2003) established the presence of a second-order
spiritual well-being dimension (which they did not reestablish in subsequent work – see
2005a; 2005b) over the four subscales through PCA and a follow up confirmatory factor
analysis (CFA).
Oxford Happiness Questionnaire – Short Form
The Oxford Happiness Questionnaire – Short Form (OHQ-SF; Hills & Argyle,
2002) is derivative of the full Oxford Happiness Questionnaire (OHQ; Hills & Argyle,
2002), which is in turn based on the Oxford Happiness Inventory (Argyle, Martine, &
Crossland, 1989). The full OHQ contains 29 items scored on a six-point Likert scale,
while the OHQ-SF condenses the measures down to eight items. The OHQ has been
tested on more diverse age groups and cultural backgrounds proving both reliable and
valid across varied samples (Aghili & Kumar, 2008; Hadinezhad & Zaree, 2009; Rezvan,
Ahmadi, & Abedi, 2006; Robbins, Francis, & Edwards, 2008; Robbins, Francis, &
Edwards, 2010; Singh, 2009). The OHQ has also shown useful in studies addressing
happiness and religion/spirituality (Abdel-Khalek & Lester, 2012; Halama, Martos, &
Adamovová, 2010). Cruise, Lewis, and McGukin (2006) upheld the internal consistency
of the OHQ-SF. Using a small sample, the OHQ-SF showed good test-retest reliability (r
= .69), with no statistically significant differences in means scores. Cleveland (2014) and
Sink et al. (2014) also demonstrated good internal consistency (α = .79 & .81,
respectively) and unidimensionality when subjecting the OHQ-SF to exploratory factor
analysis. Detractors of the OHQ-SF argue that its measures are more related to
psychological well-being than subjective well-being (Lewis, Maltby, & Day, 2005). In

19
sum, while the OHQ-SF shows promise and is simpler to administer (particularly for
younger samples), more work is needed to establish its psychometric properties.
Subjective Happiness Scale
The unidimensional Subjective Happiness Scale (SHS) is four-item scale
measuring global subjective happiness (Lyubomirsky & Lepper, 1999). Initially put
forward as thirteen items, the developers ran a PCA on a sample of college students
(N=97) and identified one interpretable factor with four items loading onto it
(Lyubomirsky & Lepper, 1999). These four items were put forward as a composite
measure of SWB. The developers indicated that the SHS demonstrated good internal
consistency (Cronbach’s alphas from .79 to .94). Test-retest reliability was also good at
one month, three month, and one year follow up administrations (r = .85, .61, .55,
respectively) (Lyubomirsky & Lepper, 1999b). Various related instruments were used
and successfully demonstrated convergent, factorial, and discriminant validities of the
SHS (Lyubomirsky & Lepper, 1999b; Mattei & Schaefer, 2004). Cleveland (2014)
performed an EFA with a sample of almost 500 third to sixth graders, and the fourth item
of the SHS (“I want to be happier”) failed to load above .12 on the single generated
factor. Removing the fourth item and retaining the first three also improved the
Cronbach’s alpha from .60 to .75. Given the similar ages of the present sample, it will be
important to establish the performance of this fourth item.
Faces Scales
The Faces Scale is a single item that measures general levels of happiness, and it
was created by Andrews and Withey (1976). Respondents are asked “How do you usually
feel?” The response format of the Faces Scale involves seven drawings of faces

20
depicting a successive range of emotions from “very unhappy” (represented by a down-
turned mouth) to “very happy” (represented by an upward-turned mouth). The middle
face is “neutral”, and it is represented by face with a straight-line mouth. To lessen
ambiguity and increase response consistency for child respondents, the number of faces
was reduced to five. The Faces Scale has been shown useful with children (Holder &
Klassen, 2010; MacDonald, Kirkpatrick, & Sullivan, 1996), but its overall reliability with
children is not rigorously established (Cleveland, 2013).
Religious Practices Scale
The Religious Practices Scales (RPS) is derived from multiple sources. The three
items in this scale originally appeared as items on the Brief Multidimensional
Measurement of Religiousness/Spirituality (BMMRS; Fetzer Institute/NIA, 1999). A
working group formed in 1997, a collaboration between National Institute on Aging
(NIA) and the Fetzer Institute, was tasked with examining possible impacts of
religiousness on health outcomes. This working group took on a task of creating a brief,
multidimensional measure of traditional religiousness and non-institutional spirituality
and the scales were intended to be able to used separately to measure sub-aspects of
religiousness/spirituality (Idler et al., 2003). The BMMRS resulted in 38 items organized
by religious and spiritual dimensions (Fetzer/NIA, 1999).
Holder et al. (2010) developed the Practices and Beliefs Scale (PBS) for a study
of the relationship between children’s spirituality, happiness, and religiousness. Holder
et al. (2010) eliminated BMMRS items that were deemed developmentally inappropriate
for children aged 8-12. Of the eleven remaining BMMRS items that composed the PBS,
Holder et al. (2010) modified the wording of the items to make them interpretable to

21
children aged 8-12. The PBS items assessed children’s belief in a higher power (4
items), global perception of religiousness/spirituality (1 item), practice of
religious/spiritual beliefs (3 items), and the role of spirituality in helping the children
cope in everyday life (3 items) (Holder et al., 2010). Cleveland (2014) appropriated one
domain of the PBS, the domain focused on how children practiced (or did not practice)
their beliefs. Sink et al. (2014) utilized the SWBQ, an overall good measure of children’s
spirituality, but modified the PBS subscale into the RPS to ensure that religiousness was
also captured. In modifying the three RPS items, Sink et al. (2014) reduced the 7-point
Likert response scale of the BMMRS and PBS to a 5-point Likert scale (ranging from
strongly disagree to strongly agree) to help aid score consistency with child respondents.
Emotionality Activity and Sociability Temperament Survey
The Emotionality Activity and Sociability Temperament Survey (EAS) was
developed by Buss and Plomin (1984). The twenty-item EAS assesses four proposed
dimensions of temperament (Emotionality, Activity, Shyness, and Sociability), with each
dimension theoretically measured by five items. The EAS theoretically yields a global
temperament score in addition to the four subscale scores (Buss & Plomin, 1984). The
EAS was created to be a brief, parent-generated report of their children’s temperament. It
has typically demonstrated good reliability and validity (Holder & Klassen, 2010; Masi et
al., 2003).
However, the factor structure and the composition of the proposed dimensions has
been debated across the last 40 years leading to several iterations of the scale by Buss and
Plomin (Cleveland, 2013). The initial four dimensions of temperament Buss and Plomin
(1975) proposed were Emotionality, Activity, Sociablity, and Impulsivity. The original

22
instrument was consequently named the EASI (Emotionality, Activity, Sociablity, and
Impulsivity), but the authors found high intercorrelations between items on Activity and
Impulsivity scales, and the Emotionality and Impulsivity scales (Windle, 1989). Altering
items on both the Emotionality & Activity scales, Buss and Plomin modified the EASI
and coined the new version the EASI-II (Windle, 1989). The Impulsivity scale did not
reliably feature in a host of subsequent factor analyses in the developmental literature,
leading Buss and Plomin to remove the Impulsivity scale from the EASI-II (Boer &
Westenberg, 1994; Rothbart & Bates, 1998). There was also an EASI-III (Nærde,
Røysamb, & Tambs, 2004).
In conjunction with the development of another childhood temperament measure,
the Colorado Childhood Temperament Inventory (CCTI; Rowe & Plomin, 1977), the
EASI-II, now reduced to three scales, underwent further revision (Routhbart & Bates,
1998). Based on the CCTI results, Buss and Plomin modified the items measuring the
Emotionality, Activity, and Sociability dimensions; the revised version was simply
referred to as the EAS (Routhbart & Bates, 1998).
The next wave of modifications centered on inconsistent results and
conceptualization of Sociability. Buss and Plomin (1986) noted that initially Sociability
and Shyness were thought to be the opposing poles of a single dimension. However, the
results of CCTI empirical analyses support a case for their conceptual distinctiveness
(Cheek & Buss, 1981). Under this updated conceptualization, “Shyness was considered a
tendency to be inhibited with people unfamiliar to the individual, while Sociability was
defined as tendency to prefer the company of other people” (Clevaland, 2013; p. 31).
The resulting current version (still retaining the acronym EAS) measures four dimensions

23
(Emotionality, Activity, Shyness, and Sociability), but the Sociability items are still
considered to be experimental (Boer & Westenberg, 1994; Mathiesen & Tambs, 1999).
The EAS demonstrated good reliability and validity across gender, age, and
culture (Boer & Westernberg, 1994; Masi et al., 2003; Cleveland, 2013). Cronnbach’s
alpha values reflect variation but appear consistently in the acceptable to strong range
across studies (Boer & Westenberg, 1994; Bould, Joinson, Sterne, & Araya, 2013;
Mathiesen & Tambs, 1999). However, Sociability and Shyness tend to not behave
predictably across studies. Boer and Westenberg’s (1994) results bolster Buss & Plomin’s
(1984) idea of a three-factor structure of temperament, as Sociability items distributed
across Activity and Shyness dimensions. Researchers often test a three-factor and a four-
factor (adding Sociability) model; sometimes a fourth factors is viable and sometimes it
is not (Boer & Westenberg, 1994; Boström, Broberg, & Hwang, 2010; Mathiesen &
Tambs, 1999). The age of the child is apparently related to the emerging factor
structure/dimensionality of the EAS in EFA studies; Sociability and Shyness may be
indistinguishable in children in infancy to around five years of age (Boer & Westenberg,
1994; Boström et al., 2010; Mathiesen & Tambs, 1999). Factor structures have ranged
from three to five factors (Activity, Sociability, and three subdimensions of Emotionality:
Anger, Distress, & Fearfulness; Nærde et al., 2004). These results point to the need for
further psychometric development of the EAS, particularly as it pertains to understanding
the social aspects of children’s temperament.

24
Chapter Three: Research Methodology
As referenced in the first chapter, the goals of this are study are to 1) seek to
validate the psychometric properties of instruments measuring subjective well-being,
spirituality, and temperament, 2) test the for varying levels of measured attributes as well
as invariance of the factor structures for boys and girls, and 3) establish the unique
contribution of spirituality over and above temperament on student happiness. To
address these goals, the analysis below will answer four related research questions:
1. Are the instruments psychometrically sound?
2. Do the overall scale scores differ by gender, and if so, how?
3. Does the factor structure appear the same among boys and girls?
4. After controlling for temperament, do children’s spiritual and religious practices predict their happiness?
To answer the first question, the data are subjected to exploratory factor analysis (EFA).
Multiple analysis of variance (MANOVA) and analysis of variance (ANOVA) are used
to address the second research question. Confirmatory factor analysis (CFA) is used to
address the third question. Finally, the third question is addressed by a sequence of
hierarchal regression models (HRM).
Sample and Sampling Procedures
As a background, the dataset gathered is part of a larger study called the
Happiness and Meaning-Making Project (hereafter HP). Targeting children in later
elementary school grades, the HP examines the relationships between children’s spiritual
wellbeing, temperament, and their sense of happiness. The HP has collected data on
children from several countries, and its sampling strategy is both purposeful and
convenient, as it involves assessing children within both public (state-funded) and

25
private, faith-based school settings. Classroom teachers administer the survey
instruments to their classes, and teachers also assess student temperament and subjective
happiness for triangulation.
The data for this study involve intermediate elementary students (grades 3-6) and
their classroom teachers from four elementary schools in South Africa. Three of the
schools were faith based (Christian; designated Elementary Schools 1, 3, and 4 below)
and one was not faith based (School 2). All of these schools featured English as their
language of learning. Students ranged in age from 8 to 16 (only 3 students were over the
age of 14). The total number of students was 883. In terms of gender, 48% of the sample
identified as male, and 52% identified as female. By grade level, 31% of the respondents
were in 3rd grade, 27% in 4th grade, 25% in 5th grade, and 17% in 6th grade (See Table 1).
Table 1
Gender by School and Grade Grade
3 4 5 6
Elementary School 1 Male 20 24 13 6 Female 23 11 10 9 Total 116 Elementary School 2 Male 23
6
Female 33
17 Total 79 Elementary School 3 Male 75 89 63 45 Female 72 77 73 63 Total 557 Elementary School 4 Male 11 18 14 13 Female 14 19 19 17 Total 125

26
Instrumentation
A thorough review of the instruments, including their extant psychometric
evidence, was featured in the previous chapter. As such, it will not be repeated here. Part
of the psychometric validation in this study tests not only the included instruments but
also revisions made to make them more developmentally appropriate for elementary
students. The EAS, SWBQ, and RPS featured rephrasing (third-person perspective was
changed to first person; phrasing was made more simplistic and literal). Additionally,
student response presentation was made uniform, with students making circles around
numbers on Likert scales for each instrument. There are three constructs salient to this
analysis - happiness, spirituality, and temperament. For happiness, the Faces Scale
(Andrews & Withey, 1976), SHS (Lyubomirsky & Lepper, 1999), and OHQ-SF (Hills &
Argyle, 2002) were used. To measure temperament, the EAS (Buss & Plomin, 1984) was
used. Finally, to assess spirituality, the SWBQ (Gomez & Fisher, 2003) was used and it
was supplemented with the RPS (Sink et al., 2014) to capture elements of traditional
religious spirituality.
Survey Procedure
Students were able to opt out of completing the survey packet at any time. No
students opted out of attempting the survey. All surveys were administered and
completed in the students’ classrooms. Teachers oversaw the administration and
collection of the surveys; no members of the Happiness Project research team were
involved. In the course of one class period, students completed the EAS, RPS, OHQ-SF,
SWBQ, and the Faces Scale. Additionally, the students’ classroom teachers completed

27
the EAS and Faces Scale for each participating student. This differs from Holder et al.
(2010), as they had the students’ parent(s) fill out these two items. The decision to
include teacher input was driven by the possibility that younger children might only
reflect school behaviors in their answers, making the teachers’ perspective possibly align
more meaningfully. Gender, age, and grade level were the primary demographic
characteristics collected.
Statistical Procedures
Data screening. The data were screened for patterned missing data and irregular
response patterns. Given that teachers oversaw administration the missing data were (a)
less than 5% and (b) apparently non-systematic. Those students with missing data were
dropped from subsequent analyses if they lacked complete data on the relevant
instrument. Data were examined for parametric assumptions relevant to suitability for
factor analysis (Fabrigar & Wegener, 2012; Pett, Lackey & Sullivan, 2003). Mean,
standard deviation, skewness/kurtosis (both numerical and graphical methods were
utilized) to ensure data were reasonably well suited for factor analysis. Additionally,
inter-item correlation matrices and statistics were assessed prior to conducting EFAs.
Hierarchal multiple regression. Based on the general linear model, hierarchal
multiple regression (HMR) enters predictor variables in blocks. Field (2013)
recommended that researchers begin with blocks of predictors that have been established
in the research or are theoretically valid for inclusion. Researchers will enter the primary
experimental variables of interest in subsequent blocks. The objective of HMR is to
isolate and examine the impact of one set of variables and seeing if adding another set
increases the predictive ability (in terms of variance explained) of the model (Field,

28
2013). The difference in R2 between each block is examined to see if there is a
significant increase in the amount of variance explained. This method is helpful for
studies such as this where arguments exist that the effects of spirituality can really be
reduced to temperament in children.
Exploratory factor analyses. The dimensionality of the instruments was
established using EFA. Many of these feature principal components analysis (PCA) and
orthogonal rotation of the factors. This choice may be justified on the grounds of
simplicity as Costello & Osborne (2005) pointed out that these are the default option in
SPSS, a popular statistical software package. However, it is methodologically less
appropriate. Principal components analysis, by its nature, is not designed for isolating
meaningful underlying constructs in groups of variables, but condensing large amounts of
variables into smaller components (Fabrigar & Wegener, 2012; Mvududu & Sink, 2012).
Principal axis factoring (PAF) is considered optimal, as the study involves identification
of meaningful latent constructs, there is likely some measurement error (rendering PCA’s
assumption of no unique variances), and there is some likely overlap in the factor
constructs (Field, 2013; Pett et al., 2003). Also, this study used oblique factor rotation to
allow for correlation between factors (Field, 2013; Mvududu & Sink, 2013; Pett et al.,
2003).
The decision to retain factors was supported by a variety of indicators.
Traditional indicators such as eigenvalues and scree plots were considered. However,
given the relative importance of retaining factors to the overall EFA results (Hayton,
Allen, & Scarpello, 2004), parallel analysis was utilized as it is generally recognized as
superior to the “Kaiser rule” (retain factors with eigenvalues greater than one (Kaiser,

29
1960) or Cattell’s (1966) scree plot test. Parallel analysis (Horn, 1965) is a Monte Carlo
simulation process comparing observed eigenvalues that are extracted from the
correlation matrix with eigenvalues from simulated normal random samples. The
assumption of parallel analysis is that eigenvalues of the sample data, if nontrivial, should
exceed mean eigenvalues from iterated sets of generated, random correlation matrices.
To ensure an accurate comparison, the generated correlation matrices are assigned the
same sample size and number of variables (Fabrigar, Wegener, MacCallum, & Strahan,
1999).
Item and reliability analysis. In addition to the process above for arriving at a
factor structure through EFA for each instrument, the derived factors were assessed by
items and overall internal consistency. These post hoc analyses generated Cronbach’s
alpha values to ensure good internal consistency for the derived factors. The results of
these analyses will be presented in the next chapter alongside the complete results.
Explaining Factorial Invariance
To provide context for EFA, CFA, and testing for factorial invariance, a brief
review of the concept of validity is needed. Messick (1989) helpfully pointed out that
contemporary validity is understood as the unified construct-based model of validity.
Messick (1989) defined this unified construct based model of validity as “an integrative
evaluative judgment of the degree to which empirical evidence and theoretical rationales
support the adequacy and appropriateness of inferences and actions based on test scores
or other modes of assessment” (p. 13). Elaborating further, Messick (1995) outlined six
aspects of this unified conception of construct validity: content, substantive, structural,
generalizability, external, and consequential.

30
Confirmatory factor analysis and factorial invariance address different aspects of
construct validity. Confirmatory factor analysis (and EFA) gathers evidence about the
structural aspect of validity. According to Dimitrov (2010), CFA appraises “the fidelity
of the scoring structure to the structure of the construct domain” (p. 123). Factorial
invariance, on the other hand, moves beyond the fidelity of structure and assesses the
generalizability aspect of validity. Factorial invariance seeks to find the extent that
properties on scores of a construct generalize across population groups, various settings,
and tasks (Messick, 1995).
Factorial invariance, put simply, is a way of seeing if the parameters associated
with each factor in one population behave the same way in other populations. This is
also referred to as multi-group invariance. Both EFA and CFA frameworks are able to
test for factorial invariance, but CFA offers more stringent tests of invariance that enable
more robust inter-group comparisons (Dimitrov, 2010). Where EFA can examine
similarity of factor patterns across multiple groups, CFA can test for factor
patterns/loadings, mean comparisons, and the precision of measurement across groups
(Dimitrov, 2010). These varying levels of factor invariance stringency afforded by CFA
can offer greater assurance of psychometric reliability of measures.
Testing for factorial invariance in CFA models involves assessment of configural,
measurement, and structural invariance (Byrne, 2004; Cheung & Rensvold, 2002). These
are incremental levels of invariance. Configural invariance (or form invariance)
identifies a baseline model, the most parsimonious, best fitting, and substantively
meaningful model that works across groups under consideration (Dimitrov, 2010).
Subsequent, more stringent tests of measurement invariance rely on the ability to
31
establish configural invariance and compare restricted models to the baseline model
(Byrne, 2004; Byrne et al., 1989). Measurement invariance of a CFA model involves
testing for the following three possible levels of factorial invariance: metric (weak
measurement), scalar (strong measurement), and invariance of item uniqueness
(complete measurement invariance – this is largely considered impractical and
unnecessary) (Dimitrov, 2010). Structural invariance moves beyond consideration of the
stability of factor loadings, patterns, means, and error variances and covariances across
groups; it refers to the invariance of the variances and covariances of the factors
themselves (Dimitrov, 2010).
Invariance
For this study, factorial invariance testing was limited to configural and
measurement invariance. The analyses will proceed in the forward approach to multiple-
group confirmatory factor analysis (Byrne, 2004; Joreskog, 1971). Using maximum
likelihood estimation, the forward approach is based on a chi-square difference test (Δχ2)
between two nested models. One model is constrained (with invariance assumed) and the
other model is unconstrained (no invariance assumed) for parameters such as factor
loadings (metric invariance), intercepts (scalar invariance), etc. Parameters being tested
are considered invariant if the difference in chi-square values (Δχ2constrained –
Δχ2unconstrained) is not statistically significant (Byrne, 2004; Joreskog, 1971). The analysis
is called forward because it moves from the least constrained solution (no invariance) to
subsequently creating and comparing models with heightened levels of parameter
restrictions for equality across groups (i.e., configural → metric → scalar → invariance
of item uniqueness). This series of parameter restrictions creates a series of nested

32
models that enable the use of a chi-square test (Byrne, 2004; Joreskog, 1971). For each
more stringent test of invariance, invariance at a lower level is assumed. For example,
testing for metric invariance assumes that an adequate fitting baseline model was
established (configural invariance), and the constrained (metric model) is compared to the
unconstrained baseline model (Byrne, 2004; Joreskog, 1971).
Confirmatory factor analysis models are evaluated by goodness of fit statistics and
are tested within the framework of structural equation modeling (SEM). The factor
loadings are estimated using maximum likelihood estimation (typically by a statistical
software package - Mplus, LISREL, AMOS, or EQS) to minimize discrepancies between
the sample covariance matrix for the observed variables and a hypothesized population
covariance matrix implied by the model (Dimitrov, 2010). If a solution can be reached
where the discrepancies are sufficiently minimal, the model is deemed to provide an
adequate or good fit to the supplied data. CFA data fit is valid if underlying SEM
assumptions of multivariate normality are met for each variable considered; goodness of
fit statistics may be distorted if normality is violated (see Curran, West, & Finch, 1996
for a detailed explanation).
Assessing goodness of fit for CFA models requires the computation and
consideration of multiple goodness-of-fit indexes (Hu & Bentler, 1999). Relying solely
on the chi-square value alone is not advised, as it is susceptible to sample size. The chi-
square value tends to overly support model fit in smaller sample sizes and to reject model
fit in large samples (Dimitrov, 2010). Hu and Bentler (1999) indicated that a joint
evaluation that consults measures such as the comparative fit index (CFI; Bentler, 1990),
the Tucker-Lewis Index (TLI; Tucker & Lewis, 1973) and root mean square error of

33
approximation (RMSEA; Steiger, 1990). These measures are reported in addition to the
chi-square value to assess constrained models for factorial invariance. The good, or
optimal fit of a proposed model is supported when CFI ≥ .95, TLI ≥ .95, and RMSEA ≤
.06 (Hu & Bentler, 1999). Model fit is considered adequate when CFI ≥ .90, TLI ≥ .90,
and RMSEA ≤ .08 (Byrne, 2009).
Partial invariance. It should be noted that due to the stringent requirements of
the hypotheses behind invariance that invariance should truly be considered a matter of
degree if full invariance cannot be reached at a certain level (Byrne et al., 1989). Each
statistics package provides modification indices with CFA output (Byrne, 2009). The
modification index (MI) for each parameter gives the “expected drop in the model’s chi-
square value if this parameter is freely estimated” (Dimitrov, 2010; p. 127). Parameters
are to be freed one at a time, starting with the highest MI value item (greater than 3.84)
that makes theoretical and empirical sense (Byrne, 2009). If the parameter with a high
MI value is freed and does not render the difference in chi-square values between
unconstrained and constrained values insignificant, further high MI value parameters can
be freed one at a time. After each parameter is freed, the Δχ2 statistic should be reviewed
to see if the model changes are no longer significant (Byrne, 2010). Generally, up to 20%
of parameters in a CFA model can be freed in claiming partial invariance (Byrne et al.,
1989; Levine et al., 2003).
However, even if partial invariance is reached at a certain level, partial invariance
does not warrant a researcher for testing invariance at a higher level. For example,
suppose a researcher finds that factor loadings do not support full metric invariance. The
researcher then consults the modification indices and frees loadings to vary that possess a

34
high MI value, and partial metric modification is achieved. Due to the nested nature of
models in invariance testing and the assumption full, progressive invariance, the
researcher would not be warranted in testing for scalar invariance based on partial metric
invariance.

35
Chapter Four: Results
To determine the measures’ psychometric properties, the data were first screened
for irregularities. Thirty-one (3%) of the student surveys (public school, n = 17; private
school, n = 14) were invalid due to substantial missing information or unusual response
patterns. In terms of skewness and kurtosis, Field (2013) notes that the general rule of
thumb criterion for skewness and kurtosis indices (absolute values greater than 1.0, ratio
of statistic to standard error of the statistic exceeding a ratio of 2:1 or 3:1, etc.) are
acceptable for most quantitative methods (Field, 2009). However, there is a growing
consensus suggesting that these parameters are insufficient for exploratory factor
analyses. Guidelines of skewness not exceeding │2│ and kurtosis not exceeding │7│ are
considered more reasonable for conducting exploratory factor analyses (EFA; Fabrigar &
Wegener, 2012; Fabrigar et al., 1999). Only three items (SWBQ items 2, 6, and 12)
demonstrated kurtosis or skew indices exceeding ± 2.0. With only a few atypical items,
all scores were entered into the PAFs. KMO estimates ranged from .75 (Student EAS) to
.91 (SWBQ). Bartlett’s tests were significant (p < .001), suggesting that the
intercorrelation matrices were factorable.
Addressing Negative Skew
The data featured some non-normal distributions as well as some missing data
(see Table 2). Normality was more of an issue with several indicators from SWBQ. For
the missing data, after investigating for any patterns, the missing data did not appear
systematic. This enables the substation of item means for missing data. One way to
investigate impact of missing data is to compare CFA results between a model featuring
missing data and a model with item means replacing missing data (Sink & Bultsma,

36
2013). Maximum Likelihood Estimation (MLE) can easily handle missing data (Enders,
2010), so the two comparison CFAs were generated with MLE. The results were virtually
identical. The same comparison method was employed to check for the impact of non-
normal items in the SWBQ. However, to adjust for the negative skew, a reflected Log10
transformation was performed (Osbourne, 2002; Roberts, 2008) on SWBQ items with
skewness scores lower than -1.5. These transformations resulted in distributions all
falling between +/-1. Comparing a CFA model that used the transformed variables with
one that used the raw data, the results were again virtually identical. Raw data results are
presented.
Table 2
Descriptive Statistics for SWBQ (Spirituality Scale)
N Mean Std. Deviation Skewness Kurtosis
Item 1: I love other people 782.00 4.17 0.94 -1.42 2.28
Item 2: I feel close to God 740.00 4.53 0.84 -2.22 5.26
Item 3: I forgive other people 816.00 3.87 1.10 -1.05 0.65
Item 4: I enjoy nature 798.00 4.36 0.94 -1.81 3.34
Item 5: I really know myself 807.00 4.44 0.88 -1.90 3.70
Item 6: I worship God 718.00 4.57 0.79 -2.36 6.41
Item 7: I feel joyous when I am outside 798.00 4.20 0.96 -1.47 2.21

37
Item 8: I trust other people 821.00 3.25 1.21 -0.33 -0.67
Item 9: I learn about myself 817.00 4.35 0.88 -1.70 3.27
Item 10: I like being in nature 815.00 4.34 0.96 -1.69 2.62
Item 11: I feel close to God 825.00 4.23 1.02 -1.47 1.75
Item 12: I feel peaceful in nature 726.00 4.54 0.84 -2.40 6.38
Item 13: I am at peace with God 808.00 4.10 1.04 -1.30 1.33
Item 14: I am joyful 736.00 4.37 0.93 -1.82 3.31
Item 15: I pray 817.00 4.05 1.02 -1.10 0.91
Item 16: I am peaceful 812.00 4.22 0.97 -1.44 1.92
Item 17: I respect other people 816.00 4.28 0.95 -1.44 1.82
Item 18: I have meaning in life 816.00 4.12 1.02 -1.25 1.18
Item 19: I am kind to other people 815.00 4.32 0.98 -1.69 2.63

38
Table 3
Descriptive Statistics - FACES, OHQ, SHS N Mean Std. Deviation Skewness Kurtosis Student FACES 806 6.31 1.271 -2.529 6.885 I feel happy with the way I am 809 4.44 .910 -2.006 4.072 I feel that life is rewarding 794 4.05 1.062 -1.059 .533 I feel comfortable with my life 798 4.09 1.122 -1.256 .841 I think I look attractive 794 3.96 1.164 -.994 .153 I see beauty around me 805 4.07 1.127 -1.206 .660 I have time to do what I enjoy 803 4.17 .988 -1.340 1.514 I pay attention 816 3.99 1.022 -.855 .211 I have happy memories of the past
798 4.10 1.107 -1.180 .687
I am usually happy 829 3.99 1.069 -1.031 .497 I am happier than most kids I know
817 3.91 1.057 -.801 .112
I enjoy life most of the time 823 4.21 .977 -1.378 1.668 I want to be happier 804 4.26 1.012 -1.553 2.024
Table 4 Descriptive Statistics for EAS (Temperament Scale) N Mean Std. Deviation Skewness Kurtosis I like to be with people 818 4.00 1.019 -1.042 .752 I usually seem to be in a hurry
804 3.48 1.264 -.501 -.714
I am easily frightened 806 3.27 1.375 -.265 -1.158 I am usually stressed 803 3.32 1.317 -.363 -.954 I let people know when I am unhappy
805 3.58 1.299 -.608 -.721
I often feel alone 812 3.40 1.355 -.462 -1.009 I like to be busy 809 3.83 1.263 -.893 -.274 I get angry easily 805 3.48 1.376 -.497 -1.002 I feel frustrated a lot 809 3.34 1.269 -.340 -.875 I am always doing things 810 3.96 1.114 -1.062 .472

39
I feel nervous about things that happen every day
808 3.47 1.283 -.479 -.807
I usually feel confident 807 3.77 1.139 -.756 -.084 I get annoyed easily 766 3.55 1.275 -.545 -.796 I panic when I get scared 795 3.52 1.309 -.511 -.878 I like to work with other people
804 4.04 1.109 -1.114 .554
I get upset easily 810 3.36 1.345 -.373 -1.036 I have a lot of energy 794 4.08 1.116 -1.182 .643 It takes a lot to upset me 806 3.51 1.254 -.528 -.688 I only have a few fears 791 3.66 1.186 -.693 -.284
Table 5
Inter-Item Correlations - SHS I am
usually happy
I am happier than most kids I know
I enjoy life most of the time
I want to be happier
I am usually happy
1 .388 .396 .265
I am happier than most kids I know
1 .267 .285
I enjoy life most of the time
1 .298
I want to be happier
1

40
Table 6 Inter-Item Correlations - SWBQ 1 2 3 4 5 6 7 8 9 10 11 12 13 14 15 16 17 18 19 1 1 .220 .337 .232 .213 .287 .215 .144 .207 .194 .278 .291 .250 .247 .236 .189 .224 .277 .227 2 1 .206 .346 .406 .440 .293 .116 .274 .335 .272 .405 .248 .405 .287 .313 .262 .272 .318 3 1 .232 .260 .217 .243 .240 .133 .225 .288 .228 .270 .183 .239 .257 .205 .223 .189 4 1 .327 .364 .315 .171 .213 .359 .261 .299 .179 .290 .226 .226 .258 .209 .302 5 1 .354 .278 .112 .282 .255 .140 .346 .212 .265 .232 .269 .281 .222 .243 6 1 .329 .107 .210 .300 .251 .418 .206 .427 .253 .285 .239 .332 .312 7 1 .112 .166 .385 .327 .251 .252 .213 .242 .195 .223 .258 .314 8 1 .097 .138 .158 .100 .223 .143 .195 .213 .147 .195 .162 9 1 .304 .286 .398 .309 .372 .299 .307 .313 .319 .291 10 1 .458 .458 .341 .394 .325 .374 .387 .327 .405 11 1 .384 .399 .379 .388 .333 .338 .318 .376 12 1 .369 .506 .439 .434 .459 .391 .431 13 1 .328 .460 .328 .339 .326 .322 14 1 .352 .418 .376 .391 .415 15 1 .425 .421 .452 .345 16 1 .346 .501 .397 17 1 .349 .413 18 1 .349 19 1
41
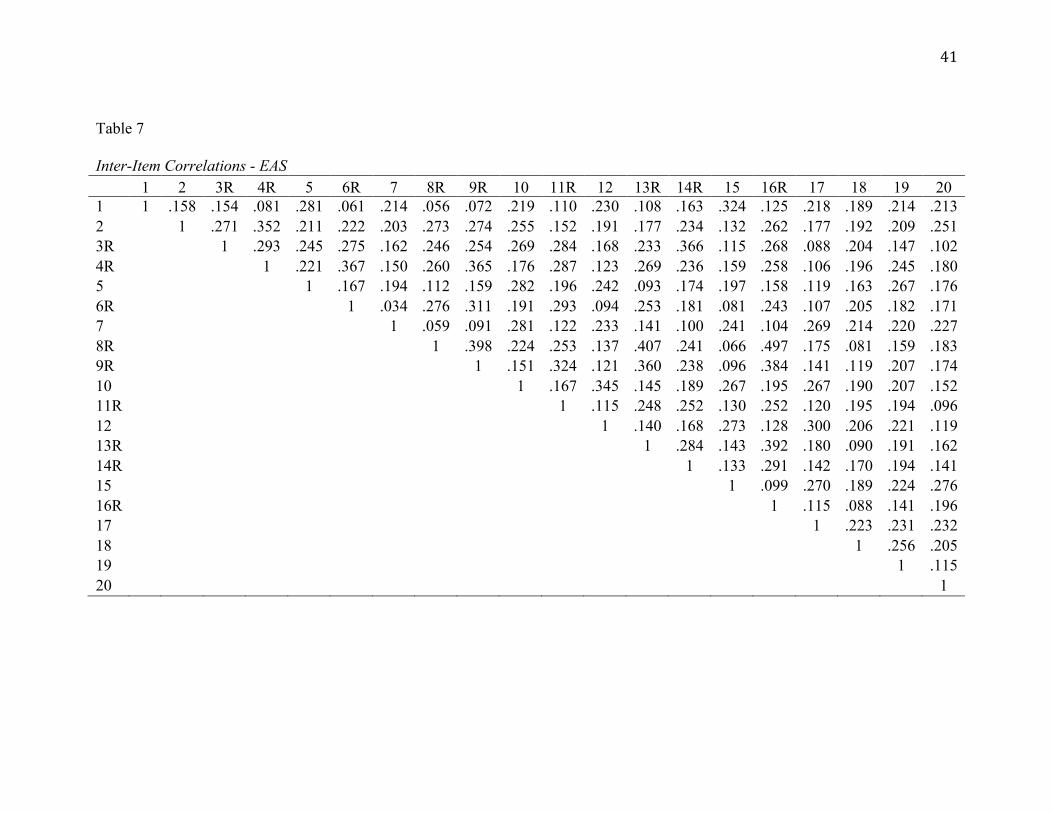
Table 7
Inter-Item Correlations - EAS 1 2 3R 4R 5 6R 7 8R 9R 10 11R 12 13R 14R 15 16R 17 18 19 20
1 1 .158 .154 .081 .281 .061 .214 .056 .072 .219 .110 .230 .108 .163 .324 .125 .218 .189 .214 .213 2 1 .271 .352 .211 .222 .203 .273 .274 .255 .152 .191 .177 .234 .132 .262 .177 .192 .209 .251 3R 1 .293 .245 .275 .162 .246 .254 .269 .284 .168 .233 .366 .115 .268 .088 .204 .147 .102 4R 1 .221 .367 .150 .260 .365 .176 .287 .123 .269 .236 .159 .258 .106 .196 .245 .180 5 1 .167 .194 .112 .159 .282 .196 .242 .093 .174 .197 .158 .119 .163 .267 .176 6R 1 .034 .276 .311 .191 .293 .094 .253 .181 .081 .243 .107 .205 .182 .171 7 1 .059 .091 .281 .122 .233 .141 .100 .241 .104 .269 .214 .220 .227 8R 1 .398 .224 .253 .137 .407 .241 .066 .497 .175 .081 .159 .183 9R 1 .151 .324 .121 .360 .238 .096 .384 .141 .119 .207 .174 10 1 .167 .345 .145 .189 .267 .195 .267 .190 .207 .152 11R 1 .115 .248 .252 .130 .252 .120 .195 .194 .096 12 1 .140 .168 .273 .128 .300 .206 .221 .119 13R 1 .284 .143 .392 .180 .090 .191 .162 14R 1 .133 .291 .142 .170 .194 .141 15 1 .099 .270 .189 .224 .276 16R 1 .115 .088 .141 .196 17 1 .223 .231 .232 18 1 .256 .205 19 1 .115 20 1

42
The inter-item correlation matrices (Tables 5-7) for each instrument do not raise
concern for computing factor analyses on the data. There are no negative inter-item
correlations, and there are none that are so large in magnitude to suggest serious
multicollinearity or redundant items (Pett et al., 2003). While some inter-item
correlations are low, this is not considered problematic for EFA (Pett et al., 2003).
Internal consistency analyses indicated that the alpha coefficients for OHQ-SF,
two dimensions of the SWBQ (Environmental and Transcendental), and two dimensions
of the EAS (Sociability and Anger were adequate (α > .70). The alphas for RPS and SHS
(.64 and .65, respectively) were lower but not far off the .70 threshold (see Table 9). The
RPS is only three items, and as such, the lower internal consistency score is unsurprising.
The EFA results for these instruments and the lower performing dimensions of EAS and
SWBQ provide insight into the respective alpha values.
Table 8
Range of Inter-Item Correlations for Instruments SWBQ 0.097 0.506 RPS 0.359 0.394 OHQ 0.19 0.378 SHS 0.265 0.396 EAS 0.034 0.497 Psychometric Analyses
Principal axis factoring (PAF) extraction was used on all of the instruments. The
FACES scales consist of only one item and were not subjected to factor analysis, as
factor analysis is meant as a reduction technique. PAF results and scree plot analyses
offered empirical support that PBS, OHQ-SF, and SHS were unidimensional. All of the
instruments subject to PAFs demonstrated significant values for Bartlett’s test of

43
sphericity (p < .001), indicating that this is not an identity matrix and appropriate for
factor analysis (Field, 2013). KMO estimates ranged from .65 (RPS) to .92 (SWBQ)
(see Table 10). High KMO values represent that the correlations are relatively compact
(0.5-0.7 mediocre but acceptable; 0.7-0.8, good; 0.8-0.9, great; 0.9-1.0, superb), and this
range indicates that these data are appropriate for factor analysis (Field, 2013).
Table 9 Cronbach’s Alphas – Internal Consistency RPS
0.64
OHQ
0.78 SHS
0.65
EAS Full Scale 0.84
Sociability 0.75
Anger 0.74
Distress 0.63
SWBQ Full Scale 0.88
Environmental 0.73
Transcendental 0.74 Personal 0.77
Table 10
Indices of Sampling Adequacy
Measure KMO χ2
SHS .70 394.25** OHQ .86 996.07** EAS .88 2413.30** SWBQ .92 2643.35**
RPS .65 266.28** Note. KMO = Kaiser-Meyer-Olkin Measure of Sampling
Adequacy; χ2 = Bartlett’s approximate Chi-square value; ** = p < .01.

44
Student EAS. Simple structure emerged using PAFs and oblimin rotations (δ = -
0.2). Items 11 (“I feel nervous about things that happen every day”) and 14 (“I panic
when I get scared”) were omitted due to extremely low communality and factor loadings
(< .25). Three interpretable factors were extracted. Eigenvalues and percentages of
common variance explained by each factor were: factor 1, Λ = 4.80 (22%) factor 2, Λ =
2.00 (7%), and factor 3, Λ = 1.14 (3%). Based on Buss and Plomin (1984) and item
content analysis, the three factors were labeled Sociability (S; items 12, 15, 17, 1, 7, 10,
5, 18, 20, 19); loadings ranged from .33 [item 19: “I only have a few fears”] to .56 [item
12: “I usually feel confident”), Anger (A; 8, 16, 13, 9); loadings ranged from .44 [item 9:
“I feel frustrated a lot”] to .73 [item 8: “I get angry easily”), and Distress (D; items 4, 6,
3, 2); loadings ranged from .34 [item 2: “I usually seem to be in a hurry”] to .56 [item 4:
“I am usually stressed], respectively. Whereas the A and D items indicated a
respondent’s level of emotionality, items comprising the S factor assessed a child’s
ability to interact positively. Alpha coefficients were acceptable for each dimension (αs
= .75, .74, and..63 for S, A, and D, respectively). Items related to shyness loaded on the
Sociability dimension.
Teacher EAS. Simple structure emerged using PFAs and oblimin rotations. Four
interpretable factors were extracted. Eigenvalues and percentages of common variance
explained by each factor were: factor 1, Λ = 4.54 (21%) factor 2, Λ = 3.58 (16%), factor
3, Λ = 1.80 (7%), and factor 4, Λ = 1.14 (3%). Based on Buss and Plomin (1984) and
item content analysis, the four factors were labeled Anger (A; items 16, 8, 18, 13, 9);
loadings ranged from .58 [item 9: “I feel frustrated a lot”] to .82 [item 16: “I get upset
easily”), Sociability (S; items 15, 1, 20, 12, 5); loadings ranged from .36 [item 5: “I let

45
people know when I am unhappy”] to .68 [item 15: “I like to work with other people”),
Distress/Fear (D; items 3, 11, 14, 4, 6); loadings ranged from .42 [item 6: “I often feel
alone”] to .70 [item 3: “I am easily frightened], and Activity (X; items 10, 7, 17);
loadings ranged from .46 [item 17: “I have a lot of energy”] to .79 [item 10: “I am always
doing things”], respectively. Whereas the A and D items indicated a respondent’s level
of emotionality, items comprising the S factor assessed a child’s ability to interact
positively. Alpha coefficients were low to acceptable for each dimension (αs = .77, .74,
.60, and .54 for D, X, S, and A, respectively). Items related to shyness loaded on the
Sociability dimension.
SWBQ. The final aggregated results suggested that the SWBQ consisted of three
factors rather than four as predicted. Eigenvalues and percentages of common variance
explained by the factors were as follows: factor 1, Λ = 5.56 (36%); factor 2, Λ = 1.16
(4.3%); factor 3, Λ = 1.1 (3.2%). Based on previous SWBQ investigations and item
content analysis, the three spiritual well-being factors were labeled Environmental (E),
Transcendental (T), and Personal (P), respectively. The social dimension present in the
original English-language SWBQ failed to emerge as a viable factor. A few of this
dimension’s items loaded on the Personal factor, which comprised 5 items (15, 18, 16,
13, 17); loadings ranged from -0.33 [item 17: “I have meaning in life”] to -0.67 [item 15:
“I am peaceful”]). The Environmental factor comprised five items (10, 11, 7, 19, 4);
loadings ranged from 0.39 [item 4: “I enjoy nature”] to 0.55 [item 10: “I like being in
nature”]). The Transcendental factor (items 6, 2, 14, 12) loadings ranged from 0.41 [item
12: “I am at peace with God”] to 0.71 [item 6: “I worship God”]) reflected the
respondent’s sense of “connectedness with a Higher Power.” Internal consistency

46
estimates for each dimension were strong (αs = .73, .74, and .78, for E, T, and P,
respectively).
Table 11
SWBQ Factor Inter-Correlation Matrix Factor 1 (E) 2 (T) 3 (P) 1 (E) .49 .48 2 (T) .43 3 (P)
Note. E = Environmental; T = Transcendental; P = Personal.
Table 12
OHQ-SF. Simple structure was achieved with seven items loading onto a single
reliable factor (α = .76; Λ = 3.02; explained variance = 34%; loadings ranged from .52
[item 6: “I have time to do what I enjoy.”] to .62 [item 1: “I feel happy with the way I
Rotated SWBQ Factor Matrix (oblimin)
Factor
Environmental Transcendental Personal h2 Item
10 0.55
0.47 11 0.53
0.48
7 0.52
0.31 19 0.40
0.28
4 0.39
0.30 6
0.71
0.55
2
0.56
0.44 14
0.44
0.47
12
0.41
0.45 15
-0.67 0.52
18
-0.61 0.46 16
-0.61 0.49
13
-0.43 0.35 17
-0.33 0.33
Eigenvalue 5.55 1.16 1.1 % of variance 35.7 4.3 3.2

47
am.”). Item 7 was eliminated because of a weak factor loading (> .30) and it failed to
contribute to the scale’s internal consistency.
Table 13 OHQ Extracted Factor Loadings Item Factor Item 1: happy with way I am .62 Item 3: feel comfortable w/ my life .61 Item 2: life is rewarding .60 Item 5: see beauty around me .60 Item 4: think I look attractive .56 Item 8: happy memories of the past .55 Item 6: have time to do what I enjoy .52
Eigenvalue 3.02 % of variance 33.67 Note. PAF.
SHS. The PFA computed on the four items generated a highly reliable
unidimensional measure (α = .64; Λ = 2.00; explained variance = 32.3%) (see Table 14).
Simple structure was achieved with four items loading onto a single reliable factor;
loadings ranged from .45 [item 4: “I want to be happier.”] to .69 [item 1: “I am usually
happy.”).
Table 14 SHS Extracted Factor Loadings
Item Factor 1 Item 1: usually happy .69 Item 2: happier than most kids .56 Item 3: enjoy life most of time .56 Item 4: want to be happier .45
Eigenvalue 2.00 % of variance 32.34 Note. PAF.

48
RPS. With only three items, PBS-B did not meet the minimum criteria of at least
four items to conduct a meaningful PAF (Costello & Osborne, 2005). However, inter-
item correlations were moderate (rm = .38), varying from .36 (ritems 1, 3) and .40
(ritems 2, 3). The Cronbach alpha for the RPS was satisfactory (α = .64), suggesting that
the RPS items measured a relatively similar construct (i.e., religious practices).
Scale Comparisons by Gender
To determine whether there were significant Gender differences on the scales (research
question 2), participants’ factor scores for each measure were computed. For
multidimensional measures (Student EAS, Teacher EAS, SWBQ), the factor scores for
each dimension were included as dependent variables in a multiple analysis of variance
(MANOVA) and gender was included as the grouping variable. If a significant main
effect was found for gender, subsequent univariate analyses were consulted for
statistically significant differences by gender on each dependent variable. For
unidimensional measures, a one-way analysis of variance (ANOVA) was run with the
factor score as the dependent variable and gender as the group variable. As there were
only two groups (female=1, male =0), a significant main effect indicated a difference
between male and female students.
Student and Teacher EAS. Using the PFA derived S, A, and D factors (Student
EAS data) as dependent variables, a MANOVA produced a significant main effect for
Gender (Wilks’ Λ = .97, F[3,613] = 4.52, p < .005, ηp2 = .02). Subsequent analyses
yielded significant differences between boys and girls on the S (F[1,615] = 8.48, p <
.001, ηp2 = .02) and A (F[1,615] = 4.19, p < .05, ηp2 = .01), and D (F[1,615] = 5.73, p <
.005, ηp2 = .01) dimensions. Girls scored themselves significantly higher on all three

49
dimensions.
The MANOVA computed on Teacher EAS mean ratings revealed a significant main
effect for Gender, Wilks’ Λ = .95, F[4,812] = 10.56, p < .001, ηp2 = .05. Subsequent,
univariate analyses yielded significant differences between boys and girls on the A
(F[1,816] = 17.34, p < .001, ηp2 = .02), S (F[1,816] = 11.35, p < .001, ηp2 = .01), and X
(F[1,816] = 5.34, p < .05, ηp2 = .01) dimensions. Girls scored themselves significantly
higher on all three dimensions.
SWBQ. Using the PFA derived P, E, and T factors (SWBQ data) as dependent
variables, a MANOVA produced a significant main effect for Gender (Wilks’ Λ = .97,
F[3,580] = 6.15, p < .001, ηp2 = .03). Subsequent, univariate analyses yielded significant
differences between boys and girls on the T (F[1,582] = 8.34, p < .005, ηp2 = .014) and P
(F[1,582] = 8.43, p < .001, ηp2 = .02) dimensions. Girls scored themselves significantly
higher on both dimensions.
RPS. An ANOVA was computed on the single dimension RPS, generating
significant main effects for Gender (F[1,705] = 22.9, p < .001, ηp2 = .03). Girls
perceived themselves as being significantly more religiously active than the boys.
OHQ-SF. The ANOVA was computed on the unidimensional OHQ-SF,
producing a significant main effect for Gender, F(1,711) = 12.02, p < .001, ηp2 = .02.
GIrls viewed themselves as significantly happier than the boys.
SHS. The ANOVA was computed on the 3-item SHS, producing a significant
main effect for Gender, F(1,776) = 9.84, p < .003, ηp2 = .01. Females again viewed
themselves as significantly happier than the males.
Student and Teacher Faces Scale. On these single item happiness scales, student

50
and teacher ratings were dependent variables and Gender was the independent factor.
The MANOVA produced a significant effect for Gender, Wilks’ Λ = .96, F[2,772] =
16.17, p < .001, ηp2 = .04. Females again rated themselves (or were rated) more highly
on happiness.
Hierarchical Multiple Regressions
To respond to the fourth research question—After controlling for temperament
(student and teacher ratings), do children’s spirituality and religious practices predict
their happiness?—hierarchical multiple regressions (HMRs) were computed on OHQ-SF,
SHS, and Student FACES. Initial bivariate correlations among all scales for the entire
sample are presented in Table 15 below. The correlations were mostly significant, and
their magnitude ranging from low-moderate to strong.
Teacher Faces Scale was dropped as a criterion variable due to its weak
correlations with the SWBQ dimensions and RPS. As Table 16 shows, for each HMR
analysis, the salient demographic variables (School Type and Gender) were entered as a
block first, followed by Student EAS, and then by Teacher EAS. The final block
included spiritual well-being (SWBQ) and religiousness (RPS) measures.
OHQ-SF. Student EAS accounted for 35% of the shared variance in OHQ-SF.
Spirituality explained 23% of the variance in this measure beyond any variance explained
by School Type, Gender, and Temperament. The Personal, Environmental, and
Transcendental domains were found to be significant predictors of student happiness.
SHS. Student temperament explained 34% of the shared variance in SHS. Only
Personal spirituality significantly explained a sizable percent (14%) of the variance in
SHS after controlling for temperament.

51
Student Faces Scale. Student temperament explained 26% of the variance in
Student Face Scale. Spirituality explained 6% of the shared variance in SHS after
controlling for student temperament. The personal and transcendental domains were
significant predictors of happiness.
Invariance Results
Having identified the factor structure of each instrument using PFA, it was
important to next see if the same factor structure held across different groups. Given the
limited meaningful grouping variables in the data, gender was selected for a multi-group
CFA to test for the factorial invariance of the student SWBQ, EAS, and OHQ-SF factor
structures. These results answer the third research question: Does the factor structure
appear the same among boys and girls? As a reminder, RPS was not subjected to
invariance testing as it only comprised three items, and the SHS did not exhibit good fit
for the configural model. The breakdown of gender included 421 males and 458 females
(N=879; four students failed to indicate their gender). The gender groups featured an N
well in excess of the 100 recommended for invariance testing (Keith, 2006).
Multicollinearity was also not an issue, as bivariate item correlations were largely low to
moderate (no correlation exceeded .61). Missing data were present in less than five
percent of the sample population, and those with missing data simply quit taking the
survey. Given that there was no apparent pattern to the survey quitters and the low
overall rate, those with missing data were dropped from the multi-group CFA.
Table 17 shows that the configural model encompassing both gender groups indicated
adequate fit for the SWBQ, EAS, and the OHQ. For the SWBQ , the CFI was .933, the
TLI was .904, and the RMSEA was .041 (90% CI = .036 to .046). For the EAS,
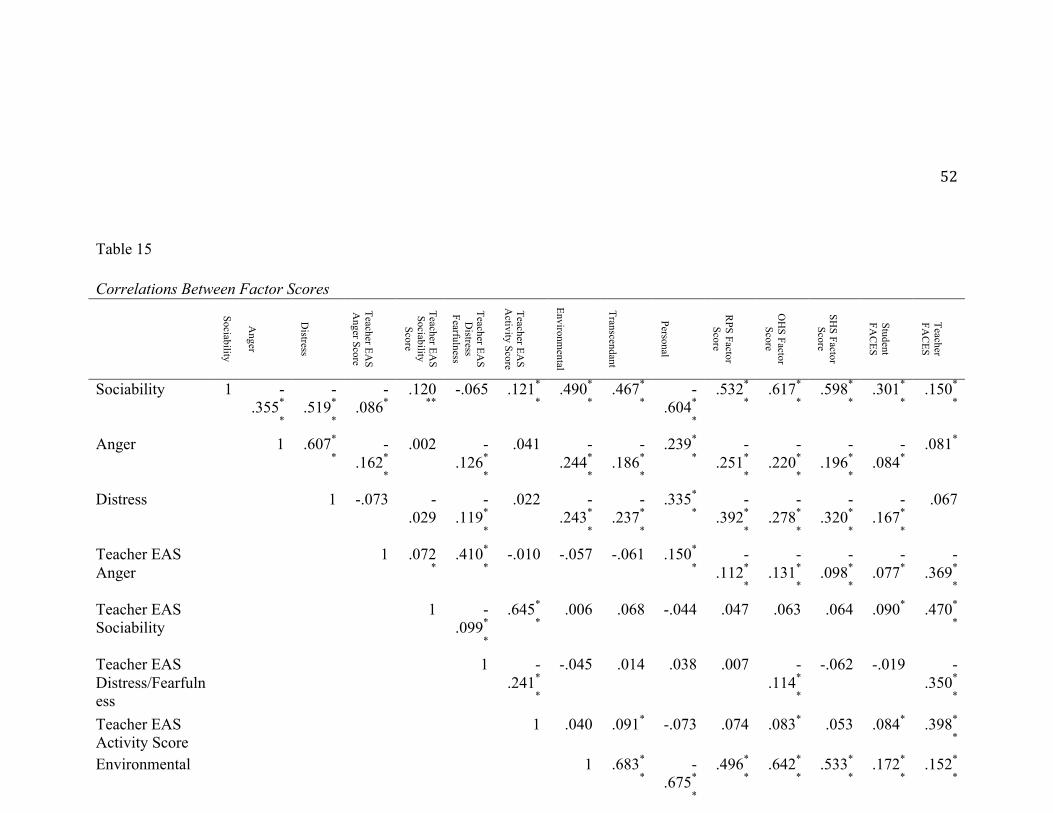
52
Table 15
Correlations Between Factor Scores
Sociability
Anger
Distress
Teacher EAS
Anger Score
Teacher EAS
Sociability Score
Teacher EAS
Distress
Fearfulness
Teacher EAS
Activity Score
Environmental
Transcendant
Personal
RPS Factor Score
OH
S Factor Score
SHS Factor Score
Student FA
CES
Teacher FA
CES
Sociability 1 -.355*
*
-.519*
*
-.086*
.120**
-.065 .121*
* .490*
* .467*
*-
.604*
*
.532*
*.617*
*.598*
*.301*
*.150*
*
Anger 1 .607*
*-
.162*
*
.002 -.126*
*
.041 -.244*
*
-.186*
*
.239*
*-
.251*
*
-.220*
*
-.196*
*
-.084*
.081*
Distress 1 -.073 -.029
-.119*
*
.022 -.243*
*
-.237*
*
.335*
*-
.392*
*
-.278*
*
-.320*
*
-.167*
*
.067
Teacher EAS Anger
1 .072*
.410*
*-.010 -.057 -.061 .150*
*-
.112*
*
-.131*
*
-.098*
*
-.077*
-.369*
*
Teacher EAS Sociability
1 -.099*
*
.645*
* .006 .068 -.044 .047 .063 .064 .090* .470*
*
Teacher EAS Distress/Fearfulness
1 -.241*
*
-.045 .014 .038 .007 -.114*
*
-.062 -.019 -.350*
*
Teacher EAS Activity Score
1 .040 .091* -.073 .074 .083* .053 .084* .398*
*
Environmental 1 .683*
*-
.675*
*
.496*
*.642*
*.533*
*.172*
*.152*
*

53
Transcendent 1 -.603*
*
.576*
*.576*
*.504*
*.176*
*.167*
*
Personal 1 -.599*
*
-.670*
*
-.654*
*
-.245*
*
-.197*
*
RPS Factor Score
1 .582*
*.523*
*.184*
*.124*
*
OHS Factor Score
1 .615*
*.218*
*.221*
*
SHS Factor Score
1 .229*
*.168*
*
Student FACES 1 .114*
*
Teacher FACES 1 **. Correlation is significant at the 0.01 level (2-tailed). *. Correlation is significant at the 0.05 level (2-tailed).

Runninghead:DISSERTATIONPROPOSAL 54
Table 16
Hierarchal Regression Model Results Criterion Step Predictors β p R² ΔR² OHQ-SF 0.02 0
1 Gender
0.15 .00** 2 Student Temperament (EAS)
0.38 0.36
Sociability 0.62 .00** Anger -0.09 0.08 Distress
0.08 0.17
3 Teacher Temperament (EAS)
0.41 0.03 Anger -0.06 0.19 Sociability 0.02 0.76 Distress/Fearfulness -0.12 .01* Activity -0.05 0.36
4 Spirituality (SWBQ)
0.57 0.16 Environmental 0.24 .00** Transcendental 0.10 0.04
Persnoal -0.23 .00**
SHS
0.03 0.00 1 Gender
0.17 .00**
2 Student Temperament (EAS)
0.40 0.37 Sociability 0.61 .00** Anger -0.05 0.27 Distress
0.03 0.56
3 Teacher Temperament (EAS)
0.41 0.01 Anger -0.06 0.19 Sociability 0.03 0.55 Distress/Fearfulness 0.01 0.84 Activity -0.07 0.16
4 Spirituality (SWBQ)
0.55 0.15 Environmental 0.02 0.65 Transcendental 0.08 0.08
Persnoal -0.41 .00**
Student Faces
0.02 0.00 1 Gender
0.14 .00**
2 Student Temperament (EAS)
0.08 0.06 Sociability 0.24 .00** Anger 0.03 0.60 Distress
-0.04 0.54
3 Teacher Temperament (EAS)
0.10 0.02 Anger -0.13 0.02 Sociability 0.06 0.32
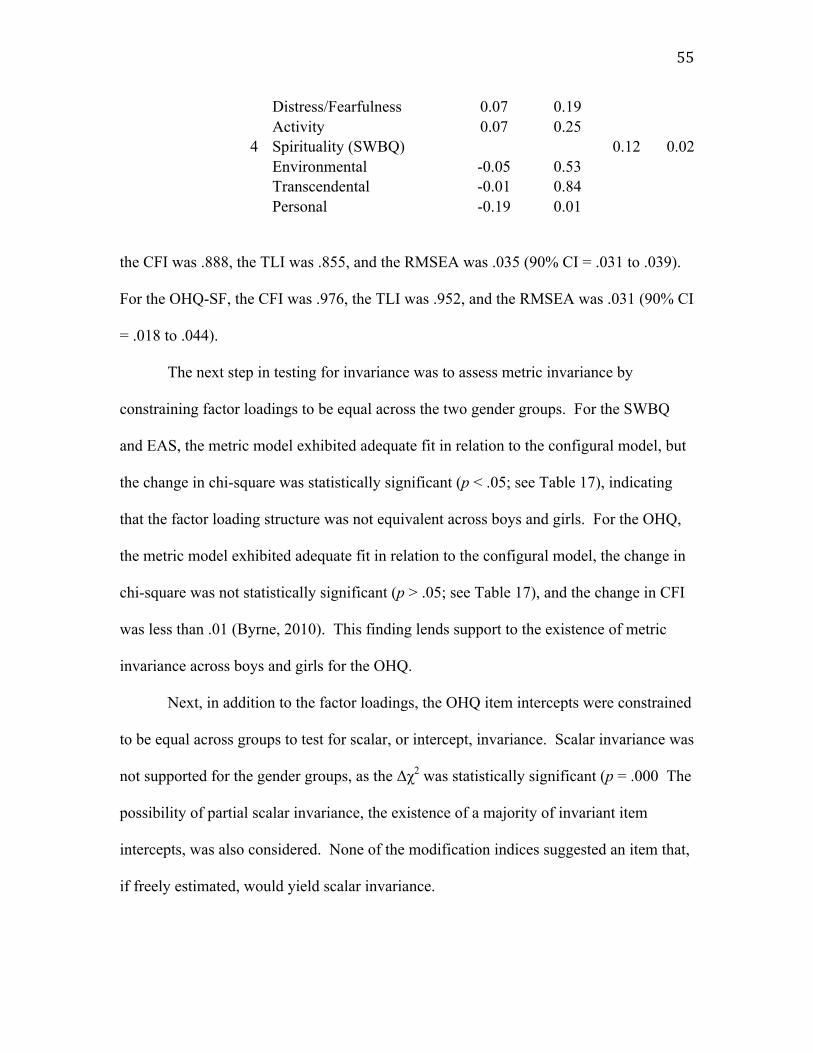
55
the CFI was .888, the TLI was .855, and the RMSEA was .035 (90% CI = .031 to .039).
For the OHQ-SF, the CFI was .976, the TLI was .952, and the RMSEA was .031 (90% CI
= .018 to .044).
The next step in testing for invariance was to assess metric invariance by
constraining factor loadings to be equal across the two gender groups. For the SWBQ
and EAS, the metric model exhibited adequate fit in relation to the configural model, but
the change in chi-square was statistically significant (p < .05; see Table 17), indicating
that the factor loading structure was not equivalent across boys and girls. For the OHQ,
the metric model exhibited adequate fit in relation to the configural model, the change in
chi-square was not statistically significant (p > .05; see Table 17), and the change in CFI
was less than .01 (Byrne, 2010). This finding lends support to the existence of metric
invariance across boys and girls for the OHQ.
Next, in addition to the factor loadings, the OHQ item intercepts were constrained
to be equal across groups to test for scalar, or intercept, invariance. Scalar invariance was
not supported for the gender groups, as the Δχ2 was statistically significant (p = .000 The
possibility of partial scalar invariance, the existence of a majority of invariant item
intercepts, was also considered. None of the modification indices suggested an item that,
if freely estimated, would yield scalar invariance.
Distress/Fearfulness 0.07 0.19
Activity
0.07 0.25
4 Spirituality (SWBQ)
0.12 0.02
Environmental -0.05 0.53
Transcendental -0.01 0.84 Personal -0.19 0.01

56
Table 17 Fit Statistics for Gender Group Invariance Tests
SWBQ Model χ2 df Δχ2 Δ df p RMSEA CFI TLI 1. Configural Invariance 364.27 148
0.04 0.93 0.90
2. Metric Invariance 391.46 162 27.19 14 0.020 0.04 0.93 0.91 EAS
Model χ2 df Δχ2 Δ df p RMSEA CFI TLI 1. Configural Invariance 546.57 264
0.04 0.89 0.86
2. Metric Invariance 590.26 282 43.69 11 0.001 0.04 0.88 0.85 OHS Model χ2 df Δχ2 Δ df p RMSEA CFI TLI 1. Configural Invariance 52.04 28
0.03 0.98 0.95
2. Metric Invariance 64.13 35 12.09 7 0.098 0.03 0.97 0.95 3. Scalar Invariance 94.19 42 30.06 7 0.000 0.04 0.95 0.93

57
Chapter Five: Summary and Discussion
Introduction The primary purpose of this study was to investigate the psychometric properties
of instruments measuring children’s spirituality, happiness, and temperament. Once
establishing these psychometric properties (with varying degrees of validity), the
instruments were employed to examine the relation of temperament and spirituality to a
child’s appraisal of their happiness. In this way, the study partially replicates the
framework of Holder et al. (2010) and adds to the psychometric base of utilizing these
instruments with child populations. To restate, the discussion that follows stems from
three research questions:
1. Are the instruments psychometrically sound?
2. Do the overall scale scores differ by gender, and if so, how?
3. Does the factor structure appear the same among boys and girls?
4. After controlling for temperament, do children’s spiritual and religious practices predict their happiness?
These questions were addressed in the analyses sequentially. An exploratory factor
analysis (EFA) was used in the initial step to test the reliability and factorial validity of
the instruments. The individual scale scores of boys and girls were compared (using
multiple analysis of variance [MANOVA]) to see if there was a statistical difference
across groups. Then the factor structure derived from the EFA was tested across two
meaningful groups for spirituality and happiness, boys and girls. confirmatory factor
analysis based invariance testing was used for these analyses. Finally, to isolate the
independent effects of temperament and happiness, hierarchal multiple regression (HMR)
was used to introduce blocks of variables and assess for improvements of model fit.

58
Comparing Results with Existing Literature
The FACES Scale
The FACES scale is unique in that it possesses only one item, a global assessment
of happiness. As such, only descriptive statistics were computed. The data for this study
revealed a heavy negative skew (> 2), large kurtosis value (> 6), and overall reflects a
non-normal distribution. A full two-thirds of South African school children rated
themselves as “Happy” or “Very Happy” (see Table 18 below). Holder et al. (2010)
found a similar distribution. However, both Cleveland (2013) and Holder and Klassen
(2010) found that the FACES distribution was within respectable limits for normality
assumptions (M, SD, skew, kurtosis). The FACES scale was used only as dependent
variable in this study. Due to the lack of consistent performance in the literature and the
overall lack of psychometric information, the FACES scale can only be commended for
use as a research tool in elementary schools.
Table 18 Comparison of Percentages of Ratings – Faces Scale
Present Study Cleveland
(2013) Holder et al.
(2010) Very Unhappy 2.50 0.23 0.00 Unhappy 0.50 1.83 0.00 Somewhat Unhappy 0.30 3.21 3.00 Neutral 4.30 13.30 7.00 Somewhat Happy 7.00 29.82 19.00 Happy 17.20 37.16 47.00 Very Happy 59.50 14.45 24.00

59
Oxford Happiness Questionnaire – Short Form (OHQ-SF)
The EFA (PAF) conducted on the OHQ-SF upheld the theorized
unidimensionality of the scale (Hills & Argyle, 2002). Only seven of the eight items
were retained in the PAF, as item 7 had a low factor loading (< .30) and reduced the
Cronbach’s alpha value for the scale. The Cronbach’s alpha value was .76, indicating
adequate reliability, and it was similar to the alpha of .79 that Cleveland (2013) reported.
These Cronbach’s alpha values are on the higher end of values compared to previous
studies using the OHQ-SF that ranged from .58 to .75 (Cruise et al., 2006; Lewis et al.,
2005). Additionally, the shared variance explained by the one-factor model (34%) was
identical to the percentage found by Cleveland (2013) with similarly aged children.
Previous studies sampled adults when considering the OHQ-SF (Cruise et al., 2006;
Lewis et al., 2005), and Hill and Argyle developed it using PCA on the full 29-item
Oxford Happiness Inventory with a sample featuring a wide age range (ages 13 to 68).
Considering Cleveland’s previous findings and the inclusion of some early teenagers in
Hill and Argyle’s study, the results here support the use of the OHQ-SF to assess
happiness in late elementary age students.
Emotionality Activity and Sociability Temperament Survey (EAS)
The EFA (PAF) in the present study did not support Buss and Plomin’s theorized
four-factor structure. Items 11 (“I feel nervous about things that happen every day”) and
14 (“I panic when I get scared”) were omitted due to extremely low communality and
factor loadings (< .25). The resulting three factors approximated the theorized
dimensions of Sociability, Anger, and Distress. Whereas the Anger and Distress items
indicated a respondent’s level of emotionality, items comprising the S factor assessed a

60
child’s ability to interact positively. Alpha coefficients were acceptable for each
dimension (αs = .75, .74, and .63 for S, A, and D, respectively). Items related to shyness
loaded on the Sociability dimension. Cleveland (2013) found only one comparable
factor, Sociability, in his two-factor solution, and it yielded a Cronbach’s alpha of .64.
The finding of a three-or-four-factor solution is fairly typical as is a wide range of
reliability scores (Boer & Westenberg, 1994; Bould et al., 2013; Mathiesen & Tambs,
1999; Stringaris et al., 2010). The EAS has demonstrated enough variation in the
literature to question the empirical stability of the theorized factors, and it appears to lack
adequacy in its existing form to measure temperament in children.
Subjective Happiness Scale (SHS)
Unlike Cleveland (2013), all four items of the SHS loaded on a single dimension
in this EFA (PAF) analysis. Item 4 was the lowest loading item (like Cleveland’s study),
but the loading was satisfactory (.45) and did not raise the Cronbach’s alpha (.64) when
dropped. This indicates less than adequate reliability, and it is a much lower Cronbach’s
alpha value than those reported in other studies (.79 to .94) (Extremera, Salguero, &
Fernández-Berrocal, 2011; Kashdan & Yuen, 2007); Lyobomirsky & Lepper, 1999; Tse,
Lueng, & Ho, 2012). One critical distinction that may explain the discrepant reliability
values was the aforementioned studies’ use of high school age and older participants.
However, unlike Cleveland’s study, these other SHS studies also retained the fourth item
in composing a single factor. The single factor derived from the PAF in this study
accounted for 32.3% of the shared variance, lower than the 39% reported by Cleveland.
While investigators may have to examine the utility of item 4 when analyzing their data,

61
the SHS seems to be a reasonable tool for assessing happiness across a broad age range of
students.
The Spiritual Well-Being Questionnaire (SWBQ)
Unlike previous studies with child, adolescent, and adult populations, the SWBQ
failed to replicate its theorized four-factor structure in EFA (PAF with oblique rotation)
here (Cleveland, 2013; Gomez & Fisher, 2003, 2005a, 2005b; Rowold, 2011). The EFA
conducted in the present study resulted in a three-factor solution with results largely
mirroring the theorized Environmental, Transcendental, and Personal dimensions (Gomez
& Fisher, 2003). The items for the Communal dimension either had low loadings or
loaded onto the Personal dimension, which was a majority of the theorized Personal
dimension items. The extracted three-factor model only accounted for 45.5% of the
shared variance, lower than Cleveland’s (2013) four-factor model that accounted for
51.5% and Gomez and Fisher’s (2003) four-factor PCA with adults (56%). The
reliability of three factors was adequate with Cronbach’s alpha values of .73, .74, and .78
for Environmental, Transcendental, and Personal dimensions, respectively. While the
Transcendental and Environmental aspects showed good distinction as factors, the prima
facie relation between Communal and Personal dimensions blurred their theorized
distinctiveness. Based on the findings of this study, use of the SWBQ should be used
with caution but shows overall promise.
Religious Practices Scale (RPS)
No true comparison can be made between this dissertation’s findings and Holder
et al. (2010). As theorized, the EFA (PAF) in this study supported the theorized
unidimensionality of the RPS. Unfortunately, Holder et al. offered no factor analytic

62
findings for the PBS (from which the RPS is derived). The PBS is derived from the 33-
item BMMRS, and Holder et al. used eleven items from multiple BMMRS dimensions,
with RPS representing three religious practices items from the eleven. Coupled with the
lack of factor analytic findings, it renders an inability to compare the findings from this
study.
Cleveland (2013) proceeded with a PAF, whereas this study observed criteria of
having four items to conduct a PAF. Like Cleveland’s correlational results (.24 to .33),
the inter-correlations between the three items were low. Additionally, both this study (α
= .61) and Cleveland’s (α = .54) demonstrated low Cronbach’s alpha values for the RPS.
The lack of items and low alpha values cast doubt on the utility of this scale to measure
religious practices. Items should be expanded (and perhaps some of the original items
replaced) to expand the psychometric properties and measurement insightfulness of the
RPS. It cannot be recommended in its present form based on the weight of available
evidence.
Gender Differences The role of gender was assessed in two ways relative to the instruments used in
this study. The first question about gender was to the overall averages of scale scores on
the various instruments: is there a significant difference in levels by gender on any
scales? The second question was one of the stability of the factor structures of the various
instruments across groups: did the same factor structure provide a good fit, and if so, to
what extent? As a reminder the RPS (only three items) and the SHS (poor fit for the
configural model) were not tested for invariance. The findings of these two questions are
summarized below.

63
Emotionality Activity and Sociability Temperament Survey (EAS)
The MANOVA results indicated an overall effect for gender on the student EAS
scores. Subsequent analyses examining the relationship of gender to the Sociability,
Anger, and Distress dimensions demonstrated statistically significant differences between
boys and girls on each dimension. Across all three dimensions, girls reported higher
levels of each dimension. When subjected to invariance testing, the student EAS scores
showed a statistically significant change in chi-square value between the metric (the least
stringent level of invariance examining the uniformity of factor loadings across groups)
and the configural (baseline) models. The statistically significant difference did not
support invariance at the metric (or factor loading) level, and subsequent levels of more
stringent invariance were not tested.
The Spiritual Well-Being Questionnaire (SWBQ)
The MANOVA results also indicated an overall effect for gender on the student
SWBQ scores for Personal, Environmental, and Transcendental dimensions. Subsequent
univariate analyses assessing the relationship between gender and scores on each of the
three scales revealed a statistically significant difference in boys and girls’ score on the
Transcendental and Personal dimensions but not on the Environmental dimension. In
both instances, girls reported a higher level. When subjected to invariance testing, the
SWBQ scores showed a statistically significant change in chi-square value between the
metric and the configural (baseline) models. The statistically significant difference did
not support invariance at the metric (or factor loading) level, and subsequent levels of
more stringent invariance were not tested.
Oxford Happiness Questionnaire – Short Form (OHQ-SF)

64
As a unidimensional measure yielding a single scale score, a univariate ANOVA
was used to assess for gender differences. There was a statistically significant difference
between the two genders with women reporting higher levels of happiness. For the OHQ,
the metric model exhibited adequate fit in relation to the configural model, and the
change in chi-square was not statistically significant. The change in CFI was also less
than 1, lending support to the existence of metric invariance across boys and girls for the
OHQ. Next, in addition to the factor loadings, the OHQ item intercepts were constrained
to be equal across groups to test for scalar, or intercept, invariance. Scalar invariance was
not supported for the gender groups, as the Δχ2 was statistically significant. None of the
modification indices suggested an item that, if freely estimated, would yield scalar
invariance.
Subjective Happiness Scale (SHS) and Religious Practices Scale (RPS)
ANOVAs were used to assess the relationship between gender and both SHS
scores and RPS scores. In both instances, there was a statistically significant main effect
for gender. Also in both instances, girls rated themselves more highly than boys on both
happiness and religious practices as measured by the SHS and RPS, respectively. Neither
of these scales was subjected due to invariance testing, as the SHS was only three items
(not ideal for CFA), and the RPS did not possess good configural invariance.
Spirituality, or Just Temperament?
The fourth research question brought the ultimate issue into focus. Does a child’s
spirituality and religious practices contribute to their sense of happiness, or is it really a
product of his or her temperament? To address this question, three measures of happiness
in the study (OHQ-SF, SHS, and Student FACES) were entered as dependent variables in

65
separate hierarchal multiple regression (HMR) models. Independent variables were
entered in blocks; the initial block contained demographic variables, the second block
included temperament (Student and Teacher EAS, and the final block included
spirituality measures (SWBQ and RPS). By looking at the difference in variance
explained by introducing a new block of variables, researchers can confirm or disconfirm
the statistical significance of each block of introduced variables.
Looking at the HMR results, an interesting picture emerges. In predicting OHQ-
SF, spirituality accounted for 23% of unique variance over and above Student EAS
(which accounted for 35%). The Personal, Environmental, and Transcendental domains
were found to be significant predictors of student happiness. When it came to predicting
SHS, student temperament explained 34% of the shared variance. Of the SWBQ factors,
only Personal spirituality significantly explained a sizable percent (14%) of the variance
in SHS after controlling for temperament. For the Student Faces scale, student
temperament explained 26% of the variance in Student Face Scale. Spirituality explained
6% of the shared variance in SHS after controlling for student temperament. The
personal and transcendental domains were significant predictors of Student Faces
happiness ratings.
Implications for Practice
A few of the instruments tested in this study show good promise for further use
with children. The FACES scale show promise, as it is fairly universal and
straightforward to administer. However, given the relative paucity of correlational and
predictive validity research, it should likely be used mostly in an exploratory capacity and
not in research studies. The OHQ-SF shows promise, but the fourth item has proven to

66
lack utility to most researchers. Continued revision of the fourth item is advised,
however the first three items seem to be helpful in assessing children’s happiness. The
SHS also finds the fourth item to be a source of weakness, but it fared better in this study
than in previous studies. The original item asked, “Some people are generally not very
happy. Although they are not depressed, they never seen as happy as they might be. To
what extent does this characterization describe you?” (Lyubomirsky & Lepper, 1999).
While this is clearly not developmentally appropriate for 4th to 6th grade students, the
simplified version used here – “I want to be happier” – may have lost some of the
original psychometric utility due to oversimplification. Like the OHQ-SF, researchers
need to consider the limitations that can correspond with going below the threshold of
four items in a scale. The SWBQ, although it yielded a three-factor solution here as
opposed to four in this study, seems worthy of use for 4th to 6th grade students. The
weight of existing research finds that the factors are fairly stable and perform reasonably
well.
Conversely, a few of the instruments seem less fruitful for research work with this
age cohort. The Student EAS has presented a fairly divergent factor structure across the
research literature. Given the iterations of development outlined in Chapter 2 above, it
seems that the instrument has always been plagued by questions over the correct number
of factors measured and the stability of how indicators load. To be fair, the field of
childhood temperament is a fractious one with dispute ongoing over the proper
dimensions that compose temperament (Strelau & Zawajzki, 2008). Researchers may do
well to use individual dimensions that have performed better across time. The RPS also
should be used with caution. Low factor loadings and reliability coupled with a relatively

67
small percentage of shared variance indicated that the RPS may be less than optimal for
use with this age cohort.
Application to South African Educational Context
Findings from this paper can help frame the existing discussion in South Africa
on how spirituality could be infused in a religiously and culturally diverse educational
context. There are voices in South Africa calling for spirituality to remain in schools in a
way that serves the totality of students (Jacobs, 2012). The social constructivist approach
to infusing spirituality in education proposed by Roux (2007) is in accord with the
findings of this paper. Religious and spiritual concepts and backgrounds could be
delivered in a constructivist manner, emphasizing parity and instrumental utility of
spirituality as part of a larger picture of well-being. Spirituality is seemingly of high
value in South Africa, and the broad, nonsectarian conceptualizations of spirituality
embedded in the study measures are informative.
Educators in South Africa would do well to look at the elements of spirituality
that showed impact on student happiness in this study. In particular, transcendence is a
useful concept. Schoolchildren can be taught about the value of transcendence in a non-
directive, nonsectarian manner. The social and emotional aspects of spirituality also
predicted student happiness. There is a large literature on social-emotional learning and
competencies in the UK and the USA that could be of assistance in aiding South African
educator to enhance this aspect of spirituality (and consequently, happiness).
Limitations of the Study
There are several limitations that must be considered when viewing the results of
this study. The first issue that readers should be aware of is a lack of generalizability.

68
Second, lack of researcher involvement in data collection leaves questions about data
quality. Third, some of the instruments proved to be problematic from a psychometric
perspective, especially the EAS instrument. Each of these concerns will be discussed in
greater detail below.
Regarding generalizability, the sample used here is small, not representative of
any population, and utilizes convenience sampling. While the sample is sufficient for
performing factor analytic work, the overall size is an issue in light of the fact that it is
not a representative sample. The sampling frame was the sum total of a miniscule portion
of South African schoolchildren, and no effort was made to match the sample to any
known demographic data. Any extrapolation of results to even broader South African
elementary school contexts must be made with caution and circumspection. The sample
here was generated on the criteria of having a few schools that self-selected into the
study. The researcher did not select them for their representativeness or for any other
strategic purpose.
Classroom teachers administered and collected the instrument protocols during
normal class hours. It is not clear the substance or amount of training that the teachers
received from the primary investigator or her team. While the research design met IRB
requirements of the primary investigator’s university, as a secondary research analysis, it
is unclear how the data were safeguarded for any bias in administration and collection.
While this is not likely a matter of serious concern, it is mentioned here because it cannot
truly be assessed.
The EAS, and to a lesser degree, the RPS, also are a concern for their dubious
psychometric properties. Regarding the EAS, this is hardly a new concern. As described

69
in Chapter 2, the development history of the EAS has resulted in several versions and
varying theorized factor structures (EAS, EASI, EASI-II, etc.). The version used in this
study was selected to attempt to replicate the one used by Holder et al. (2010). The
Holder et al. version included four domains (Emotionality, Activity, Sociability
(experimental), and Shyness) as outlined by Buss and Plomin (1984). However, the
version used here was not the Buss and Plomin version, but it was another iteration
designed for child self-report administration. It was composed of Emotionality, Activity,
and Sociability domains, with the Emotionality domain consisting of twelve items
(Activity and Sociability had only four apiece). It appears that these twelve items
represent three theorized sub-dimensions of Emotionality outlined by Buss and Plomin:
fearfulness, distress, and anger. The factor solution here identified factors approximating
the anger and distress sub-dimensions of Emotionality (in addition to Sociability). The
Sociability domain items were also a source of confusion, as it was unclear if they
actually represented items from the Shyness domain postulated in some EAS versions.
The unclear source and version of the full set of EAS indicators is problematic in
comparing to other studies utilizing the EAS. The RPS also should be used with caution
as it lacks explanatory power as it pertains to happiness, and its items yield low factor
loadings.
Application to School Counseling Practice
Spirituality has long been theorized and proven to be a source of resilience across
ecological levels of a child’s existence (Dillen, 2012; Werner, 1984). Resilience and
social-emotional learning are the province of school counselors, and as such, school
counselors should be attuned to the types and levels of spirituality that students possess.

70
This study extends the tradition of findings linking spirituality and resilience (as indicated
by measures of children’s happiness). The contribution of spirituality to happiness could
not be reduced to variations in children’s temperament. This finding opens the door for
school counselors to build interventions that enhance students’ ability to make meaning
as well as to enhance their sense of connectedness and transcendence.
School counselors undoubtedly have some reticence about addressing spirituality
with children due to the misconception that discussing religion or spirituality in public
schools is legally prohibited (MacDonald, 2004). However, the nonsectarian framework
for spirituality provides broad leeway for school counselors to use this empirically proven
asset to healthy student development (James, Fine, & Turner, 2012). Furthermore, the
multicultural mandate of the ASCA Ethical Standards for School Counselors (2010) that
states ethical school counselors must pay attention to student and family religious and
spiritual concerns. Due to established links the positive benefits of spirituality for broad
health indicators (mental/physical health, resiliency, and reduced risk behaviors), the
school counseling profession has increasingly called for student spirituality to be
integrated within core curricula (Briggs & Rayle, 2005; Sink & Richmond, 2004).
Recommendations for Future Research
Researchers should take up the issue of validity (both convergent and divergent)
in future research using the instruments in this study. The instruments should be able to
correlate highly with areas of theorized influence to indicate convergent validity.
Divergent (or discriminant) validity tests for the absence of a relationship with another
variable or construct, and it affirms by validity by showing very low or no correlation
with a construct at theorized odds with the one in question. Increasing use of regression

71
models should be used to reveal patterns of predictive influence on subsets of variables
and prosocial outcomes.
Confirmatory factor analysis is also an under utilized approach in testing the
psychometric properties of the instruments in this study. As data for the Happiness &
Meaning-Making Project continue to grow in number of respondents and countries
surveyed, CFA testing would be especially valuable. It would be of great empirical
interest to demonstrate if there are factor structures that provide a good fit to a broad
diversity of students. If such a result could be reached, it would provide a sketch of what
might be a universal way to conceptualize developmental spirituality for intermediate
elementary-aged students.
Toward the end of universality and international comparison, invariance testing
could be used to see how and to what extent one sample of students possesses a similar
factor structure. In current spirituality research, cross-national comparisons are rare for
children’s spirituality. The Happiness & Meaning-Making Project provides a useful
study design for this task. Data are now available for students from multiple countries,
and researchers could make side-by-side comparisons of invariance on a factor structure
established by EFA. Instruments could also be modified based on comparisons from
cross-national samples of students.
Finally, researchers should consider whether there are certain spirituality profiles
that are predictive of various prosocial and antisocial outcomes. Discriminant analysis
(not to be confused with discriminant validity) is a tool that can take a selection of
predictors and examine for combinations within them that predict the probability of group
membership (associated with possessing/not possessing a certain status or trait). This

72
would help school counselors develop interventions that could isolate key spirituality
dimensions for interventions based on their ability to predict certain statuses or traits.
The broad point should also be made that these instruments need to be collected along
with a broader set of demographic and behavioral variables to facilitate this kind of work.
Conclusion
The series of research questions began with the baseline of establishing the
psychometric qualities of the study instruments. The OHQ-SF, SHS, and SWBQ all
proved to be useful measures for assessing elementary-age children. They demonstrated
adequate factorial validity and reliability. The RPS and EAS both proved to be
problematic, but in different ways. The RPS did not register adequate psychometric
properties to recommend it for use. For the EAS, the issue was a muddled factor
structure relative to unclear hodgepodge of EAS versions; it did not faithfully replicate
factor structure congruent with a previously published EAS version. The single-item
FACES scale is good for quick, one-time measures of affect or mood, but it is not useful
as a static indicator in scientific work.
The results of the remaining research questions were more straightforward.
Regarding research question two, the overall trend of summative scale scores across
instruments was for girls to show a higher level of spirituality or happiness than boys.
Upon using CFA for conducting invariance tests, the factor structure of most instruments
(with the exception of OHQ-SF) varied across boys and girls. This finding addressed the
third research question. Finally, the fourth and culminating research question looked at
spirituality’s unique contribution to students’ appraisals of their happiness. On all of the
happiness outcomes, spirituality factor scores proved to largely have some statistically

73
significant impact on perceived happiness levels. These results show promise for
spirituality as a source of resilience and offer a challenge to researchers to better
understand the differential spiritual development of elementary-aged boys and girls.

74
References
Abdel-Khalek, A. M., & Lester, D. (2012). Constructions of religiosity, subjective
well-being, anxiety, and depression in two cultures: Kuwait and USA.
International Journal of Social Psychiatry, 58(2), 138-145.
Aghili, M., & Kumar, G. (2008). Relationship between religious attitude and
happiness among professional employees. Journal of The Indian
Academy of Applied Psychology, 34, 66-69.
Andrews, F. M., & Withey, S. B. (1976). Social indicators of well-being:
Americans’ perceptions of life quality. New York, NY: Plenum Press.
Argyle, M., & Crossland, J. (1987). The dimensions of positive emotions. British
Journal of Social Psychology, 26, 127–137.
Argyle, M., Martin, M., & Crossland, J. (1989). Happiness as a function of
personality and social encounters. In J. P. Forgas, & J. M. Innes (Eds.),
Recent advances in social psychology: An international perspective (pp.
189–203). North-Holland: Elsevier.
Barber, B. K. (2013). Annual research review: The experience of youth with
political conflict - challenging notions of resilience and encouraging
research refinement. Journal of Child Psychology & Psychiatry, 54(4),
461-473.
Beechum, N. O. (2012). Teaching adolescents to become learners. The role of
noncognitive factors in shaping school performance: A critical literature
review. Chicago, IL: University of Chicago Consortium on Chicago School
Research.

75
Bentler, P. M. (1990). Comparative fit indexes in structural models. Psychological
Bulletin, 107, 238–246.
Berk, L. E. (2006). Development through the lifespan. Needham Heights, MA:
Allyn and Bacon.
Boer, F., & Westenberg, P. (1994). The factor structure of the Buss and Plomin
EAS Temperament Survey (Parental Ratings) in a Dutch sample of
elementary school children. Journal Of Personality Assessment, 62(3),
537-551.
Bornstein, M. H., Hahn, C., & Suwalsky, J. T. D. (2013). Developmental
pathways among adaptive functioning and externalizing and internalizing
behavioral problems: Cascades from childhood into adolescence. Applied
Developmental Science, 17(2), 76-87.
Boström, P. P., Broberg, M. M., & Hwang, C. P. (2010). Different, difficult or
distinct? Mothers' and fathers' perceptions of temperament in children with
and without intellectual disabilities. Journal of Intellectual Disability
Research, 54(9), 806-819.
Bould, H., Joinson, C., Sterne, J., & Araya, R. (2013). The Emotionality Activity
Sociability Temperament Survey: Factor analysis and temporal stability in
a longitudinal cohort. Personality And Individual Differences, 54(5), 628-
633.
Bregman, L. (2006). Spirituality: A glowing and useful term in search of meaning.
OMEGA, 53(1-2), 5-26.
Briggs, M., & Rayle, A. (2005). Incorporating spirituality into core counseling courses:

76
Ideas for classroom application. Counseling and Values, 50, 63-75.
Bronfenbrenner, U. (1974). Developmental research, public policy, and the ecology of
childhood. Child Development, 45(1), 1-5.
Bronfenbrenner, U. (1976). The experimental ecology of education. Educational
Researcher, 5(9), 5-15.
Bronfenbrenner, U. (1977). Toward an experimental ecology of human development.
American Psychologist, 32(7), 513-531.
Bronfenbrenner, U. (1979). The ecology of human development: Experiments by
nature and design. Cambridge, MA: Harvard University Press.
Bronfenbrenner, U., & Morris, P. A. (2006). The bioecological model of human
development. In R.M. Lerner & W. Damon (Eds.), Handbook of child
psychology (6th edition), (pp. 793–828). Hoboken, NJ: John Wiley & Sons.
Buss A. H. & Plomin, R. (1975) A temperament theory of personality
development. Wiley-Interscience, Oxford.
Buss, A. H., & Plomin, R. (1984). Temperament: Early developing personality
traits. Hillsdale: Lawrence Erlbaum Associates.
Buss, A. H., & Plomin, R. (1986). The EAS approach to temperament. In R.
Plomin & J. Dunn (Eds.), The study of temperament: Changes,
continuities and challenges. Hillsdale, NJ: Lawrence Erlbaum Associates
Inc.
Byrne, B. M. (2004). Testing for multigroup invariance using AMOS graphics: A
road less traveled. Structural Equation Modeling, 11, 272–300.
Byrne, B. M. (2009). Structural equation modeling with AMOS: Basic concepts,

77
applications, and programming. New York: Routledge.
Byrne, B. M., Shavelson, R. J., & Muthén, B. (1989). Testing for the equivalence of
factor covariance and mean structures: The issue of partial measurement
invariance. Psychological Bulletin, 105, 456-466.
Cattell, R. B. (1966). The scree test for the number of factors. Multivariate
Behavioral Research, 1, 245-276.
Cheek, J. M., & Buss, A. H. (1981). Shyness and sociability. Journal of
Personality and Social Psychology, 41, 330-339.
Cheung, G. W., & Rensvold, R. B. (2002). Evaluating goodness-of-fit indexes for
testing measurement invariance. Structural Equation Modeling, 9, 233–
255.
Cleveland, R. E. (2014). Psychometric reanalysis of happiness, temperament,
and spirituality scales with elementary-age children. (Unpublished doctoral
dissertation). Seattle Pacific University, WA.
Costello, A. B., & Osborne, J. W. (2005). Best practices in exploratory factor
analysis: Four recommendations for getting the most from your analysis.
Practical Assessment, Research, & Evaluation,10(7). Available online:
http://pareonline.net/getvn.asp?v=10&n=7
Crawford, E., Wright, M., & Masten, A. S. (2006). Resilience and spirituality in
youth. In E. C. Roehlkepartain, P. E., King, L. Wagener., & P. L. Benson
(Eds.), The handbook of spiritual development in childhood and
adolescence (pp. 355-370). Thousand Oaks, CA: Sage.
78
Cruise, S., Lewis, C., & McGukin, C. (2006). Internal consistency, reliability, and
temporal stability of the Oxford Happiness Questionnaire short-form: Test- retest data over two weeks. Social Behavior and Personality, 34(2), 123-
126.
Curran, P. J., West, S. G., & Finch, J. F. (1996). The robustness of test statistics
to nonnormality and specification error in confirmatory factor analysis.
Psychological Methods, 1, 16–29.
de Jager Meezenbroek, E., Garssen, B., van den Berg, M., van Dierendonck, D.,
Visser, A., & Schaufeli, W. B. (2012). Measuring spirituality as a universal
human experience: A review of spirituality questionnaires. Journal of
Religion And Health, 51(2), 336-354.
DeNeve, K. M., & Cooper, H. (1998). The happy personality: A meta-analysis of
137 personality traits and subjective well-being. Psychological Bulletin,
124(2), 197-229.
Diener, E. (2000). Subjective well-being: the science of happiness, and a
proposal for a national index. American Psychologist, 55, 34–43.
Dillen, A. (2012). The resiliency of children and spirituality: A practical theological
reflection. International Journal of Children’s Spirituality, 17(1), 61-75.
Dimitrov, D. M. (2010). Testing for factorial invariance in the context of construct
validation. Measurement and Evaluation in Counseling and Development,
43(2), 121-149.
Elbertson, N. A., Brackett, M. A., & Weissberg, R. P. (2009). School-based social
and emotional learning (SEL) programming: Current perspectives. In A.

79
Hargreaves, A. Lieberman, M. Fullan, & D. Hopkins (Eds.), Second
international handbook of educational change (pp. 1017-1032). New York,
NY: Springer.
Extremera, N., Salguero, J., & Fernández-Berrocal, P. (2011). Trait meta-mood and
subjective happiness: A 7-week prospective study. Journal of Happiness Studies,
12(3), 509-517.
Fabrigar, L. R., & Wegener, D. T. (2012). Exploratory factor analysis. New York,
NY: Oxford University Press.
Fabrigar, L. R., Wegener, D. T., MacCallum, R. C., & Strahan, E. J. (1999).
Evaluating the use of exploratory factor analysis in psychological research.
Psychological Methods, 4, 272-299.
Farrington, C. A., Roderick, M., Allensworth, E., Nagaoka, J., Keyes, T. S.,
Johnson, D. W., & Beechum, N. O. (2012). Teaching adolescents to
become learners. The role of noncognitive factors in shaping school
performance: A critical literature review. Chicago, IL: University of Chicago
Consortium on Chicago School Research.
Fetzer Institute (1999). Multidimensional measurement of
religiousness/spirituality for use in health research: A report of the Fetzer
Institute/National Institute on Aging Working Group. Kalamazoo, MI: John
E. Fetzer Institute.
Field, A. (2013). Discovering statistics using SPSS (4th ed.). Thousand Oaks,
CA: Sage.
Gomez, R., & Fisher, J. W. (2003). Domains of spiritual well-being and

80
development and validation of the Spiritual Well-Being Questionnaire.
Personality and Individual Differences, 35(8), 1975-1991.
Gomez, R., & Fisher, J. W. (2005a). Item response theory analysis of the spiritual
well-being questionnaire. Personality and Individual Differences, 38(5),
1107-1121.
Gomez, R., & Fisher, J. W. (2005b). The spiritual well-being questionnaire: Testing
for model applicability, measurement and structural equivalencies, and
latent mean differences across gender. Personality and Individual
Differences, 39(8), 1383-1393.
Hadinezhad, H., & Zaree, F. (2009). Reliability, validity, and normalization of the
Oxford Happiness Questionnaire. Psychological Research, 12(1-2), 62-77.
Halama, P., Martos, T., & Adamovová, L. (2010). Religiosity and well-being in
Slovak and Hungarian student samples: The role of personality traits.
Studia Psychologica, 52(2), 101-116.
Hayton, J. C., Allen, D. G., & Scarpello, V. (2004). Factor retention decisions in
exploratory factor analysis: A tutorial on parallel analysis. Organizational
Research Methods, 7(2), 191-205.
Hills, P., & Argyle, M. (2002). The Oxford Happiness Questionnaire: A compact
scale for the measurement of psychological well-being. Personality and
Individual Differences, 33, 1073-1082.
Holder, M. D., Coleman, B., & Wallace, J. M. (2010). Spirituality, religiousness,
and happiness in children aged 8–12 years. Journal of Happiness Studies,
11(2), 131-150.

81
Holder, M. D., Coleman, B., & Singh, K. (2012). Temperament and happiness in
children in India. Journal Of Happiness Studies, 13(2), 261-274.
Holder, M. D., & Klassen, A. (2010). Temperament and happiness in children.
Journal Of Happiness Studies, 11(4), 419-439.
Horn, J. L. (1965). A rationale and test for the number of factors in factor
analysis. Psychometrika, 30, 179-185.
Hu, L. T., & Bentler, P. M. (1999). Cutoff criteria for fit indexes in covariance
structure analysis: Conventional criteria versus new alternatives.
Structural Equation Modeling, 6, 1–55.
Idler, E. L., Musick, M. A., Ellison, C. G., George, L. K., Krause, N., Ory, M. G.,
Pargament, K. I., Powell, L. H., Underwood, L. G., & Williams, D. R. (2003).
Measuring multiple dimensions of religion and spirituality for health
research: Conceptual background and findings from the 1998 General
Social Survey. Research on Aging, 25(4), 327-365.
Jacobs, A. C. (2012). South African teachers’ views on the inclusion of spirituality
education in the subject Life Orientation. International Journal of Children’s
Spirituality, 17, 235-253.
James, A. G., Fine, M. A., & Turner, L. J. (2012). An empirical examination of youths'
perceptions of spirituality as an internal developmental asset during adolescence.
Applied Developmental Science, 16, 181-194.
Jones, L. (2012). Measuring resiliency and its predictors in recently discharged
foster youth. Child & Adolescent Social Work Journal, 29(6), 515-533.
Jöreskog, K. G. (1971). Simultaneous factor analysis in several populations.

82
Psychometrika, 36, 409–426.
Kaiser, H. F. (1960). The application of electronic computers to factor analysis.
Educational and Psychological Measurement, 20, 141-151.
Kashdan, T. B. (2004). The assessment of subjective well-being (issues raised
by the Oxford Happiness Questionnaire). Personality and Individual
Differences, 36, 1225-1232.
Kashdan, T., & Yuen, M. (2007). Whether highly curious students thrive academically
depends on perceptions about the school learning environment: A study of Hong
Kong adolescents. Motivation and Emotion, 31(4), 260-270.
Kim, S., & Esquivel, G. B. (2011). Adolescent spirituality and resilience: Theory,
research, and educational practices. Psychology in the Schools, 48(7),
755-765.
King, M. F., Renó, V. F., & Novo, E. M. L. M. (2014). The concept, dimensions and
methods of assessment of human well-being within a sociological context:
A literature review. Social Indicators Research,116(3), 681-698.
Levine, D. W., Kaplan, R. M., Kripke, D. F., Bowen, D. J., Naughton, M. J., &
Shumaker, S. A. (2003). Factor structure and measurement invariance of
the women’s health initiative insomnia rating scale, Psychological
Assessment, 15, 123–136.
Lewis, C., Maltby, J., & Day, L. (2005). Religious orientation, religious coping and
happiness among UK adults. Personality and Individual Differences, 38(5),
1193-1202.
Luthar, S. S., & Cicchetti, D. (2000). The construct of resilience: A critical

83
evaluation and guidelines for future work. Child Development, 71(3), 543-
562.
Lyubomirsky, S., & Lepper, H. (1999). A measure of subjective happiness:
Preliminary reliability and construct validation. Social Indicators Research,
46, 137-155.
Lyubomirsky, S., & Lepper, H. (1999b). Subjective Happiness Scale [Database
record]. Retrieved from PsychTESTS. Retrieved from:
http://psychnet.apa.org/doi/10.1037/t0158 8-000
MacDonald, P. M., Kirkpatrick, S. W., & Sullivan, L. A. (1996). Schematic
drawings of facial expressions for emotion recognition and interpretation
by preschool-aged children. Genetic, Social, and General Psychology
Monographs, 122(4), 373-388.
MacDonald, D. (2004). Collaborating with students' spirituality. Professional School
Counseling, 7, 293-300.
Masi, G., Mucci, M., Favilla, L., Brovedani, P., Millepiedi, S., & Perugi, G. (2003).
Temperament in adolescents with anxiety and depressive disorders and in
their families. Child Psychiatry and Human Development, 33, 245–259.
Masten, A. S., Best, K. M., & Garmezy, N. (1990). Resilience and development:
Contributions from the study of children who overcome adversity.
Development and Psychopathology, 2, 425–444.
Masten, A. S., & Coatsworth, J. D. (1998). The development of competence in
favorable and unfavorable environments. American Psychologist, 53(2), 205-
220.
84
Masten, A. S. (2011). Resilience in children threatened by extreme adversity:
Frameworks for research, practice, and translational synergy. Development
and Psychopathology, 23(2), 493-506.
Mathiesen, K. S., & Tambs, K. (1999). The EAS Temperament Questionnaire—
factor structure, age trends, reliability, and stability in a Norwegian sample.
Journal of Child Psychology and Psychiatry, 40(3), 431-439.
Mattei, D., & Schaefer, C. E. (2004). An investigation of validity of the Subjective
Happiness Scale. Psychological Reports, 94(1), 288-290.
Messick, S. (1989). Validity. In R. L. Linn (Ed.), Educational measurement (3rd
ed., pp. 13–103). New York, NY: American Council on Education.
Messick, S. (1995). Validity of psychological assessment: Validation of
inferences from persons’ responses and performances as scientific inquiry
into score meaning. American Psychologist, 50, 741–749.
Mnyaka, M., & Motlhabi, M. (2005). The African concept of Ubuntu/Botho and its
socio-moral significance. Black Theology: An International Journal, 3(2),
215-237.
Møller, V. (2013). South African quality of life trends over three decades, 1980-
2010. Social Indicators Research, 113(3), 915-940.
Moodley, T., Esterhuyse, K. G. F., & Beukes, R. B. I. (2012). Factor analysis of the
Spiritual Well-being Questionnaire using a sample of South African
Adolescents. Religion & Theology, 19, 122-151.
Mvududu, N. H., & Sink, C. A. (2013). Factor analysis in counseling research and
practice. Counseling Outcome Research and Evaluation, 4(2), 75-98.

85
Nærde, A., Røysamb, E., & Tambs, K. (2004). Temperament in adults-reliability,
stability, and factor structure of the EAS Temperament Survey. Journal of
Personality Assessment, 82(1), 71-79.
Nelson, S. K., & Lyubomirsky, S. (2014). Finding happiness. In M. M. Tugade, M.
N. Shiota, L. D. Kirby (Eds.), Handbook of positive emotions (pp. 275-
293). New York, NY: Guilford Press.
Pargament, K. I. (2013). Spirituality as an irreducible human motivation and process. The
International Journal for the Psychology of Religion, 23, 271-281.
Payton, J., Weissberg, R. P., Durlak, J. A., Dymnicki, A. B., Taylor, R. D.,
Schellinger, K. B., & Pachan, M. (2008). The positive impact of social and
emotional learning for kindergarten to eighth-grade students: Findings
from three scientific reviews. Chicago, IL: Collaborative for Academic,
Social, and Emotional Learning. Retrieved from
http://www.lpfch.org/sel/casel-narrative.pdf
Pett, M. A., Lackey, N. R., & Sullivan, J. J. (2003). Making sense of factor analysis:
The use of factor analysis for instrument development in health care
research. Thousand Oaks, CA: Sage.
Raftopoulos, M., & Bates, G. (2011). 'It's that knowing that you are not alone':
The role of spirituality in adolescent resilience. International Journal of
Children's Spirituality, 16, 151-167.
Rezvan, S. S., Ahmadi, S. A., & Abedi, M. R. (2006). The effects of
metacognitive training on the academic achievement and happiness of
Esfahan University conditional students. Counselling Psychology

86
Quarterly, 19(4), 415-428.
Robbins, M., Francis, L. J., & Edwards, B. (2008). Prayer, personality and
happiness: A study among undergraduate students in Wales. Mental Health, Religion & Culture, 11(1), 93-99.
Robbins, M., Francis, L. J., & Edwards, B. (2010). Happiness as stable
extraversion: Internal consistency reliability and construct validity of the Oxford Happiness Questionnaire among undergraduate students. Current Psychology: A Journal For Diverse Perspectives on Diverse Psychological Issues, 29(2), 89-94.
Roodt, V. (2014). On public happiness. South African Journal of Philosophy,
33(4), 459-471.
Rothbart, M. K., & Bates, J. E. (1998). Temperament. In W. Damon (Ed.),
Handbook of child psychology, Vol. 3. Social, emotional and personality development (5th ed.) (pp. 105-176). New York: John Wiley.
Rothbart, M. K., & Derryberry, D. (2000). Temperament in children. Presented as a State
of the Art lecture at the 26th International Congress of Psychology, July, 2000, Stockholm, Sweden. Retrieved from http://www.bowdoin.edu/~sputnam/rothbart- temperament-questionnaires/cv/publications/pdf/2002_Temp_%20in_Children _Rothbart-Derryberry.pdf.
Roux, C. (2007). Hermeneutics and religion teaching and learning in the context of social constructivism. Scriptura, 96, 469-485.
Rowe, D. C., & Plomin, R. (1977). Temperament in early childhood. Journal of
Personality Assessment, 41(2), 150-156.

87
Rowold, J. (2011). Effects of spiritual well-being on subsequent happiness,
psychological well-being, and stress. Journal of Religion and Health,
50(4), 950-963.
Scholastic and the Bill & Melinda Gates Foundation. (2014). Primary sources:
America’s teachers on teaching in an era of change (3rd ed.). Seattle, WA:
Bill & Melinda Gates Foundation. Retrieved from
http://www.scholastic.com/primarysources/PrimarySources3rdEditionWith
Appendix.pdf
Seo, M., Sink, C. A., & Cho, H. (2011). Korean version of the Life Perspectives
Inventory: Psychometric properties and implications for high school
counseling. Professional School Counseling, 15(1), 15-33.
Shiner, R. L. (2012). The impact of temperament on child development: Comments on
Rothbart, Kagan, Eisenberg, and Schermerhorn and Bates. Rev ed. Rothbart MK,
topic ed. In: Tremblay, RE, Barr RG, Peters RDeV, eds. Encyclopedia on Early
Childhood Development [online]. Montreal, Quebec: Centre of Excellence for
Early Childhood Development and Strategic Knowledge Cluster on Early Child
Development; 2012: 1-5. Retrieved from: http://www.child- encyclopedia.com/temperament/according-experts/impact-temperament-child- development-comments-rothbart-eisenberg-kagan
Accessed November 20, 2015
Singh, K. (2009). NEO-PI-R factor structure in college students. Journal of the
Indian Academy of Applied Psychology, 35(1), 17-25.
Sink, C. A., Blackshire, A., Osterdahl, S. & Hartman, D. (2015). Happiness,

88
spiritual well-being, and temperament in South African elementary-age
children. (Unpublished manuscript).
Sink, C. A., & Devlin, J. M. (2011). Student spirituality and school counseling:
Issues, opportunities, and challenges. Counseling and Values, 56, 130-148.
Sink, C. A., & Hyun, J. (2012). A comprehensive review of research on child and
adolescent spirituality: Evidence for inclusion of spirituality in school
counseling. Journal of Asian Pacific Counseling.
Sink, C. A., Kim, D., Park, S., & Hyun, J. (2014). Happiness, spiritual well-being,
and temperament in South Korean elementary-age children. (Unpublished
manuscript).
Sink, C. A., & Richmond, L. J. (2004). Introducing spirituality to professional school
counseling. Professional School Counseling, 7, 291-292.
Smith, C. (2003). Theorizing religious effects among American adolescents.
Journal for the Scientific Study of Religion, 42(1): 17-30.
Steiger, J. H. (1990). Structural model evaluation and modification: An interval
estimation approach. Multivariate Behavioral Research, 25, 173–180.
Tse, M., Leung, R., & Ho, S. (2012). Pain and psychological well-being of older
persons living in nursing homes: An exploratory study in planning patient-
centered intervention. Journal of Advanced Nursing, 68(2), 312-321.
Tucker, L. R., & Lewis, C. (1973). A reliability coefficient for maximum likelihood
factor analysis. Psychometrika, 38, 1–10.
Tutu, D. M. (1999). No future without forgiveness. New York, NY: Doubleday.
Ungar, M., Ghazinour, M., & Richter, J.ö. (2013). Annual research review: What

89
is resilience within the social ecology of human development? Journal of
Child Psychology & Psychiatry, 54(4), 348-366.
von Bertalanffy, L. (1968). General systems theory: Foundations, development,
applications. NY: George Braziller.
Werner, E. E. (1984). Resilient children. Young Children, 40(1), 68-72.
Westaway, M. S., Olorunju, S. S., & Rai, L. J. (2007). Which personal quality of
life domains affect the happiness of older South Africans? Quality of Life
Research, 16(8), 1425-1438.
Windle, M. (1989). Temperament and personality: An exploratory interinventory
study of the DOTS—R, EASI—II, and EPI. Journal of Personality
Assessment, 53(3), 487-501.

90
Appendix
TheHappinessandMeaningMakingProject(2014)STUDENTQUESTIONS
Name:__________________________________ IamaGIRLoraBOY(circleone) GradeLevel:4th5th6thgrade(circleone)
Circlethefacethatshowshowyouusuallyfeel.
VeryUnhappy VeryHappyDirections:ThisisNOTatest.Thesequestionsaremeanttoaskaboutyourlife.ThereareNOrightorwronganswers.Eachquestionasksyoutocircleanumberthatbestshowshowmuchyouagreeordisagree.EXAMPLEIfyouusuallylikeanimals,butdon’tloveanimals,circle“4agree,”likethis:1 Iloveanimals 1Strongly
disagree2disagree
3Notsure 4Agree 5StronglyAgree
Ifyouchangeyourmindaboutananswer,justcrossitoutandcirclethenewanswer,likethis.

91
1 Iloveanimals 1Strongly
disagree2disagree
3Notsure 4Agree 5StronglyAgree

92
1 Iloveotherpeople
1Stronglydisagree
2disagree
3Notsure 4Agree 5StronglyAgree
2 IfeelclosetoGod
1Stronglydisagree 2disagree 3Notsure 4Agree 5StronglyAgree
3 Iforgiveotherpeople
1Stronglydisagree 2disagree 3Notsure 4Agree 5StronglyAgree
4 Ienjoynature
1Stronglydisagree 2disagree 3Notsure 4Agree 5StronglyAgree
5 Ireallyknowmyself
1Stronglydisagree 2disagree 3Notsure 4Agree 5StronglyAgree
6 IworshipGod
1Stronglydisagree 2disagree 3Notsure 4Agree 5StronglyAgree
7 IfeeljoyouswhenIamoutside
1Stronglydisagree 2disagree 3Notsure 4Agree 5StronglyAgree
8 Itrustotherpeople
1Stronglydisagree 2disagree 3Notsure 4Agree 5StronglyAgree
9 Ilearnaboutmyself
1Stronglydisagree 2disagree 3Notsure 4Agree 5StronglyAgree
10 Ilikebeinginnature
1Stronglydisagree 2disagree 3Notsure 4Agree 5StronglyAgree
11 IfeelclosetoGod
1Stronglydisagree 2disagree 3Notsure 4Agree 5StronglyAgree

93
12 Ifeelpeacefulinnature
1Stronglydisagree
2disagree
3Notsure 4Agree 5StronglyAgree
13 IamatpeacewithGod
1Stronglydisagree 2disagree 3Notsure 4Agree 5StronglyAgree
14 Iamjoyful
1Stronglydisagree 2disagree 3Notsure 4Agree 5StronglyAgree
15 Ipray
1Stronglydisagree 2disagree 3Notsure 4Agree 5StronglyAgree
16 Iampeaceful
1Stronglydisagree 2disagree 3Notsure 4Agree 5StronglyAgree
17 Irespectotherpeople
1Stronglydisagree 2disagree 3Notsure 4Agree 5StronglyAgree
18 Ihavemeaninginlife
1Stronglydisagree 2disagree 3Notsure 4Agree 5StronglyAgree
19 Iamkindtootherpeople
1Stronglydisagree 2disagree 3Notsure 4Agree 5StronglyAgree
20 Ifeelspecialinnature
1Stronglydisagree 2disagree 3Notsure 4Agree 5StronglyAgree
21 Igotoaplaceofworshiplikeachurcheveryweek
1Stronglydisagree 2disagree 3Notsure 4Agree 5StronglyAgree
22 Iprayormeditatebymyselfalot
1Stronglydisagree 2disagree 3Notsure 4Agree 5StronglyAgree

94
23 IfeelhappywiththewayIam
1Stronglydisagree
2disagree
3Notsure 4Agree 5StronglyAgree
24 Ifeelthatlifeisrewarding
1Stronglydisagree 2disagree 3Notsure 4Agree 5StronglyAgree
25 Ifeelcomfortablewithmylife
1Stronglydisagree 2disagree 3Notsure 4Agree 5StronglyAgree
26 IthinkIlookattractive
1Stronglydisagree 2disagree 3Notsure 4Agree 5StronglyAgree
27 Iseebeautyaroundme
1Stronglydisagree 2disagree 3Notsure 4Agree 5StronglyAgree
28 IhavetimetodowhatIenjoy
1Stronglydisagree 2disagree 3Notsure 4Agree 5StronglyAgree
29 Ipayattention
1Stronglydisagree 2disagree 3Notsure 4Agree 5StronglyAgree
30 Ihavehappymemoriesofthepast
1Stronglydisagree 2disagree 3Notsure 4Agree 5StronglyAgree
31 Iamusuallyhappy
1Stronglydisagree 2disagree 3Notsure 4Agree 5StronglyAgree
32 IamhappierthatmostkidsIknow
1Stronglydisagree 2disagree 3Notsure 4Agree 5StronglyAgree
33 Ienjoylifemostofthetime
1Stronglydisagree 2disagree 3Notsure 4Agree 5StronglyAgree
34 Ienjoylifemostofthetime
1Stronglydisagree 2disagree 3Notsure 4Agree 5StronglyAgree
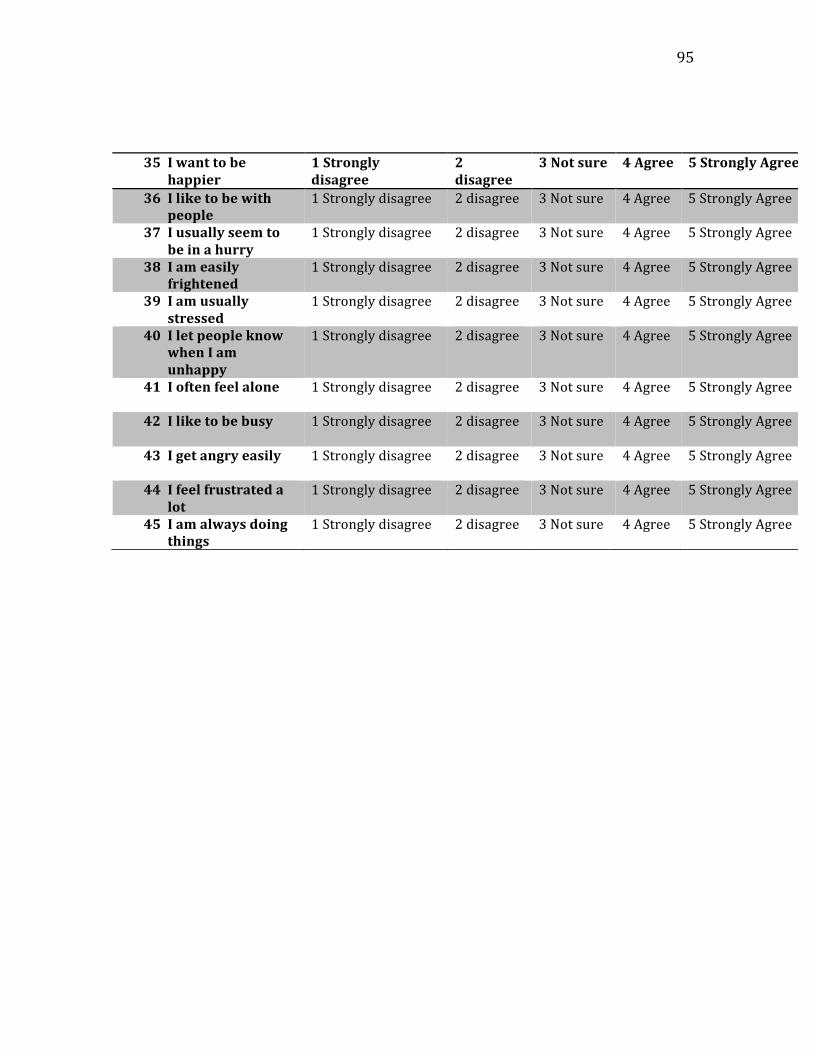
95
35 Iwanttobehappier
1Stronglydisagree
2disagree
3Notsure 4Agree 5StronglyAgree
36 Iliketobewithpeople
1Stronglydisagree 2disagree 3Notsure 4Agree 5StronglyAgree
37 Iusuallyseemtobeinahurry
1Stronglydisagree 2disagree 3Notsure 4Agree 5StronglyAgree
38 Iameasilyfrightened
1Stronglydisagree 2disagree 3Notsure 4Agree 5StronglyAgree
39 Iamusuallystressed
1Stronglydisagree 2disagree 3Notsure 4Agree 5StronglyAgree
40 IletpeopleknowwhenIamunhappy
1Stronglydisagree 2disagree 3Notsure 4Agree 5StronglyAgree
41 Ioftenfeelalone
1Stronglydisagree 2disagree 3Notsure 4Agree 5StronglyAgree
42 Iliketobebusy
1Stronglydisagree 2disagree 3Notsure 4Agree 5StronglyAgree
43 Igetangryeasily
1Stronglydisagree 2disagree 3Notsure 4Agree 5StronglyAgree
44 Ifeelfrustratedalot
1Stronglydisagree 2disagree 3Notsure 4Agree 5StronglyAgree
45 Iamalwaysdoingthings
1Stronglydisagree 2disagree 3Notsure 4Agree 5StronglyAgree

96
46 Ifeelnervousaboutthingsthathappeneveryday
1Stronglydisagree
2disagree
3Notsure 4Agree 5StronglyAgree
47 Iusuallyfeelconfident
1Stronglydisagree 2disagree 3Notsure 4Agree 5StronglyAgree
48 Igetannoyedeasily
1Stronglydisagree 2disagree 3Notsure 4Agree 5StronglyAgree
49 IpanicwhenIgetscared
1Stronglydisagree 2disagree 3Notsure 4Agree 5StronglyAgree
50 Iliketoworkwithotherpeople
1Stronglydisagree 2disagree 3Notsure 4Agree 5StronglyAgree
51 Igetupseteasily
1Stronglydisagree 2disagree 3Notsure 4Agree 5StronglyAgree
52 Ihavealotofenergy
1Stronglydisagree 2disagree 3Notsure 4Agree 5StronglyAgree
53 Ittakesalottoupsetme
1Stronglydisagree 2disagree 3Notsure 4Agree 5StronglyAgree
54 Ionlyhaveafewfears
1Stronglydisagree 2disagree 3Notsure 4Agree 5StronglyAgree
55 Iwouldratherspendtimewithpeoplethandoanythingelse
1Stronglydisagree 2disagree 3Notsure 4Agree 5StronglyAgree