Embed Size (px)
Citation preview

Spinifex State College - Mount Isa Queensland State School Reporting 2015 School Annual Report
Postal address PO Box 1355 Mount Isa 4825
Phone (07) 4740 1111
Fax (07) 4743 9102
Email [email protected]
Webpages Additional reporting information pertaining to Queensland state schools is located on the My School website and the Queensland Government data website.
Contact person Denise Kostowski, Principal
SENIOR CAMPUS JUNIOR CAMPUS RESIDENTIAL CAMPUS
Head of Campus: Phil Sweeney
145-163 Abel Smith Parade
PO Box 1729
MOUNT ISA QLD 4825
Phone: 4744 7222
Email: [email protected]
Principal: Denise Kostowski
6-12 Fifth Avenue
PO Box 1355
MOUNT ISA QLD 4825
Phone: 4740 1111
Email: [email protected]
Head of Campus: Cath Jeffrey
83-85 Transmission Street
PO Box 1842
MOUNT ISA QLD 4825
Phone: 4745 4333
Email: [email protected]
Principal’s foreword
Introduction
Spinifex State College – Mount Isa opened in 2003. It is a three-campus co-educational school, with a Junior, Senior and Residential campus. When opened Spinifex State College offered an educational program for years 8-12. In 2015 the Junior Campus welcomed students in year 7 to secondary school and provided education for students in years 7-9. The school is based on a ‘school within a school’ concept with a Deputy and Head of Department assigned to, and managing each year level. In addition to this there is also a STEPS Program that caters for students who are not achieving success in the mainstream program. In 2015 Senior Campus provided for years 10 and 12. Students select a course of study from a wide variety of offerings including Queensland Studies Authority subjects, Authority Registered subjects and also TAFE courses. Spinifex College has a Special Education Program at the junior campus and a Special Education Class at the Senior Campus. The Residential Campus was the first state-run boarding facility for students attending a state school. This campus has the capacity to board and provide educational support to 55 students. This report will provide: an overview of activities of 2015 and data on a range of topics such as student accomplishments in National Testing, Year 12 Data and Staff Profiles.
School progress towards its goals in 2015
In 2015 the school had a focus on improving results for all students. This was done by:

Focusing on having all staff skilled to deliver quality curriculum programs to all students.
Consolidating the adoption of the Explicit Instruction model as the commonly adopted teaching framework for all classrooms.
Consolidating the focus on the teaching of Reading across all curriculum areas.
Embedding the Positive Behaviour for Learning program by training staff, teaching school Expectations, and having celebration events.
Celebration of ANZAC Day, National Sorry Day, Remembrance Day and Reconciliation Week and NAIDOC week on both Junior and Senior campuses;
Celebrating Special Events – Cultural, Performing Arts and Academic activities.
Future outlook
Key priorities identified for improvement in the school for 2016:
Embed a positive learning environment – through the consistent implementation of Positive Behaviour for Learning and the Spinifex Success Principles
Embed a culture of high aspiration and successful learning – delivered through the Explicit Instruction
model focussing on the Gradual Release of Responsibility model.
Embed consistent delivery of Reading programs across the school –a continued focus on Learning to Read and Reading to Learn.
Our school at a glance
School Profile
Coeducational or single sex: Coeducational
Independent Public School: No
Year levels offered in 2015: Year 7 - Year 12
Student enrolments for this school:
Total Girls Boys Indigenous
Enrolment Continuity
(Feb – Nov)
2013 866 427 439 285 84%
2014 808 394 414 260 82%
2015 890 437 453 335 87%
Student counts are based on the Census (August) enrolment collection.
*From 2015, data for all state high schools include Year 7 students. Prior to 2015, only state high schools offering Year 7 had these students included in their counts.
Characteristics of the student body:
Spinifex State College – Mount Isa is built on Kalkadoon land and provides education to a student body from a wide variety of cultural and socio-economic backgrounds. While the Kalkadoon are the local indigenous group we have students from as many as 16 different cultural groups from around Queensland and the Northern Territory. Approximately 30% of the student population identify as being Indigenous, and we also have a large number of students from overseas countries including New Zealand and South East Asia.
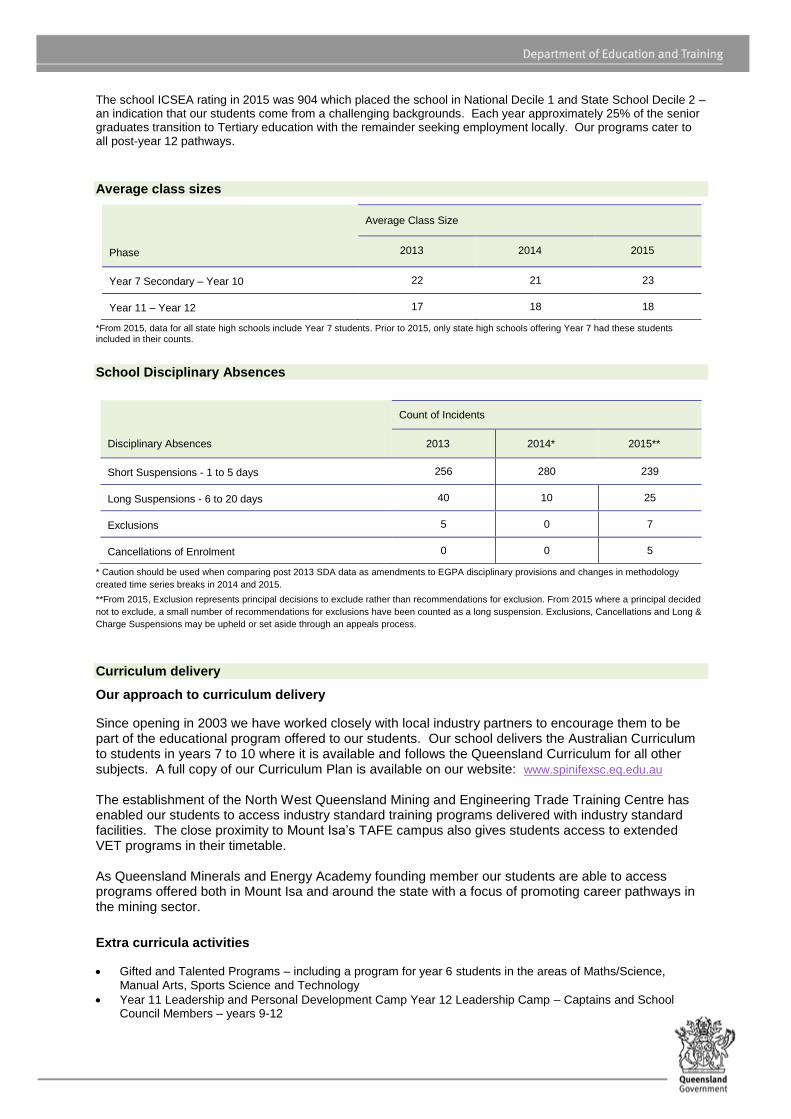
The school ICSEA rating in 2015 was 904 which placed the school in National Decile 1 and State School Decile 2 – an indication that our students come from a challenging backgrounds. Each year approximately 25% of the senior graduates transition to Tertiary education with the remainder seeking employment locally. Our programs cater to all post-year 12 pathways.
Average class sizes
Phase
Average Class Size
2013 2014 2015
Year 7 Secondary – Year 10 22 21 23
Year 11 – Year 12 17 18 18
*From 2015, data for all state high schools include Year 7 students. Prior to 2015, only state high schools offering Year 7 had these students included in their counts.
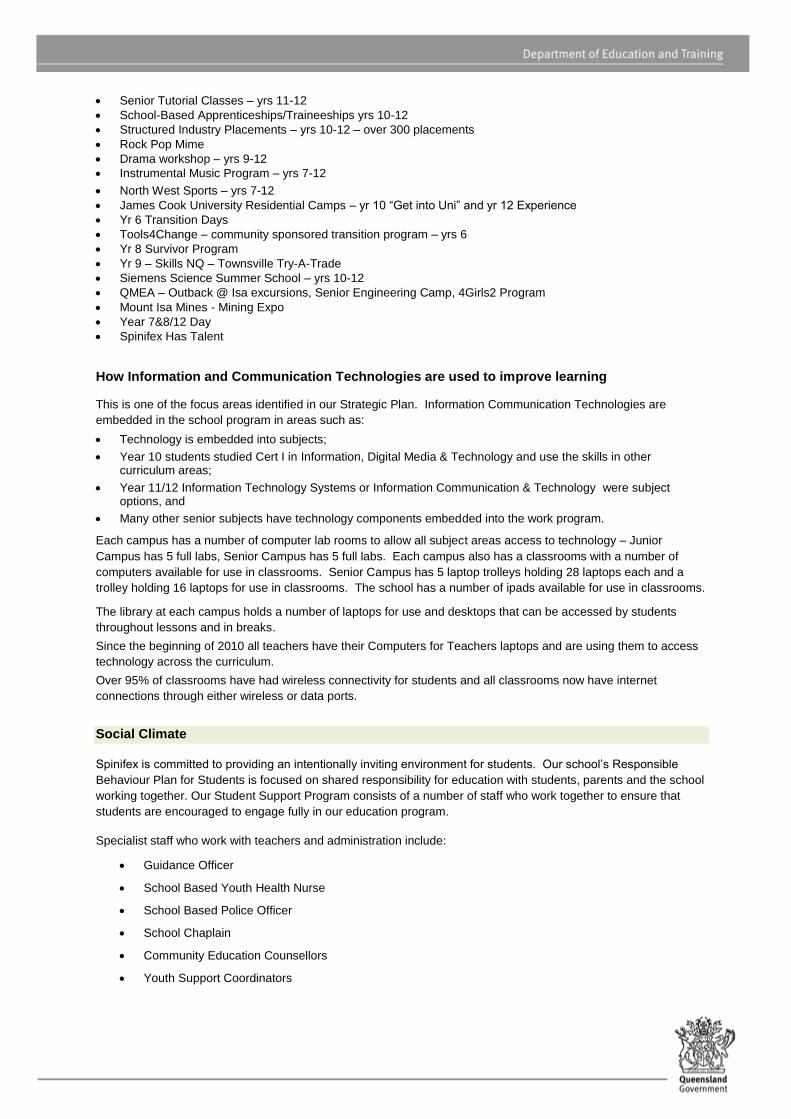
School Disciplinary Absences
* Caution should be used when comparing post 2013 SDA data as amendments to EGPA disciplinary provisions and changes in methodology
created time series breaks in 2014 and 2015.
**From 2015, Exclusion represents principal decisions to exclude rather than recommendations for exclusion. From 2015 where a principal decided
not to exclude, a small number of recommendations for exclusions have been counted as a long suspension. Exclusions, Cancellations and Long &
Charge Suspensions may be upheld or set aside through an appeals process.
Curriculum delivery
Our approach to curriculum delivery
Since opening in 2003 we have worked closely with local industry partners to encourage them to be part of the educational program offered to our students. Our school delivers the Australian Curriculum to students in years 7 to 10 where it is available and follows the Queensland Curriculum for all other subjects. A full copy of our Curriculum Plan is available on our website: www.spinifexsc.eq.edu.au The establishment of the North West Queensland Mining and Engineering Trade Training Centre has enabled our students to access industry standard training programs delivered with industry standard facilities. The close proximity to Mount Isa’s TAFE campus also gives students access to extended VET programs in their timetable. As Queensland Minerals and Energy Academy founding member our students are able to access programs offered both in Mount Isa and around the state with a focus of promoting career pathways in the mining sector.
Extra curricula activities
Gifted and Talented Programs – including a program for year 6 students in the areas of Maths/Science, Manual Arts, Sports Science and Technology
Year 11 Leadership and Personal Development Camp Year 12 Leadership Camp – Captains and School Council Members – years 9-12
Disciplinary Absences
Count of Incidents
2013 2014* 2015**
Short Suspensions - 1 to 5 days 256 280 239
Long Suspensions - 6 to 20 days 40 10 25
Exclusions 5 0 7
Cancellations of Enrolment 0 0 5
Senior Tutorial Classes – yrs 11-12
School-Based Apprenticeships/Traineeships yrs 10-12
Structured Industry Placements – yrs 10-12 – over 300 placements
Rock Pop Mime
Drama workshop – yrs 9-12
Instrumental Music Program – yrs 7-12
North West Sports – yrs 7-12
James Cook University Residential Camps – yr 10 “Get into Uni” and yr 12 Experience
Yr 6 Transition Days
Tools4Change – community sponsored transition program – yrs 6
Yr 8 Survivor Program
Yr 9 – Skills NQ – Townsville Try-A-Trade
Siemens Science Summer School – yrs 10-12
QMEA – Outback @ Isa excursions, Senior Engineering Camp, 4Girls2 Program
Mount Isa Mines - Mining Expo
Year 7&8/12 Day
Spinifex Has Talent
How Information and Communication Technologies are used to improve learning
This is one of the focus areas identified in our Strategic Plan. Information Communication Technologies are
embedded in the school program in areas such as:
Technology is embedded into subjects;
Year 10 students studied Cert I in Information, Digital Media & Technology and use the skills in other curriculum areas;
Year 11/12 Information Technology Systems or Information Communication & Technology were subject options, and
Many other senior subjects have technology components embedded into the work program.
Each campus has a number of computer lab rooms to allow all subject areas access to technology – Junior
Campus has 5 full labs, Senior Campus has 5 full labs. Each campus also has a classrooms with a number of
computers available for use in classrooms. Senior Campus has 5 laptop trolleys holding 28 laptops each and a
trolley holding 16 laptops for use in classrooms. The school has a number of ipads available for use in classrooms.
The library at each campus holds a number of laptops for use and desktops that can be accessed by students
throughout lessons and in breaks.
Since the beginning of 2010 all teachers have their Computers for Teachers laptops and are using them to access
technology across the curriculum.
Over 95% of classrooms have had wireless connectivity for students and all classrooms now have internet
connections through either wireless or data ports.
Social Climate
Spinifex is committed to providing an intentionally inviting environment for students. Our school’s Responsible
Behaviour Plan for Students is focused on shared responsibility for education with students, parents and the school
working together. Our Student Support Program consists of a number of staff who work together to ensure that
students are encouraged to engage fully in our education program.
Specialist staff who work with teachers and administration include:
Guidance Officer
School Based Youth Health Nurse
School Based Police Officer
School Chaplain
Community Education Counsellors
Youth Support Coordinators
In 2015 the school embedded the Positive Behaviour for Learning. School Expectations were taught to students:
As Learners at Spinifex: We are SAFE; We are RESPECTFUL; and We are RESPONSIBLE.
As part of the SWPBS Program the school implemented the concept of Spinifex Stamps as a reward for following
the school expectations. Stamps were spent at the Spinifex Shop or raffles. Reward activities each term for the
top earners were held also – these included Pizza parties, bowling activities and movie entrance.
Other significant activities that supported the development of a positive school culture included:
Evidence based programs to enhance social and emotional development of students: Drumbeat, Girls With a
Purpose, Seasons for Growth, Deadly Choices, and PCYC Boxing Program
The Breakfast Club run by the SBYHN and Chaplain
The Young, Black and Deadly Program (included serving at the Elders Lunch during NAIDOC week in 2015),
Lunchtime sports at both Junior and Senior Campus,
Students of the Week awards given on year level parades,
Student Council events such as Shave for a Cure, Jeans for Genes Day, Spinifex Has Talent
Commemoration of significant events such as ANZAC Day Parades, Sorry Day Parades, Reconciliation Week and NAIDOC Week activities
Involvement in Community events such as annual ANZAC Day Parade and NAIDOC Elders lunch.
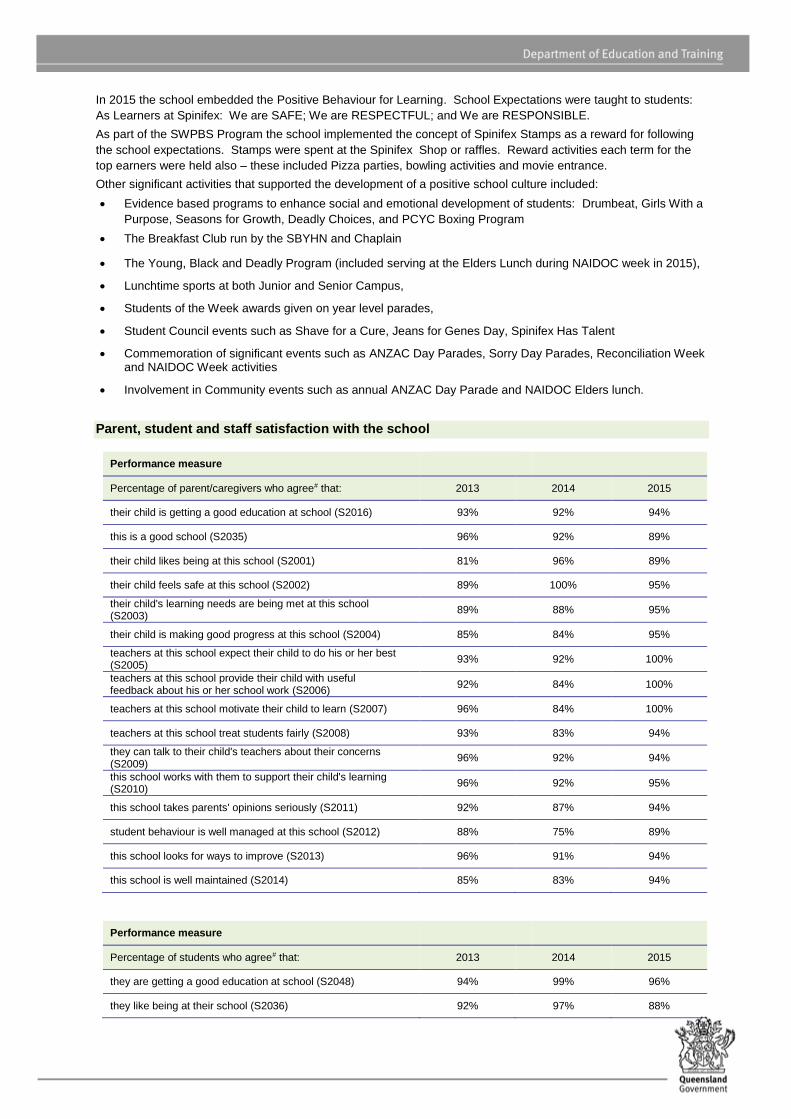
Parent, student and staff satisfaction with the school
Performance measure
Percentage of parent/caregivers who agree# that: 2013 2014 2015
their child is getting a good education at school (S2016) 93% 92% 94%
this is a good school (S2035) 96% 92% 89%
their child likes being at this school (S2001) 81% 96% 89%
their child feels safe at this school (S2002) 89% 100% 95%
their child's learning needs are being met at this school (S2003)
89% 88% 95%
their child is making good progress at this school (S2004) 85% 84% 95%
teachers at this school expect their child to do his or her best (S2005)
93% 92% 100%
teachers at this school provide their child with useful feedback about his or her school work (S2006)
92% 84% 100%
teachers at this school motivate their child to learn (S2007) 96% 84% 100%
teachers at this school treat students fairly (S2008) 93% 83% 94%
they can talk to their child's teachers about their concerns (S2009)
96% 92% 94%
this school works with them to support their child's learning (S2010)
96% 92% 95%
this school takes parents' opinions seriously (S2011) 92% 87% 94%
student behaviour is well managed at this school (S2012) 88% 75% 89%
this school looks for ways to improve (S2013) 96% 91% 94%
this school is well maintained (S2014) 85% 83% 94%
Performance measure
Percentage of students who agree# that: 2013 2014 2015
they are getting a good education at school (S2048) 94% 99% 96%
they like being at their school (S2036) 92% 97% 88%

Performance measure
Percentage of students who agree# that: 2013 2014 2015
they feel safe at their school (S2037) 92% 95% 93%
their teachers motivate them to learn (S2038) 94% 97% 91%
their teachers expect them to do their best (S2039) 96% 99% 97%
their teachers provide them with useful feedback about their school work (S2040)
92% 94% 92%
teachers treat students fairly at their school (S2041) 85% 80% 83%
they can talk to their teachers about their concerns (S2042) 79% 88% 84%
their school takes students' opinions seriously (S2043) 86% 84% 81%
student behaviour is well managed at their school (S2044) 76% 74% 76%
their school looks for ways to improve (S2045) 95% 94% 94%
their school is well maintained (S2046) 90% 88% 88%
their school gives them opportunities to do interesting things (S2047)
93% 92% 90%
Performance measure
Percentage of school staff who agree# that: 2013 2014 2015
they enjoy working at their school (S2069) 98% 90% 94%
they feel that their school is a safe place in which to work (S2070)
98% 92% 95%
they receive useful feedback about their work at their school (S2071)
85% 81% 94%
they feel confident embedding Aboriginal and Torres Strait Islander perspectives across the learning areas (S2114)
86% 90% 93%
students are encouraged to do their best at their school (S2072)
96% 89% 98%
students are treated fairly at their school (S2073) 95% 85% 95%
student behaviour is well managed at their school (S2074) 81% 76% 83%
staff are well supported at their school (S2075) 84% 80% 88%
their school takes staff opinions seriously (S2076) 84% 80% 89%
their school looks for ways to improve (S2077) 94% 92% 95%
their school is well maintained (S2078) 79% 69% 86%
their school gives them opportunities to do interesting things (S2079)
90% 83% 95%
# ‘Agree’ represents the percentage of respondents who Somewhat Agree, Agree or Strongly Agree with the statement. DW = Data withheld to ensure confidentiality.
Parent and Community Engagement
Involving parents in their child’s education
Our school encourages parents to participate in the education of their students. We offer both formal and informal opportunities to do this. Some examples include:
Meet the Teacher/Parent function in February of each year.
Leadership Investiture/Awards Night/Yr 12 Graduation
Fortnightly newsletters – sent via email and on the school website
Regular Facebook posts
Monthly P&C Meetings
Quarterly Indigenous Advisory Committee meetings
Parent/Teacher interviews – held twice per year
SET Planning Interviews – all year 10 students and parents meet with school staff to develop individual Senior
Education and Training Plans
Regular teacher/parent contact – to celebrate success or to discuss issues of concern
Year 7/8 Culminating Events/Open Day
MAD About the Arts – Art Exhibition Evenings
Spinifex Has Talent – performance evening
School Events such as Sporting Carnivals, Musicals,
Hospitality Restaurants
Subject Selection Evenings
Parent Meetings as part of the Case Management process, particularly for students involved in alternative programs
Community Education Counsellor home visits
Residential community visits – Head of Campus regularly visits communities with house parents and teachers
Open Days/weekends were held at the Residential Campus where community members stayed at the residential campus with their children
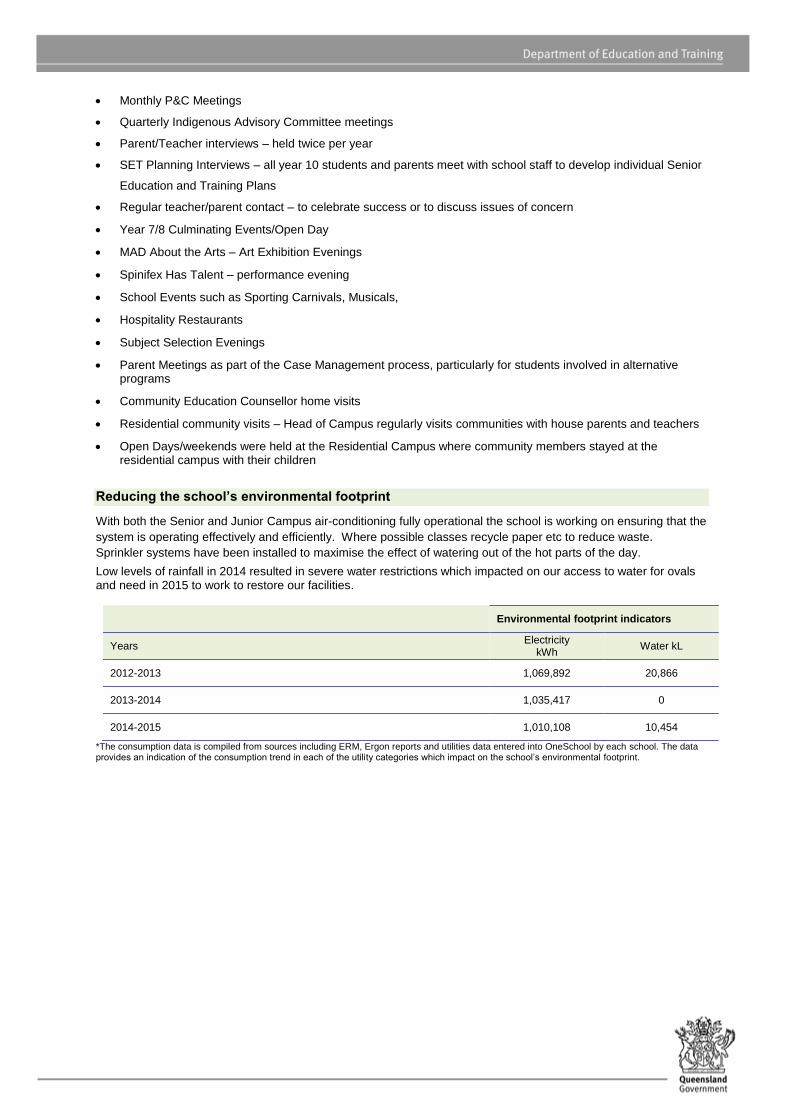
Reducing the school’s environmental footprint
With both the Senior and Junior Campus air-conditioning fully operational the school is working on ensuring that the
system is operating effectively and efficiently. Where possible classes recycle paper etc to reduce waste.
Sprinkler systems have been installed to maximise the effect of watering out of the hot parts of the day.
Low levels of rainfall in 2014 resulted in severe water restrictions which impacted on our access to water for ovals and need in 2015 to work to restore our facilities.
Environmental footprint indicators
Years Electricity
kWh Water kL
2012-2013 1,069,892 20,866
2013-2014 1,035,417 0
2014-2015 1,010,108 10,454
*The consumption data is compiled from sources including ERM, Ergon reports and utilities data entered into OneSchool by each school. The data provides an indication of the consumption trend in each of the utility categories which impact on the school’s environmental footprint.
Our staff profile
Staff composition, including Indigenous staff
2015 Workforce Composition Teaching Staff* Non-teaching
Staff Indigenous Staff
Headcounts 74 69 6
Full-time equivalents 72 56 5
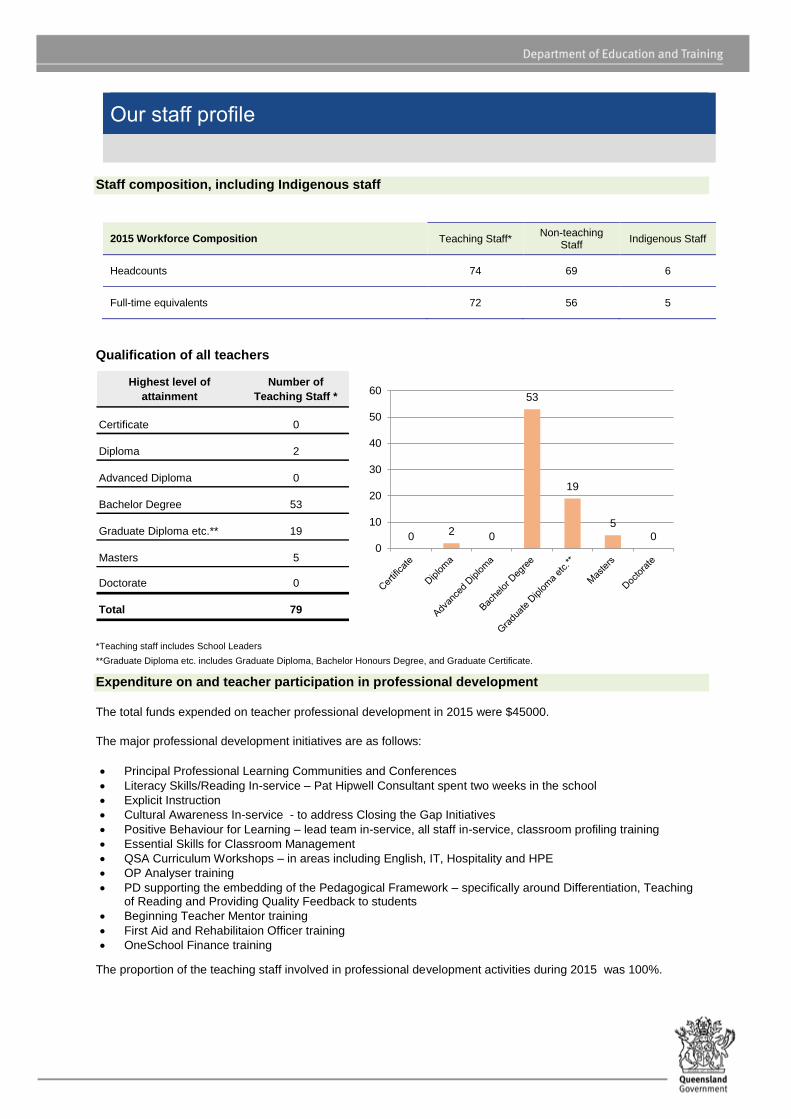
Qualification of all teachers
Highest level of
attainment
Number of
Teaching Staff *
Certificate 0
Diploma 2
Advanced Diploma 0
Bachelor Degree 53
Graduate Diploma etc.** 19
Masters 5
Doctorate 0
Total 79
02
0
53
19
5
00
10
20
30
40
50
60
*Teaching staff includes School Leaders
**Graduate Diploma etc. includes Graduate Diploma, Bachelor Honours Degree, and Graduate Certificate.
Expenditure on and teacher participation in professional development
The total funds expended on teacher professional development in 2015 were $45000.
The major professional development initiatives are as follows:
Principal Professional Learning Communities and Conferences
Literacy Skills/Reading In-service – Pat Hipwell Consultant spent two weeks in the school
Explicit Instruction
Cultural Awareness In-service - to address Closing the Gap Initiatives
Positive Behaviour for Learning – lead team in-service, all staff in-service, classroom profiling training
Essential Skills for Classroom Management
QSA Curriculum Workshops – in areas including English, IT, Hospitality and HPE
OP Analyser training
PD supporting the embedding of the Pedagogical Framework – specifically around Differentiation, Teaching of Reading and Providing Quality Feedback to students
Beginning Teacher Mentor training
First Aid and Rehabilitaion Officer training
OneSchool Finance training
The proportion of the teaching staff involved in professional development activities during 2015 was 100%.

Average staff attendance 2013 2014 2015
Staff attendance for permanent and temporary staff and school leaders. 97% 97% 97%
Proportion of staff retained from the previous school year
From the end of the previous school year, 70% of staff was retained by the school for the entire 2015 school year.
School income broken down by funding source
School income broken down by funding source is available via the My School website at http://www.myschool.edu.au/.
To access our income details, click on the My School link above. You will then be taken to the My School website with the following ‘Find a school’ text box.
Where it says ‘School name’, type in the name of the school you wish to view, select the school from the drop-down list and select <GO>. Read and follow the instructions on the next screen; you will be asked to confirm that you are not a robot then by clicking continue, you acknowledge that you have read, accepted and agree to the Terms of Use and Privacy Policy before being given access to the school’s profile webpage.
School financial information is available by selecting ‘School finances’ in the menu box in the top left corner of the school’s profile webpage. If you are unable to access the internet, please contact the school for a paper copy of income by funding source.
Performance of our students
Key student outcomes
Student attendance 2013 2014 2015
The overall attendance rate for the students at this school (shown as a percentage). 80% 85% 85%
The attendance rate for Indigenous students at this school (shown as a percentage). 67% 77% 78%
The student attendance rate is generated by dividing the total of full-days and part-days that students attended, and comparing this to the total of all possible days for students to attend, expressed as a percentage.
The overall attendance rate in 2015 for all Queensland Secondary schools was 90%.
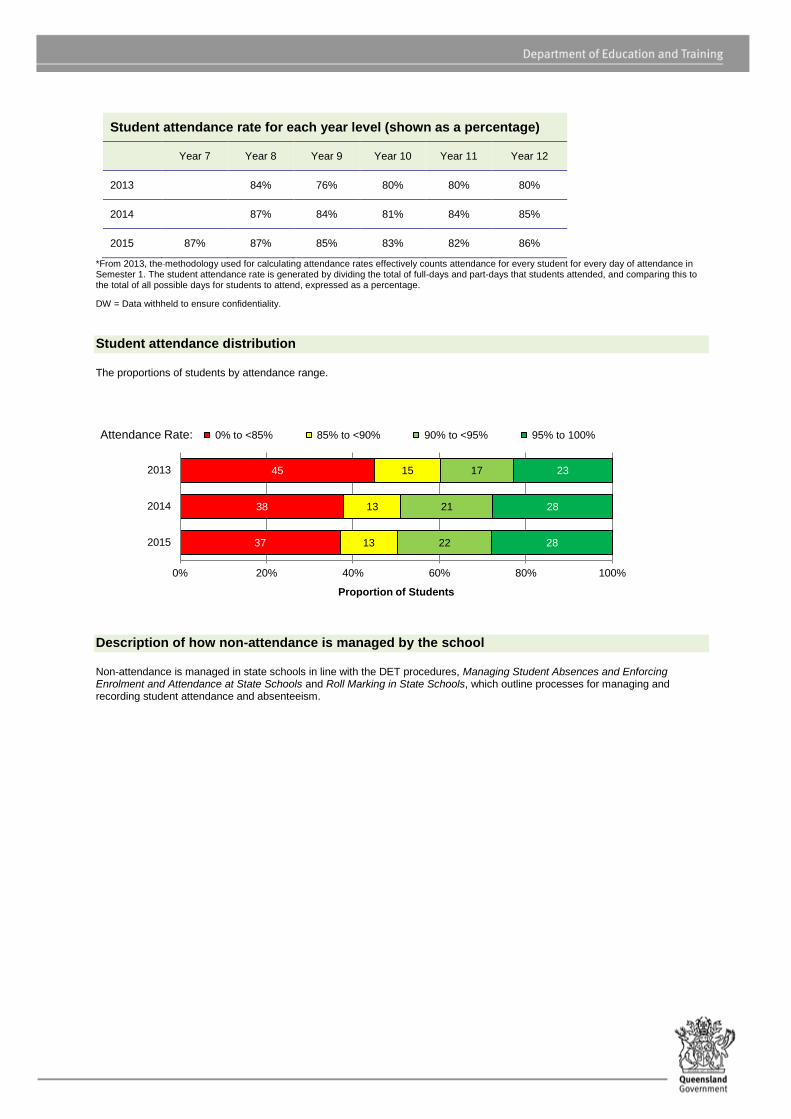
Student attendance rate for each year level (shown as a percentage)
Year 7 Year 8 Year 9 Year 10 Year 11 Year 12
2013 84% 76% 80% 80% 80%
2014 87% 84% 81% 84% 85%
2015 87% 87% 85% 83% 82% 86%
*From 2013, the methodology used for calculating attendance rates effectively counts attendance for every student for every day of attendance in Semester 1. The student attendance rate is generated by dividing the total of full-days and part-days that students attended, and comparing this to the total of all possible days for students to attend, expressed as a percentage.
DW = Data withheld to ensure confidentiality.
Student attendance distribution
The proportions of students by attendance range.
Description of how non-attendance is managed by the school
Non-attendance is managed in state schools in line with the DET procedures, Managing Student Absences and Enforcing Enrolment and Attendance at State Schools and Roll Marking in State Schools, which outline processes for managing and recording student attendance and absenteeism.
37
38
45
13
13
15
22
21
17
28
28
23
0% 20% 40% 60% 80% 100%
2015
2014
2013
Proportion of Students
Attendance Rate: 0% to <85% 85% to <90% 90% to <95% 95% to 100%
The school operates a text-messaging system to give parents early notification if a child is not at school and asks for parents to contact the office to discuss reasons for absences.
Rolls are marked each morning on both Junior and Senior Campus. Students who are flexed off at Senior report to the office on arrival.
Students late to school report to the office and are counselled by the Principal or Deputy Principal. Regular late arrivers are given consequences for this which may include Attendance Cards.
Roll marking is completed for each teacher in each class using ID Attend during the day to ensure up-to-date electronic records.
School staff contact home for students who are regularly absent from school to discuss issues with intent to encourage attendance.
Five-weekly attendance audits were performed on Senior Campus – attendance linked to eligibility to attend extra-curricular activities such as Leadership Camp and Graduation.
A Teacher Aide is employed on each campus to contact home to follow up ‘unexplained’ absences.
Community Education Counsel lors and Student Case Managers visited homes of students with poor attendance records to encourage re-entry to schooling.
Residential Campus runs reward activities to encourage students to return promptly from holidays.
Letters are sent home to families when children are absent for more than three unexplained days. Where there is not a suitable response alternatives such as making the child’s enrolment ‘inactive’ or sending home letters to start legal prosecution are considered.
National Assessment Program – Literacy and Numeracy (NAPLAN) results – our reading,
writing, spelling, grammar and punctuation, and numeracy results for the Years 3, 5, 7, and 9.
Our reading, writing, spelling, grammar and punctuation, and numeracy results for the Years 7 and 9 are available via the My
School website at http://www.myschool.edu.au/.
To access our NAPLAN results, click on the My School link above. You will then be taken to the My School website with the
following ‘Find a school’ text box.
Where it says ‘School name’, type in the name of the school you wish to view, select the school from the drop-down list and select <GO>. Read and follow the instructions on the next screen; you will be asked to confirm that you are not a robot then by clicking continue, you acknowledge that you have read, accepted and agree to the Terms of Use and Privacy Policy before being given access to the school’s profile webpage.
School NAPLAN information is available by selecting ‘NAPLAN’ in the menu box in the top left corner of the school’s profile webpage. If you are unable to access the internet, please contact the school for a paper copy of our school’s NAPLAN results.

Outcomes for our Year 12 cohorts 2013 2014 2015
Number of students receiving a Senior Statement 118 151 130
Number of students awarded a Queensland Certificate of Individual Achievement. 3 5 5
Number of students receiving an Overall Position (OP) 36 51 32
Percentage of Indigenous students receiving an Overall Position (OP) 13% 3% 13%
Number of students who are completing/continuing a School-based Apprenticeship or Traineeship (SAT).
24 23 14
Number of students awarded one or more Vocational Educational Training (VET) qualifications (incl. SAT).
93 111 113
Number of students awarded an Australian Qualification Framework Certificate II or above.
45 31 47
Number of students awarded a Queensland Certificate of Education (QCE) at the end of Year 12.
90 129 122
Percentage of Indigenous students awarded a Queensland Certificate of Education (QCE) at the end of Year 12.
55% 84% 90%
Number of students awarded an International Baccalaureate Diploma (IBD). 0 0 0
Percentage of OP/IBD eligible students with OP 1-15 or an IBD. 58% 43% 72%
Percentage of Year 12 students who are completing or completed a SAT or were awarded one or more of the following: QCE, IBD, VET qualification.
86% 92% 95%
Percentage of Queensland Tertiary Admissions Centre (QTAC) applicants receiving an offer.
96% 94% 100%
As at 16 February 2016. The above values exclude VISA students.
As at 16 February 2016. The above values exclude VISA students.
Apparent retention rates Year 10 to Year 12 2013 2014 2015
Year 12 student enrolment as a percentage of the Year 10 student cohort. 73% 82% 80%
Year 12 Indigenous student enrolment as a percentage of the Year 10 Indigenous student cohort.
58% 49% 70%
Overall Position Bands (OP)
Number of students in each Band for OP 1 to 25
Years OP 1-5 OP 6-10 OP 11-15 OP 16-20 OP 21-25
2013 4 8 9 14 1
2014 3 6 13 19 10
2015 8 7 8 9 0
Vocational Educational Training qualification (VET)
Number of students completing qualifications under Australian Qualification Framework (AQF)
Years Certificate I Certificate II Certificate III or above
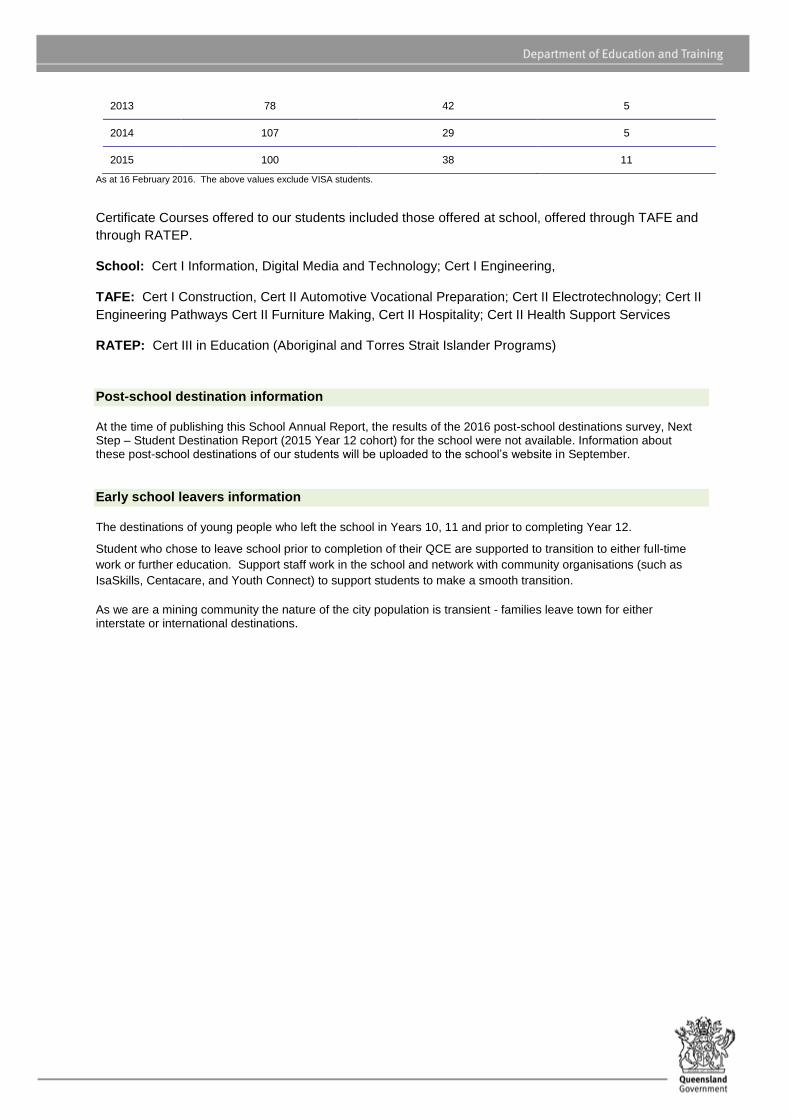
As at 16 February 2016. The above values exclude VISA students.
Certificate Courses offered to our students included those offered at school, offered through TAFE and
through RATEP.
School: Cert I Information, Digital Media and Technology; Cert I Engineering,
TAFE: Cert I Construction, Cert II Automotive Vocational Preparation; Cert II Electrotechnology; Cert II
Engineering Pathways Cert II Furniture Making, Cert II Hospitality; Cert II Health Support Services
RATEP: Cert III in Education (Aboriginal and Torres Strait Islander Programs)
Post-school destination information
At the time of publishing this School Annual Report, the results of the 2016 post-school destinations survey, Next Step – Student Destination Report (2015 Year 12 cohort) for the school were not available. Information about these post-school destinations of our students will be uploaded to the school’s website in September.
Early school leavers information
The destinations of young people who left the school in Years 10, 11 and prior to completing Year 12.
Student who chose to leave school prior to completion of their QCE are supported to transition to either full-time
work or further education. Support staff work in the school and network with community organisations (such as
IsaSkills, Centacare, and Youth Connect) to support students to make a smooth transition.
As we are a mining community the nature of the city population is transient - families leave town for either interstate or international destinations.
2013 78 42 5
2014 107 29 5
2015 100 38 11