Embed Size (px)
Citation preview

Spinal Cord Injury in Wisconsin:1997
September 1999
Wisconsin Department of Health and Family ServicesDivision of Supportive Living
Bureau of Aging and Long Term Care ResourcesOffice for Persons with Physical Disabilities
Supported by grant H133N50024 of the Model Spinal Cord Injury System from the NationalInstitute on Disability and Rehabilitation Research, Office of Special Education and
Rehabilitative Services, U.S. Department of Education, Washington, D.C.

2

3
Acknowledgements
This research was supported in part by grant H133N50024 of the Model Spinal CordInjury System from the National Institute on Disability and Rehabilitation Research,Department of Education, Washington, D.C.
Co-Principle Investigators:Dennis Maiman, M.D., Ph.D Irma G. Fiedler, Ph.D.Department of Neurosurgery Department of Physical
Medicine and Rehabilitation
Medical College of Wisconsin9200 W. Wisconsin AvenueMilwaukee, WI 53226(414) 259-2126
Report Author:Kimberly Schindler, M.S., C.R.C.
Contact Information:Wisconsin Spinal Cord Registry1 West Wilson Street, Room 450PO Box 7851Madison, WI 53707-7851(608) 266-8905 Voice(608) 267-9880 TTY(608) 267-2913 [email protected]
Alternate versions of this report are available on request.

4
5
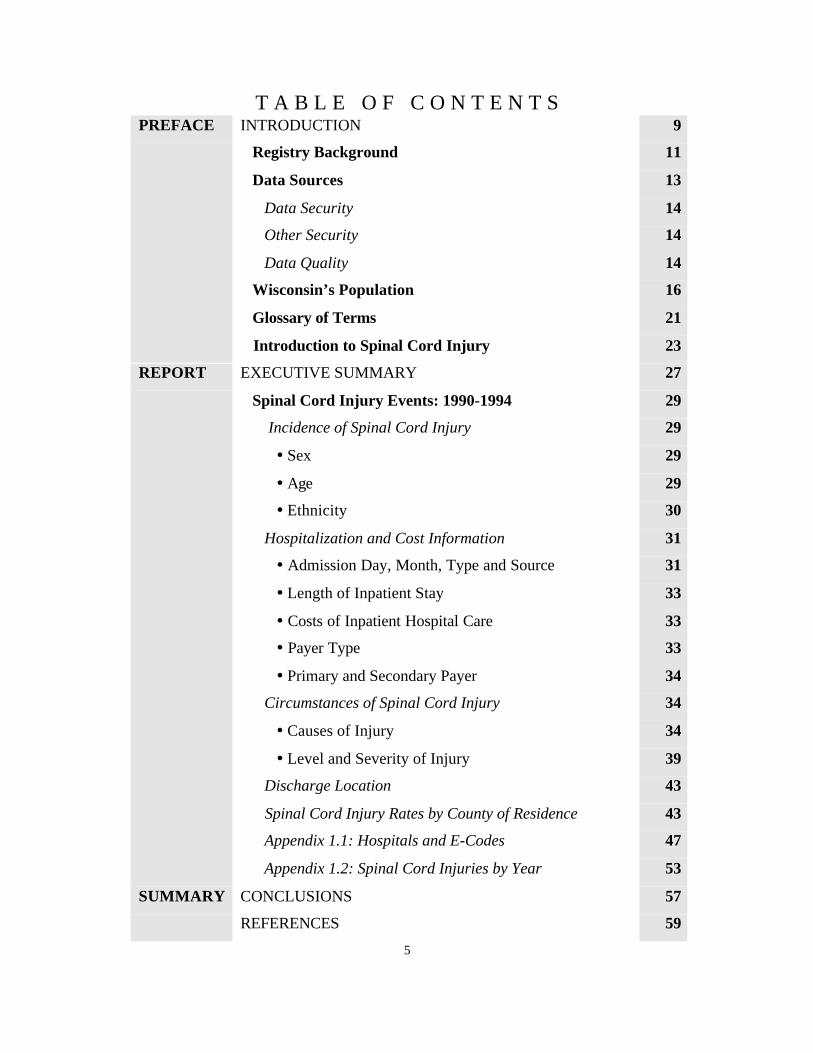
T A B L E O F C O N T E N T SPREFACE INTRODUCTION
Registry Background
Data Sources
Data Security
Other Security
Data Quality
Wisconsin’s Population
Glossary of Terms
Introduction to Spinal Cord Injury
9
11
13
14
14
14
16
21
23
REPORT EXECUTIVE SUMMARY
Spinal Cord Injury Events: 1990-1994
Incidence of Spinal Cord Injury
� Sex
� Age
� Ethnicity
Hospitalization and Cost Information
� Admission Day, Month, Type and Source
� Length of Inpatient Stay
� Costs of Inpatient Hospital Care
� Payer Type
� Primary and Secondary Payer
Circumstances of Spinal Cord Injury
� Causes of Injury
� Level and Severity of Injury
Discharge Location
Spinal Cord Injury Rates by County of Residence
Appendix 1.1: Hospitals and E-Codes
Appendix 1.2: Spinal Cord Injuries by Year
27
29
29
29
29
30
31
31
33
33
33
34
34
34
39
43
43
47
53
SUMMARY CONCLUSIONS
REFERENCES
57
59

6
LIST OF MAPS, TABLES AND GRAPHS
Table 1.1 WI Population Projections / County Projections by
Total Population 17
Table 1.2 WI Population Projections by Age Group 19
Graph 1.1 Injuries by Gender and Year 29
Graph 1.2 Injuries by Age and Gender 30
Graph 1.3 Injuries by Race 31
Graph 1.4 Admission by Day of the Week 31
Graph 1.5 Admission by Month 32
Graph 1.6 Type of Admission 32
Graph 1.7 Average Length of Inpatient Stay by Gender 33
Graph 1.8 Payer Type 34
Graph 1.9 Causes of Injury 35
Table 1.3 Causes of SCI, by Gender 36
Table 1.4 Causes of SCI, by Selected Age Groups 37
Graph 1.10 Severity of Injury 40
Table 1.5 Principal Diagnosis 41
Graph 1.11 Patient Discharge Location 43
Map 1.1 Spinal Cord Injuries by County of Residence 44
Table 1.6 Injuries by County of Residence 45
Table 1.7 Hospitals Reporting SCI 49
Table 1.8 E-Codes 51
Table 1.9 1997 Data 55

7
v
Introduction
Registry Background
Data Sources
Wisconsin's Population
Glossary of Terms
Introduction to Spinal Cord Injury

8

9
Introduction
The establishment of a statewide registry and surveillance program was necessary in order toclearly identify factors and demographics associated with the population of individuals thatsustains spinal cord injuries (SCI). Accurate incidence, prevalence and economic informationabout disabilities caused by traumatic injuries had been lacking in Wisconsin.
This Wisconsin Spinal Cord Injury Report represents an overview of spinal cord injuries inWisconsin occurring in 1997. The data presented in this report includes hospital discharge datarelated to spinal cord injuries with ICD-9-CM diagnostic codes 806.00-806.99 (fracture ofvertebral column with spinal cord injury) and 952.00-952.99 (spinal cord injury without evidenceof spinal bone injury). Within this data it is possible that the same person could be hospitalizedmore than once during a particular year. In order to avoid counting duplicate hospital visits, onlythe initial hospital visit data is included in the report, except for the “length of stay” and “cost ofstay” data. These exceptions were figured from all hospital visits resulting from the originalinjury to give the actual length of stay and cost of stay data for each injury. Spinal cord injurycodes were chosen based on Center for Disease Control and Prevention Guidelines. Thedischarge data presented here included all events occurring in Wisconsin during 1997 toWisconsin residents only. Non-residents of Wisconsin were not included.
Readers are encouraged to review the entire report and tables before drawing any conclusionsfrom one table or graph within the document. Please contact the Office for Persons withPhysical Disabilities for further explanation of the data presented in this report or for additionalcopies.
Wisconsin Spinal Cord Injury SurveillanceOffice for Persons with Physical Disabilities
Bureau of Aging and Long Term Care ResourcesDivision of Supportive Living
Department of Health and Family ServicesP.O. Box 7851
Madison, Wisconsin 53707-7851

10

11
Registry Background
Background
The Wisconsin Council on Physical Disabilities state plan and Council on Physical Disabilities1993-1995 Biennial Budget Initiatives identified the need for the systematic collection andanalysis of data. The high cost of treating disabilities, the savings in human suffering, and thecost-effectiveness of prevention are viable reasons for promoting prevention programs.
Physical injury is costly. The National Safety Council (1989) estimated that in the United States:
drinking is indicated as a factor in at least half of the fatal motor vehicleaccidents;
in 40% of motorcycle fatalities, there was a detectable blood alcohol level.
the total lack of crash protection afforded by motorcycles places the motor-cyclist at an 80-90% risk of death or injury in any accident;
in six states where helmet laws were required, head injury in helmeted riderswas reduced by at least 60%; and
trauma accidents involving the spinal cord have their highest incidenceamong adolescents.
Current Concerns
The Council identified the need for information about disability etiology, including spinal cordand brain injury, suggesting that a comprehensive program of public education could serve toeducate people about specific precautions and thus reduce the incidence of injury. Specificmeasures such as driving practices, crash helmets, and seat belts and subsequent publicawareness programs that focus on youth could have significant influence on reducing suchinjuries. Knowledge about the etiology of injuries also suggests that a comprehensive publicinformation program must be coordinated with other public and private agencies that also have asignificant responsibility for disabilities prevention and related issues.
In 1994 the Wisconsin Council on Physical Disabilities received a planning grant from theWisconsin Council on Developmental Disabilities to identify opportunities to establish spinalcord injury and brain trauma surveillance. The Office for Persons with Physical Disabilities staffworked with the Council to identify potential funding opportunities.

12
Spinal Cord Injury Surveillance
In 1995 the Medical College of Wisconsin received a five-year grant from the National Instituteon Disability and Rehabilitation Research, Department of Education to become a federallydesignated Model Spinal Cord Injury Center. As an integral component of the grant, theDepartment of Health and Family Services, Office for Persons with Physical Disabilitiesreceived a subcontract to establish spinal cord injury surveillance. This surveillance has begunto compile statewide data about persons who have sustained spinal cord injuries. This data willenable other investigators to design and implement prevention projects and service projects,which will assist individuals with spinal cord injuries to live at their maximum levels ofindependence in their communities.
The objectives of the Spinal Cord Injury Surveillance include:
contribute to and compare Wisconsin data with the national SCI data base;
identify and track the incidence of spinal cord injury in Wisconsin;
provide data which will facilitate the development and implementationof effective preventive programs;
provide data which will facilitate blending the prevention and serviceaspects of health care for the population with SCI; and
identify and track the expenditure of treatment and service dollarsfor persons who are spinal cord injured.

13
Data Sources
Surveillance opportunities in Wisconsin for injuries, illnesses, and other conditions haveincreased since the creation of the Bureau of Health Information (BHI) hospital discharge datasystem.
The 1987 Wisconsin Act 399 established an Office of Health Care Information. The Bureau ofHealth Information’s responsibilities include collecting, analyzing, and disseminatinginformation on health care from inpatient hospital medical records. Under the statute andadministrative rules, hospitals are required to submit specific data to BHI for the purpose ofconstructing an inpatient hospital database, using information currently being collected on theUniform Billing forms (UB-92). Along with a patient’s billing information, the diagnosis andtreatment of the patient are recorded using standard International Classification of Disease-9th
Revision-Clinical Modification (ICD-9-CM) codes. BHI, at present, collects one principaldiagnostic code and has the capability of collecting up to eight secondary codes.
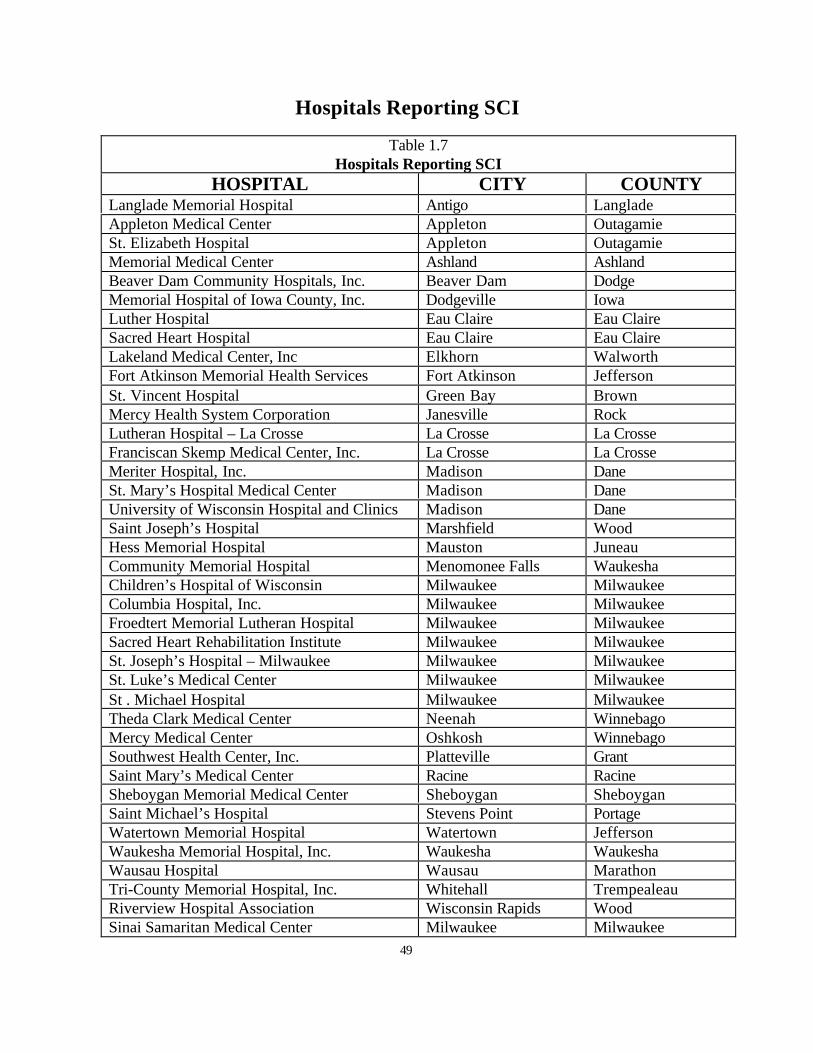
Hospitals reporting spinal cord injuries 1997 are shown in Table 1.7 and the codings used areshown in Table 1.5.
The case definition used for this analysis is consistent with current Centers for Disease Control(CDC) guidelines for spinal cord injury surveillance. Included are the hospital discharge recordsthat contain one or more of the following injury codes, which are based on the ICD-9-CM.
Spinal Cord Injury
Code Description806 Fracture of vertebral column with spinal cord lesion952 Spinal cord lesion with evidence of spinal bone injury
[This report does not include persons with spinal cord injuries who died beforereaching a hospital.]
When BHI began collecting data in January 1989, external cause codes (E-codes) for injurieswere reported on a voluntary basis, as one of the four secondary diagnoses. Regardless of howmany diagnostic codes were collected at individual hospitals, BHI only analyzes five diagnosticcodes. With recent revisions, the BHI database is able to collect additional secondary diagnosesand provide a field reserved for E-codes. With the national recommendation to change the UB-82 form to the UB-92 form, a designated field is now used for the E-code. The E-codes areshown in Table 1.8.
External cause codes for injuries were reported on a voluntary basis until January 1994. Usingthe voluntary system, only 30 percent of injury diagnoses contained this data element. The

14
inclusion of E-codes and improvement in their reporting is especially important to thesurveillance plan, as these codes classify causative agents and/or activities for disabling injuries.The E-codes provide crucial information to guide, develop and evaluate interventions, as well asinitiate preventative activities. Effective January 1994, Wisconsin hospitals were required toreport E-codes.
In the early years of hospital data collection, documentation and collection of race codes was notmandatory, therefore the race of some patients is “unknown” or documented as “other”.
Data Security
The Spinal Cord Registry maintains confidential data on individuals. This data is only accessibleto the individual subject of the data and persons who work directly on the registry. Measures toretain patient confidentiality are outlined in Wisconsin Statues Chapter 153.45 (Release of Data)and 153.50 (Protection of Patient Confidentiality). Only summary data are accessible to thepublic to protect individual identities.
All data is protected electronically through password measures, and copies of the data on backupdiskettes are kept under lock and key. Any additional information collected from persons withspinal cord injuries (in the form of interviews, phone contact, etc.), for the purposes ofprevention and services, will be conducted by persons under the direct supervision of theDirector of the Office for Persons with Physical Disabilities.
Other Security
In addition to data password protection, an automatic virus-checking program has been installedon the registry computer in order to safeguard against the possibility of any form of virusinfecting the data.
Data Quality
As stated in the introduction, while analyzing the data, questions arose relevant to the validity ofcoding by hospitals of actual spinal cord injuries resulting in permanent neurological deficitnecessitating an inpatient rehabilitation stay. In a recent article in the American Journal ofEpidemiology, Vol. 146, pp 266-272, 1997, Johnson et al. raised the issue of accuracy inreporting of spinal cord injury to a statewide database in Colorado. They report a positivepredictive value of 0.55, which implies that one can be only 55% certain that an identified caseof spinal cord injury is, in fact, a spinal cord injury resulting in permanent neurological deficit.This has obvious impact on the surveillance aspects of any registry that is planning on recordingonly spinal cord injuries with permanent neurological deficit. It is important to remember thatthe Center for Disease Control only requires a code of 806 or 952 for its registry. While full

15
medical chart review of all reported cases would not be feasible due to reasons of cost, time andconfidentiality, an attempt is underway to screen the data using the available codes by using aprocess developed by the Medical College of Wisconsin Model Spinal Cord Injury Center.Diagnoses critical to spinal cord injury including acute paraplegia or tetraplegia, bowel andbladder paralysis and systemic problems typically associated with spinal cord injury werereviewed. Also incorporated in the determination of acuity was the performance of surgery fordecompression or stabilization of the spine, placement of a halo, and transfer into a rehabilitationenvironment. Lengths of stay and outcome data were also considered: if patient demonstratedtransient quadriparesis, or was discharged home after one day of inpatient hospital care, it wasclear that this was not a permanent neurological deficit. In addition there was the need to verifythis process by comparing the results with actual medical records. Several of the coding sheetswere compared to the medical records of patients who had been discharged from FroedtertHospital. Eighty-six percent of the determinations at Froedtert were found to be correct, therebyestablishing the validity of the coding by that hospital.

16
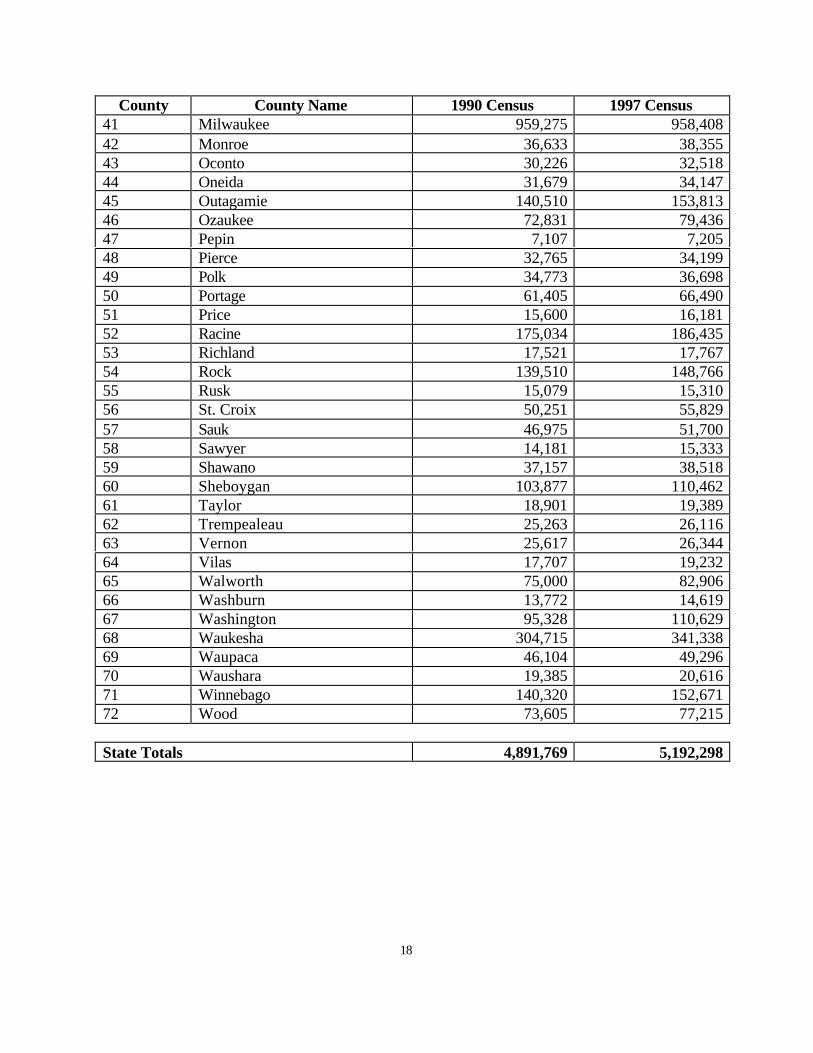
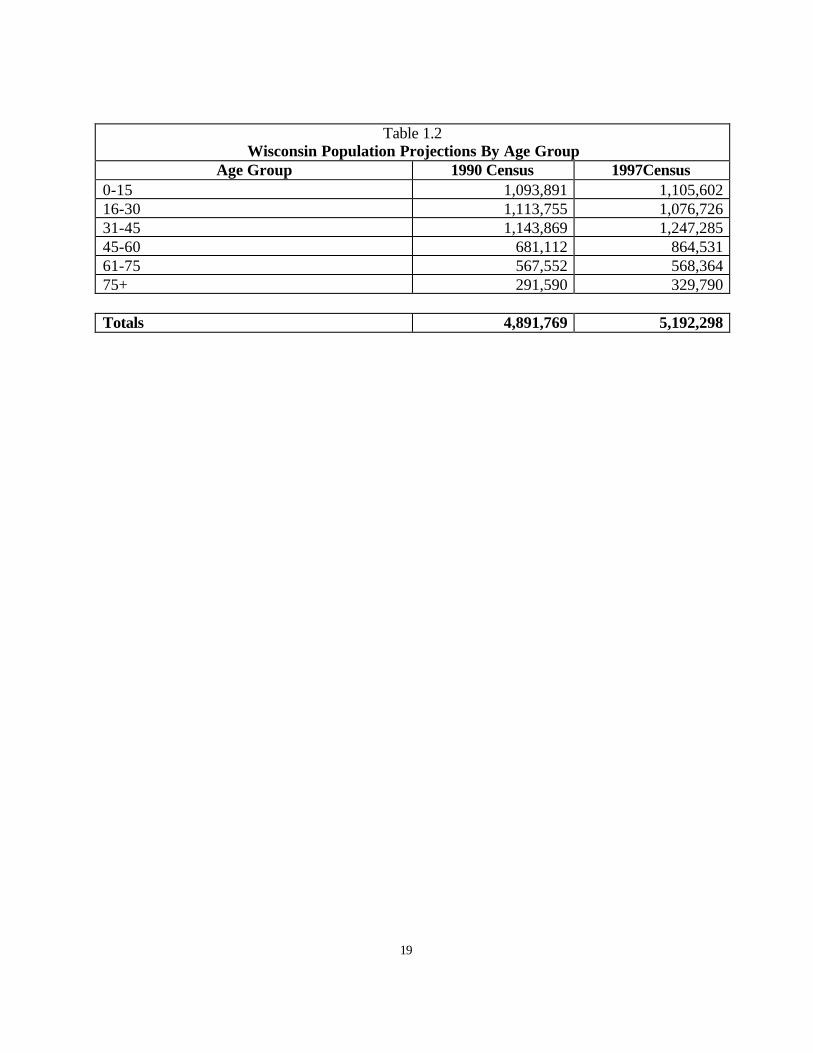
Wisconsin’s Population
Tables 1.1 and 1.2 summarize Wisconsin's population by county of residence, age and gender.From the 1990 census data, Wisconsin's estimated 1997 population was approximately 49percent male and 51 percent female. The largest population age groups for both males andfemales were in the 31-45 age category, comprising 24% of the general population. Ages 0-15and 16-30 (21%), 46-60 (17%), and 61-75 (11%), followed. Those aged 75 and older made upthe smallest age group, comprising 6% of the general population (Wisconsin Department ofHealth and Family Services, 1999).
In terms of racial diversity in 1997, 92.2 percent of Wisconsin's population was white, 5.5percent black, 1.4 percent Asian or Pacific Islander, and 0.9 percent Native American.

17
Table 1.1 Wisconsin Population Projections / County Projections by Total Population
County County Name 1990 Census 1997 Census01 Adams 15,682 17,49302 Ashland 16,307 16,75503 Barron 40,750 42,39904 Bayfield 14,008 14,52205 Brown 195,594 215,69206 Buffalo 13,584 13,74007 Burnett 13,084 13,85708 Calumet 34,291 37,78809 Chippewa 52,360 54,28310 Clark 31,647 32,35711 Columbia 45,088 48,59012 Crawford 15,940 16,21713 Dane 367,085 402,98814 Dodge 76,559 82,14715 Door 25,690 26,33316 Douglas 41,758 42,38317 Dunn 35,909 37,90718 Eau Claire 85,183 89,68219 Florence 4,590 4,94520 Fond du Lac 90,083 95,43521 Forest 8,776 9,12122 Grant 49,266 49,56723 Green 30,339 31,68924 Green Lake 18,651 19,33725 Iowa 20,150 21,61626 Iron 6,153 6,27927 Jackson 16,588 18,01028 Jefferson 67,783 72,70429 Juneau 21,650 23,19230 Kenosha 128,181 140,13331 Kewaunee 18,878 19,62132 LaCrosse 97,904 104,40933 Lafayette 16,074 16,13034 Langlade 19,505 20,45935 Lincoln 26,993 28,68236 Manitowoc 80,421 83,82837 Marathon 115,400 124,30938 Marinette 40,548 42,10439 Marquette 12,321 13,38240 Menominee 3,890 4,272
18
County County Name 1990 Census 1997 Census41 Milwaukee 959,275 958,40842 Monroe 36,633 38,35543 Oconto 30,226 32,51844 Oneida 31,679 34,14745 Outagamie 140,510 153,81346 Ozaukee 72,831 79,43647 Pepin 7,107 7,20548 Pierce 32,765 34,19949 Polk 34,773 36,69850 Portage 61,405 66,49051 Price 15,600 16,18152 Racine 175,034 186,43553 Richland 17,521 17,76754 Rock 139,510 148,76655 Rusk 15,079 15,31056 St. Croix 50,251 55,82957 Sauk 46,975 51,70058 Sawyer 14,181 15,33359 Shawano 37,157 38,51860 Sheboygan 103,877 110,46261 Taylor 18,901 19,38962 Trempealeau 25,263 26,11663 Vernon 25,617 26,34464 Vilas 17,707 19,23265 Walworth 75,000 82,90666 Washburn 13,772 14,61967 Washington 95,328 110,62968 Waukesha 304,715 341,33869 Waupaca 46,104 49,29670 Waushara 19,385 20,61671 Winnebago 140,320 152,67172 Wood 73,605 77,215
State Totals 4,891,769 5,192,298
19
Table 1.2Wisconsin Population Projections By Age Group
Age Group 1990 Census 1997Census0-15 1,093,891 1,105,60216-30 1,113,755 1,076,72631-45 1,143,869 1,247,28545-60 681,112 864,53161-75 567,552 568,36475+ 291,590 329,790
Totals 4,891,769 5,192,298

20

21
Glossary of Terms
Central Nervous System (CNS): the brain, spinal cord, and retina.
Cervical Spine: highest level in the spine, the neck region, consisting of seven vertebrae andeight nerve roots.
Clinic Referral: the patient was admitted to a facility upon recommendation of a clinicphysician.
Coccyx: the tailbone, with one vertebrae and nerve root.
Complete Injury: injury that leaves no motor function or sensation below the spinal cord injuryzone.
Court/Law Enforcement Referral: the patient was admitted to a facility upon direction of acourt of law, upon the request of a law enforcement agency representative, or upon referral froma 51.42/51.437 or 46.23 county board.
Elective Admission: an admission that can be delayed without substantial risk to the health ofthe individual. This means the patient’s condition permits adequate time to schedule theavailability of a suitable accommodation.
Emergency Admission: the patient requires immediate medical intervention as a result ofsevere, life threatening or potentially disabling conditions. Usually the patient is admittedthrough the emergency room.
Emergency Referral: the patient was admitted to a facility upon recommendation of anemergency room physician.
HMO Referral: the patient was referred to a facility upon the recommendation of a healthmaintenance organization physician.
Incomplete Injury: spinal cord damage leaving some sensation and/or motor control below theinjury zone because some nerve pathways remain intact.
Level of Injury: level of injury is determined by which vertebrae of the spinal cord has beeninjured. The closer the injury is to the brain, the greater the loss of function and feeling will be.C3-T1 will produce tetraplegia. T1 and below will produce paraplegia; C5 and above willproduce tetraplegia with reduced respiratory function.
Lumbar Spine: the strongest part of the spine, the lower back, consisting of five vertebrae andnerve roots.

22
Paraplegia: loss of function below the cervical spinal cord segments, upper body usually retainsmost function and sensation.
Physician Referral: the patient was admitted to a facility upon the recommendation of his or herphysician.
Tetraplegia (formerly quadraplegia): loss of function of any injured or diseased cervical spinalcord segment, affecting all four limbs.
Transfer from Another Health Care Facility: the patient was admitted to a facility as atransfer from a health care facility other than an acute care facility or a skilled nursing facility.
Transfer from a Hospital: the patient was admitted to a facility as a transfer from an acute carefacility where he or she was an inpatient.
Transfer from a Skilled Nursing Facility: the patient was admitted to a facility as a transferfrom a skilled nursing facility where he or she was and inpatient.
Sacrum Spine: below the lumbar spine, with five vertebrae and nerve roots.
Spinal Cord Injury: any injury of the neural elements within the spinal canal. Can occur fromeither trauma or disease.
Thoracic Spine: at the level of the chest, has twelve vertebrae and nerve roots.
Urgent Admission: the patient requires immediate attention for the care and treatment of aphysical or mental disorder. Generally the patient is admitted to the first available and suitableaccommodation.
Ventilator: a mechanical apparatus or machine, which is used for artificially ventilating thelungs.
23
Introduction to Spinal Cord Injury
The spinal cord is part of the nervous system and is the largest nerve in the body. It is about 18inches long and extends from the base of the brain, down the middle of the back, to about thewaist and is surrounded by protective rings of bone called the vertebral column, or the spinalcolumn. The 33 vertebrae of the spine can be divided into several regions. At the highest levelin the spine, the neck region is the cervical spine, consisting of seven vertebrae and eight nerveroots. They are smaller than the other vertebrae, which allows a greater amount of movement.The thoracic spine, at the level of the chest, has twelve vertebrae and nerve roots. The spinalcanal in the thoracic region is relatively smaller than the cervical or lumbar areas. This makesthe thoracic spinal cord at greater risk if there is a fracture (Maddox, 1993).
Below the thoracic spine is the lumbar spine, the low back region, consisting of five vertebraeand nerve roots and then the sacrum, which also has five fused vertebrae and nerve roots. Thecoccyx, or tailbone, has one vertebrae and nerve root. Vertebrae increase in size as they go downthe column, with the cervical as the smallest and the lumbar the largest.
The central nervous system consists of the brain and spinal cord. The nerves that lie within thespinal cord are upper motor neurons and their function is to carry the messages back and forthfrom the brain to the spinal nerves along the spinal tract. The peripheral nervous system consistsof spinal nerves that branch out from the spinal cord to other parts of the body, that are calledlower motor neurons. These spinal nerves exit and enter at each vertebral level andcommunicate with specific areas of the body. The sympathetic nervous system is a system ofnerves that controls involuntary functions such as blood pressure and temperature regulation.
The term spinal cord injury or SCI refers to any injury of the neural elements within the spinalcolumn. SCI can occur from either trauma or disease to the vertebral column or the spinal corditself, though most spinal cord injuries are the result of trauma to the vertebral column. Thespinal cord does not have to be severed in order for a loss of functioning to occur. In fact, inmost people with SCI, the spinal cord is intact, but the damage to it results in loss of functioningdue to bruising or loss of blood supply. These injuries can affect the spinal cord's ability to sendand receive messages from the brain to the body systems that control the sensory, motor, andautonomic function below the level of injury.
Typically, the nerves above the injury site continue to function as they always have and thenerves below the site do not. A physician describes an individual as having a certain “level”injury by naming the region affected and the level that corresponds with that region. In general,the higher the level of injury, the greater the functional loss. Damage to the cervical region (C1-C8) usually results in a loss of function in the arms and legs, resulting in tetraplegia. Injury tothe thoracic region (T1-T12) usually affects the chest and legs and results in paraplegia.Nationally, the most common types of injury are at the mid-to-low cervical vertebrae (C5-C6),followed by the thoracolumbar junction (T2-L1). Both spots are the spine’s areas of greatestflexibility and vulnerability.

24
Mortality rates are significantly higher during the first year after injury than during subsequentyears. The average life expectancy for a person with spinal cord injury continues to increase dueto improved technology, but is still somewhat below normal. Spinal cord injuries have profoundeffects on the public health system because of the young age of those injured, the high cost ofacute and rehabilitative care, and the long-term disability.

25
v
Executive Summary
Incidence of Spinal Cord Injury
Hospitalization and Cost Information
Circumstances of Spinal Cord Injury
Status at Time of Discharge
Spinal Cord Injury Rates by County of Residence

26

27
Executive Summary
In 1997, there were 230 spinal cord injury events in Wisconsin with the predominant causes ofhospitalizations being falls, motor vehicle crashes, and other injury events. Malesdisproportionately represented 76.5% of spinal cord injury events. In 1997, the average age attime of injury was 41.6 (males 41.2 and females 43.0), with the most frequent age at 16 (males22 and females 13). Males aged 31-45 represented the overall largest group of injury with 55(24% overall) injuries, followed by men in the 16-30 age group with 52 (23% overall) injuries.Females aged 16-30 represented the largest group for women with 14 (6% overall) injuries,followed by women aged 31-45 with 12 (5% overall) injuries. Overall, 58% of all injuries (bothmen and women) occurred between the ages of 16-45. It is interesting to note that 22% of allinjuries occurred to individuals who were age 61 or over. This is especially significant withwomen, as over 28% of all injuries occur to women in that combined age group. Although ageand gender are significant risk factors for spinal cord injury, there are other risk factors thatcontribute such as race, time of year and demographic area.
The majority of individuals admitted for spinal cord injuries during 1997 were white (179 or78%), followed by 26 (or 11%) being black. Although whites sustain the majority of spinal cordinjuries, members of minority groups sustain a disproportionate percentage relative to theirnumbers.
The warmest months (May through July) had the highest number of spinal cord injury events,with May and June being the leading months. Saturday and Sunday had the highest incidence ofspinal cord injuries. It is important to remember that Saturday and Sunday would include anyincidences that occurred the "night" before (after midnight). For example, Saturday injurieswould include any incidence that occurred after midnight on Friday.
The average length of an inpatient hospital stay in 1997 was 26.9 days. In 1997, acute carehospital charges for treatment for spinal cord injuries totaled more than $14 million. Theaverage charge for a non-fatal spinal cord injury was $61,758 per acute inpatient admission.
Spinal cord injuries have profound effects on the public health system because of the young ageof those injured, the high cost of acute and rehabilitative care, and the long-term disability.Thus, the findings of this and future reports will identify the cost and cause of spinal cord injury,leading to strategies to prevent the injuries from occurring in the first place.

28

29
Spinal Cord Injury Events: 1997
The Incidence of Spinal Cord Injury
From January 1, 1997 to December 31, 1997, a total of 230 Wisconsin residents werehospitalized for a spinal cord injury.
Demographics
Sex—Males sustained 176 injuries (76.5%) and females sustained 54 injuries (23.5%) (Graph1.1).
Graph 1.1
Injuries by Gender and Year1997
176
54
020406080
100120140160180
200
Males Females
Age—The average age at time of injury was 41.6. The most frequent age of injury was 16overall, with 22 for males and 13 for females. The mean age at injury was slightly higher forfemales (43.0) than for males (41.2). Ages ranged from 3 to 93. Males aged 31-45 representedthe overall largest group of injury with 55 injuries, followed by men in the 16-30 age group with52 injuries. Females aged 16-30 represented the largest group of women with 14 injuries,followed by women aged 31-45 with 12 injuries (Graph 1.2).

30
Graph 1.2
Injuries by Age and Gender 1997
107
52
14
55
12
24
6
21
4
1411
0
25
50
75
0-15 16-30 31-45 46-60 61-75 75+
Males Females
Overall, 29% of all injuries occurred between the ages of 16-30 and 31-45. The next highest agegroup was 46-60, with 13% of all injuries. Eleven percent occurred between the ages of 46-60and 75 and older. Finally, 7% of all injuries occurred between the ages of 0-15. The totalnumber of spinal cord injuries for each age group and gender is listed in Table 1.4.
Among racial/ethnic groups, whites had the highest mean age at injury (43.1 years), while blackshad the lowest mean age at injury (31.3 years). The mean age at injury for Asians was 33.3years.
Ethnicity—The race of some patients in 1997 was unknown or documented as “other” (22 or10%). The majority of individuals admitted for spinal cord injuries during 1997 were white (179or 78%), followed by 26 or 11% being black and 3 or 1% being Asian and/or Pacific Islander(Graph 1.3).
Although whites sustained the majority of spinal cord injuries, members of minority groups didsustain a disproportionate percentage relative to their numbers in Wisconsin. In fact, 5.5% of theWisconsin population is black, yet this group sustained 11% of all spinal cord injuries inWisconsin.

31
Graph 1.3
Injuries by Race1997
326
179
220
0
50
100
150
200
Asian Black White Other Unknown
Among whites, men were three times as likely to acquire spinal cord injuries than females, whileamong blacks, males were seven times as likely to acquire spinal cord injuries than females.
Hospitalization and Cost Information
Admission Day, Month, Type and Source—In 1997, the majority of spinal cord injury eventsoccurred during the weekend. Saturdays had the highest number of events. Wednesdays had thelowest number of injury events (Graph 1.4).
G r a p h 1 . 4
A d m i s s i o n b y D a y o f t h e W e e k1 9 9 7
2 31 7
3 4
4 1
3 4 3 5
4 6
0
5
1 0
1 5
2 0
2 5
3 0
3 5
4 0
4 5
5 0
Mon
Tues
Wed
Thurs
Fri
Sat
Sun
In terms of the month in which individuals were admitted to hospitals in Wisconsin for spinalcord injuries, the months of May through July had the highest number of injuries. Overall, Junehad the highest number of admissions with 32, followed by May with 26. December had the

32
lowest amount with 9 (Graph 1.5). If race becomes a variable, blacks had the highest incidenceof injury in May, July and October.
Graph 1.5Admiss ion by Month
1997
1 4 1 4
1 91 4
2 6
3 2
2 4
1 3
2 2 2 1 2 2
9
0
5
1 0
1 5
2 0
2 5
3 0
3 5
J a n F e b M a r Apr M a y June July Aug Sept O c t N o v D e c
Both the largest type and source of admission to hospitals involving residents with spinal cordinjuries occurred during emergency situations, where the patient required immediate medicalintervention as a result of severe, life threatening or potentially disabling conditions (Graph 1.6).
G r a p h 1 . 6T y p e o f A d m i s s i o n
1 9 9 7
6 7 %
3 1 %
2 %
E m e r g e n c y ( 1 5 5 ) U r g e n t ( 7 0 ) E l e c t i v e ( 5 )

33
Length of Inpatient Stay—The average length of an acute inpatient hospital stay in 1997 was26.9 days. The average length of stay for men was 27.5 days, for women 25.1 days (Graph 1.7).The average length of stay for a tetraplegia injury was 31.8 days and for a paraplegia injury, 21.0days. Above all factors, respiratory complications, including ventilator dependency, wereresponsible for lengthy hospital stays.
Graph 1.7Average Length of Inpatient Stay by Gender
1997
27.5 25.1
0
10
20
30
40
Males Females
Cost of Inpatient Hospital Care—In 1997, acute care hospital charges for treatment of spinalcord injury totaled more than $14 million. In 1997, the average cost for an acute inpatienthospital stay was $61,758. In terms of gender differences, the cost of hospitalization was greaterfor males than females. Males averaged $63,006 per year, females averaged $57,693 per year.Men averaged almost two and a half more days of acute care, which may account for thedifference in average costs. Fifty-seven percent of all injuries to females resulted in tetraplegia,while just 54% of injuries to males resulted in a tetraplegia diagnosis. It is important toremember that these costs do not reflect the total cost for a spinal cord injury, since medicalequipment, ongoing medical care, home and vehicle modifications, and attendant care greatlyadd to the overall costs of spinal cord injuries.Payer Type—In 1997, the majority of initial inpatient stays (109 or 47%) were paid for by fee-for service insurance. Sixty (26%) initial inpatient stays were paid for by an Alternative HealthCare Insurance Plan (HMO, PPO, PPA, etc.). Other payment types included worker'scompensation (16 or 7%), general relief (1 or .5%), non-Wisconsin Medicaid (1 or .5%), othergovernment agency or program (7 or 3%), and self-pay (21 or 9%). For fifteen (7%) inpatientstays, the exact type of payment, either fee-for-service or HMO was unable to be determined(Graph 1.8).

34
G r a p h 1 . 8
P a y e r T y p e1 9 9 7
2 6 %
7 %1 % 3 % 1 %
9 % 7 %
4 7 %
0 %5 %
1 0 %1 5 %2 0 %2 5 %3 0 %3 5 %4 0 %4 5 %5 0 %
FFS
HM
Os,
PPOs
Worker's
Com
p
Gen. R
elief
Govn't
Agcy
Non-W
I
Medicaid
Self-pay
Unknow
n
Primary and Secondary Payer— Medicare was the primary payer for 42 initial inpatient stays;Medicaid for 24 stays. Medicare was the secondary payer for 11 initial hospital stays; Medicaidfor 12.
Circumstances of Spinal Cord Injury
Causes of Injury—Based on the available information from E-Codes, the leading cause ofspinal cord injury during 1997 was falls (97), followed by motor vehicle crashes (78), and thenother injury events (25). Motor vehicle crashes were the leading cause of injury to those aged 0-45. After age 46, the leading cause of injury was due to some type of fall (Graph 1.9). Causesof spinal cord injury can vary by race. Accidental falls were the leading cause among whites(84), followed by motor vehicle crashes (61). Intentional injuries (assault and self-inflicted)were the leading cause of spinal cord injury among blacks (10), followed by falls (8). In fact,intentional injuries were the cause of 38% of all spinal cord injuries among blacks.

35
78
1 3
97
2 5
11 2
1 1 2
0
20
40
60
80
100
120
MV
C
OT
I
Falls
OIE TS
Ass
ault
SII
IU
NE
C
Motor Vehicle Crashes (MVC) Other Transport Injuries (OTI)Falls Other Injury Events (OIE)Therapeautic Substances (TS) AssaultSelf-Inflicted Injuries (SII) Intention Unclear ( IU)Natural/Environmental Causes (NEC)
G raph 1 .9
Causes o f In ju ry1 9 9 7
The leading causes of injuries of spinal cord injuries from 1997 are listed in Table 1.3.

36
Table 1.3Causes of SCI, by Gender: 1997
Cause(with E-code)
Male#
Male%
Female#
Female%
Total#
Total%
UnintentionalMotor Vehicle Crashes (810-819, 929.0)Other Transport Injuries (820-848, 929.1)Falls(880-888, 929.3)Other Injury Events(870-879, 916-928)Natural/Environmental Factors(900-909)Therapeutic Substances (930-949)
48
13
79
20
2
1
27
7
45
11
1
1
30
0
18
5
0
0
56
0
33
9
0
0
78
13
97
25
2
1
34
6
42
11
.5
.5
IntentionalAssault(960-969)Self-inflicted Injuries(950-959)
12
0
7
0
0
1
0
2
12
1
5
.5
UnclearIntention Unclear(980-989)
1 1 0 0 1 .5
Total With Cause Known 176 100 54 100 230 100

37
Table 1.4Causes of SCI by Selected Age Groups: 1997
Male Female TotalAge Groups & Causes Number of
SCI Events %Number ofSCI Events %
Number ofSCI Events %
0-15 Total All Causes
Motor Vehicle Crashes Other Transport Injuries
Falls Other Injury Events
Therapeutic Substances Assaults
Self-inflicted Injuries Intention Unclear
10 30
2 2 02
0 1
100 30 0
20 20 0
20 0
10
7 4 0 1 2 00
0 0
100 57 0 14 29 0
0 0 0
17 7 0 3 4 02
0 1
100 41 0 18 23 0
12 0 6
16-30 Total All Causes
Motor Vehicle Crashes Other Transport Injuries
Falls Other Injury Events
Therapeutic Substances Assaults
Self-inflicted Injuries Intention Unclear
52 15
4 16 10
0 7 00
100 29
83119
0 13
00
1410 0 2 1 0 0 1 0
100 72
0 14
7 0
07
0
6625 4
18 11
0 7 1 0
10038 6
27 17
011
1 0
31-45 Total All Causes
Motor Vehicle Crashes Other Transport Injuries
Falls Other Injury Events
Therapeutic Substances Assaults
Self-inflicted Injuries Intention Unclear
55 16
827 2 02 00
100 29 14 49
3.5 1
3.5 00
1210 011
0 0 0 0
100 84
0 88
0 0 0 0
67 26
8 28
30 2 00
10039
1242
403
0 0
46-60 Total All Causes
Motor Vehicle Crashes Other Transport Injuries
Falls Other Injury Events
Therapeutic Substances Assaults
Self-inflicted Injuries Intention Unclear
24 6 1 13 3 1 00
0
100 25
4 54
13 4
00
0
6 1 05
0 0 00
0
100 17 0 83 0
0 0
0 0
30 71
18 31
0 0 0
100 24 3 60
10 3 0
0 0

38
(Table 1.4, Continued)
61-75 Total All Causes
Motor Vehicle Crashes Other Transport Injuries
Falls Other Injury Events
Therapeutic Substances Assaults
Self-inflicted Injuries Intention Unclear
21 6 0
132
0 0 0 0
10028.5 0 62
9.5 0
0 0 0
42
02
0 0 0 0 0
10050
0 50
00
0 0
0
25 80
15 2 0 0 0 0
100 32 0 60
8 0
0 0 0
75+ Total All Causes
Motor Vehicle Crashes Other Transport Injuries
Falls Other Injury Events
Therapeutic Substances Assaults
Self-inflicted Injuries Intention Unclear
Natural/Environmental Factors
14 2 1 81
0 0 0 02
10014.5 7 57 7 0 0 0 0
14.5
113
071
0 0 0 00
10027
0 64
90
0 0
00
255
1 15 20
0 0 0
2
100 20 4 60 8
0 0 0 0
8
Falls—Falls were by far the leading cause of spinal cord injury among Wisconsin residents. In1997, 97 spinal cord injuries (79 or 45% of injuries to males and 18 or 33% of injuries tofemales) were sustained in a accidental fall. Overall, males sustained approximately 4.4 times asmany spinal cord injury events as a result of accidental falls than did females. Falls were theleading cause of spinal cord injury for both genders between 46 and older, and the secondleading cause of injury for persons aged 0-45.
The majority of identified falls (64%) occurred when the individual fell from one level to another(falling down stairs, off ladders and chairs, etc.). Six (6%) of injuries were sustained fromshallow water dives.
Motor Vehicle Crashes—Motor vehicle crashes were the second leading cause of spinal cordinjury in Wisconsin. There were 78 motor vehicle crashes resulting in spinal cord injuryrecorded in Wisconsin in 1997, with sixty-one percent of those events occurring to men. Mensustained 48 spinal cord injuries due to motor vehicle crashes, while females sustained 30injuries. Motor vehicle crashes were the leading cause of spinal cord injury for both genders age0 to 45.
In the majority of motor vehicle crashes (51%), the driver was the individual to sustain the spinalcord injury. Based on the available information from E-Codes, 9% of motor vehicle injuriesoccurred to individuals while operating a motorcycle, all of these injuries to males (Table 1.8).

39
Other Injury Events—This was the third leading cause of injury, not related to transportvehicles, including machine injuries, sport injuries, and injuries incurred during medicalprocedures. There were 25 injuries sustained in 1997 due to these events. Males sustained 20(80%) of these injuries.
Other Transport Injuries—In 1997, other transport injuries were the fourth leading cause ofspinal cord injury, with 13 injuries reported. Other transport injuries include injuries fromsnowmobiles, watercraft, and aircraft, among others. Males sustained all 13 (100%) of theseother transport-related events.
Intentional Injuries—Intentional injuries were the fifth leading cause of spinal cord injury. In1997, there were 12 intentional events resulting in spinal cord injury. Men sustained all 12(100%) of these intentional events. This total includes self-inflicted injury as well as thoseinflicted by other persons.
The question of intention is often considered relevant to causation. An injury is categorized as“intention unknown” when it is unspecified or it cannot be determined whether the injuries areaccidental (unintentional), suicide (attempted), or assault.
Whether ruled accidental, intentional, or intention unknown, firearms were a recurring cause ofspinal cord injury, especially among males. Fourteen firearm injury events were reported, allfourteen (100%) of these to males.
Level and Severity of Injury—There are two categories of spinal cord injuries: paraplegia andtetraplegia. A person is said to have paraplegia when there is a loss of feeling in the lowerportion of the body. Tetraplegia is described as loss of movement in both the upper and lowerportions of the body (Maddox, 1993). In the 1997 data, 55% of the individuals sustained spinalcord injuries resulting in tetraplegia, and 45% in paraplegia (Graph 1.10). Men sustained 95injuries resulting in tetraplegia and 81 injuries resulting in paraplegia. Women sustained 31injuries resulting in tetraplegia and 23 injuries resulting in paraplegia.

40
Graph 1.10
Severity of Injury1997
55%
45%
Tetraplegia (126) Paraplegia (104)
The severity of a spinal cord injury is determined by the level of the injury and by the amount ofneurological impairment. A spinal cord injury at any level may impair strength, sensation,bowel, bladder, and sexual functioning.
A spinal cord injury can also be described as either complete or incomplete. A complete injurymeans an individual has no function, sensation, or voluntary movement below the level of injury.In most cases, both sides are equally affected. An incomplete injury means there is somefunctioning below the primary level of injury. The individual may be able to move one limbmore than another, feel parts of the body that cannot be moved, or may have more functioning onone side of the body than the other. Due to advances in medicine, the incomplete injury is morecommon.

41
Table 1.5
Principal Diagnosis
Diagnosis Code Principal Diagnosis Male Female Total806 Fracture of vertebral column with spinal cord
injury806.0 Cervical, closed806.00 C1-C4 level with unspecified spinal cord injury 3 3 6806.01 C1-C4 level with complete lesion of cord 4 2 6806.03 C1-C4 level with central cord syndrome 6 2 8806.04 C1-C4 level with other specified spinal cord injury 4 0 4806.05 C5-C7 level with unspecified spinal cord injury 8 3 11806.06 C5-C7 level with complete lesion of cord 9 1 10806.07 C5-C7 level with anterior cord syndrome 1 2 3806.08 C5-C7 level with central cord syndrome 4 1 5806.09 C5-C7 level with other specified spinal cord injury 11 5 16806.1 Cervical, open806.11 C1-C4 level with complete lesion of cord 1 0 1806.14 C1-C4 level with other specified spinal cord injury 1 0 1806.16 C5-C7 level with complete lesion of cord 1 0 1806.2 Dorsal (thoracic), closed806.20 T1-T6 level with unspecified spinal cord injury 6 0 6806.21 T1-T6 level with complete lesion of cord 9 1 10806.22 T1-T6 level with anterior cord syndrome 1 0 1806.24 T1-T6 level with other specified spinal cord injury 1 0 1806.25 T7-T12 level with unspecified spinal cord injury 6 3 9806.26 T7-T12 level with complete lesion of cord 11 1 12806.29 T7-T12 level with other specified spinal cord injury 10 3 13806.3 Dorsal (thoracic), open806.36 T7-T12 level with complete lesion of cord 1 0 1806.39 T7-T12 level with other specified spinal cord injury 2 0 2806.4 Lumbar, closed 19 6 25806.5 Lumbar, open 1 0 1806.6 Sacrum and coccyx, closed806.60 With unspecified spinal cord injury 0 1 1806.7 Sacrum and coccyx, open806.70 With unspecified spinal cord injur;y 1 0 1806.8 Unspecified, closed 1 0 1

42
952 Spinal cord injury without evidence of spinalbone injury
952.0 Cervical952.00 C1-C4 level with unspecified spinal cord injury 9 3 12952.01 C1-C4 level with complete lesion of spinal cord 1 0 1952.02 C1-C4 level with anterior cord syndrome 2 0 2952.03 C1-C4 level with central cord syndrome 8 3 11952.04 C1-C4 level with other specified spinal cord injury 2 0 2952.05 C1-C4 level with unspecified spinal cord injury 5 3 8952.06 C1-C4 level with complete lesion of spinal cord 2 0 2952.07 C5-C7 level with anterior cord syndrome 2 0 2952.08 C5-C7 level with central cord syndrome 8 2 10952.09 C5-C7 level with other specified spinal cord injury 3 1 4952.1 Dorsal (thoracic)952.10 T1-T6 level with unspecified spinal cord injury 1 0 1952.14 T1-T6 level with other specified spinal cord injury 0 1 1952.15 T7-T12 level with unspecified spinal cord injury 0 1 1952.2 Lumbar 3 2 5952.4 Cauda Equina 1 0 1952.8 Multiple sites of spinal cord 0 1 1952.9 Unspecified site of spinal cord 7 3 10
43
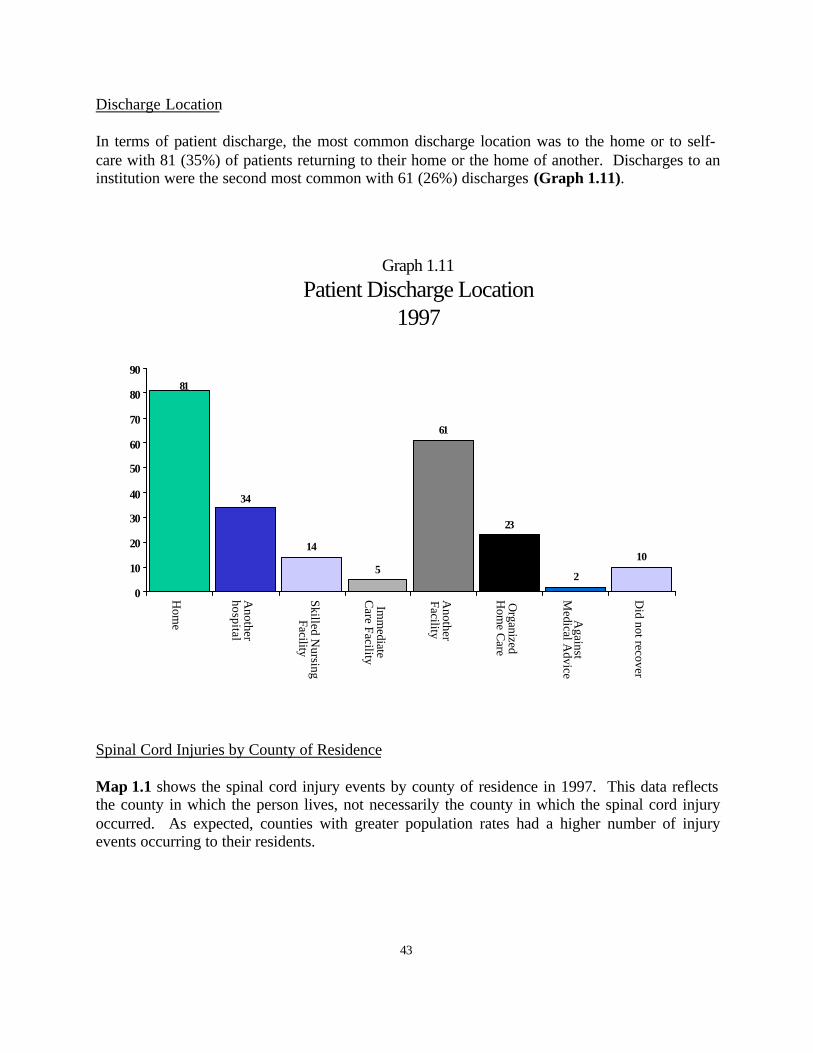
Discharge Location
In terms of patient discharge, the most common discharge location was to the home or to self-care with 81 (35%) of patients returning to their home or the home of another. Discharges to aninstitution were the second most common with 61 (26%) discharges (Graph 1.11).
Graph 1.11Patient Discharge Location
1997
14
5
61
23
2
10
81
34
0
10
20
30
40
50
60
70
80
90
Hom
e
Another
hospital
Skilled Nursing
Facility
Imm
ediateC
are Facility
Another
Facility
Organized
Hom
e Care
Against
Medical A
dvice
Did not recover
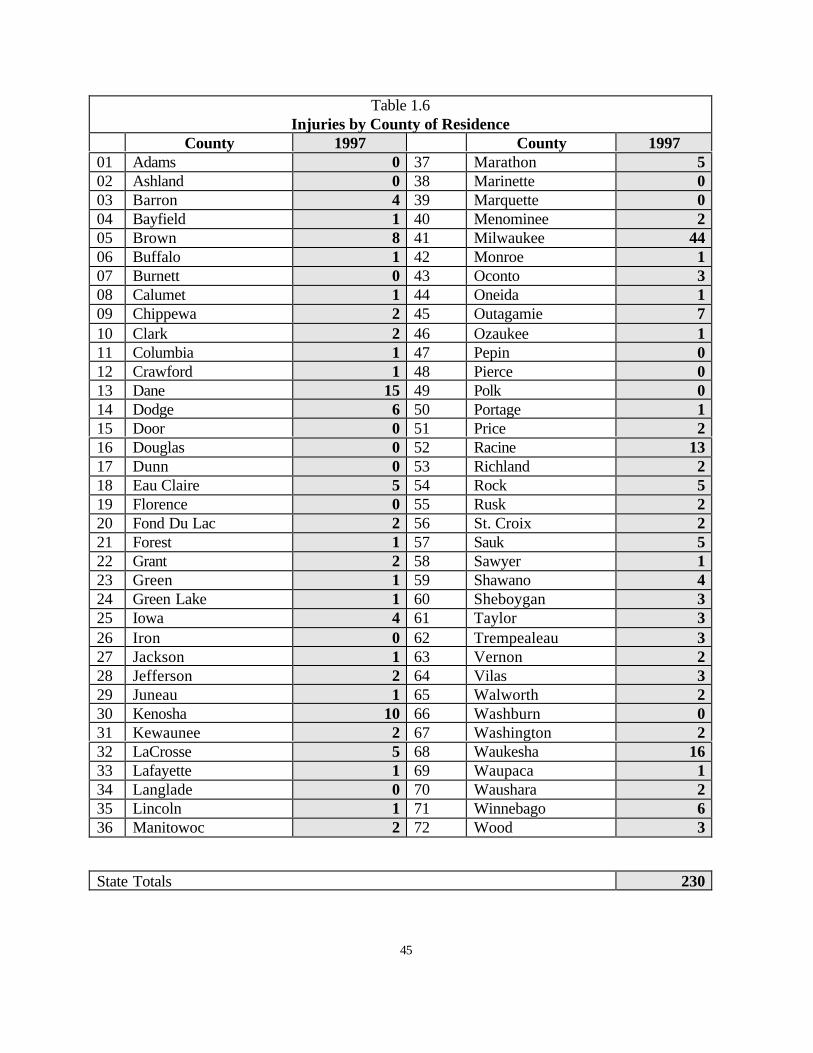
Spinal Cord Injuries by County of Residence
Map 1.1 shows the spinal cord injury events by county of residence in 1997. This data reflectsthe county in which the person lives, not necessarily the county in which the spinal cord injuryoccurred. As expected, counties with greater population rates had a higher number of injuryevents occurring to their residents.

44
!
$
Washburn
Burnett
DouglasBayfield
Sawyer
AshlandIron
Vilas
OneidaPrice
Polk Barron Rusk
ChippewaSt. Croix Dunn
Taylor
LincolnLanglade
Forest Florence
Marinette
Oconto
ClarkMarathon
Shawano
Wood Portage Waupaca
Menominee
Door
Kewaunee
Brown
Pierce
Pepin
Buffalo Tremp-ealeau
Eau Claire
La Crosse
MonroeJuneau
Adams
Waushara
Outagamie
Manitowoc
Sheboygan
SaukVernon
CrawfordRichland
Grant
Iowa
LafayetteGreen Rock Walworth
Kenosha
Racine
Washington
Ozaukee
Columbia
DaneJefferson
Dodge
Waukesha Milwaukee
Fond du LacMarquette
Green-Lake
Winnebago Calu-met
Jackson
0 1
3
0 0 1
0 4
2
0
05
2
13
1
5
2
11
2
4
1
15 2
2
16
5 1 6
0
1
2 3
1
8
6
1 1
2
0
3
7
7
2
2
0
32
4
5
0
0
12
31
0
2
0 0
0
0
0
1
44
2
1 1 52
13
10
Map 1.1Spinal Cord Injuries by
County of Residence, 1997
45
Table 1.6Injuries by County of Residence
County 1997 County 199701 Adams 0 37 Marathon 502 Ashland 0 38 Marinette 003 Barron 4 39 Marquette 004 Bayfield 1 40 Menominee 205 Brown 8 41 Milwaukee 4406 Buffalo 1 42 Monroe 107 Burnett 0 43 Oconto 308 Calumet 1 44 Oneida 109 Chippewa 2 45 Outagamie 710 Clark 2 46 Ozaukee 111 Columbia 1 47 Pepin 012 Crawford 1 48 Pierce 013 Dane 15 49 Polk 014 Dodge 6 50 Portage 115 Door 0 51 Price 216 Douglas 0 52 Racine 1317 Dunn 0 53 Richland 218 Eau Claire 5 54 Rock 519 Florence 0 55 Rusk 220 Fond Du Lac 2 56 St. Croix 221 Forest 1 57 Sauk 522 Grant 2 58 Sawyer 123 Green 1 59 Shawano 424 Green Lake 1 60 Sheboygan 325 Iowa 4 61 Taylor 326 Iron 0 62 Trempealeau 327 Jackson 1 63 Vernon 228 Jefferson 2 64 Vilas 329 Juneau 1 65 Walworth 230 Kenosha 10 66 Washburn 031 Kewaunee 2 67 Washington 232 LaCrosse 5 68 Waukesha 1633 Lafayette 1 69 Waupaca 134 Langlade 0 70 Waushara 235 Lincoln 1 71 Winnebago 636 Manitowoc 2 72 Wood 3
State Totals 230

46

47
v
Appendix 1.1:Hospitals and E-Codes,
1997

48
49
Hospitals Reporting SCI
Table 1.7Hospitals Reporting SCI
HOSPITAL CITY COUNTYLanglade Memorial Hospital Antigo LangladeAppleton Medical Center Appleton OutagamieSt. Elizabeth Hospital Appleton OutagamieMemorial Medical Center Ashland AshlandBeaver Dam Community Hospitals, Inc. Beaver Dam DodgeMemorial Hospital of Iowa County, Inc. Dodgeville IowaLuther Hospital Eau Claire Eau ClaireSacred Heart Hospital Eau Claire Eau ClaireLakeland Medical Center, Inc Elkhorn WalworthFort Atkinson Memorial Health Services Fort Atkinson JeffersonSt. Vincent Hospital Green Bay BrownMercy Health System Corporation Janesville RockLutheran Hospital – La Crosse La Crosse La CrosseFranciscan Skemp Medical Center, Inc. La Crosse La CrosseMeriter Hospital, Inc. Madison DaneSt. Mary’s Hospital Medical Center Madison DaneUniversity of Wisconsin Hospital and Clinics Madison DaneSaint Joseph’s Hospital Marshfield WoodHess Memorial Hospital Mauston JuneauCommunity Memorial Hospital Menomonee Falls WaukeshaChildren’s Hospital of Wisconsin Milwaukee MilwaukeeColumbia Hospital, Inc. Milwaukee MilwaukeeFroedtert Memorial Lutheran Hospital Milwaukee MilwaukeeSacred Heart Rehabilitation Institute Milwaukee MilwaukeeSt. Joseph’s Hospital – Milwaukee Milwaukee MilwaukeeSt. Luke’s Medical Center Milwaukee MilwaukeeSt . Michael Hospital Milwaukee MilwaukeeTheda Clark Medical Center Neenah WinnebagoMercy Medical Center Oshkosh WinnebagoSouthwest Health Center, Inc. Platteville GrantSaint Mary’s Medical Center Racine RacineSheboygan Memorial Medical Center Sheboygan SheboyganSaint Michael’s Hospital Stevens Point PortageWatertown Memorial Hospital Watertown JeffersonWaukesha Memorial Hospital, Inc. Waukesha WaukeshaWausau Hospital Wausau MarathonTri-County Memorial Hospital, Inc. Whitehall TrempealeauRiverview Hospital Association Wisconsin Rapids WoodSinai Samaritan Medical Center Milwaukee Milwaukee

50
HOSPITAL CITY COUNTYHoly Family Memorial Medical Center Manitowoc ManitowocTHC/Vencor Hospital Greenfield MilwaukeeLakeview NeuroRehab Center, Midwest Waterford Racine

51
Table 1.8
E-Codes
E-code
Description Total Male Female
8120 Traffic accidents with motor vehicle, driver 15 8 78121 Traffic accidents with motor vehicle, passenger 8 2 68122 Traffic accidents with motor vehicle, motorcyclist 1 1 08147 Motor vehicle collision with pedestrian, pedestrian 1 0 18160 Motor vehicle-loss of control, driver 24 18 68161 Motor vehicle-loss of control, passenger 14 5 98162 Motor vehicle-loss of control, motorcyclist 6 6 08166 Motor vehicle-loss of control, pedal cyclist 1 1 08167 Motor vehicle-loss of control, pedestrian 1 1 08171 Non-collision motor vehicle, while boarding,
passenger1 1 0
8190 Unspecified motor vehicle accident, driver 1 1 08191 Unspecified motor vehicle accident, passenger 1 1 08199 Unspecified motor vehicle accident, unspecified
person3 2 1
8200 Non-traffic accident (snow vehicle), driver 2 2 08210 Off-road motor vehicle, driver 2 2 08212 Off-road motor vehicle, passenger 2 2 08248 Other motor vehicle, while boarding, other
specified person1 1 0
8250 Other motor vehicle, non-traffic, driver 1 1 08350 Other unspecified fall in water transport, occupant
of small unpowered boat1 1 0
8353 Other unspecified fall in water transport, occupantof other watercraft
1 1 0
8447 Other specified air transport accidents, parachutist 2 2 08796 Other procedures, urinary catheterization 1 1 08809 Fall from stairs or steps, other stairs or steps 13 11 28810 Fall from ladder 4 4 08811 Fall from scaffolding 2 2 0882 Fall from or out of building 13 9 38830 Accident from diving or jumping into water 6 6 08840 Fall from playground equipment 1 1 08842 Fall from chair 3 2 18845 Fall from other furniture 1 1 08846 Fall from commode 2 1 18849 Fall from one level to another 24 23 1885 Fall from same level, slip, trip, or stumble 15 10 5

52
888 Other & unspecified fall 14 9 59068 Other specified injury caused by animals 2 2 0916 Struck by falling object 8 7 19170 Struck by objects or persons – in sports 5 4 19179 Struck by objects or persons – other 3 3 09190 Accident caused by argicultural machines 1 0 19229 Accident caused by firearm, unspecified firearm 2 2 0927 Overexertion and strenuous movements 4 3 19258 Accident caused by electrical current 1 0 19293 Late effects of accidental fall 1 0 19479 Unspecified drugs or medicinal substances 1 1 09571 Suicide/self-inflicted injury, jumping from high
place, other man-made structure1 0 1
9600 Fight/ brawl/ rape, unarmed fight or brawl 1 1 09650 Assault by firearms, handgun 2 2 09654 Assault by firearms, other & unspecified firearms 9 9 09854 Intention unknown accident, other & unspecified
firearm1 1 0

53
v
Appendix 1.2:Spinal Cord Injuries 1997

54

55
Table 1.91997 Data
Category of Data Total Male Female
INCIDENCEIncidence (by gender) 230 176 54
AGE0-15 17 10 7
16-30 66 52 1431-45 67 55 1246-60 30 24 661-75 25 21 4
75+ 25 14 11
RACEAmerican Indian, Native Alaskan 0 0 0
Asian, Pacific Islander 3 1 2Black 26 23 3White 179 134 45Other 2 2 0
Unknown 20 16 4Not Reported 0 0 0
ADMISSION MONTHJanuary 14 9 5
February 14 10 4March 19 15 4
April 14 11 3May 26 21 5June 32 21 11July 24 19 5
August 13 10 3September 22 16 6
October 21 17 4November 22 19 3December 9 8 1
ADMISSION DAYMonday 34 25 9Tuesday 23 17 6
Wednesday 17 11 6Thursday 35 29 6
Friday 34 25 9Saturday 46 39 7
Sunday 41 30 11
ADMISSION TYPEEmergency 155 116 39
Urgent 70 56 14Elective 5 4 1
56
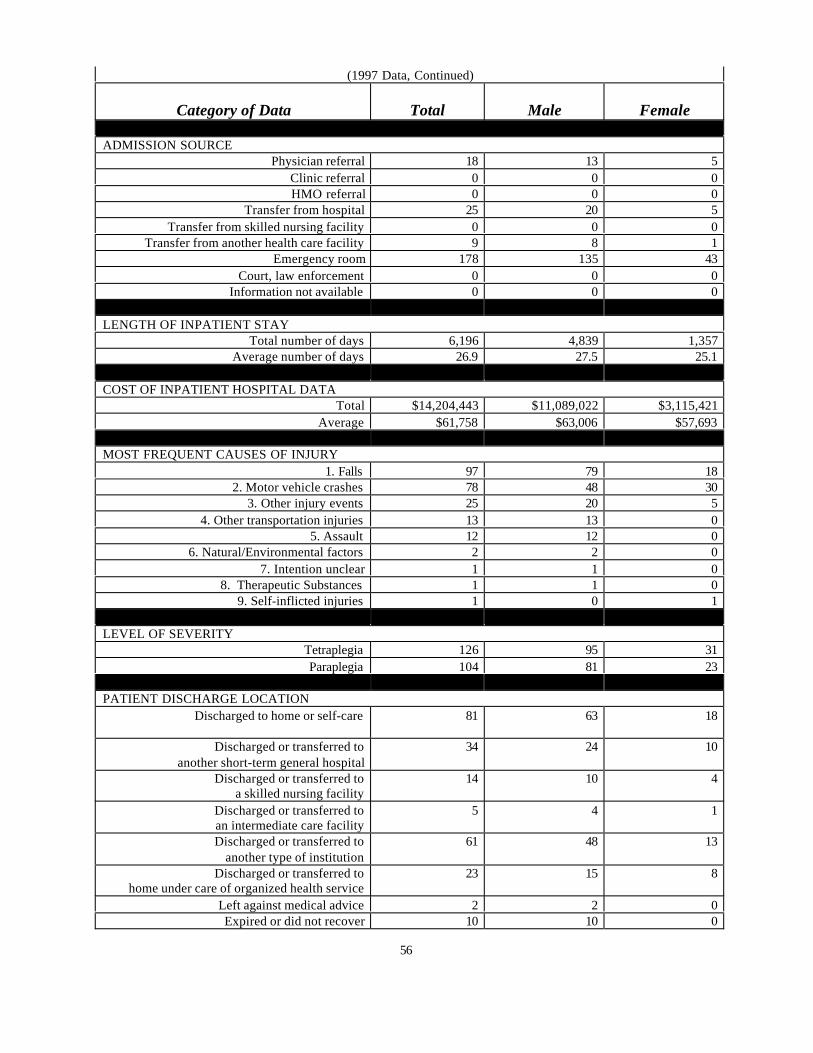
(1997 Data, Continued)
Category of Data Total Male Female
ADMISSION SOURCEPhysician referral 18 13 5
Clinic referral 0 0 0HMO referral 0 0 0
Transfer from hospital 25 20 5Transfer from skilled nursing facility 0 0 0
Transfer from another health care facility 9 8 1Emergency room 178 135 43
Court, law enforcement 0 0 0Information not available 0 0 0
LENGTH OF INPATIENT STAYTotal number of days 6,196 4,839 1,357
Average number of days 26.9 27.5 25.1
COST OF INPATIENT HOSPITAL DATATotal $14,204,443 $11,089,022 $3,115,421
Average $61,758 $63,006 $57,693
MOST FREQUENT CAUSES OF INJURY1. Falls 97 79 18
2. Motor vehicle crashes 78 48 303. Other injury events 25 20 5
4. Other transportation injuries 13 13 05. Assault 12 12 0
6. Natural/Environmental factors 2 2 07. Intention unclear 1 1 0
8. Therapeutic Substances 1 1 09. Self-inflicted injuries 1 0 1
LEVEL OF SEVERITYTetraplegia 126 95 31Paraplegia 104 81 23
PATIENT DISCHARGE LOCATIONDischarged to home or self-care 81 63 18
Discharged or transferred toanother short-term general hospital
34 24 10
Discharged or transferred toa skilled nursing facility
14 10 4
Discharged or transferred toan intermediate care facility
5 4 1
Discharged or transferred toanother type of institution
61 48 13
Discharged or transferred tohome under care of organized health service
23 15 8
Left against medical advice 2 2 0Expired or did not recover 10 10 0

57
Conclusions
The establishment of this statewide registry and surveillance program was necessary to documentfactors and demographics associated with the population of individuals that sustains spinal cordinjuries. We believe that the data presented in this report clearly indicates the major etiologies ofinjury, the disproportionate injuries sustained by certain race, age and gender groups, and thecost of these injuries. In the future, we hope to explore the data further to identify the location ofinjury, the time and the factors surrounding the injuries, and other determinants that are crucialfor injury prevention.

58

59
References
Maddox, S. (1993). Spinal network (2nd ed.). Boulder, CO: Library of Congress Cataloging inPublication Data.
National Safety Council (1989). Accident facts: 1988 edition.
National Spinal Cord Injury Statistical Center (1998). Spinal cord injury: Facts and figures at aGlance. Birmingham, AL: The University of Alabama at Birmingham.
Johnson, R.L., Gabella, B.A., Gerhart, K.A., McCray, J., Menconi, J.C., & Whiteneck, G.G.(1997). “Evaluating sources of traumatic spinal cord injury surveillance data inColorado.” American Journal of Epidemiology, 146(3), 266-272.
All population estimates
Wisconsin Department of Administration (1998). Madison, WI: Demographic Services Center.

60
PLS-3149