Embed Size (px)
Citation preview

Performance of the Southern African Large Telescope (SALT)
High Resolution Spectrograph (HRS)
Lisa A. Crause*a
, Ray M. Sharplesb, David G. Bramall
b, Jürgen Schmoll
b, Paul Clark
b, Eddy J.
Youngerb, Luke M. G. Tyas
c, Sean G. Ryan
d, Janus D. Brink
c, Ockert J. Strydom
c, David A. H.
Buckleyc, Martin Wilkinson
c, Steven M. Crawford
a, Éric Depagne
c
aSouth African Astronomical Observatory, P.O. Box 9, Observatory 7935, Cape Town, South Africa
bDurham University, Centre for Advanced Instrumentation, Department of Physics, Science
Laboratories, South Road, Durham, DH1 3LE, United Kingdom cSALT Foundation, P.O. Box 9, Observatory 7935, Cape Town, South Africa
dUniversity of Hertforshire, Hatfield, Hertforshire, AL10 9AB, United Kingdom
ABSTRACT
The Southern African Large Telescope (SALT) High Resolution Spectrograph (HRS) is a fibre-fed R4 échelle
spectrograph employing a white pupil design with red and blue channels for wavelength coverage from 370–890nm.
The instrument has four modes, each with object and sky fibres: Low (R~15000), Medium (R~40000) and High
Resolution (R~65000), as well as a High Stability mode for enhanced radial velocity precision at R~65000. The High
Stability mode contains a fibre double-scrambler and offers optional simultaneous Th-Ar arc injection, or the inclusion
of an iodine cell in the beam. The LR mode has unsliced 500μm fibres and makes provision for nod-and-shuffle for
improved background subtraction. The MR mode also uses 500μm fibres, while the HR and HS fibres are 350μm. The
latter three modes employ modified Bowen-Walraven image-slicers to subdivide each fibre into three slices. All but the
High Stability bench is sealed within a vacuum tank, which itself is enclosed in an interlocking Styrostone enclosure, to
insulate the spectrograph against temperature and atmospheric pressure variations. The Fibre Instrument Feed (FIF)
couples the four pairs of fibres to the telescope focal plane and allows the selection of the appropriate fibre pair for a
given mode, and adjustment of the fibre separation to optimally position the sky fibre. The HRS employs a
photomultiplier tube for an exposure meter and has a dedicated auto-guider attached to the FIF. We report here on the
commissioning results and overall instrument performance since achieving first light on 28 September 2013.
Keywords: Southern African Large Telescope, SALT, High Resolution Spectrograph, HRS, fibre-fed, échelle, Fibre
Instrument Feed, FIF
1. INTRODUCTION
1.1 The Southern African Large Telescope (SALT)1-6
The primary mirror of SALT consists of 91 spherically figured hexagonal 1m segments. The telescope is free to rotate in
azimuth, but the elevation axis of the structure is fixed at 37° from the zenith. A tracker assembly at prime focus then
moves about all six translational and rotational axes in order to track an object as it travels across the annulus of
accessible sky. SALT is thus able to follow celestial targets for between one and three hours, depending on their
declination. Consequently, observations are entirely queue-scheduled to make optimal use of targets’ limited visibility
windows. Access to observing time is limited to members of the SALT Consortium, which includes various groups
distributed across seven partner countries.
The Tracker carries the Payload which includes the four-mirror Spherical Aberration Corrector7-12
(the secondary optics
that remove aberrations introduced by the spherical primary) and SALT’s two first-light instruments: the acquisition and
imaging camera (SALTICAM), and the multi-purpose low-resolution spectrograph (the Robert Stobie Spectrograph,
RSS). An additional fold mirror in the Payload feeds a third focus, reserved for the final first generation instrument – a
fibre-fed high resolution spectrograph, the HRS. Here the Fibre Instrument Feed (FIF) provides the interface for the 50m
long fibre cable that conducts the light to the spectrometer room below the telescope, where the HRS is situated.
1.2 The SALT High Resolution Spectrograph (HRS)
SALT HRS13-15
is an efficient fibre-fed, single-object spectrograph of a dual channel, ‘white pupil’ design. The
instrument’s parabolic primary mirror thus acts to collimate light onto the R4 échelle grating (blaze angle θB = 76°), and
also to focus dispersed light to an intermediate focus. A dichroic beam-splitter then separates the dispersed light into two
separate spectral channels (370-555nm and 555-890nm). Spherical pupil mirrors transfer the separated beams via a fold
mirror to two wavelength-specific volume-phase holographic gratings (VPHGs) used as cross-dispersers. The cross-
dispersed spectra are then imaged by two fully dioptric camera systems onto optimized CCD detectors. A single 2k × 4k
CCD is sufficient to capture all of the blue orders, while a 4k × 4k, fringe-suppressing deep-depletion CCD, is used for
the red camera. Complete free spectral ranges are covered by both the blue and red arms. Fig. 1 shows the optical layout
of the spectrograph and Fig. 2 is a photograph of the échelle that consists of two identical 214mm × 400mm gratings on a
single Zerodur substrate.
Figure 1. The optical layout of the SALT HRS (excluding the fore-optics), showing the white pupil design and the two channels
optimized for blue (370-555 nm) and red (555-890 nm) wavelength ranges.
Figure 2. The physical scale of SALT HRS is perhaps best conveyed by the fact that the échelle grating weighs roughly as much
as individual members of the instrument team! The narrow, spherically-figured pick-off mirror for the exposure meter can be
seen in the centre of the grating, positioned in the dead space between the two sections of the échelle mosaic. The optical surface
of the mirror is pointing to the left in this image.

Much of the optical design for the HRS16
was provided by the University of Canterbury in New Zealand, as their in-kind
contribution to join the SALT consortium. Remaining design work and construction of the instrument began at Durham
University’s Centre for Advanced Instrumentation17
in late-2007. Installation and integration on site at SALT was
carried out during September 2013 and first light was achieved on 28th September. This was followed by a period of
Science Commissioning before SALT partners were invited to submit HRS Science Verification proposals. These
observations were undertaken on a shared-risk basis (and thus not charged to SALT partner time allocations) and the
instrument began delivering fully-charged science observations in May 2014. In this paper we present results obtained
during the Commissioning and Science Verification phases that demonstrate the instrument’s performance.
2. SALT HRS MODES
The fibre bundle for the HRS consists of 16 large, 500μm and 350μm diameter (2.2 and 1.6 arcsec on-sky, respectively),
PolyMicro Technologies FBP broad spectrum step-index fibres. These core sizes were chosen to accommodate the
relatively poor median seeing conditions at SALT. Each of the instrument’s four modes (Low, Medium and High
Resolution, and High Stability) has four fibres, one for the source (star), one for the background (sky) and spares for
these (see Fig. 3). Three of the four fibre pairs (all but the LR mode) feed modified Bowen-Walraven image-slicers that
reformat the fibre image into a narrow slit to improve the resolution. The modification to the slicer optics allows the star
and sky fibres to be sliced simultaneously and to end up with identical optical path lengths through the slicing elements.
The resolving powers for the various modes are: ~15000 for the unsliced 500μm fibres (LR), ~40000 for the sliced
500μm fibres (MR) and ~65000 for the sliced 350μm fibres (HR and HS).
2.1 Low Resolution (LR)
The lowest resolving-power, R~15000 configuration should be seen as a specialist mode. This offers the same fibre
input diameter as the R~40000 mode (500μm), but with two beneficial differences: nominally 1.4 × higher throughput
because the fibre output is not image-sliced (hence the coarser resolution), and the opportunity to use nod-and-shuffle for
improved sky subtraction. The nod-and-shuffle operation samples two different sky fields on either side of the target, for
half of the total exposure time in each case. It ensures that object and sky spectra can be extracted from the same pixels
on the CCD. In addition, the starlight falls on two different regions of the CCD (corresponding to the two fibre
positions) and hence benefits from a √2 reduction in the impact of residual flat-field noise, but without an increase in
read-noise. This improvement in sky sampling and reduction in flat-field residuals will benefit observations of the
faintest targets requiring the lowest resolving power. Examples where the lowest resolving power may be tolerable and
where the improved background sampling might be beneficial include spectroscopy of diffuse interstellar bands against
lines of sight to distant stars or quasars, and molecular band analyses of stars in Local Group galaxies.
2.2 Medium Resolution (MR)
The R~40000 mode is expected to be the most commonly used SALT HRS mode. It has adequately high resolving
power for many projects, but with a larger fibre diameter and thus potentially better seeing-related throughput than the
R~65000 mode. Studies of objects whose intrinsic line widths are broader than two resolution elements of the R~65000
mode, such as rotating stars (e.g. most O and B stars), stars in which the Balmer line strength measurements are the
principal aims, and studies of molecular bands at medium resolution will be well suited to this mode.
2.3 High Resolution (HR)
The R~65000 mode is likely to be selected for projects involving line profile variations when investigating stellar
atmosphere dynamics, resolving closely spaced lines, or in exploring absorbing structures in the interstellar or
intergalactic medium at the highest velocity resolution. Studies that benefit from fine sampling of stellar line profiles,
such as the most precise radial velocity work, will also utilize this resolving power. However, given that the wavelength
stability of the instrument as a whole is much higher than in traditional non-vacuum spectrographs, users may achieve
adequate velocity accuracy even at R~40000 due of the improved systematics compared to other spectrographs.
2.4 High Stability (HS)
The high stability mode is optimized for precision radial velocity measurements and is implemented at R~65000,
because of the importance of adequately sampling the line profiles in order to achieve sub-resolution-element accuracy

(an error of 0.5m/s corresponds to 10-4
of a resolution element!). The light path includes a permanent double-scrambler
to improve the radial scrambling of the fibres and reduce the spectral shifts due to the star moving on the input face of
the fibre. In this mode it is also possible to insert an iodine cell into the beam (both channels) to provide a superimposed
set of wavelength reference lines in the 500-620nm range, or to illuminate the second (sky) fibre with an internal ThAr
calibration source to obtain a simultaneous wavelength calibration. The efficiency of this mode is about half that of the
normal high resolution mode and thus it would normally only be used where this level of wavelength stability is
essential. Note that the simultaneous ThAr and iodine cell options may not be used at the same time.
Table 1. Summary of the four SALT HRS modes and the associated options.
Parameter Low
Resolution
Medium
Resolution
High
Resolution
High Stability
Fibre Diameter (μm) 500 500 350 350
Fibre Diameter (arcsec) 2.23 2.23 1.56 1.56
Slit Width (arcsec) 0.710 0.710 0.355 0.355
Image-Slicers No 3 Slices 3 Slices 3 Slices
Blue Arm Resolving Power 15000 43000 65000 65000
Red Arm Resolving Power 14000 40000 74000 65000
Blue Transmission (% total @ 460nm)* 12 7 7 4
Red Transmission (% total @ 625nm)* 19 11 12 6
Fibre Mode Scrambling No No No Permanent
Nod and Shuffle Optional No No No
Iodine Cell** No No No Optional**
Simultaneous ThAr** No No No Optional**
Total Photon Count*** Yes Yes Yes Yes
* These efficiency values are the as-measured ‘end-to-end’ throughput measurements for the spectrograph as a whole.
** Note that the Iodine Cell and Simultaneous ThAr feed cannot be used at the same time.
*** From the exposure meter (not available when using the Simultaneous ThAr feed in the HS mode)
Figure 3. Left: the Fibre Instrument Feed with its acquisition camera (1) and the fibre pairs for the modes (HS, HR, MR and LR
from top to bottom, star fibres on the left and sky fibres on the right). Right: the High Stability bench showing the iodine cell (1),
the double-scrambler (2) gap in the HS fibres (3) and the fold mirrors (4) to direct light from the ThAr lamp (5) into the fibres.

3. INSTRUMENT PERFORMANCE
3.1 Throughput
End-to-end instrument throughput measurements were made for each mode (from the input ends of the fibres to the
CCDs) prior to the fibre cable being routed up to the Payload. This was done using four narrow-band LEDs with peak
wavelengths at 460nm and 505nm (for the blue channel) and 591nm and 625nm for the red channel. Each fibre input
was illuminated using a small (~50μm) spot at F/4.2, to simulate the output focal ratio of the telescope. The total input
flux was measured using a calibrated photodiode and the LEDs were powered using a stabilized current source to ensure
that the illumination remained constant to ~1-2% during the measurements (this was verified over the course of hours).
Since the bandpass of the LEDs is much greater than one spectrograph order, the detected signal on the CCDs was
measured using an aperture large enough to capture most of the light in the cross-dispersed spectrum. The detected
signal was corrected for background and converted to electrons using the measured gains for the blue and red chips. The
measurements of the integrated signal were found to be repeatable to ~2% for different aperture sizes and background
corrections. The number of incident photons was then estimated from the supplied photodiode calibration curve (W/A)
at the mean wavelength of the diode, using an energy per photon calculated at the peak diode wavelength. Since the
diode absolute calibration varies approximately linearly with wavelength across the LED spectrum (and the energy per
photon varies inversely with wavelength), adopting a mean value should introduce negligible errors (<1%). Including all
known sources of error (scattered light, diffraction) we estimate that the measurements are accurate to 5% of their
absolute value. Measurements were taken for both ‘star’ and ‘sky’ fibres in all four modes and the efficiency data are
plotted as a function of wavelength in Fig. 4 below.
Figure 4. Fibre-input to CCD throughput measurements for the various HRS modes. Solid lines indicate star fibres while dashed
lines represent the sky fibres. Dotted lines are estimates derived from the exposure time calculators for other high resolution
spectrographs (UVES, HARPS and HET HRS) for comparison.
We have also included throughput estimates for three comparable fibre-fed échelle systems: HET HRS,
FLAMES/UVES18
(the fibre feed to UVES from FLAMES) and HARPS19
in Fig. 4. These are not actual laboratory
measurements, but were taken from the various exposure time calculators (ETCs) provided for these instruments, by
assuming no entrance slit losses (0 arcsec seeing) and correcting where necessary for standard atmospheric (0.83-0.91)
and mirror reflectivity (0.92 per surface) transmission (the ETCs generally include the telescope and atmospheric losses).

The MR and HR mode efficiencies would be expected to be very similar (as observed) as the optical layout is almost the
same, and the benefits of the larger fibres in the MR mode are not reflected in this particular test (i.e. there is no
atmospheric seeing). The HS mode transmission is somewhat lower, as expected from the double-scrambler, although
these measurements were made before the final optimization of the double-scrambler alignment was made and are likely
to be underestimates of the true efficiency. These measurements of the four fibre pairs led to those with the highest
transmission being selected as the default object fibres for each mode. Note that the differences between fibres at the
level observed are typical, HARPS quotes a difference of 30% in the relative transmission of their star-sky fibre pair.
A separate measurement was also made of the fibre cable transmission losses at 460nm, using the same setup on the HS
fibres, by measuring the output in the gap between the double-scrambler lenses. The measured transmissions were
72.4% for the HS sky fibre and 78.9% for the HS star fibre. The manufacturer lists the attenuation for this type of fibre
to be 26 dB/km at this wavelength, so for a 42m length of cable this gives 22% transmission loss at 460nm. Adding in
1% Fresnel losses at the fibre input and output (the output is optically bonded to the double-scrambler lens, so there is
only one AR-coated air-glass surface at each end), the predicted throughput would be 76%. This is in good agreement
with the average measured transmission (75.6%).
Reliable on-sky throughput measurements require photometric conditions, good seeing, a well aligned SALT primary
mirror and the cooperation of a number of telescope and instrument sub-systems. The HRS Exposure Time Calculator
(ETC) was used to predict fluxes from the HRS for a radial velocity standard star (HD157881, a K7 dwarf with an
effective temperature of 4020K, a surface gravity of 4.50 and a V-band magnitude of 8.1) that was observed under these
favourable conditions. The ETC predictions could then be compared with spectra obtained while the Sutherland seeing
monitor reported 1.4 arcsec seeing and the HRS auto-guider measured a FWHM = 1.6 arcsec on the guide star. Fig. 5
shows the comparison between the measured S/N ratio and the prediction from the ETC for each channel, assuming a
Kurucz model with an effective temperature of 4000K. We also show the prediction (green dashed line) using the VLT
ETC for UVES/FLAMES (R~47000), but assuming seeing of FWHM = 0.75 arcsec. The FLAMES fibres are 1.0 arcsec
diameter and 55 metres long so the aperture losses are equivalent to using a 2.2 arcsec diameter fibre in FWHM = 1.5
arcsec conditions with SALT HRS (and also fairly reflects the different intrinsic seeing at the two sites).
Figure 5. Comparisons between the SALT HRS ETC S/N predictions and MR mode spectra of a radial velocity standard star
obtained under photometric conditions with 1.5 arcsec seeing and a well-aligned primary mirror. The blue channel is shown on
the left and the red on the right. The dashed line shows the VLT/UVES ETC prediction for R~47000 and 0.75 arcsec seeing.
The SALT HRS efficiencies currently encoded into the ETC are close for the blue channel, but are ~10% too high for the
red channel. We note that the Pickles stellar models would produce better predictions than the Kurucz models (e.g. the
strong absorption feature at 710nm in the ETC curve is due to a failure of the Kurucz models) and so these will be
incorporated into the HRS ETC. The absorption dip in the HRS spectrum at 770nm is due to the telluric A-band.

3.2 Stability
Stability is critical for high resolution spectrographs to be competitive. To this end, the SALT HRS optical components
are mounted on an optical bench contained within a steel vacuum tank that is held at a pressure of 0.05 mBar. The
instrument is thus well isolated from the destabilizing effects of temperature and atmospheric pressure variations. The
tank rests on pneumatic isolators to minimize vibrations and is bricked inside a Stryrostone enclosure for additional
thermal insulation. The temperature of the instrument room is also actively controlled to within a few tenths of a degree
Celsius, while the tank temperature is fine-tuned by a heating wire bonded to the outer surface of the tank. Numerous
temperature sensors constantly monitor the main optical components, the bench, the tank and the air inside and outside
the thermal enclosure. The wavelength stability of the instrument is monitored with regular internal ThAr arc exposures.
Figure 6. Left: HRS inside its insulated enclosure (1) in the spectrometer room below SALT. With the side door panel removed,
one can see the vacuum tank (2), the High Stability bench (3), the blue and red cameras (4), the insulation on the floor (5) and the
instrument PI (6). Right: inside the HRS room, with the Styrostone (1) thermal enclosure only partly built up around the tank.
The various cable feed-throughs (2), the tank heating wire (3), the vacuum hose (4) and the exposure meter (5) can also be seen.
Figure 7. Normalised flux measurements of the internal ThAr calibration lamp for the blue (left) and red (right) channels over a
3.5 day interval, showing the line stability as the system settled down after an air-conditioning glitch. The system meets the
stability specification of 10% (rms) over a 12 hour period.

Figure 8. Line width (FWHM) measurements of the internal ThAr calibration lamp for the blue (left) and red (right) channels
over a 3.5 day interval. The system meets the stability specification of 1% (rms) over a 12 hour period.
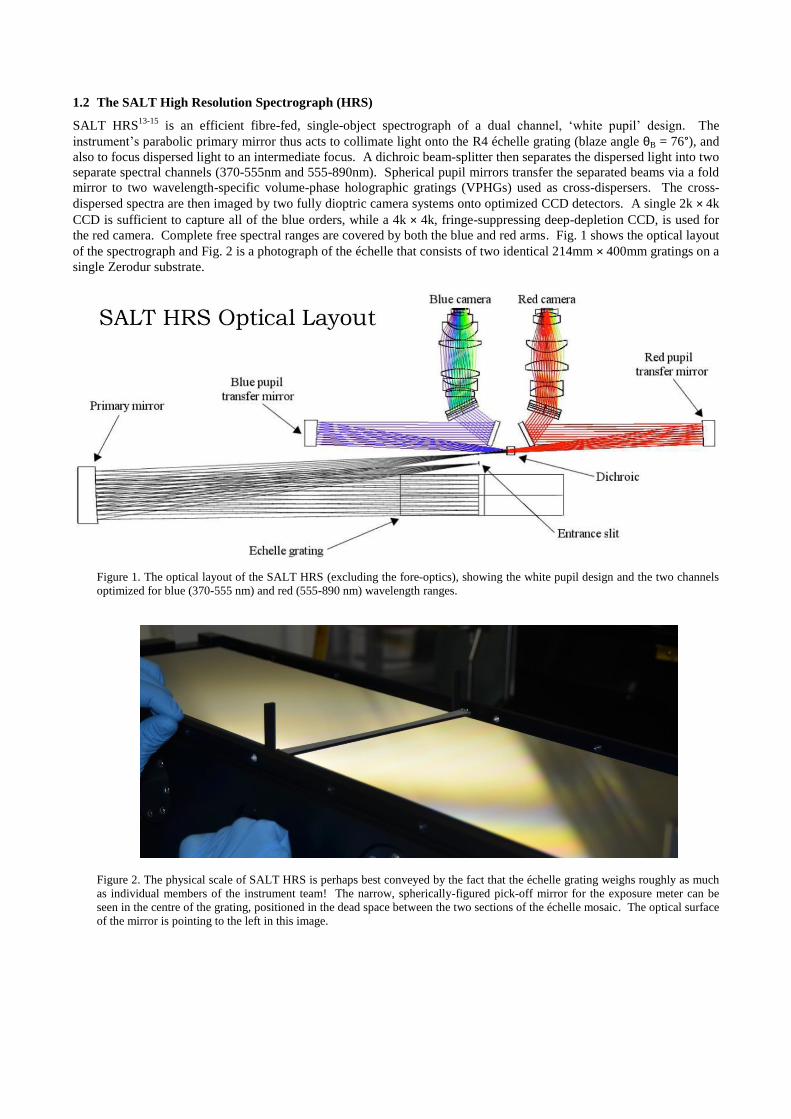
3.3 Spectral Resolution
The spectral resolution for the LR, MR and HR modes was measured on the telescope using the SALT calibration
system’s ThAr arc to illuminate both fibres. Because of the extreme faintness of this source, several long exposure arcs
(typically 1800s each) were median-combined to improve the S/N. For the HS mode it was possible to use the internal
ThAr arc lamp on the high stability bench. This is considerably more efficient and so the exposure times were only 10s.
The arc lines were detected using SExtractor20
and the spectral line widths were measured using a Python Gaussian-
fitting script. Individual FWHM measurements, as a function of position on the detector, were fitted using a quadratic
surface to look for systematic effects associated with field curvature and anamorphic magnification. The median spectral
resolutions for the blue and red channels were then calculated in 3×3 grids covering the two chips. A mean dispersion of
0.0032 nm/pixel and a central wavelength of 475nm were used for the blue channel, while a mean dispersion of 0.0043
nm/pixel and a central wavelength of 700nm were applied for the red channel. The surface plots for each mode and
channel, and the corresponding median spectral resolutions, are shown in Figures 9 and 10 below, with the number of
lines averaged for each measurement given in parentheses. The dominant effect causing the spectral resolution to change
in the dispersion direction is the variation in anamorphic magnification from the échelle. This is most pronounced for
the MR mode as those slits are offset the furthest from the optical axis of the collimator. It is also always more
pronounced for the red channel with its more extended CCD.
Table 2. Specified and achieved resolving powers for the blue (left) and red (right) channels in the various modes.
Mode Specification Achieved Low Resolution 12700 12700 15000 14000
Medium Resolution 33000 33600 43400 39600
High Resolution 58000 62300 66700 73700
High Stability 58000 62300 66900 64600
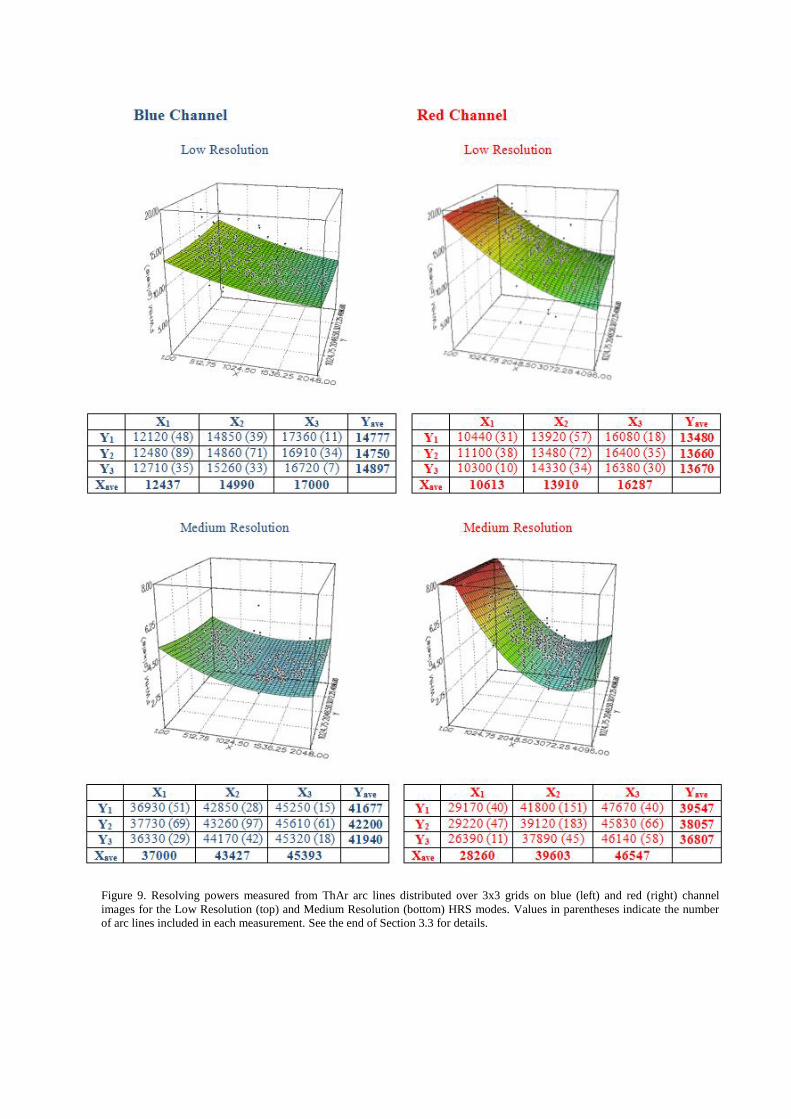
Figure 9. Resolving powers measured from ThAr arc lines distributed over 3x3 grids on blue (left) and red (right) channel
images for the Low Resolution (top) and Medium Resolution (bottom) HRS modes. Values in parentheses indicate the number
of arc lines included in each measurement. See the end of Section 3.3 for details.
Figure 10. Resolving powers measured from ThAr arc lines distributed over 3x3 grids on blue (left) and red (right) channel
images for the High Resolution (top) and High Stability (bottom) HRS modes. Values in parentheses indicate the number of arc
lines included in each measurement. See the end of Section 3.3 for details.

4. SALT HRS OPERATIONS
As with the other SALT instruments, HRS proposals are written and submitted using the SALT Principal Investigator
Proposal Tool (PIPT), in conjunction with the SALT HRS exposure time calculator. These proposals go into the Science
Database where they are accessible to the SALT Astronomy Operations Team via the Web Manager. Active proposals
are then subject to queue scheduling so that when a target becomes visible to SALT, the Observation Configuration
System may be used to send the desired settings to the instrument. The HRS MMI is a LabVIEW graphical interface that
is used to configure the instrument and run the procedures required to capture the data. The first phase of the HRS data
reduction software is a Python/PyRAF based quick-look tool with a PyQt GUI that will allow the SALT Astronomer to
assess data quality at the telescope. The data are then transferred to Cape Town for basic pipeline reduction the next day,
before being made available to the PIs for download. A full HRS data pipeline will eventually be incorporated into the
PySALT suite of data reduction and analysis packages.
SALT HRS offers a variety of detector configurations. The CCDs can be read out at either 400 kHz or 1000 kHz (with
read noise of 3.6 and 4.7 e- RMS, respectively, in the red; and 4.2 and 5.8 e
- RMS in the blue), through either single or
multiple readout amplifiers (two in the case of the blue channel and four in the red). Binning choices include 1×1, 2×2,
3×3, 9×9 and 3×1, the latter with binning in the spatial direction only. Exposure times need not be the same for the red
and blue channels. The detectors do, however, have to be read out sequentially and so even if the exposure times are
equal, it will still take approximately 50s to read out both chips and write the new files (for a set of unbinned frames). A
windowed readout option has yet to be implemented, but will be made available in the future.
A custom-made pick-off mirror (a 200mm long sliver of aircraft-grade aluminium, diamond-turned to produce the
required spherical figure on the ~2mm wide optical surface) is mounted in the 16mm wide gap between the two identical
sections of the échelle grating mosaic. Starlight that would otherwise be wasted is thus fed to a photomultiplier tube
(PMT) that serves as an exposure meter (EM). This allows the observer to monitor the progress of an exposure and
adapt accordingly to varying observing conditions. The EM reports the total counts recorded by the PMT, allowing the
mean count and the flux-weighted mid-point of the exposure to be calculated. The latter is particularly important for
radial velocity studies where a precise correction for the Earth’s orbital motion needs to be applied. The EM is suitable
for targets ranging in brightness from V ≈ 3-14 and is also useful for peaking up the fibre position during acquisition, as
well as for monitoring the telescope focus through the course of the observation.
The two panels in Fig. 11 illustrate the spectral formats for the red and blue cameras, including the orders, their blaze
wavelengths and inter-order spacings, as well as the positions of various spectral features. Fig. 12 shows raw blue (left)
and red (right) calibration frames for the different sliced modes. Both fibres are illuminated in all cases so the orders are
paired. The images are HR twilight sky flats (top), MR SALT CalSys ThAr+Ar arcs (centre) and HS flat-fields with the
iodine cell in the beam (bottom), superimposing a dense forest of absorption features on the spectra.
The SALT calibration system will soon be upgraded substantially and this will greatly simplify HRS operations. The
current system has made it impractical to take arcs during the night, or even to do so regularly during the daytime.
Although the instrument’s intrinsic stability reduces the need for daily calibrations, an appropriate schedule for taking
arcs and flat-fields will be established once the new SALT CalSys is in operation (likely within the next few months).
Sets of 11 bias frames are currently taken each night while sky flats are obtained on a ~monthly basis. Internal ThAr
arcs will continue to be taken daily to monitor the stability of the instrument, particularly once the remaining thermal
insulation issues have been addressed. CalSys flats use a quartz/tungsten/halogen source with a ‘Clear-UV’ filter to help
balance the flux distribution while CalSys arcs currently include both a ThAr and an Ar lamp. Radial velocity standard
star observations will continue to be made during twilight and made available to all HRS PIs.

Figure 11. The simulated spectral formats of the SALT HRS red (top) and blue (bottom) channels, showing the order numbers
(m), the blaze wavelength (λB) of each order, the inter-order spacing (Δy) and the position of some commonly studied spectral
lines. The dashed lines indicate the limits corresponding to one free spectral range in each order. Wavelengths increase from left
to right and bottom to top in each panel.

Figure 12. Raw HRS calibration frames, blue on the left and red on the right. From top to bottom these are: twilight sky flats,
SALT CalSys ThAr+Ar arcs and CalSys flat-field images taken with the iodine cell in the beam, superimposing a dense forest of
iodine absorption lines on the 500-620nm region of the two cameras.

5. SUMMARY
The HRS was delivered to SALT on 3 September 2013. The 40 foot shipping container and 15 airfreight crates were
unpacked and the instrument reassembled and integrated into the facility. This process was documented daily on the
SALT Astronomy Blog21
during the month of September. First light on 28 September was followed by commissioning
and science verification observations. The instrument meets (or exceeds) specification in terms of spectral resolution,
throughput and stability and compares favourably with similar spectrographs such as UVES on the VLT. SALT HRS is
now fully operational and available to the SALT community.
REFERENCES
[1] Stobie, R., Meiring, J. G., Buckley, D. A. H., “Design of the Southern African Large Telescope (SALT)”, Proc.
SPIE 4003, 355 (2000).
[2] Swat, A., O’Donoghue, D., Swiegers, J., Nel, L. and Buckley, D. A. H., “The optical design of the Southern
African Large Telescope”, Proc. SPIE 4837, 564 (2003).
[3] Buckley, D. A. H., Swart, G. P., Meiring, J. G., “Completion and commissioning of the Southern African Large
Telescope”, Proc. SPIE 6267, 564 (2003).
[4] Meiring, J. G., Buckley, D. A. H., “Southern African Large Telescope (SALT) project, progress and status after
4 years”, Proc. SPIE 5489, 592 (2004).
[5] O’Donoghue, D. et al., “First science with the Southern African Large Telescope: peering at the accreting polar
caps of the eclipsing polar SDSS J015543.40+002807.2”, Mon. Not. R. Astr. Soc, 372, 151 (2006).
[6] http://www.salt.ac.za
[7] O’Donoghue, D., “Correction of spherical aberration in the Southern African Large Telescope (SALT)”, Proc.
SPIE 4003, 363 (2000).
[8] http://www.salt.ac.za/iq/the-salt-image-quality-story
[9] http://saltiqmission.blogspot.com
[10] O’Donoghue, D. E. et al., “The image quality of the Southern African Large Telescope (SALT)”, Proc. SPIE
7018, 32 (2008).
[11] O’Donoghue, D. E., O’Connor, J. E., Crause, L. A., Strümpfer, F., Strydom, O. J., Brink, J. D., Sass, C., Wiid,
E., Atad-Ettedgui, E., “Saving SALT: repairs to the spherical aberration corrector of the Southern African Large
Telescope (SALT)”, Proc. SPIE 7739, 21 (2010).
[12] Crause, L. A., O’Donoghue, D. E., O’Connor, J. E., Strümpfer, F., Strydom, O. J., Sass, C., du Plessis, C., Wiid,
E., Love, J., Brink, J. D., Wilkinson, M., Coetzee, C., “A happy conclusion to the SALT image quality saga”,
Proc. SPIE 8444, 8444I (2012).
[13] Bramall, D. G., Sharples, R., Tyas, L., Schmoll, J., Clark, P., Luke, P., Looker, N., Dipper, N., Ryan, S.,
Buckley, D. A. H., Brink, J., Barnes, S. I., “The SALT HRS spectrograph: final design, instrument capabilities,
and operational modes”, Proc. SPIE 7735, 77354F (2010).
[14] Bramall, D. G., Schmoll, J., Tyas, L. M. G., Clark, P., Younger, E., Sharples, R. M., Dipper, N., Ryan, S. G.,
Buckley, D. A. H., Brink, J., “The SALT HRS spectrograph: instrument integration and laboratory test results”,
Proc. SPIE 8446, 84460A (2012)
[15] Tyas, L. M. G., “The SALT HRS Spectrograph” (2011) - PhD Thesis
[16] Barnes, S., Cottrell, P., Albrow, M., Frost, N., Graham, G., Kershaw, G., Ritchie, R., Jones, D., Sharples, R.,
Bramall, D., Schmoll, J., Luke, P., Clark, P., Tyas, L., Buckley, D., Brink, J., “Optical design of the Southern
African Large Telescope High Resolution Spectrograph: SALT HRS”, Proc. SPIE 7014, 70140K (2008).
[17] https://www.dur.ac.uk/cfai/
[18] Dekker, H., D’Odorico, S., Kaufer, A., Delabre, B., Kotzlowski, H., “Design, construction and performance of
UVES, the échelle spectrograph for the UT2 Kueyen Telescope at the ESO Paranal Observatory”, Proc. SPIE
4008, 534-545 (2000).
[19] Pepe, F., Mayor, M., Queloz, D., Udry, S., Delabre, B., Kohler, D., Lacroix, D., Sivan, J., Benz, W., Bertaux, J.:
“HARPS: a new high-resolution spectrograph for the search extrasolar planets”, Proc. SPIE 4008, 582 (2000).
[20] Bertin, E., Arnouts, S., “SExtractor: Software for source extraction”, Astronomy & Astrophysics Supplement
117, 393 (1996).
[21] http://saltastro.blogspot.com/2013/09/welcome-hrs-airfreight-including.html


![PROCEEDINGS OF SPIE · Proceedings of SPIE The International Society for Optical Engineering ... FORTH-IESL-MRG (Greece); ... (Keynote Paper) [6415-21] C. Iliescu, J. Wei, B. Chen,](https://img.pdfslide.us/doc/110x75/5b3a3fb27f8b9a4a728f10fd/proceedings-of-spie-proceedings-of-spie-the-international-society-for-optical.jpg)