Embed Size (px)
Citation preview
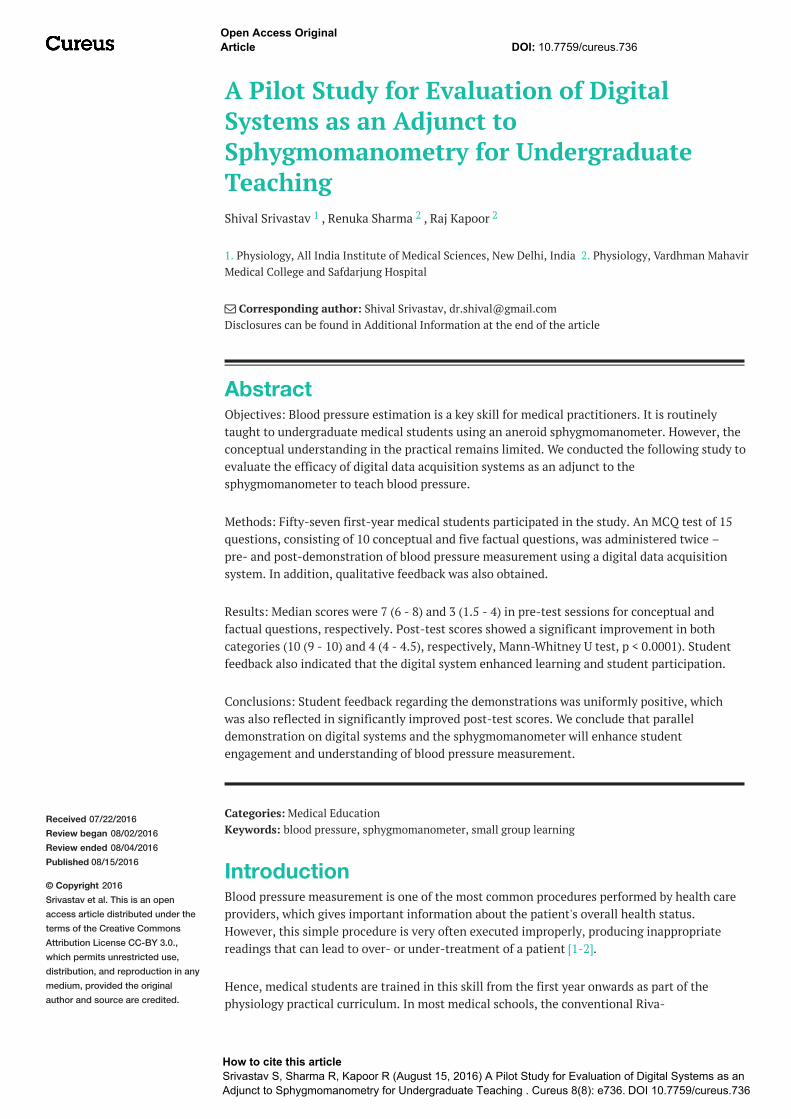
Received 07/22/2016 Review began 08/02/2016 Review ended 08/04/2016 Published 08/15/2016
© Copyright 2016Srivastav et al. This is an openaccess article distributed under theterms of the Creative CommonsAttribution License CC-BY 3.0.,which permits unrestricted use,distribution, and reproduction in anymedium, provided the originalauthor and source are credited.
A Pilot Study for Evaluation of DigitalSystems as an Adjunct toSphygmomanometry for UndergraduateTeachingShival Srivastav , Renuka Sharma , Raj Kapoor
1. Physiology, All India Institute of Medical Sciences, New Delhi, India 2. Physiology, Vardhman MahavirMedical College and Safdarjung Hospital
Corresponding author: Shival Srivastav, [email protected] Disclosures can be found in Additional Information at the end of the article
AbstractObjectives: Blood pressure estimation is a key skill for medical practitioners. It is routinelytaught to undergraduate medical students using an aneroid sphygmomanometer. However, theconceptual understanding in the practical remains limited. We conducted the following study toevaluate the efficacy of digital data acquisition systems as an adjunct to thesphygmomanometer to teach blood pressure.
Methods: Fifty-seven first-year medical students participated in the study. An MCQ test of 15questions, consisting of 10 conceptual and five factual questions, was administered twice –pre- and post-demonstration of blood pressure measurement using a digital data acquisitionsystem. In addition, qualitative feedback was also obtained.
Results: Median scores were 7 (6 - 8) and 3 (1.5 - 4) in pre-test sessions for conceptual andfactual questions, respectively. Post-test scores showed a significant improvement in bothcategories (10 (9 - 10) and 4 (4 - 4.5), respectively, Mann-Whitney U test, p < 0.0001). Studentfeedback also indicated that the digital system enhanced learning and student participation.
Conclusions: Student feedback regarding the demonstrations was uniformly positive, whichwas also reflected in significantly improved post-test scores. We conclude that paralleldemonstration on digital systems and the sphygmomanometer will enhance studentengagement and understanding of blood pressure measurement.
Categories: Medical EducationKeywords: blood pressure, sphygmomanometer, small group learning
IntroductionBlood pressure measurement is one of the most common procedures performed by health careproviders, which gives important information about the patient's overall health status.However, this simple procedure is very often executed improperly, producing inappropriatereadings that can lead to over- or under-treatment of a patient [1-2].
Hence, medical students are trained in this skill from the first year onwards as part of thephysiology practical curriculum. In most medical schools, the conventional Riva-
1 2 2
Open Access OriginalArticle DOI: 10.7759/cureus.736
How to cite this articleSrivastav S, Sharma R, Kapoor R (August 15, 2016) A Pilot Study for Evaluation of Digital Systems as anAdjunct to Sphygmomanometry for Undergraduate Teaching . Cureus 8(8): e736. DOI 10.7759/cureus.736
Rocci/Korotkoff’s technique of measuring blood pressure with a mercury sphygmomanometerand stethoscope is being followed. However, blood pressure measurement is a complex skillthat requires considerable practice in order to gain competence in the recognition ofKorotkoff sounds. Interactions with our medical students revealed that the conceptualunderstanding of the blood pressure practical was far from satisfactory in the majority. Hence,the competency of blood pressure estimation attained by the students was more of a skill ratherthan the underlying concept. Previous studies have also demonstrated that common errorsduring blood pressure measurement, like placing stethoscope diaphragm under the cuff,persisted in fourth and fifth-year medical students as well [3].
Certain researchers have attempted to clarify the concept of blood pressure measurement usingsimulators and supplemental classes to nursing students [4-5]. To the best of our knowledge,no such study has been carried out in medical students to enhance their understanding of thephysiological phenomena underlying blood pressure estimation.
Hence, we designed this study to explore demonstration on digital data acquisition systems, asa supplemental tool, for teaching blood pressure recording to first-year medical students.
Materials And MethodsAfter due approval by Institute Ethics Committee, the study was launched by explaining a briefoutline to all the first-year medical students during lecture hours. All subjects who volunteeredfor the study were enrolled in a random manner and the identity of the students was coded topreserve anonymity and avoid bias. All the non-participants were also assured of no adverseaction for refusal to participate.
After obtaining informed consent, the study protocol was explained and students weredistributed in groups of four to five each. Assessment of baseline knowledge was done using amultiple choice question (MCQ) test, which consisted of 15 questions: 10 conceptual and fivefactual questions (See Appendix I).
The questions were prepared from standard undergraduate textbooks and consisted of fouroptions each. Subsequently, demonstration of blood pressure estimation was done usingPowerLab® digital data acquisition system (AD Instruments, New South Wales, Australia). Toensure uniformity of demonstration, all sessions were conducted by the same person and astandard script was read out. After the demonstration, the MCQ test was re-administered to theparticipants. In addition, a questionnaire to document qualitative feedback was also given.
Demonstration using a digital data acquisition systemThe PowerLab® digital data acquisition system was used to conduct the demonstration. Thesystem is already being used for research worldwide and data acquired using it has beenvalidated in multiple scientific publications [6].
We used three channels of the device for demonstration – a pressure transducer attached toRiva-Rocci cuff, cardio microphone, and pulse transducer, respectively. The pressure transducerwas appropriately calibrated before the start of every demonstration.
The demonstration began by tying the Riva-Rocci cuff around the arm, placing a cardiomicrophone over the brachial artery, and strapping the pulse transducer to the index finger ofthe ipsilateral arm. As the cuff was gradually inflated, the amplitude of the finger pulse begandiminishing. At the point of disappearance of the pulse, the pressure in the cuff was taken as ameasure of systolic blood pressure. Cuff pressure was inflated to 10-16 mmHg beyond this
2016 Srivastav et al. Cureus 8(8): e736. DOI 10.7759/cureus.736 2 of 13
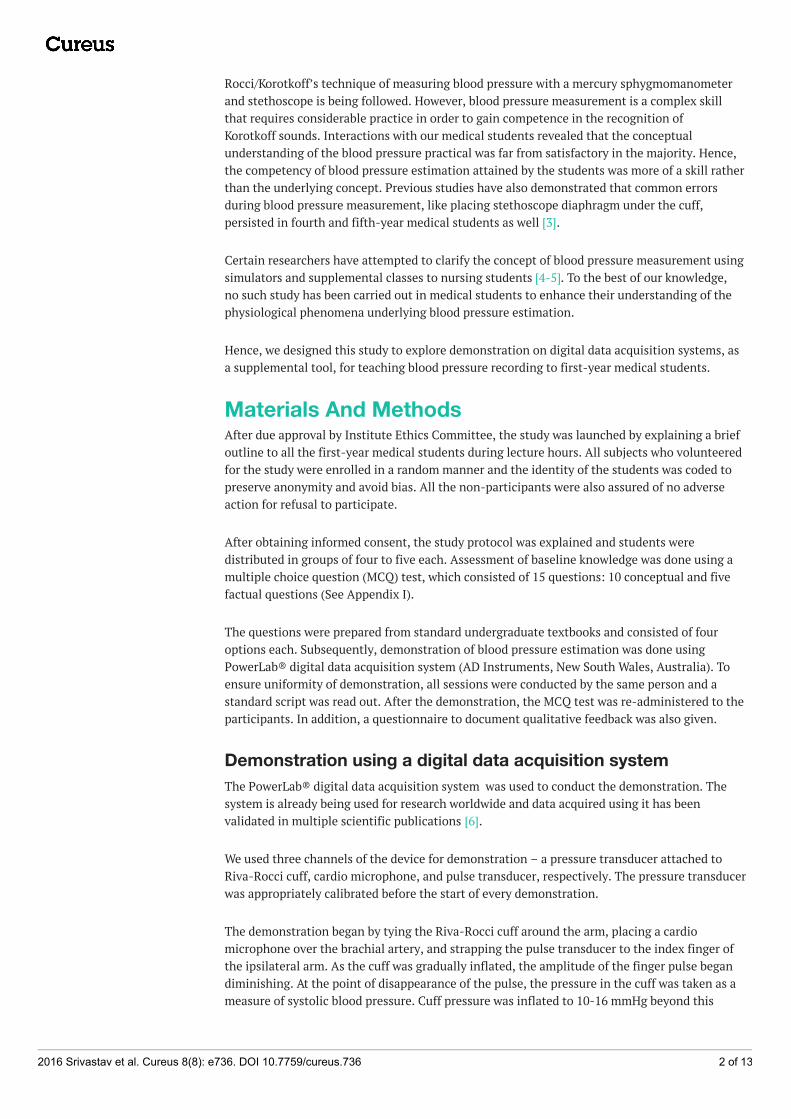
point and subsequently deflated slowly. As the pressure approached systolic pressure, fingerpulse reappeared and Korotkoff sounds were observed in the microphone channel. As thepressure was further lowered, finger pulse regained its normal amplitude and Korotkoff soundsdisappeared when pressure attained diastolic levels, as seen in Figure 1.
FIGURE 1: Representative Record of Blood PressureMeasurement Using the PowerLab© SystemThis is a three channel recording done using PowerLab® system for estimation of bloodpressure. Channel 1 shows pressure in Riva-Rocci cuff taken using pressure transducer.Channel 2 shows pulse waveform taken using pulse transducer from the index finger ofipsilateral arm. Channel 3 shows sounds picked up using a cardio microphone.
The phases of rest, inflation of cuff and deflation of cuff are marked. During rest, the cuffpressure is close to zero, finger pulse is normal in amplitude, and cardio microphone channelshows some noise due to mechanical pulsations picked up by the probe. As the cuff isgradually inflated, the cuff pressure rises and stray signals are picked up by the sensitivemicrophone due to turbulent flow. When cuff pressure surpasses systolic pressure, finger pulsecompletely disappears. When the cuff is slowly deflated, finger pulse reappears and graduallyrises in amplitude and the Korotkoff sounds can be clearly demarcated in Channel 3.
Assessment of MCQ scoreThe MCQ test administered consisted of two parts. The initial 10 questions were based onphysiological concepts underlying measurement of blood pressure using a sphygmomanometerwhile the latter five questions were factual and dealt with commonly used terminologies, suchas Reynold’s number, white coat hypertension, etc.
As discussed earlier, the MCQ test was administered pre- and post-demonstration and scoreswere compared for conceptual and fact-based questions. One mark was awarded for a correctanswer while no marks were awarded for incorrect answers or unattempted questions. Theindividual scores for both categories were compared pre- and post-demonstration.
Qualitative assessmentAlong with the post-demonstration MCQ test, a questionnaire with three open-endedquestions was administered to the students (See Appendix II).
2016 Srivastav et al. Cureus 8(8): e736. DOI 10.7759/cureus.736 3 of 13
The questions recorded the perception and suggestions of the students regarding the utility ofthe demonstration via the digital data acquisition system.
Statistical analysisGraphPad Prism® software version 5.01 (GraphPad Software, San Diego, CA) was used forstatistical analysis. Kolmogorov-Smirnov test was used to assess normality of distribution. Datawas expressed as median (interquartile range). Mann-Whitney U-test was used to compare pre-and post-demonstration score for both categories of questions.
ResultsFifty-seven medical students participated in the study. Marks were awarded for concept-basedand factual questions answered correctly out of 10 and five, respectively.
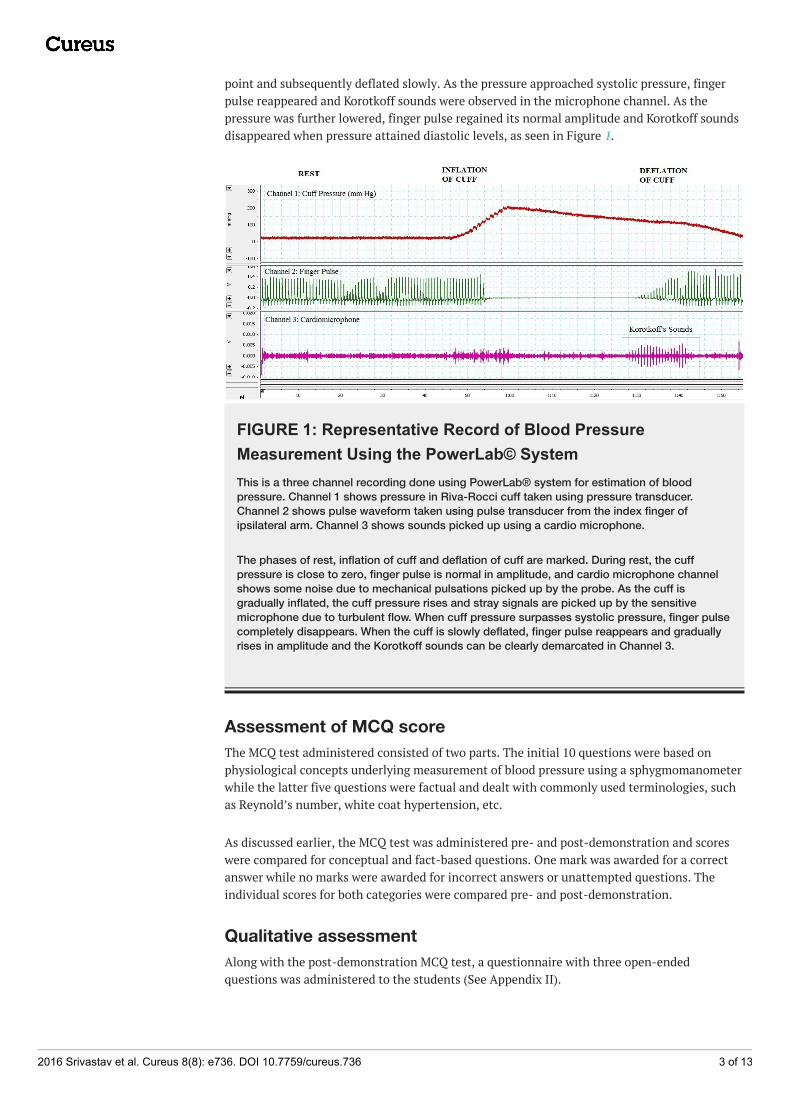
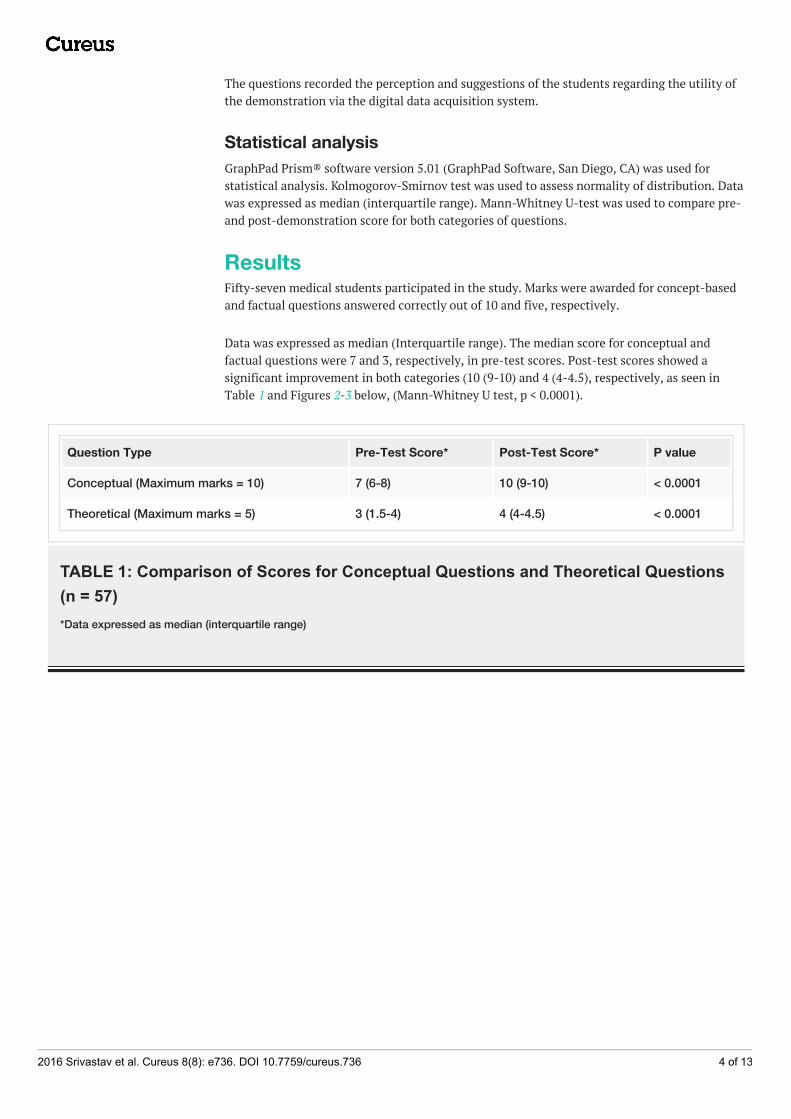
Data was expressed as median (Interquartile range). The median score for conceptual andfactual questions were 7 and 3, respectively, in pre-test scores. Post-test scores showed asignificant improvement in both categories (10 (9-10) and 4 (4-4.5), respectively, as seen inTable 1 and Figures 2-3 below, (Mann-Whitney U test, p < 0.0001).
Question Type Pre-Test Score* Post-Test Score* P value
Conceptual (Maximum marks = 10) 7 (6-8) 10 (9-10) < 0.0001
Theoretical (Maximum marks = 5) 3 (1.5-4) 4 (4-4.5) < 0.0001
TABLE 1: Comparison of Scores for Conceptual Questions and Theoretical Questions(n = 57)*Data expressed as median (interquartile range)
2016 Srivastav et al. Cureus 8(8): e736. DOI 10.7759/cureus.736 4 of 13
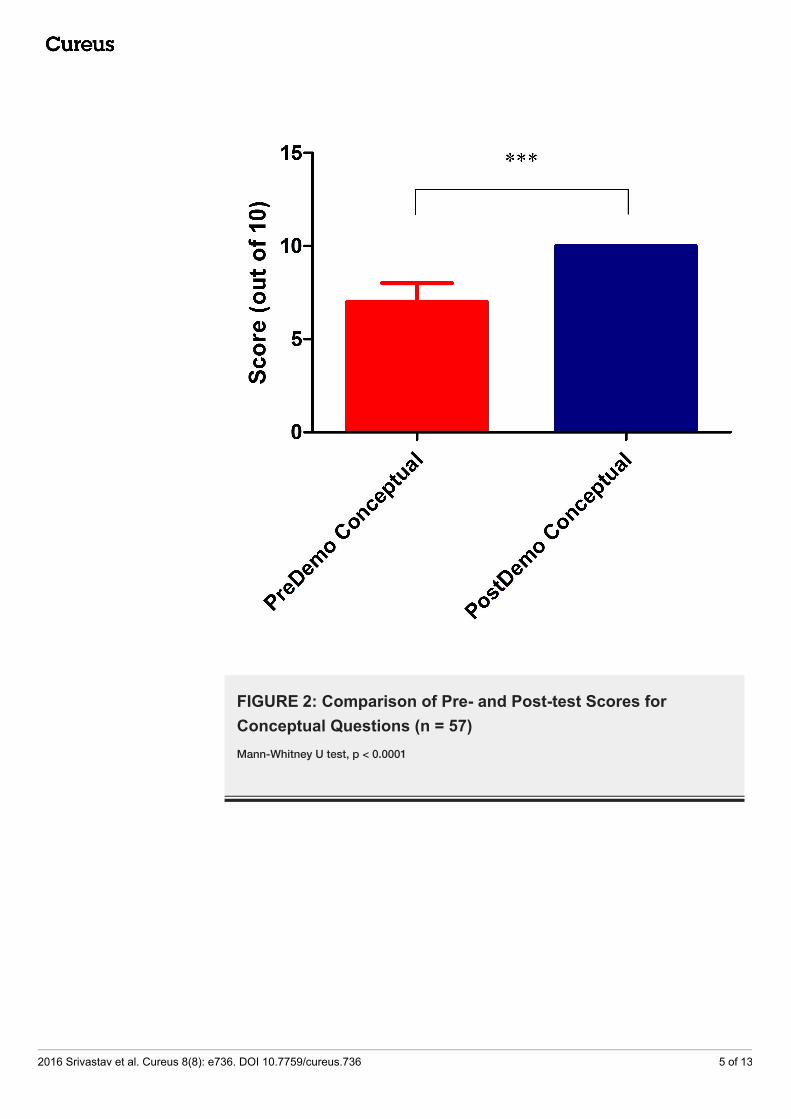
FIGURE 2: Comparison of Pre- and Post-test Scores forConceptual Questions (n = 57)Mann-Whitney U test, p < 0.0001
2016 Srivastav et al. Cureus 8(8): e736. DOI 10.7759/cureus.736 5 of 13
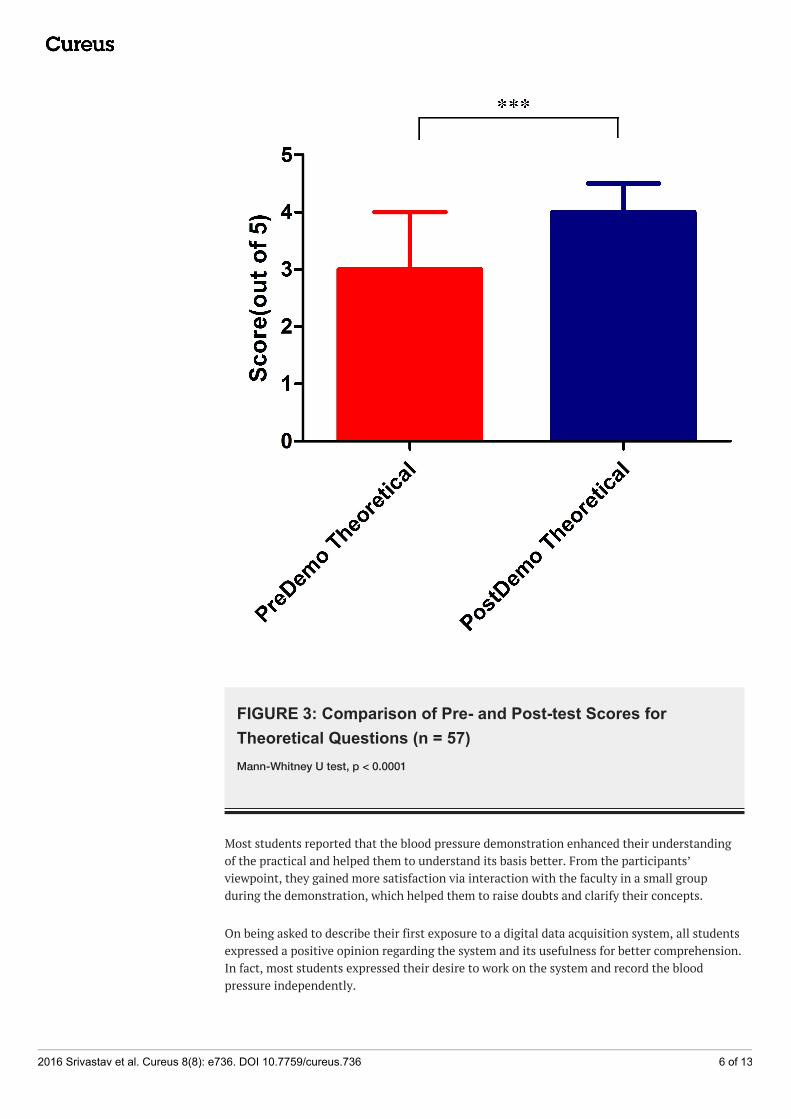
FIGURE 3: Comparison of Pre- and Post-test Scores forTheoretical Questions (n = 57)Mann-Whitney U test, p < 0.0001
Most students reported that the blood pressure demonstration enhanced their understandingof the practical and helped them to understand its basis better. From the participants’viewpoint, they gained more satisfaction via interaction with the faculty in a small groupduring the demonstration, which helped them to raise doubts and clarify their concepts.
On being asked to describe their first exposure to a digital data acquisition system, all studentsexpressed a positive opinion regarding the system and its usefulness for better comprehension.In fact, most students expressed their desire to work on the system and record the bloodpressure independently.
2016 Srivastav et al. Cureus 8(8): e736. DOI 10.7759/cureus.736 6 of 13
One participant said that “The demonstration was interesting and useful and enhanced myunderstanding of the topic” (male first-year student)
Another reported that “I was finally able to understand how Korotkoff sounds are produced andthe phenomenon of an auscultatory gap” (male first-year student).
When asked how the demonstration was different from using the aneroid sphygmomanometer,a majority of participants found it to be visually illustrative and easier to comprehend ascompared to sphygmomanometry.
One participant mentioned that “The demonstration was more descriptive” while anotherstudent wrote that “I could visualise the Korotkoff sounds better using this method” (femalefirst-year student).
Another student found “The experience was very useful and more informative” (male first-yearstudent).
The participants were also asked as to how the demonstration could be improved to make itmore beneficial for understanding. Most students felt that holding the demonstrationsimultaneously with the sphygmomanometry practical would be extremely useful for learningpurposes. Also, all participants strongly appreciated the benefits of small group teaching andfelt it should also be carried out routinely.
One student reported that “Making it a part of the regular practical curriculum anddemonstrating it along with the sphygmomanometer method would be helpful” (female first-year student).
Another student also felt that “Since this demonstration was held in small batches, we couldinteract and clarify our doubts better” (female first-year student).
One student said that “The demonstration would have been better if the students were allowedto take the blood pressure using this method themselves” (male first-year student).
DiscussionCardiovascular physiology practicals are a vital segment of the curriculum and form the basisfor consolidation of theoretical concepts, the development of clinical examination skills, andare crucial in student understanding as they provide opportunities for active learning.However, most students find certain concepts of cardiovascular physiology quite challenging tofathom [7].
The use of a sphygmomanometer for teaching measurement of blood pressure toundergraduates has been in practice since time immemorial. Students are taught to recordblood pressure using both the palpatory method and auscultation of Korotkoff sounds by meansof a stethoscope. The principle behind the generation of these sounds is the turbulence ofblood flowing through a partially occluded area in the artery. The Korotkoff sounds are usedmainly to detect the values of systolic blood pressure and diastolic blood pressure, which isdone by noting the levels at which the Korotkoff sounds initially appear and then disappear,respectively. However, a consistent observation during subsequent practical assessments wasthe difficulty in the perception of sounds and understanding of the concept of turbulent andstreamlined flow faced by many students. An attempt has been made for nursing students toimprove their understanding of blood pressure measurement by using simulators [4]. Also,similar conceptual doubts have been documented in medical students in various facets of
2016 Srivastav et al. Cureus 8(8): e736. DOI 10.7759/cureus.736 7 of 13
cardiovascular physiology. Newer teaching methodologies, like Finapres®, ultrasound, andequivalent electronic circuits, have been used to resolve these doubts [8-12]. These modalitieshave been observed to be more effective aids for student engagement as they enhance theirparticipation level and provide motivation for further learning and comprehension in anenjoyable manner. Hence, we designed this study to assess the efficacy of demonstration on adigital data acquisition system, as an aid to blood pressure measurement by thesphygmomanometric method, for first-year undergraduate students.
The study was conducted after lectures on cardiovascular physiology had been delivered andblood pressure estimation using a sphygmomanometer had been taught in multiple practicalclasses. The students had been given the opportunity of clarification of doubts during thediscussion sessions conducted following the practical. Hence, it was safely assumed that thestudents had reasonable knowledge about the practical, which was reflected in the aboveaverage performance in the pre-test score, as seen in Table 1.
We used PowerLab® digital data acquisition system for demonstration of blood pressurerecording. The demonstration displayed a correlation of pulse amplitude and Korotkoff soundswith changes in cuff pressure and was carried out in small groups of four to five students forbetter visual clarity and understanding. A questionnaire consisting of 15 multiple choicequestions (10 conceptual and five fact-based) was prepared from standard physiology textbooksby senior faculty members with adequate expertise in undergraduate assessment.Questionnaires were administered before and after the demonstration to assess the baselineknowledge and improvement in understanding, respectively. Qualitative assessment was alsorecorded using open-ended questions to record the participants' perception and suggestionsregarding the demonstration.
Analysis of post-test scores revealed a significant improvement in test scores, as seen in Table1. The positive results reflect the value of a demonstration of digital data systems in theimprovement of student understanding. Most participants exhibited average scores in the pre-demo test, which only confirms the well-established adequacy of sphygmomanometry as ateaching tool for undergraduates. However, the improved scores following the demonstrationare an indicator of enhanced comprehension as they were able to visualize the key vascularchanges and clarify their concepts regarding Korotkoff sounds.
The participants’ feedback regarding the demonstration was extremely positive, and theoverwhelming majority of students strongly endorsed the concept of this demonstration to beincluded in the routine curriculum. Most students were vocal about the improvement in theirunderstanding levels and clarity of concepts and also suggested that the demonstration shouldbe held concurrently with the sphygmomanometric method for optimal comprehension.
An additional observation was the preference of most students for small group teaching as itencouraged them to raise queries and seek clarifications in problem areas. Previous studieshave also observed that small group teaching is a more effective tool and promotes betterlearning amongst students [13-16].
Hence, we propose that digital data systems should be increasingly employed, along with thesphygmomanometer, for teaching blood pressure measurement to undergraduates as theyenhance student participation and facilitate learning.
Limitations Our study had a few limitations. Since the participation was purely voluntary, our pre-testscores could have been influenced by sampling bias. Students who were highly motivated and,
2016 Srivastav et al. Cureus 8(8): e736. DOI 10.7759/cureus.736 8 of 13
hence, academically better performers were more likely to participate in the study andconsequently score better. We tried to overcome this bias by making multiple formalannouncements and encouraging all students to participate in the study. We had committed tothe participation of thirty students since this was a pilot project, but eventually fifty-sevenstudents participated in our study. The enthusiastic participation was encouraging andconfirms the interest generated by novel teaching methods in students. Nonetheless, it isnatural that further studies on larger samples, such as entire classes, will firmly help establishthe role of digital data systems for routine undergraduate teaching.
StrengthsTo the best of our knowledge, ours was the first study of its kind that has validated the use ofdigital data acquisition systems for teaching the underlying basis of measurement of bloodpressure to undergraduate students. Significant improvement in post-test scores reaffirmed ourbelief that there are some lacunae in students’ understanding of physiological principlesbehind seemingly simple skills, such as blood pressure estimation. These doubts may beaddressed by means of new teaching methodologies, such as the digital data acquisitionsystems. The qualitative feedback illustrated that small group learning and newermethodologies are likely to enhance student participation and improve learning.
ConclusionsTo conclude, we observed that the introduction of a pilot demonstration practical using thedigital data acquisition system at our institution was potentially beneficial for the first-yearmedical students. As compared to finger plethysmography and ultrasound used in prior studies,the digital data acquisition system is a highly effective and economical teaching aid, whichrequires no specialized training. Numerous earlier studies and our own results demonstratethat practical classes that involve active learning and student-centric approaches cansignificantly enhance student engagement and learning [13-17].
AppendicesAppendix I: Multiple Choice Question Test
1. Above which Reynold’s number, will the blood flow becometurbulent?
1. 5002. 10003. 20004. 3000
2. The sounds heard during estimation of blood pressure using asphygmomanometer are known as?
1. Aminoff’s sounds2. Korotoff’s sounds3. Riva-Rocci sounds4. Hales’ sounds
3. During estimation of blood pressure, the sounds heard areproduced due to?
1. Increased diameter of vessel2. Increased viscosity of blood
2016 Srivastav et al. Cureus 8(8): e736. DOI 10.7759/cureus.736 9 of 13
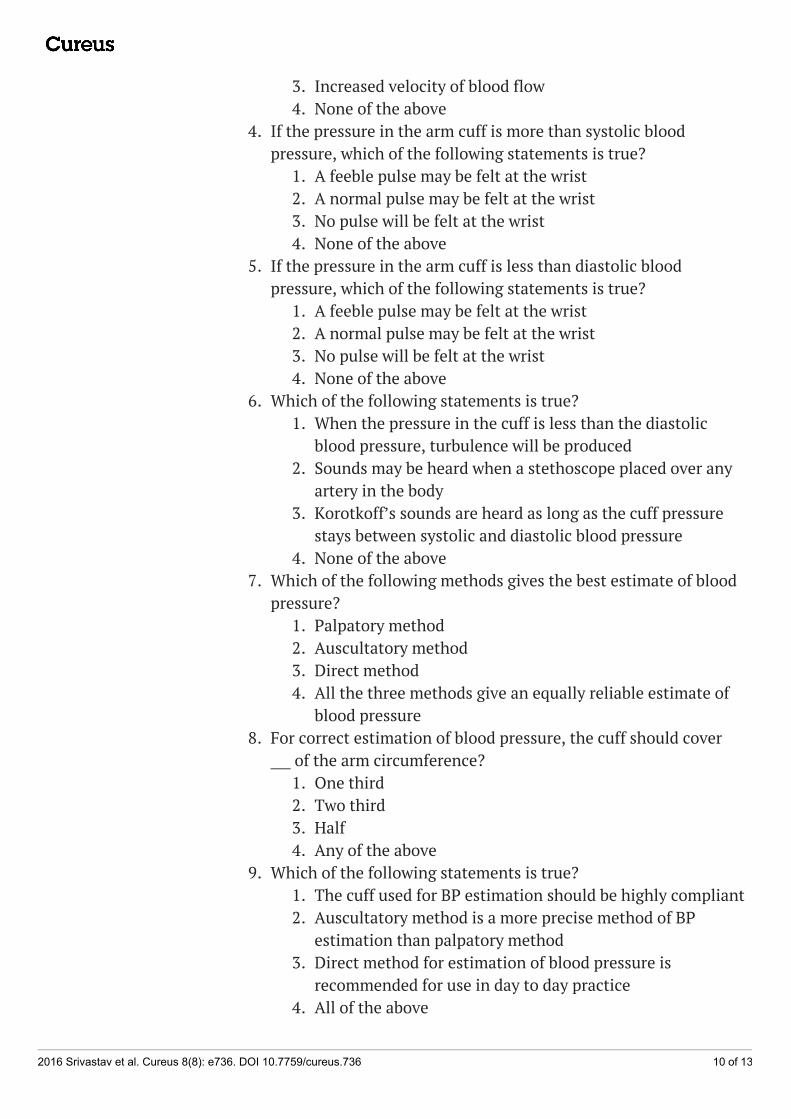
3. Increased velocity of blood flow4. None of the above
4. If the pressure in the arm cuff is more than systolic bloodpressure, which of the following statements is true?
1. A feeble pulse may be felt at the wrist2. A normal pulse may be felt at the wrist3. No pulse will be felt at the wrist4. None of the above
5. If the pressure in the arm cuff is less than diastolic bloodpressure, which of the following statements is true?
1. A feeble pulse may be felt at the wrist2. A normal pulse may be felt at the wrist3. No pulse will be felt at the wrist4. None of the above
6. Which of the following statements is true?1. When the pressure in the cuff is less than the diastolic
blood pressure, turbulence will be produced2. Sounds may be heard when a stethoscope placed over any
artery in the body3. Korotkoff’s sounds are heard as long as the cuff pressure
stays between systolic and diastolic blood pressure4. None of the above
7. Which of the following methods gives the best estimate of bloodpressure?
1. Palpatory method2. Auscultatory method3. Direct method4. All the three methods give an equally reliable estimate of
blood pressure8. For correct estimation of blood pressure, the cuff should cover
___ of the arm circumference?1. One third2. Two third3. Half4. Any of the above
9. Which of the following statements is true?1. The cuff used for BP estimation should be highly compliant2. Auscultatory method is a more precise method of BP
estimation than palpatory method3. Direct method for estimation of blood pressure is
recommended for use in day to day practice4. All of the above
2016 Srivastav et al. Cureus 8(8): e736. DOI 10.7759/cureus.736 10 of 13
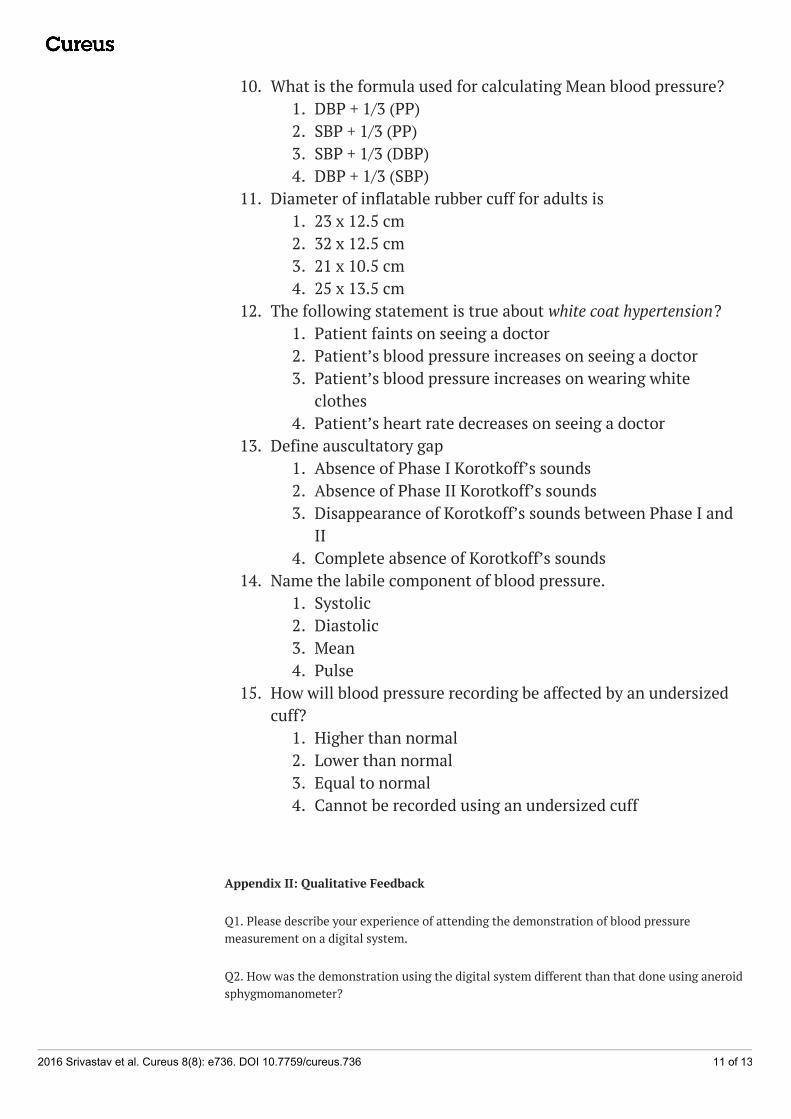
10. What is the formula used for calculating Mean blood pressure?1. DBP + 1/3 (PP)2. SBP + 1/3 (PP)3. SBP + 1/3 (DBP)4. DBP + 1/3 (SBP)
11. Diameter of inflatable rubber cuff for adults is1. 23 x 12.5 cm2. 32 x 12.5 cm3. 21 x 10.5 cm4. 25 x 13.5 cm
12. The following statement is true about white coat hypertension?1. Patient faints on seeing a doctor2. Patient’s blood pressure increases on seeing a doctor3. Patient’s blood pressure increases on wearing white
clothes4. Patient’s heart rate decreases on seeing a doctor
13. Define auscultatory gap1. Absence of Phase I Korotkoff’s sounds2. Absence of Phase II Korotkoff’s sounds3. Disappearance of Korotkoff’s sounds between Phase I and
II4. Complete absence of Korotkoff’s sounds
14. Name the labile component of blood pressure.1. Systolic2. Diastolic3. Mean4. Pulse
15. How will blood pressure recording be affected by an undersizedcuff?
1. Higher than normal2. Lower than normal3. Equal to normal4. Cannot be recorded using an undersized cuff
Appendix II: Qualitative Feedback
Q1. Please describe your experience of attending the demonstration of blood pressuremeasurement on a digital system.
Q2. How was the demonstration using the digital system different than that done using aneroidsphygmomanometer?
2016 Srivastav et al. Cureus 8(8): e736. DOI 10.7759/cureus.736 11 of 13
Q3. How can we improve the demonstration to make it more useful for students?
Additional InformationDisclosuresHuman subjects: Consent was obtained by all participants in this study. Institute EthicsCommittee issued approval IEC/SJH/VMMC/Project/May-2016/584. Animal subjects: Allauthors have confirmed that this study did not involve animal subjects or tissue. Conflicts ofinterest: In compliance with the ICMJE uniform disclosure form, all authors declare thefollowing: Payment/services info: All authors have declared that no financial support wasreceived from any organization for the submitted work. Financial relationships: All authorshave declared that they have no financial relationships at present or within the previous threeyears with any organizations that might have an interest in the submitted work. Otherrelationships: All authors have declared that there are no other relationships or activities thatcould appear to have influenced the submitted work.
AcknowledgementsThe authors would like to thank the first year students of MBBS course of Vardhaman MahavirMedical College and Safdarjung Hospital for participating in the study.
References1. Podoll A, Grenier M, Croix B, Feig DI: Inaccuracy in pediatric outpatient blood pressure
measurement. Pediatrics. 2007, 119:e538-43. 10.1542/peds.2006-16862. Pickering TG, Hall JE, Appel LJ, Falkner BE, Graves J, Hill MN, Jones DW, Kurtz T, Sheps SG,
Roccella EJ: Recommendations for blood pressure measurement in humans and experimentalanimals: part 1: blood pressure measurement in humans: a statement for professionals fromthe Subcommittee of Professional and Public Education of the American Heart AssociationCouncil on High Blood Pressure Research. Circulation. 2005, 111:697-716.10.1161/01.CIR.0000154900.76284.F6
3. Gazibara T, Rancic B, Maric G, Radovanovic S, Kisic-Tepavcevic D, Pekmezovic T: Medicalstudents, do you know how to measure blood pressure correctly?. Blood Press Monit. 2015,20:27-31. 10.1097/MBP.0000000000000085
4. Eghbalibabadi M, Ashouri E: Comparison of the effects of two teaching methods on thenursing students’ performance in measurement of blood pressure. Iran J Nurs Midwifery Res.2014, 19:381-84.
5. Brokalaki H, Matziou V, Gymnopoulou E, Galanis P, Brokalaki E, Theodossiades G:Modification of nursing students' performance in blood pressure measurement: aneducational retraining programme. Int Nurs Rev. 2008, 55:187-91. 10.1111/j.1466-7657.2007.00621.x
6. Komine H, Sugawara J, Hayashi K, Yoshizawa M, Yokoi T: Regular endurance exercise inyoung men increases arterial baroreflex sensitivity through neural alteration of baroreflex arc.J Appl Physiol (1985). 2009, 106:1499-505. 10.1152/japplphysiol.91447.2008
7. Michael JA, Wenderoth MP, Modell HI, Cliff W, Horwitz B, McHale P, Richardson D,Silverthorn D, Williams S, Whitescarver S: Undergraduates' understanding of cardiovascularphenomena. Adv Physiol Educ. 2002, 26:72-84. 10.1152/advan.00002.2002
8. Hodgson Y, Choate J: Continuous and noninvasive recording of cardiovascular parameterswith the Finapres finger cuff enhances undergraduate student understanding of physiology.Adv Physiol Educ. 2012, 36:20-26. 10.1152/advan.00097.2011
9. Bell FE 3rd, Wilson LB, Hoppmann RA: Using ultrasound to teach medical students cardiacphysiology. Adv Physiol Educ. 2015, 39:392-96. 10.1152/advan.00123.2015
10. Hammoudi N, Arangalage D, Boubrit L, Renaud MC, Isnard R, Collet JP, Cohen A, Duguet A:Ultrasound-based teaching of cardiac anatomy and physiology to undergraduate medicalstudents. Arch Cardiovasc Dis. 2013, 106:487-91. 10.1016/j.acvd.2013.06.002
11. Ribaric S, Kordas M: Teaching cardiovascular physiology with equivalent electronic circuits in
2016 Srivastav et al. Cureus 8(8): e736. DOI 10.7759/cureus.736 12 of 13
a practically oriented teaching module. Adv Physiol Educ. 2011, 35:149-60.10.1152/advan.00072.2010
12. Paganini M, Rubini A: Ultrasound-based lectures on cardiovascular physiology and reflexesfor medical students. Adv Physiol Educ. 2016, 40:243-47.
13. Saleh AM, Shabila NP, Dabbagh AA, Al-Tawil NG, Al-Hadithi T: A qualitative assessment offaculty perspectives of small group teaching experience in Iraq. BMC Med Educ. 2015, 15:19.10.1186/s12909-015-0304-7
14. Biswas SS, Jain V, Agrawal V, Bindra M: Small group learning: effect on item analysis andaccuracy of self-assessment of medical students. Educ Health (Abingdon). 2015, 28:16-21.10.4103/1357-6283.161836
15. Edmunds S, Brown G: Effective small group learning: AMEE Guide No. 48 . Med Teach. 2010,32:715-26. 10.3109/0142159X.2010.505454
16. Parmelee D: Effective small group learning: Guide supplement 48.1--viewpoint . Med Teach.2011, 33:1031-33. 10.3109/0142159X.2011.596591
17. Michael J: Where's the evidence that active learning works? . Adv Physiol Educ. 2006, 30:159-67. 10.1152/advan.00053.2006
2016 Srivastav et al. Cureus 8(8): e736. DOI 10.7759/cureus.736 13 of 13