Embed Size (px)
Citation preview
Supporting Information for
Sub-5 nm SnO2 Chemically Coupled Hollow Carbon Spheres for Efficient Electrocatalytic CO2 Reduction
Yiliguma,a Zhijie Wang,a Chao Yang,a Anxiang Guan,a Longmei Shang,a Abdullah M. Al-Enizi,b
Lijuan Zhang,a Gengfeng Zheng*a
aLaboratory of Advanced Materials, Department of Chemistry and Shanghai Key Laboratory of
Molecular Catalysis and Innovative Materials, Fudan University, Shanghai 200438, China
bDepartment of Chemistry, College of Science, King Saud University, Riyadh 11451, Saudi
Arabia
* Corresponding author E-mail: [email protected]
Electronic Supplementary Material (ESI) for Journal of Materials Chemistry A.This journal is © The Royal Society of Chemistry 2018
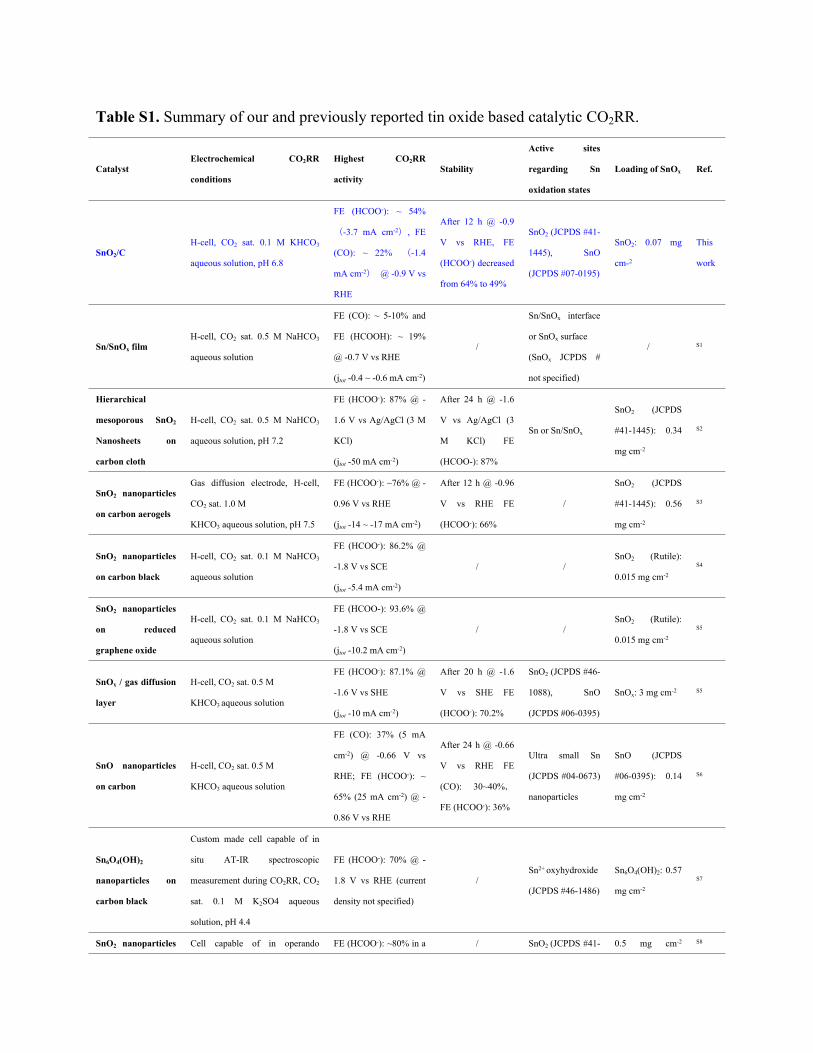
Table S1. Summary of our and previously reported tin oxide based catalytic CO2RR.
CatalystElectrochemical CO2RR
conditions
Highest CO2RR
activityStability
Active sites
regarding Sn
oxidation states
Loading of SnOx Ref.
SnO2/CH-cell, CO2 sat. 0.1 M KHCO3
aqueous solution, pH 6.8
FE (HCOO-): ~ 54%
(-3.7 mA cm-2), FE
(CO): ~ 22% (-1.4
mA cm-2) @ -0.9 V vs
RHE
After 12 h @ -0.9
V vs RHE, FE
(HCOO-) decreased
from 64% to 49%
SnO2 (JCPDS #41-
1445), SnO
(JCPDS #07-0195)
SnO2: 0.07 mg
cm-2
This
work
Sn/SnOx filmH-cell, CO2 sat. 0.5 M NaHCO3
aqueous solution
FE (CO): ~ 5-10% and
FE (HCOOH): ~ 19%
@ -0.7 V vs RHE
(jtot -0.4 ~ -0.6 mA cm-2)
/
Sn/SnOx interface
or SnOx surface
(SnOx JCPDS #
not specified)
/ S1
Hierarchical
mesoporous SnO2
Nanosheets on
carbon cloth
H-cell, CO2 sat. 0.5 M NaHCO3
aqueous solution, pH 7.2
FE (HCOO-): 87% @ -
1.6 V vs Ag/AgCl (3 M
KCl)
(jtot -50 mA cm-2)
After 24 h @ -1.6
V vs Ag/AgCl (3
M KCl) FE
(HCOO-): 87%
Sn or Sn/SnOx
SnO2 (JCPDS
#41-1445): 0.34
mg cm-2
S2
SnO2 nanoparticles
on carbon aerogels
Gas diffusion electrode, H-cell,
CO2 sat. 1.0 M
KHCO3 aqueous solution, pH 7.5
FE (HCOO-): ~76% @ -
0.96 V vs RHE
(jtot -14 ~ -17 mA cm-2)
After 12 h @ -0.96
V vs RHE FE
(HCOO-): 66%
/
SnO2 (JCPDS
#41-1445): 0.56
mg cm-2
S3
SnO2 nanoparticles
on carbon black
H-cell, CO2 sat. 0.1 M NaHCO3
aqueous solution
FE (HCOO-): 86.2% @
-1.8 V vs SCE
(jtot -5.4 mA cm-2)
/ /SnO2 (Rutile):
0.015 mg cm-2
S4
SnO2 nanoparticles
on reduced
graphene oxide
H-cell, CO2 sat. 0.1 M NaHCO3
aqueous solution
FE (HCOO-): 93.6% @
-1.8 V vs SCE
(jtot -10.2 mA cm-2)
/ /SnO2 (Rutile):
0.015 mg cm-2
S5
SnOx / gas diffusion
layer
H-cell, CO2 sat. 0.5 M
KHCO3 aqueous solution
FE (HCOO-): 87.1% @
-1.6 V vs SHE
(jtot -10 mA cm-2)
After 20 h @ -1.6
V vs SHE FE
(HCOO-): 70.2%
SnO2 (JCPDS #46-
1088), SnO
(JCPDS #06-0395)
SnOx: 3 mg cm-2 S5
SnO nanoparticles
on carbon
H-cell, CO2 sat. 0.5 M
KHCO3 aqueous solution
FE (CO): 37% (5 mA
cm-2) @ -0.66 V vs
RHE; FE (HCOO-): ~
65% (25 mA cm-2) @ -
0.86 V vs RHE
After 24 h @ -0.66
V vs RHE FE
(CO): 30~40%,
FE (HCOO-): 36%
Ultra small Sn
(JCPDS #04-0673)
nanoparticles
SnO (JCPDS
#06-0395): 0.14
mg cm-2
S6
Sn6O4(OH)2
nanoparticles on
carbon black
Custom made cell capable of in
situ AT-IR spectroscopic
measurement during CO2RR, CO2
sat. 0.1 M K2SO4 aqueous
solution, pH 4.4
FE (HCOO-): 70% @ -
1.8 V vs RHE (current
density not specified)
/Sn2+ oxyhydroxide
(JCPDS #46-1486)
Sn6O4(OH)2: 0.57
mg cm-2
S7
SnO2 nanoparticles Cell capable of in operando FE (HCOO-): ~80% in a / SnO2 (JCPDS #41- 0.5 mg cm-2 S8
on reduced
graphene oxide
Raman spectroscopic study during
CO2RR, CO2 dissolved 0.5 M
NaOH, pH 9.7
potential range around
from -0.9 to -1.2 V vs
Ag/AgCl (3 M KCl)
(jtot -4.7 mA cm-2 @ -1.5
V vs Ag/AgCl)
1445) (including
reduced graphene
oxide)
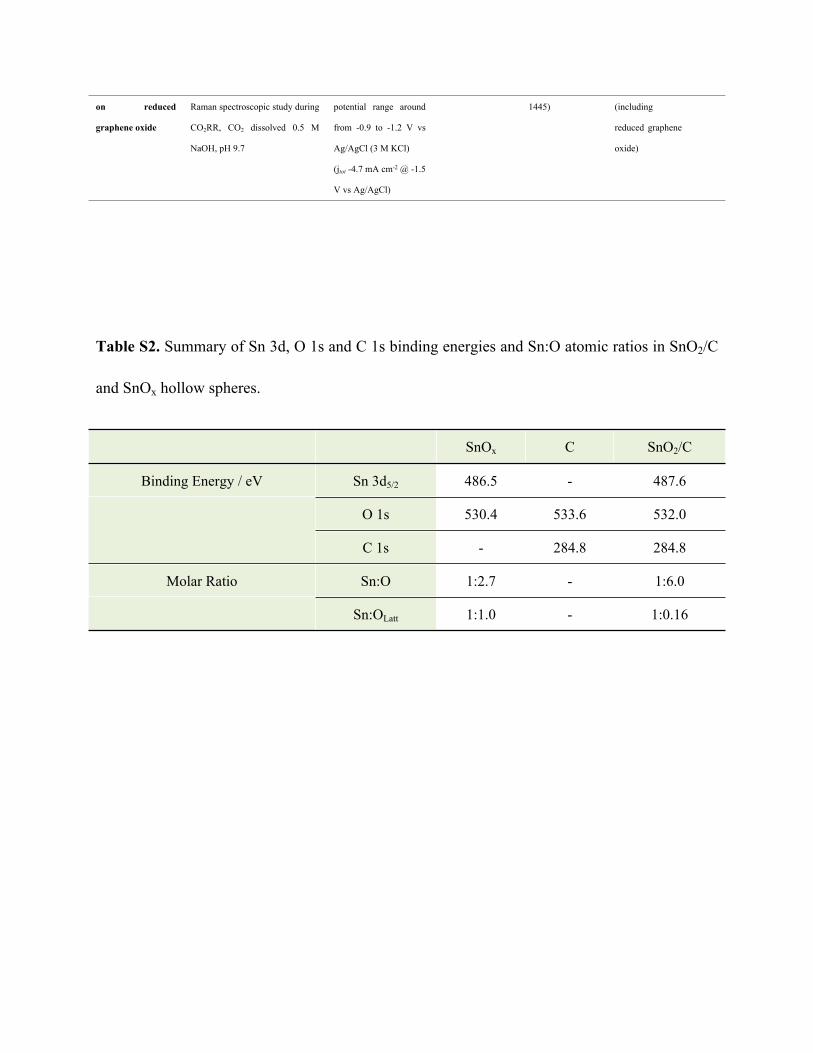
Table S2. Summary of Sn 3d, O 1s and C 1s binding energies and Sn:O atomic ratios in SnO2/C
and SnOx hollow spheres.
SnOx C SnO2/C
Sn 3d5/2 486.5 - 487.6
O 1s 530.4 533.6 532.0
Binding Energy / eV
C 1s - 284.8 284.8
Sn:O 1:2.7 - 1:6.0Molar Ratio
Sn:OLatt 1:1.0 - 1:0.16
Methods
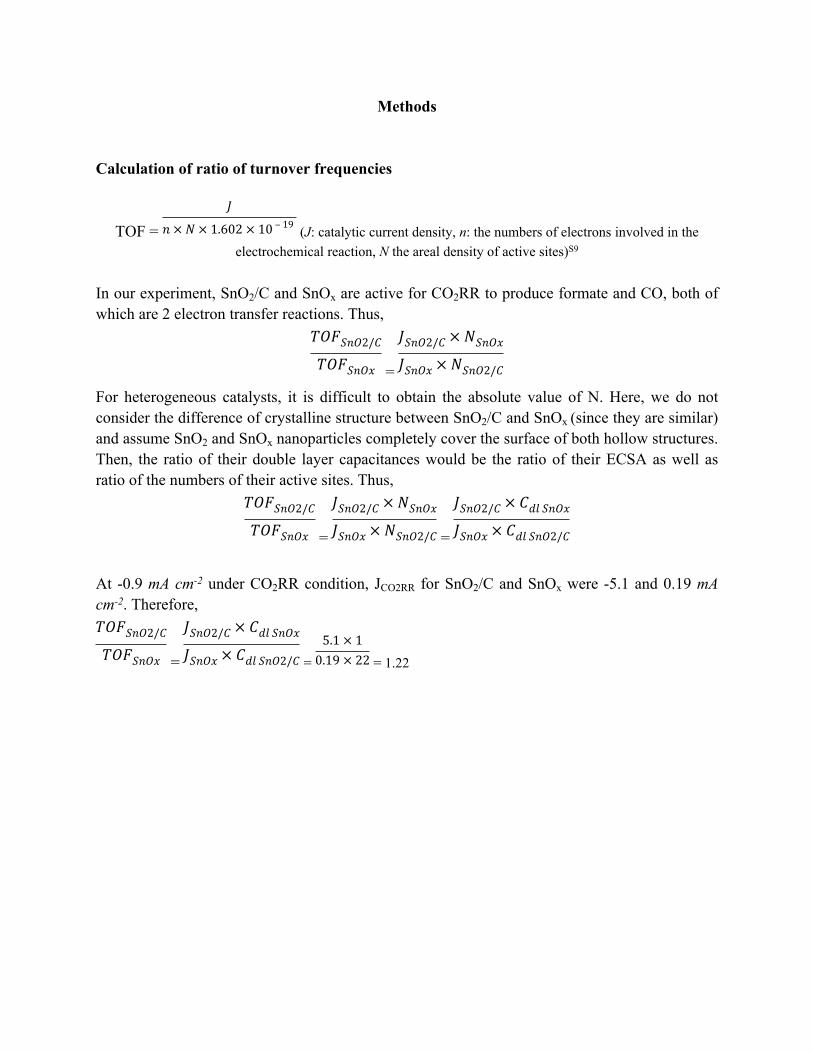
Calculation of ratio of turnover frequencies
TOF = (J: catalytic current density, n: the numbers of electrons involved in the
𝐽
𝑛 × 𝑁 × 1.602 × 10 ‒ 19
electrochemical reaction, N the areal density of active sites)S9
In our experiment, SnO2/C and SnOx are active for CO2RR to produce formate and CO, both of which are 2 electron transfer reactions. Thus,
=
𝑇𝑂𝐹𝑆𝑛𝑂2/𝐶
𝑇𝑂𝐹𝑆𝑛𝑂𝑥
𝐽𝑆𝑛𝑂2/𝐶 × 𝑁𝑆𝑛𝑂𝑥
𝐽𝑆𝑛𝑂𝑥 × 𝑁𝑆𝑛𝑂2/𝐶
For heterogeneous catalysts, it is difficult to obtain the absolute value of N. Here, we do not consider the difference of crystalline structure between SnO2/C and SnOx (since they are similar) and assume SnO2 and SnOx nanoparticles completely cover the surface of both hollow structures. Then, the ratio of their double layer capacitances would be the ratio of their ECSA as well as ratio of the numbers of their active sites. Thus,
= =
𝑇𝑂𝐹𝑆𝑛𝑂2/𝐶
𝑇𝑂𝐹𝑆𝑛𝑂𝑥
𝐽𝑆𝑛𝑂2/𝐶 × 𝑁𝑆𝑛𝑂𝑥
𝐽𝑆𝑛𝑂𝑥 × 𝑁𝑆𝑛𝑂2/𝐶
𝐽𝑆𝑛𝑂2/𝐶 × 𝐶𝑑𝑙 𝑆𝑛𝑂𝑥
𝐽𝑆𝑛𝑂𝑥 × 𝐶𝑑𝑙 𝑆𝑛𝑂2/𝐶
At -0.9 mA cm-2 under CO2RR condition, JCO2RR for SnO2/C and SnOx were -5.1 and 0.19 mA cm-2. Therefore,
= = = 1.22
𝑇𝑂𝐹𝑆𝑛𝑂2/𝐶
𝑇𝑂𝐹𝑆𝑛𝑂𝑥
𝐽𝑆𝑛𝑂2/𝐶 × 𝐶𝑑𝑙 𝑆𝑛𝑂𝑥
𝐽𝑆𝑛𝑂𝑥 × 𝐶𝑑𝑙 𝑆𝑛𝑂2/𝐶
5.1 × 10.19 × 22
Supplementary Figures
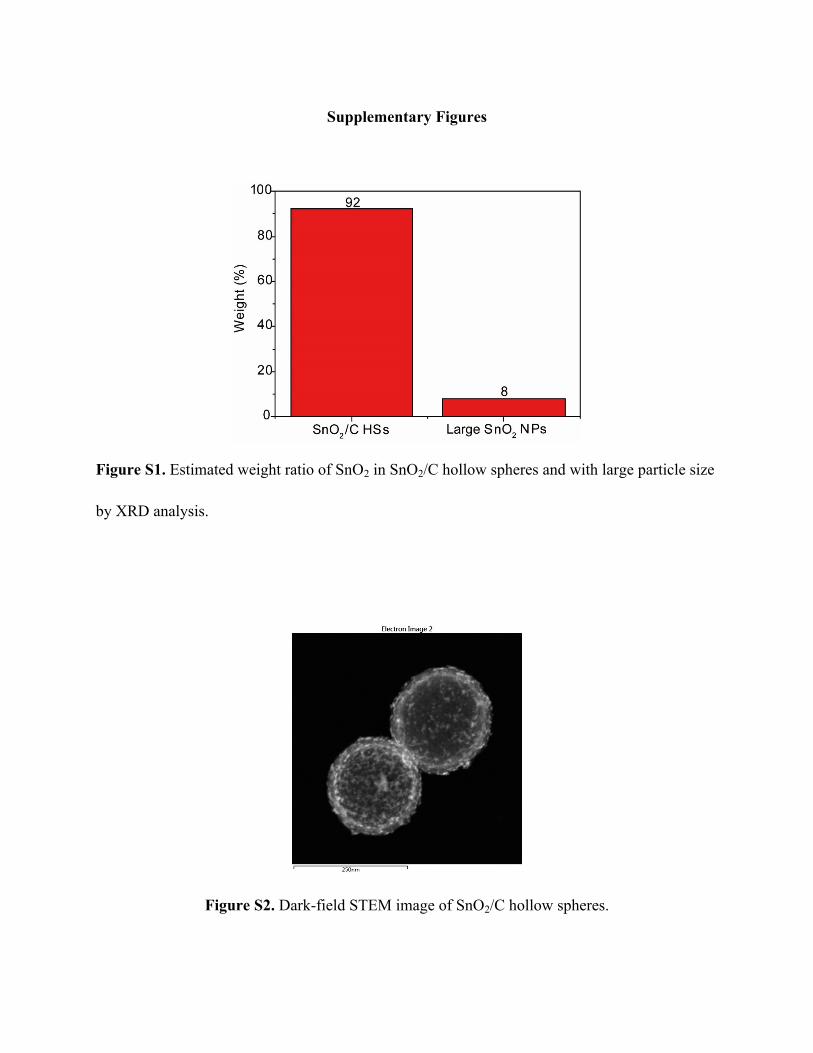
Figure S1. Estimated weight ratio of SnO2 in SnO2/C hollow spheres and with large particle size
by XRD analysis.
Figure S2. Dark-field STEM image of SnO2/C hollow spheres.
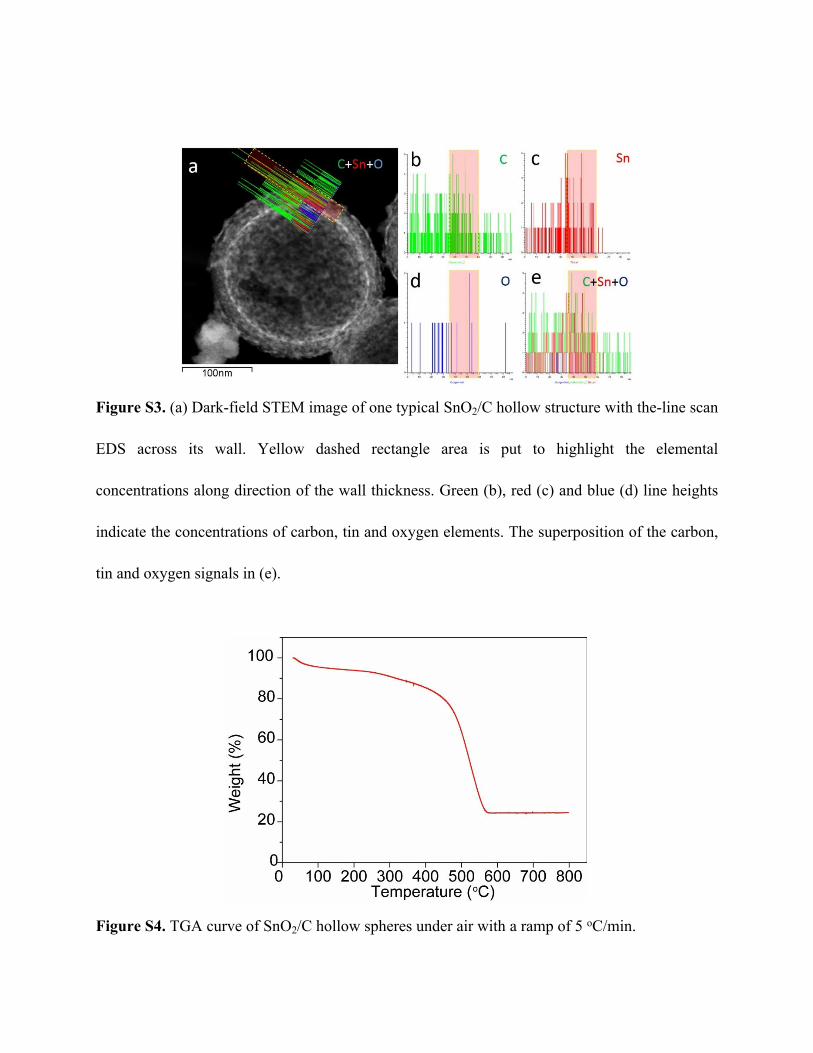
Figure S3. (a) Dark-field STEM image of one typical SnO2/C hollow structure with the-line scan
EDS across its wall. Yellow dashed rectangle area is put to highlight the elemental
concentrations along direction of the wall thickness. Green (b), red (c) and blue (d) line heights
indicate the concentrations of carbon, tin and oxygen elements. The superposition of the carbon,
tin and oxygen signals in (e).
Figure S4. TGA curve of SnO2/C hollow spheres under air with a ramp of 5 oC/min.
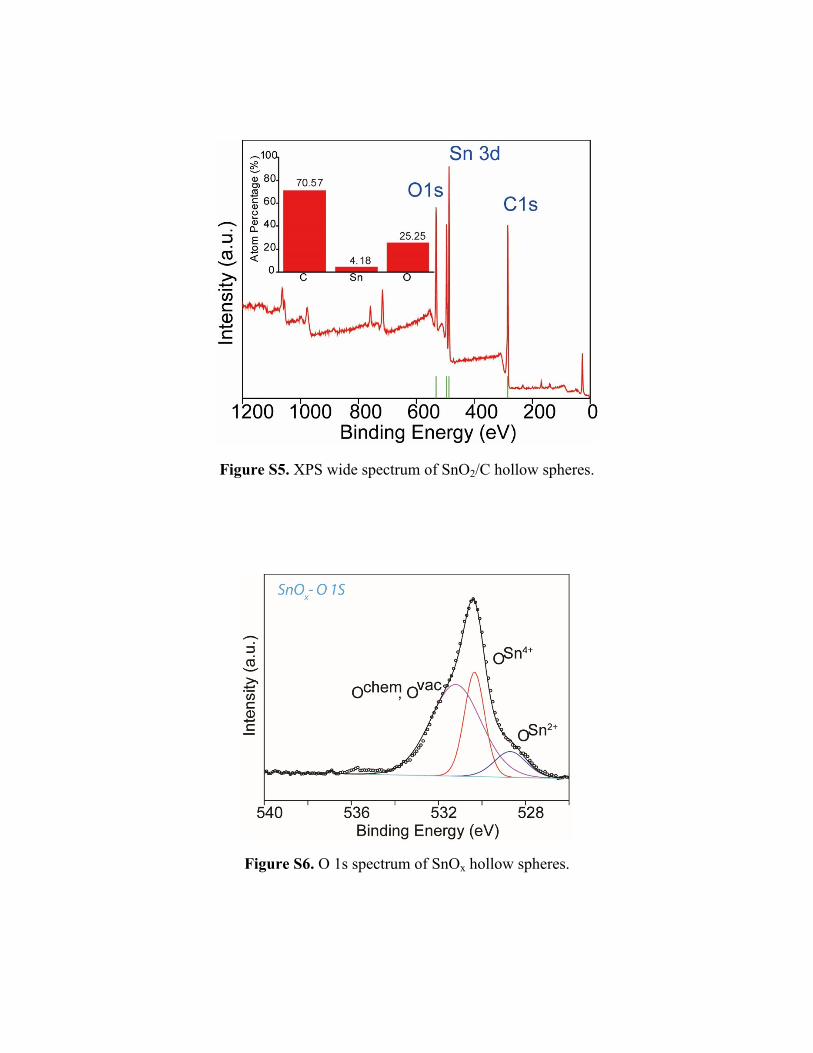
Figure S5. XPS wide spectrum of SnO2/C hollow spheres.
Figure S6. O 1s spectrum of SnOx hollow spheres.
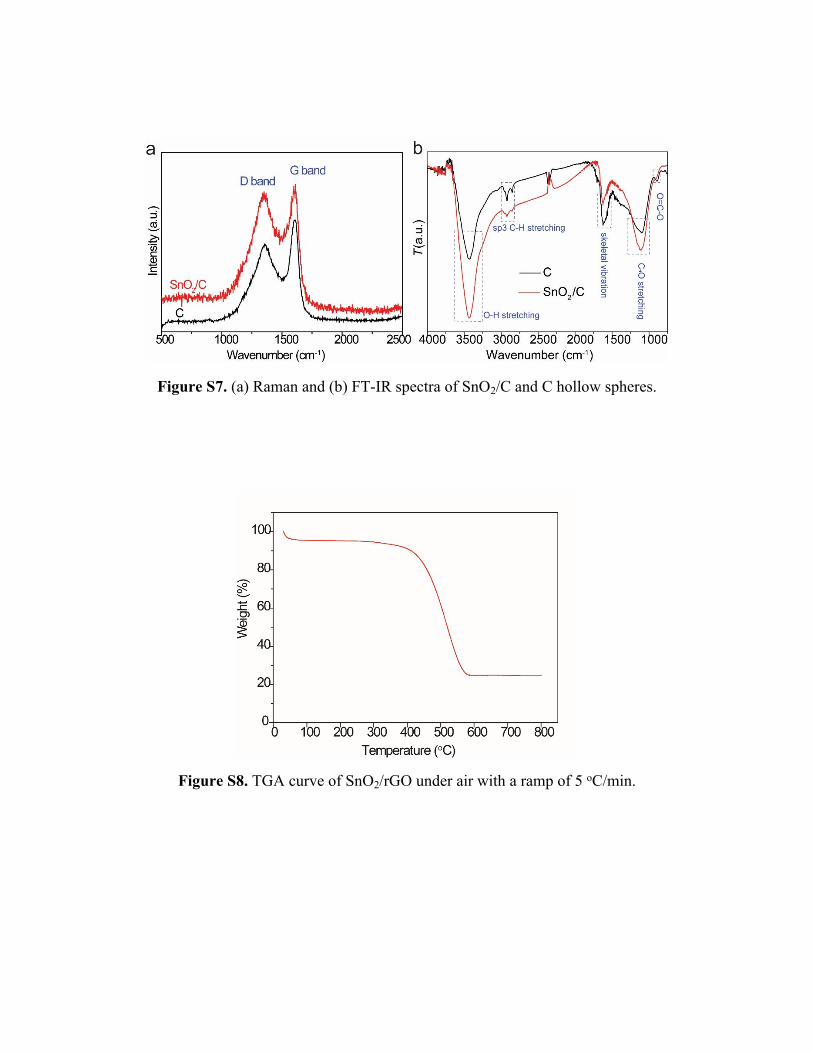
Figure S7. (a) Raman and (b) FT-IR spectra of SnO2/C and C hollow spheres.
Figure S8. TGA curve of SnO2/rGO under air with a ramp of 5 oC/min.
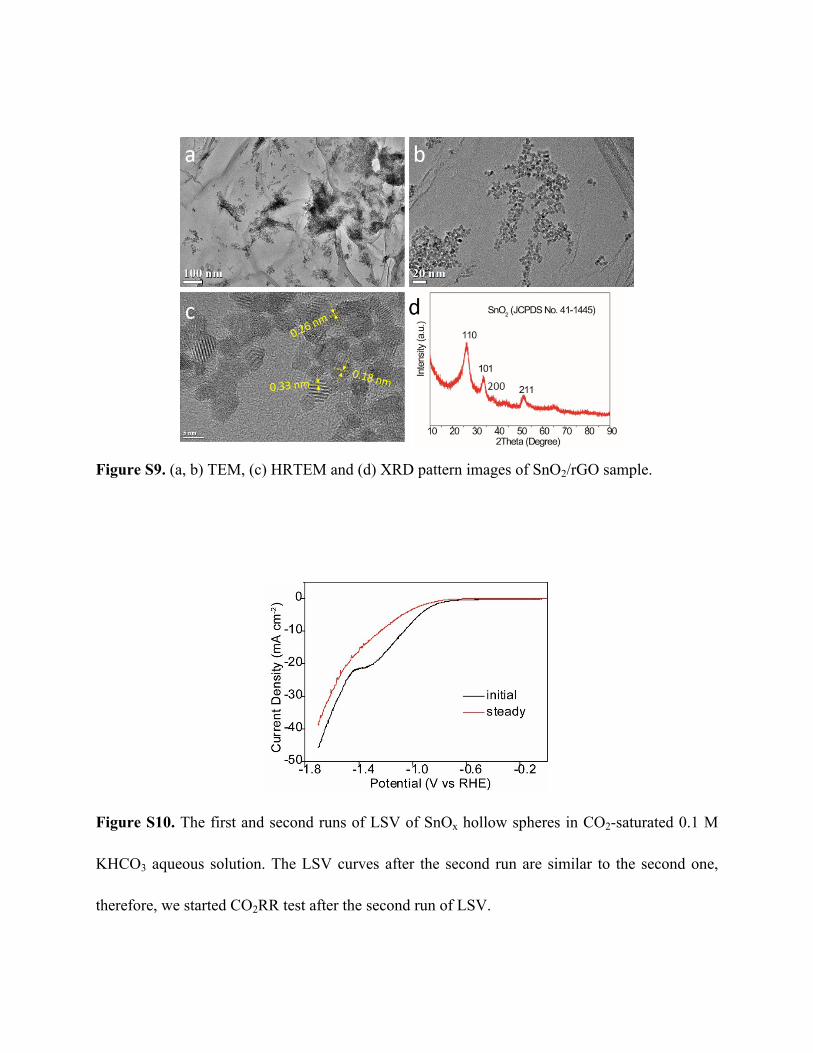
Figure S9. (a, b) TEM, (c) HRTEM and (d) XRD pattern images of SnO2/rGO sample.
Figure S10. The first and second runs of LSV of SnOx hollow spheres in CO2-saturated 0.1 M
KHCO3 aqueous solution. The LSV curves after the second run are similar to the second one,
therefore, we started CO2RR test after the second run of LSV.
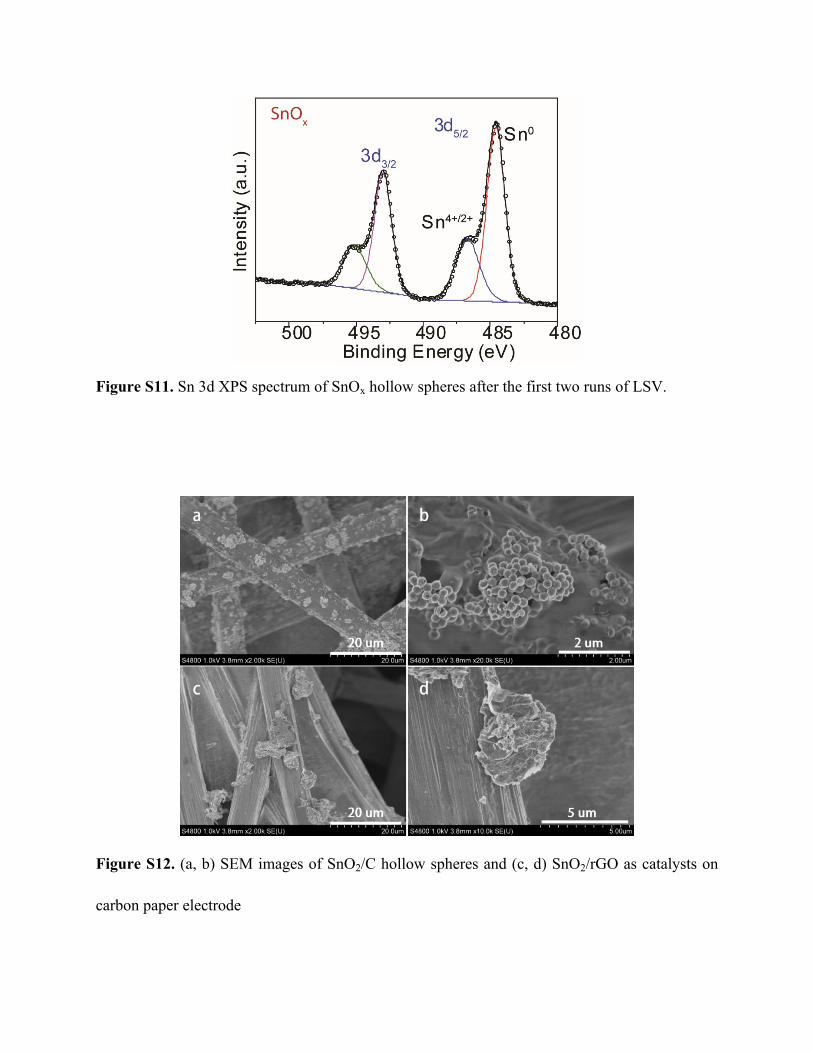
Figure S11. Sn 3d XPS spectrum of SnOx hollow spheres after the first two runs of LSV.
Figure S12. (a, b) SEM images of SnO2/C hollow spheres and (c, d) SnO2/rGO as catalysts on
carbon paper electrode
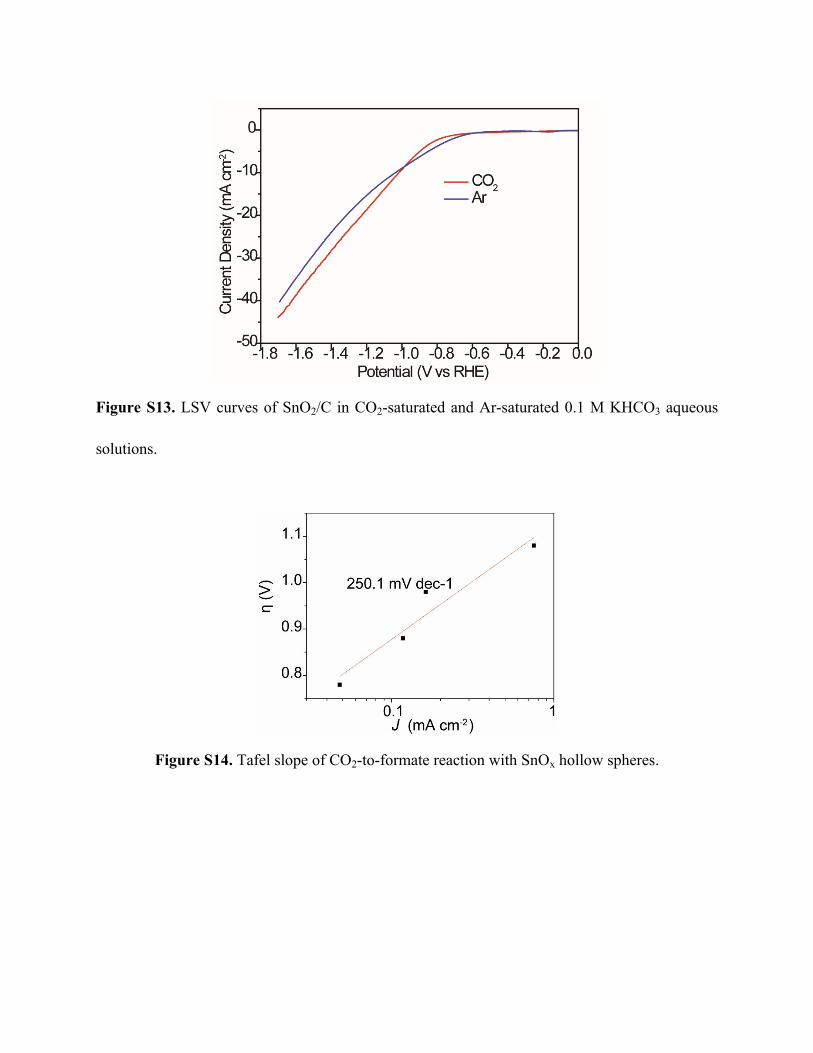
Figure S13. LSV curves of SnO2/C in CO2-saturated and Ar-saturated 0.1 M KHCO3 aqueous
solutions.
Figure S14. Tafel slope of CO2-to-formate reaction with SnOx hollow spheres.
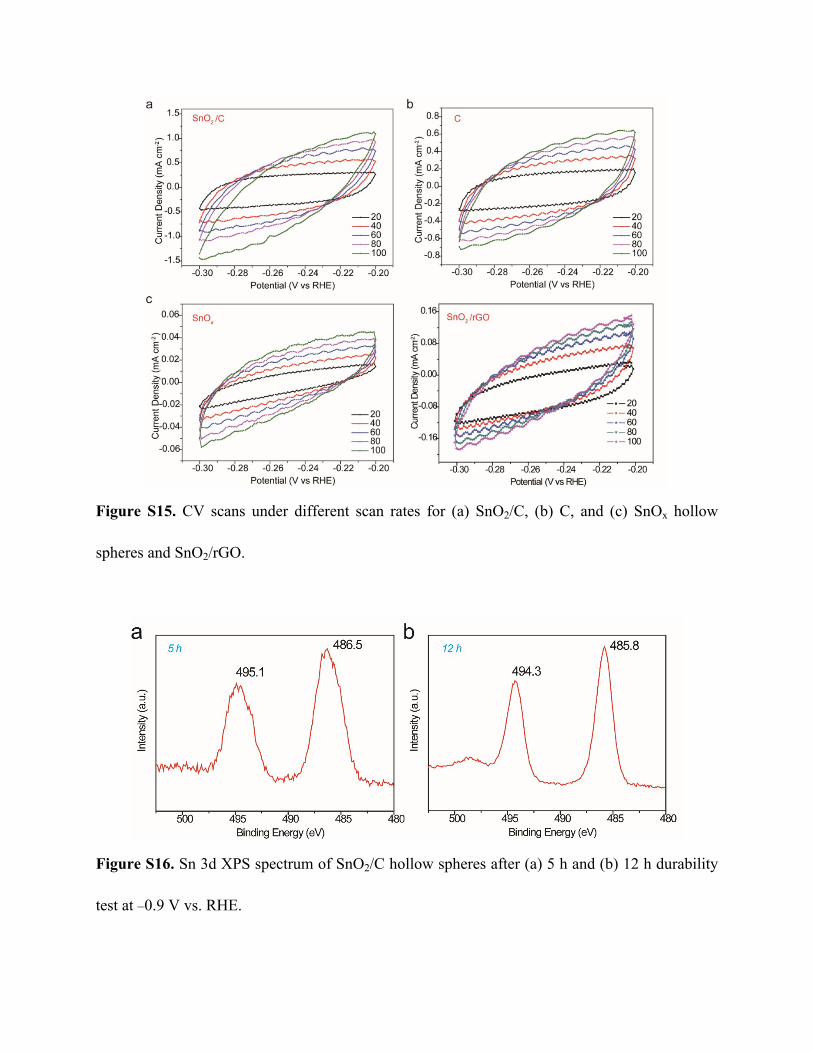
Figure S15. CV scans under different scan rates for (a) SnO2/C, (b) C, and (c) SnOx hollow
spheres and SnO2/rGO.
Figure S16. Sn 3d XPS spectrum of SnO2/C hollow spheres after (a) 5 h and (b) 12 h durability
test at –0.9 V vs. RHE.
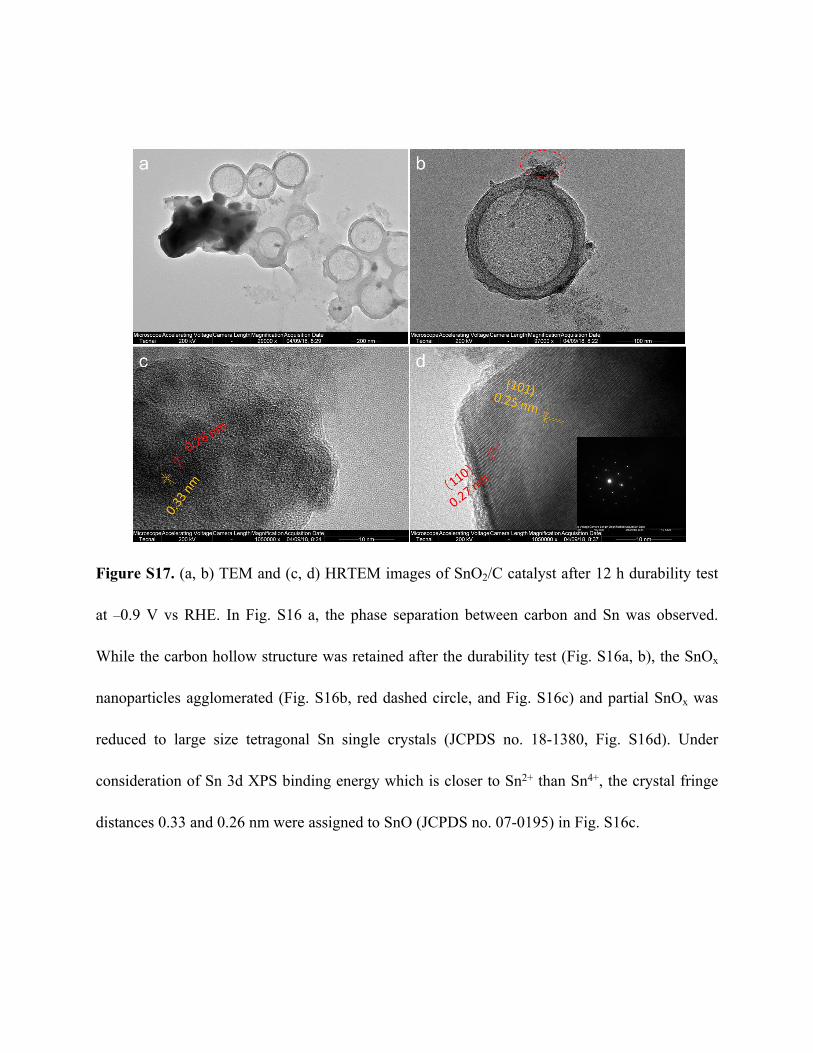
Figure S17. (a, b) TEM and (c, d) HRTEM images of SnO2/C catalyst after 12 h durability test
at –0.9 V vs RHE. In Fig. S16 a, the phase separation between carbon and Sn was observed.
While the carbon hollow structure was retained after the durability test (Fig. S16a, b), the SnOx
nanoparticles agglomerated (Fig. S16b, red dashed circle, and Fig. S16c) and partial SnOx was
reduced to large size tetragonal Sn single crystals (JCPDS no. 18-1380, Fig. S16d). Under
consideration of Sn 3d XPS binding energy which is closer to Sn2+ than Sn4+, the crystal fringe
distances 0.33 and 0.26 nm were assigned to SnO (JCPDS no. 07-0195) in Fig. S16c.
Reference
S1. Chen, Y.; Kanan, M. W. Tin Oxide Dependence of the CO2 Reduction Efficiency on Tin
Electrodes and Enhanced Activity for Tin/Tin Oxide Thin-Film Catalysts. J. Am. Chem. Soc.
2012, 134 (4), 1986-1989.
S2. Li, F.; Chen, L.; Knowles, G. P.; MacFarlane, D. R.; Zhang, J. Hierarchical Mesoporous
SnO2 Nanosheets on Carbon Cloth: A Robust and Flexible Electrocatalyst for CO2
Reduction with High Efficiency and Selectivity. Angew. Chem. Int. Ed. 2017, 56 (2), 505-
509.
S3. Yu, J.; Liu, H.; Song, S.; Wang, Y.; Tsiakaras, P. Electrochemical Reduction of Carbon
Dioxide at Nanostructured SnO2/Carbon Aerogels: The Effect of Tin Oxide Content on the
Catalytic Activity and Formate Selectivity. Appl. Catal. A: Gen. 2017, 545, 159-166.
S4. Zhang, S.; Kang, P.; Meyer, T. J. Nanostructured Tin Catalysts for Selective
Electrochemical Reduction of Carbon Dioxide to Formate. J. Am. Chem. Soc. 2014, 136 (5),
1734-1737.
S5. Li, Y.; Qiao, J.; Zhang, X.; Lei, T.; Girma, A.; Liu, Y.; Zhang, J. Rational Design and
Synthesis of SnOx Electrocatalysts with Coralline Structure for Highly Improved Aqueous
CO2 Reduction to Formate. ChemElectroChem 2016, 3 (10), 1618-1628.
S6. Gu, J.; Héroguel, F.; Luterbacher, J.; Hu, X. Densely Packed, Ultra Small SnO
Nanoparticles for Enhanced Activity and Selectivity in Electrochemical CO2 Reduction.
Angew. Chem. Int. Ed. 2018, 57 (11), 2943-2947.
S7. Baruch, M. F.; Pander, J. E.; White, J. L.; Bocarsly, A. B., Mechanistic Insights into the
Reduction of CO2 on Tin Electrodes using in Situ ATR-IR Spectroscopy. ACS Catal. 2015,
5 (5), 3148-3156.
S8. Dutta, A.; Kuzume, A.; Rahaman, M.; Vesztergom, S.; Broekmann, P., Monitoring the
Chemical State of Catalysts for CO2 Electroreduction: An In Operando Study. ACS Catal.
2015, 5 (12), 7498-7502.
S9. Voiry, D.; Fullon, R.; Yang, J.; Silva, C. C. C.; Kappera, R.; Bozkurt, I.; Kaplan, D.; Lagos,
M. J.; Batson, P. E.; Gupta, G.; Mohite, A. D.; Dong, L.; Er, D.; Shenoy, V.; Asefa, T.;
Chhowalla, M., The Role of Electronic Coupling Between Substrate and 2D MoS2
Nanosheets in Electrocatalytic Production of Hydrogen. Nature Mater. 2016, 15, 1003-1010.