Embed Size (px)
Citation preview
THE SPGM-SYSTEM October 10, 2009
F o l l o w t h e r u l e s a n d b e s u c c e s s f u l
Page 1
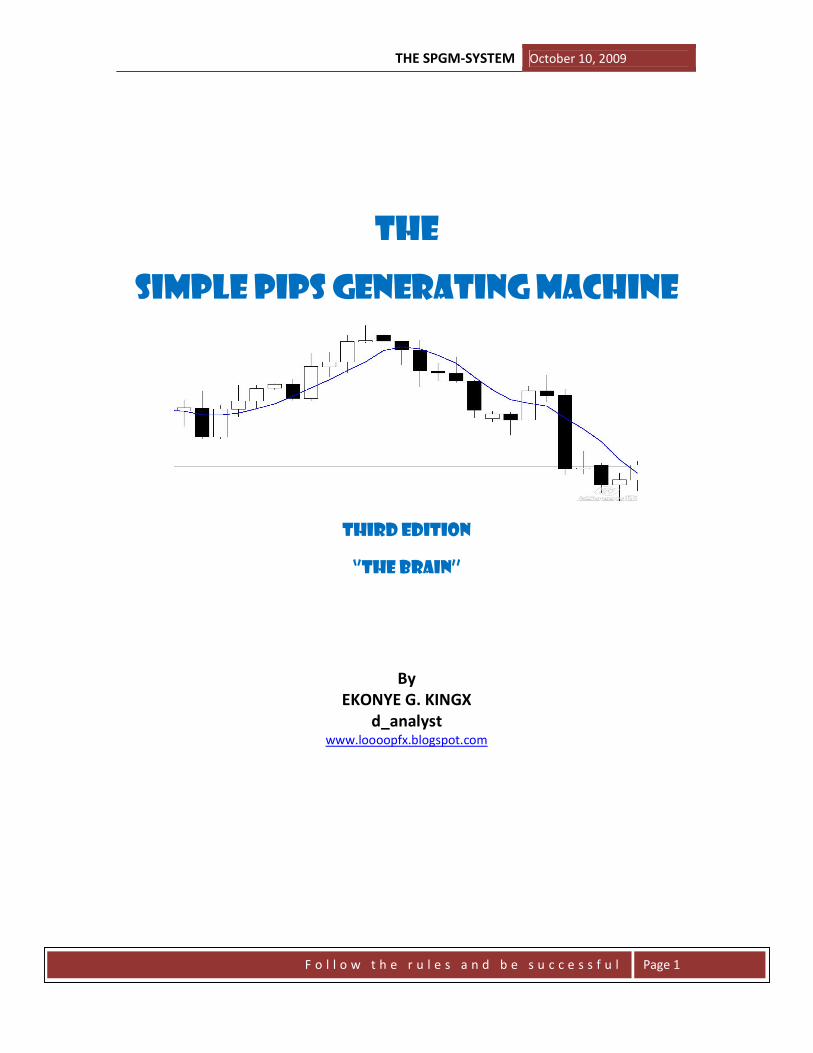
THE
SIMPLE PIPS GENERATING MACHINE
THIRD EDITION
‘’The Brain’’
By
EKONYE G. KINGX
d_analyst www.loooopfx.blogspot.com
THE SPGM-SYSTEM October 10, 2009
F o l l o w t h e r u l e s a n d b e s u c c e s s f u l
Page 2
SPGM-3
’THE BRAIN’
My initial plans was to launch SPGM-3 (The Filter) this weekend then SPGM-4 (The Brain) two weeks
later but I was forced to realise that if an SPGM-4 can be ready just two weeks after SPGM-3, why
can’t I merge the two to make a much more loaded SPGM-3 (The Brain) ? Funny enough I could not
afford the luxury of having enough time to make the choice and this was mainly catalysed by the
statistical result I got after taking a poll of various area of SPGM-1 and 2 questions were coming
mainly from. This alone was more than enough reasons for me to embrace the inevitable choice
...merging the two to form a more complete SPGM-3 ...The Brain.
From statistics, 65% of questions asked were targeted at ENTRY, 18% at EXIT and 12% at STOP LOSS.
I think my priority here is entry and stop loss, a well defined entry could guarantee a tight and safe
stop loss however, I will like to leave issues regarding exits to individual traders to handle. You are in
the best position to define the kind of trader you want to be either aggressive (making the most out
of the market) or conservative (taking little at a time). Fortunately enough, as generous as SPGM can
be, it will help take care of entries, exits and stop loss issues... I give you my word...SPGM-3 will
afford you the luxury of trading like a pro with a more relaxed mind.
EXTRACTING THE BRAIN
I will be applying the principle of more facts and fewer stories because I hope to see this document
as the full version of The SPGM-System, earlier versions seen so far were just the refining stages of
SPGM right from the crude to the finest...SPGM-3.
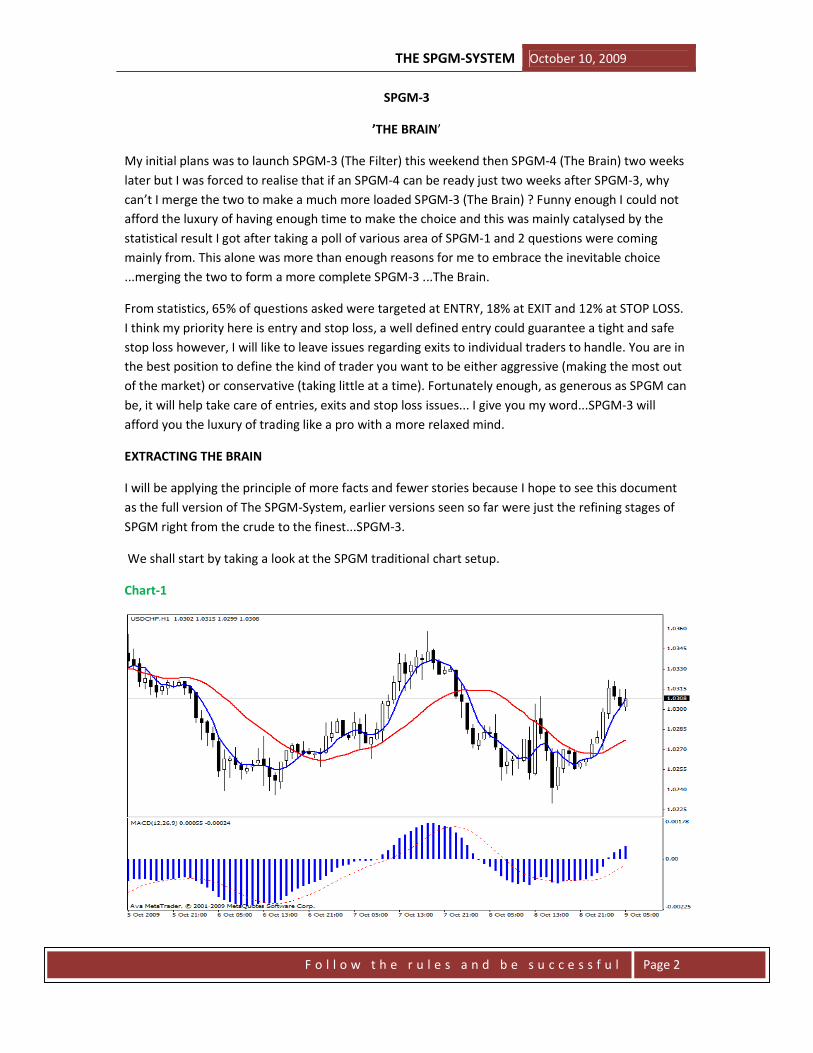
We shall start by taking a look at the SPGM traditional chart setup.
Chart-1

THE SPGM-SYSTEM October 10, 2009
F o l l o w t h e r u l e s a n d b e s u c c e s s f u l
Page 3
Nice clean chart if you ask me and so simple looking isn’t it? I got thinking ...aren’t there possibilities
of tweaking the SPGM to much cleaner simpler form with higher profitability? Too many questions
have been asked regarding the SPGM entry rules, the base entry rule seem well understood
however, the exception cases seem to have drawn so many attentions though most experienced
traders do not have problems with this, a bulk of newbie traders seem to be clamouring for more
clarity as regards the SPGM entry exceptions. This makes a fact clear; the system truly may be simple
as paraded but entry issues still carry traces of complexity to many newbie traders and this could
make the supposed simplicity of the system a bit questionable especially to newbie. I do not think I
want that to happen.
Now back to the traditional SPGM chart, I carried out an intensive close observation of the three
base indicators of the SPGM; sma5, sma20 and macd independently for a few days backed up of
course with back test data and took a record of my observations of individual role played by the
SPGM base indicators. The idea behind this is to run a check to see if anyone of the indicator could
play the role of another or other two. I took a down a record of my findings after the exercise.
The Final Filter
I collated the records I took down so as to enable me make my deductions. Looking at my score
sheet, I discovered something real amazing.
1. All Macd signals, those for reversals, warnings and continuations, are as a result of price
action on sma5. This true and verifiable fact balls down to another true fact; price action on
sma5 helps it pick earlier and more promising signals than macd itself.
2. Sma5 is a better and more reliable tool for measuring true intraday trend compared to
sma20.
3. Sma5 has this very unique characteristic of always following price action closely (a kind of
hugging habit) and this leaves no room for a tool like sma20 in SPGM system.
4. Macd and sma20 are more active only when sma5 is active meaning they both depend on
sma5 to perform. This makes sma20 and macd the dependent variables of SPGM system.
Based on my above discoveries, I decided to alter the SPGM setup; I removed sma20 and macd from
all my charts leaving just sma5.
THE SPGM-SYSTEM October 10, 2009
F o l l o w t h e r u l e s a n d b e s u c c e s s f u l
Page 4
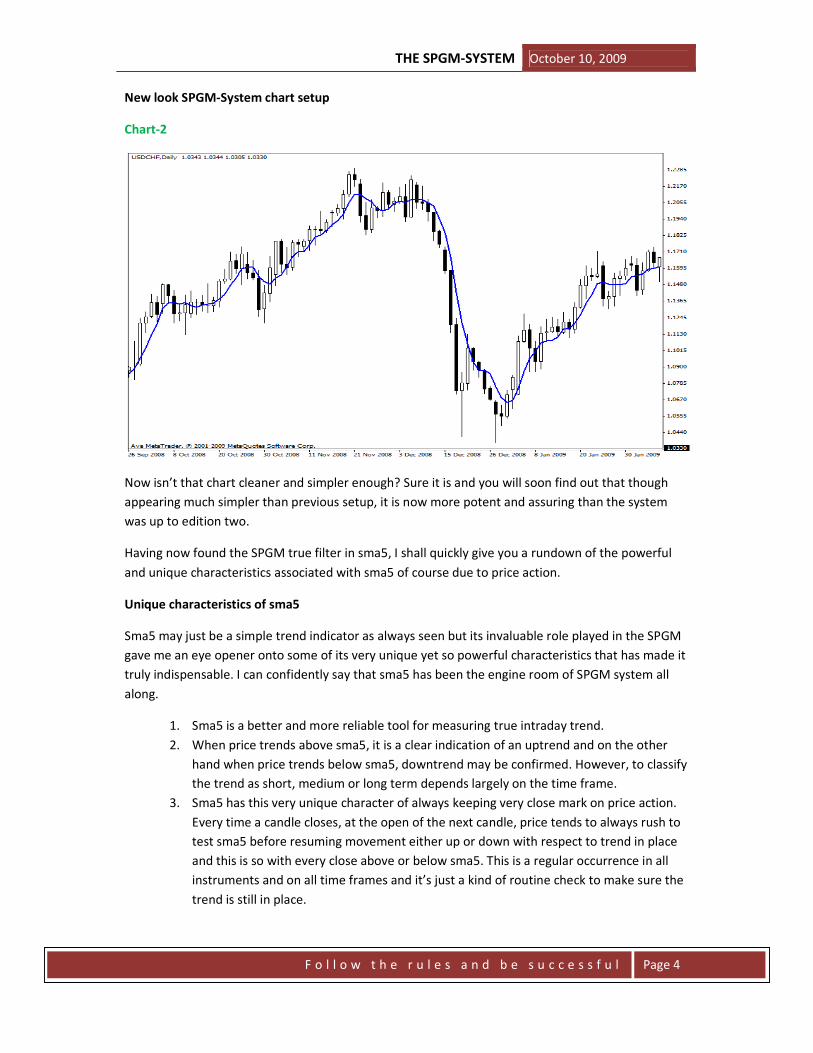
New look SPGM-System chart setup
Chart-2
Now isn’t that chart cleaner and simpler enough? Sure it is and you will soon find out that though
appearing much simpler than previous setup, it is now more potent and assuring than the system
was up to edition two.
Having now found the SPGM true filter in sma5, I shall quickly give you a rundown of the powerful
and unique characteristics associated with sma5 of course due to price action.
Unique characteristics of sma5
Sma5 may just be a simple trend indicator as always seen but its invaluable role played in the SPGM
gave me an eye opener onto some of its very unique yet so powerful characteristics that has made it
truly indispensable. I can confidently say that sma5 has been the engine room of SPGM system all
along.
1. Sma5 is a better and more reliable tool for measuring true intraday trend.
2. When price trends above sma5, it is a clear indication of an uptrend and on the other
hand when price trends below sma5, downtrend may be confirmed. However, to classify
the trend as short, medium or long term depends largely on the time frame.
3. Sma5 has this very unique character of always keeping very close mark on price action.
Every time a candle closes, at the open of the next candle, price tends to always rush to
test sma5 before resuming movement either up or down with respect to trend in place
and this is so with every close above or below sma5. This is a regular occurrence in all
instruments and on all time frames and it’s just a kind of routine check to make sure the
trend is still in place.
THE SPGM-SYSTEM October 10, 2009
F o l l o w t h e r u l e s a n d b e s u c c e s s f u l
Page 5
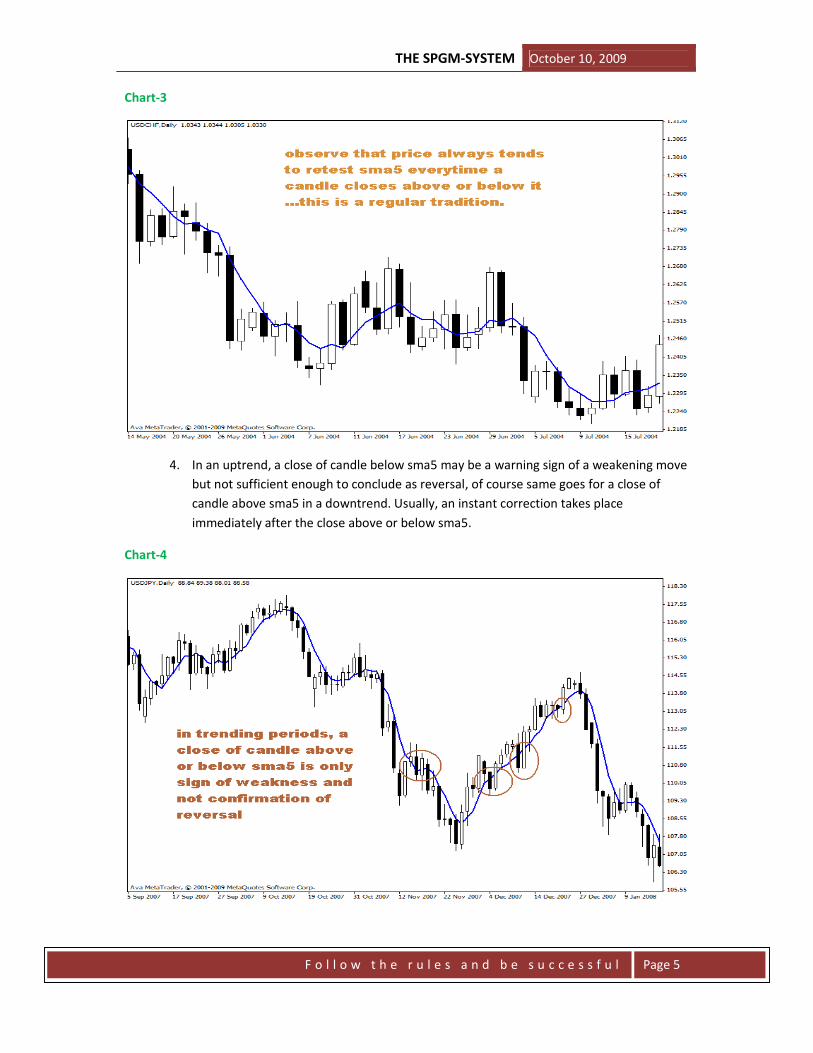
Chart-3
4. In an uptrend, a close of candle below sma5 may be a warning sign of a weakening move
but not sufficient enough to conclude as reversal, of course same goes for a close of
candle above sma5 in a downtrend. Usually, an instant correction takes place
immediately after the close above or below sma5.
Chart-4
THE SPGM-SYSTEM October 10, 2009
F o l l o w t h e r u l e s a n d b e s u c c e s s f u l
Page 6
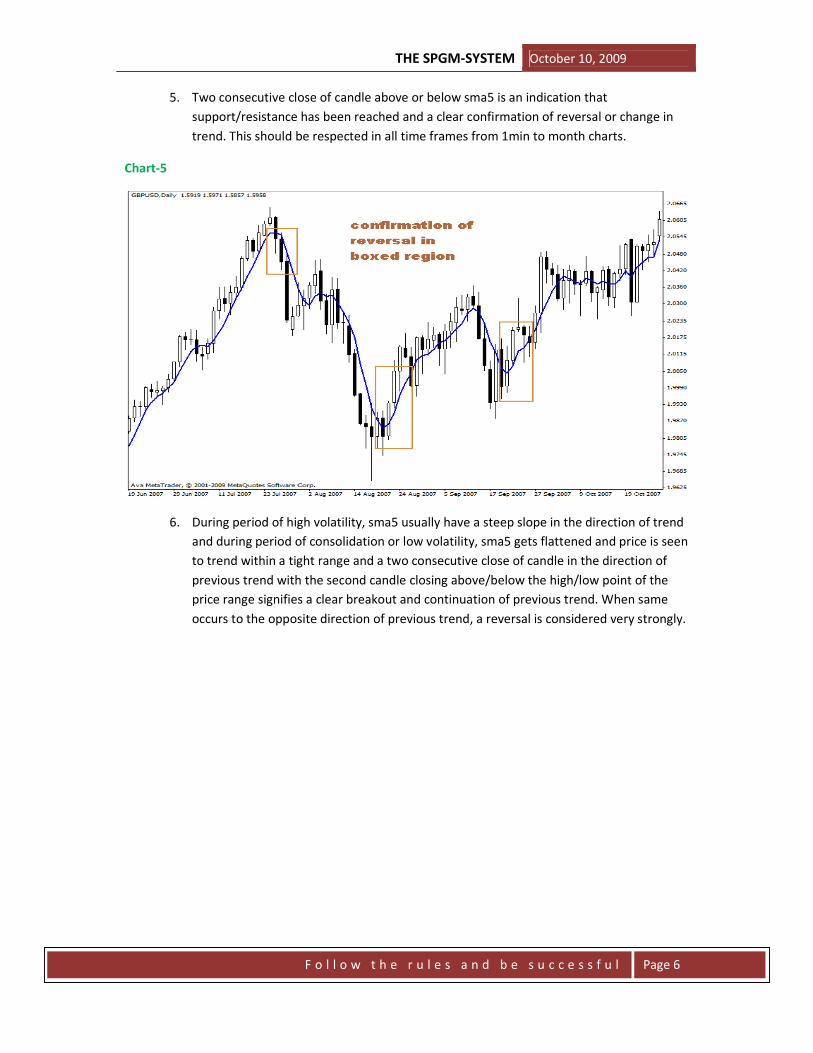
5. Two consecutive close of candle above or below sma5 is an indication that
support/resistance has been reached and a clear confirmation of reversal or change in
trend. This should be respected in all time frames from 1min to month charts.
Chart-5
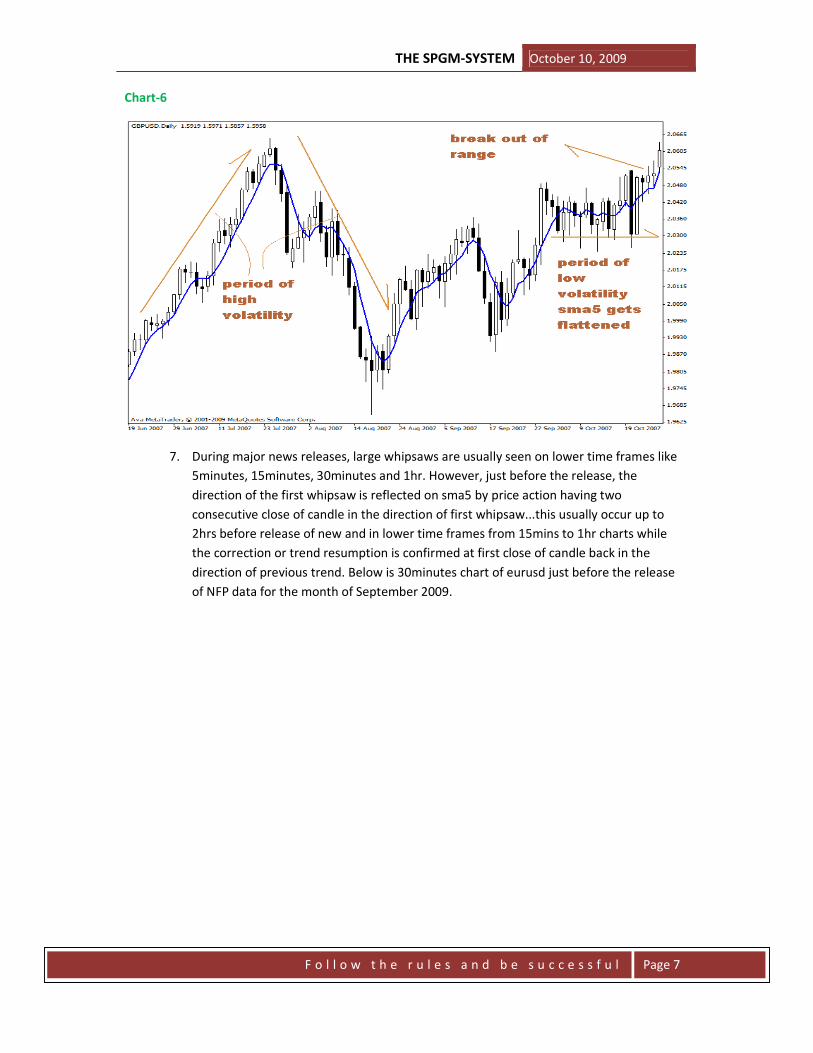
6. During period of high volatility, sma5 usually have a steep slope in the direction of trend
and during period of consolidation or low volatility, sma5 gets flattened and price is seen
to trend within a tight range and a two consecutive close of candle in the direction of
previous trend with the second candle closing above/below the high/low point of the
price range signifies a clear breakout and continuation of previous trend. When same
occurs to the opposite direction of previous trend, a reversal is considered very strongly.
THE SPGM-SYSTEM October 10, 2009
F o l l o w t h e r u l e s a n d b e s u c c e s s f u l
Page 7
Chart-6
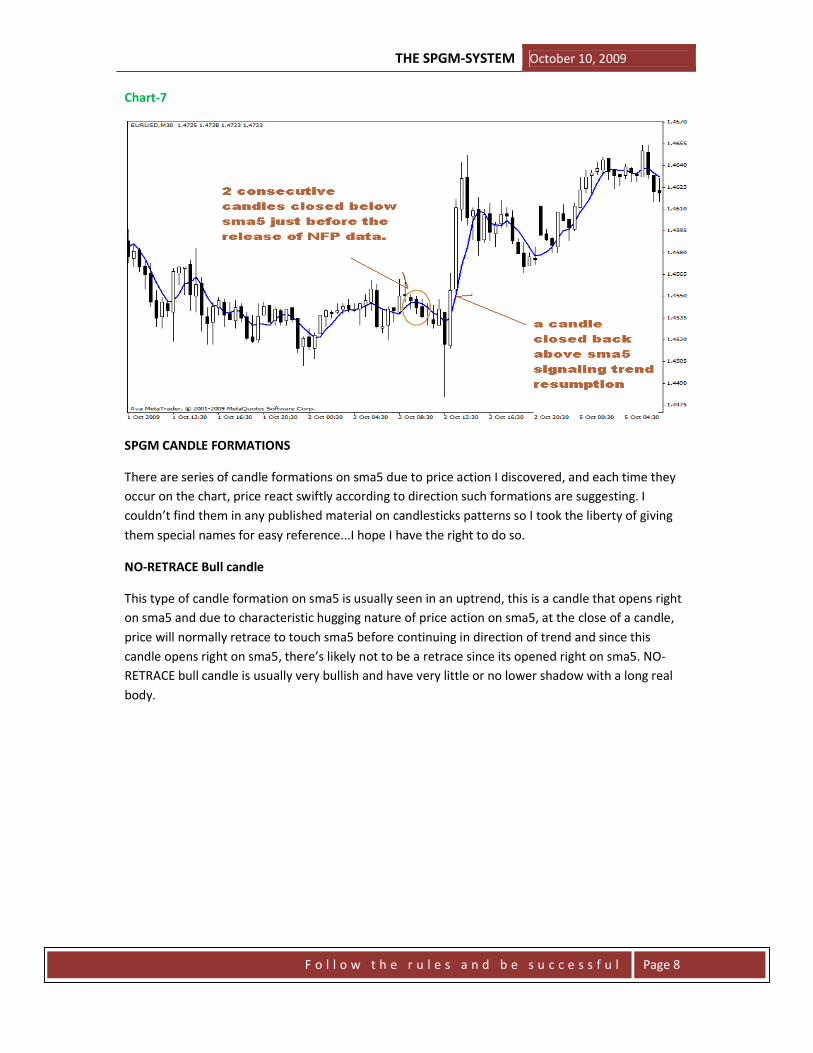
7. During major news releases, large whipsaws are usually seen on lower time frames like
5minutes, 15minutes, 30minutes and 1hr. However, just before the release, the
direction of the first whipsaw is reflected on sma5 by price action having two
consecutive close of candle in the direction of first whipsaw...this usually occur up to
2hrs before release of new and in lower time frames from 15mins to 1hr charts while
the correction or trend resumption is confirmed at first close of candle back in the
direction of previous trend. Below is 30minutes chart of eurusd just before the release
of NFP data for the month of September 2009.
THE SPGM-SYSTEM October 10, 2009
F o l l o w t h e r u l e s a n d b e s u c c e s s f u l
Page 8
Chart-7
SPGM CANDLE FORMATIONS
There are series of candle formations on sma5 due to price action I discovered, and each time they
occur on the chart, price react swiftly according to direction such formations are suggesting. I
couldn’t find them in any published material on candlesticks patterns so I took the liberty of giving
them special names for easy reference...I hope I have the right to do so.
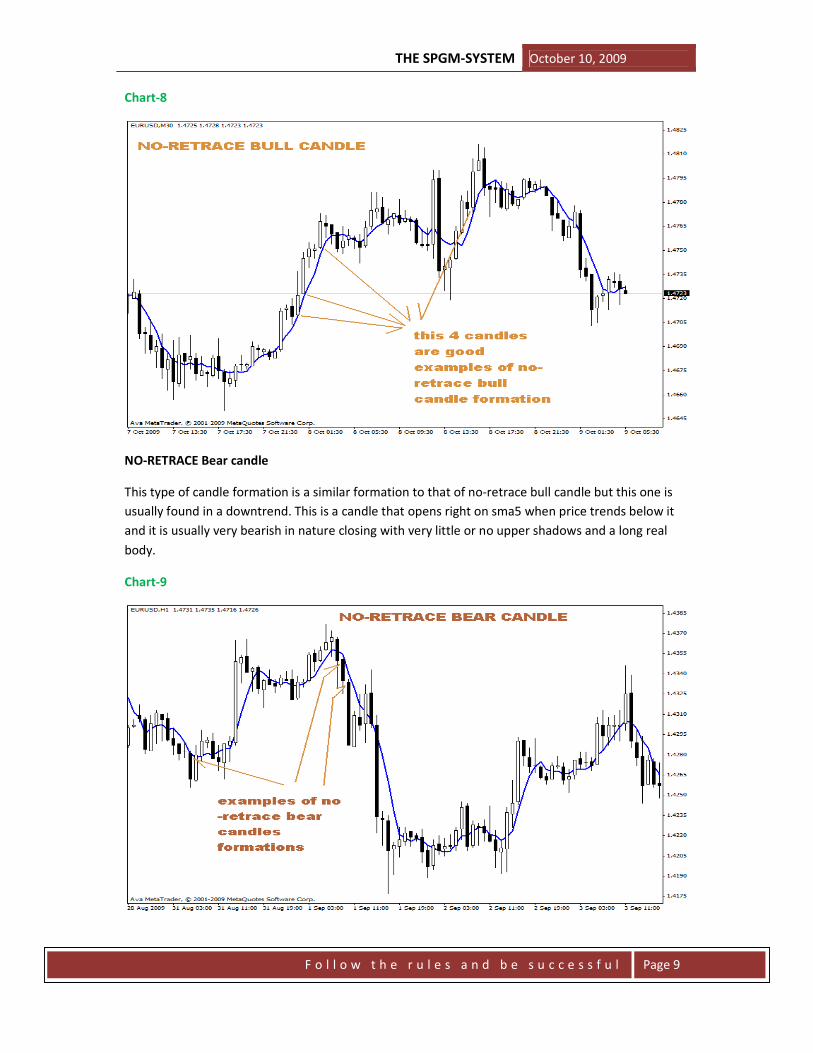
NO-RETRACE Bull candle
This type of candle formation on sma5 is usually seen in an uptrend, this is a candle that opens right
on sma5 and due to characteristic hugging nature of price action on sma5, at the close of a candle,
price will normally retrace to touch sma5 before continuing in direction of trend and since this
candle opens right on sma5, there’s likely not to be a retrace since its opened right on sma5. NO-
RETRACE bull candle is usually very bullish and have very little or no lower shadow with a long real
body.
THE SPGM-SYSTEM October 10, 2009
F o l l o w t h e r u l e s a n d b e s u c c e s s f u l
Page 9
Chart-8
NO-RETRACE Bear candle
This type of candle formation is a similar formation to that of no-retrace bull candle but this one is
usually found in a downtrend. This is a candle that opens right on sma5 when price trends below it
and it is usually very bearish in nature closing with very little or no upper shadows and a long real
body.
Chart-9
THE SPGM-SYSTEM October 10, 2009
F o l l o w t h e r u l e s a n d b e s u c c e s s f u l
Page 10
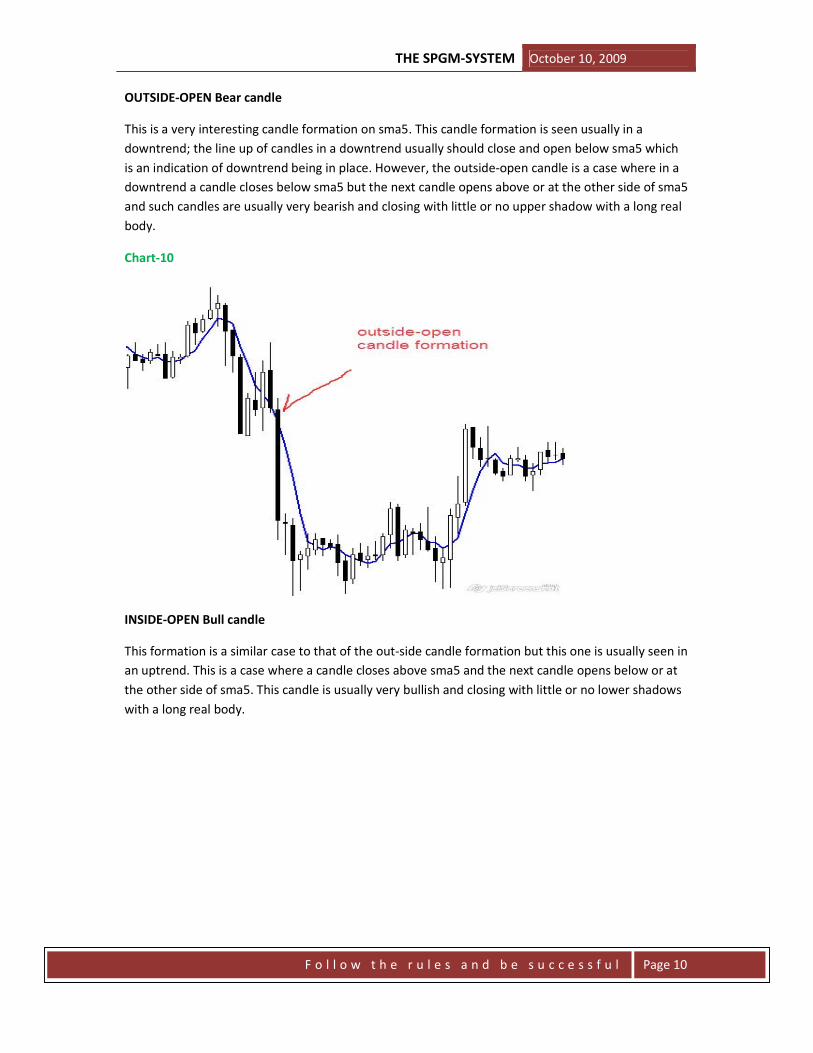
OUTSIDE-OPEN Bear candle
This is a very interesting candle formation on sma5. This candle formation is seen usually in a
downtrend; the line up of candles in a downtrend usually should close and open below sma5 which
is an indication of downtrend being in place. However, the outside-open candle is a case where in a
downtrend a candle closes below sma5 but the next candle opens above or at the other side of sma5
and such candles are usually very bearish and closing with little or no upper shadow with a long real
body.
Chart-10
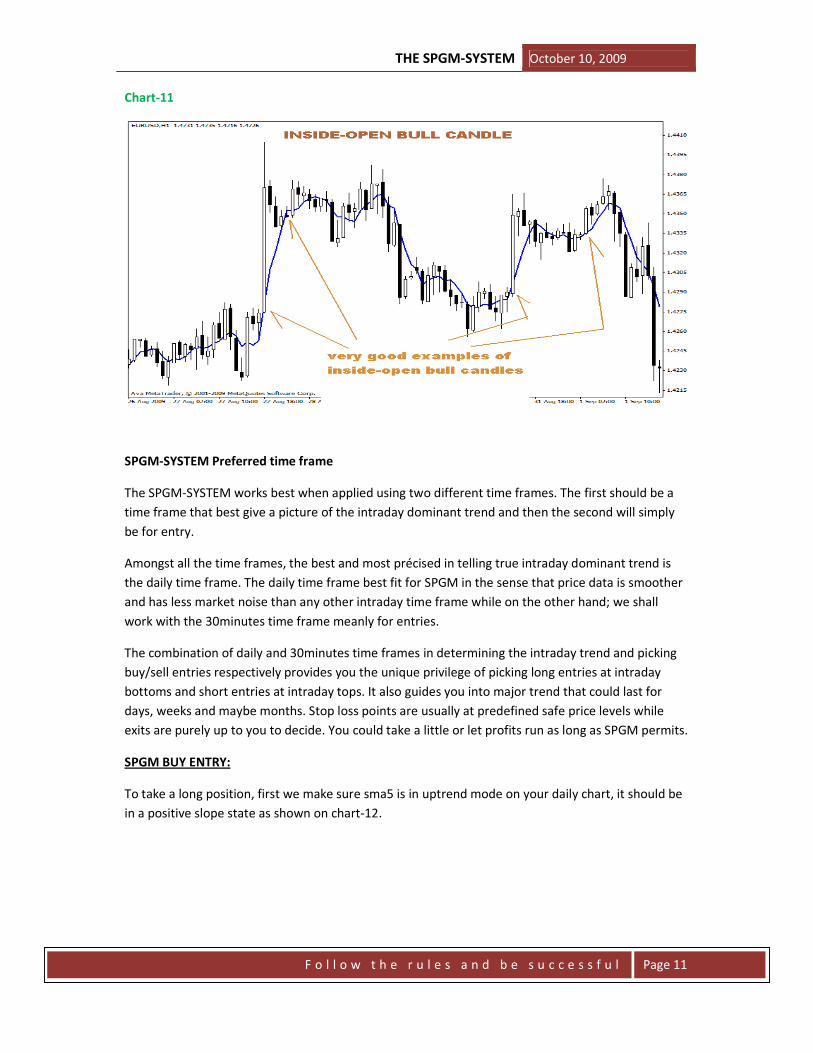
INSIDE-OPEN Bull candle
This formation is a similar case to that of the out-side candle formation but this one is usually seen in
an uptrend. This is a case where a candle closes above sma5 and the next candle opens below or at
the other side of sma5. This candle is usually very bullish and closing with little or no lower shadows
with a long real body.
THE SPGM-SYSTEM October 10, 2009
F o l l o w t h e r u l e s a n d b e s u c c e s s f u l
Page 11
Chart-11
SPGM-SYSTEM Preferred time frame
The SPGM-SYSTEM works best when applied using two different time frames. The first should be a
time frame that best give a picture of the intraday dominant trend and then the second will simply
be for entry.
Amongst all the time frames, the best and most précised in telling true intraday dominant trend is
the daily time frame. The daily time frame best fit for SPGM in the sense that price data is smoother
and has less market noise than any other intraday time frame while on the other hand; we shall
work with the 30minutes time frame meanly for entries.
The combination of daily and 30minutes time frames in determining the intraday trend and picking
buy/sell entries respectively provides you the unique privilege of picking long entries at intraday
bottoms and short entries at intraday tops. It also guides you into major trend that could last for
days, weeks and maybe months. Stop loss points are usually at predefined safe price levels while
exits are purely up to you to decide. You could take a little or let profits run as long as SPGM permits.
SPGM BUY ENTRY:
To take a long position, first we make sure sma5 is in uptrend mode on your daily chart, it should be
in a positive slope state as shown on chart-12.
THE SPGM-SYSTEM October 10, 2009
F o l l o w t h e r u l e s a n d b e s u c c e s s f u l
Page 12
Chart-12
Since the daily chart determines our intraday true trend, possible setups may only be sort after at
daily market close. As a new daily candle forms, first we note if it is one of the SPGM candle
formation associated with uptrend (Inside-open and No-retrace bull candle formations) and if it is,
then there may likely be very little or no retrace/pullback to test sma5 therefore an instant long
position may be taken at the daily candle open. However, if it is a non-SPGM candle formation, then
there is most likely going to be retrace/pullback to sma5 therefore we switch to the 30minutes chart
to find a convenient entry point.
First you wait till the retrace/pullback is almost at sma5 on the daily chart then go to 30minutes
chart to wait for a first two consecutive close of candle above sma5 which is a clear confirmation
that the retrace/pullback to sma5 on daily chart have found support then you may wait for a
pullback to sma5 on the 30minutes chart right after the two consecutive candle close above sma5 (it
does 98% of the time) and take a long position right there.
For those who may not have the time to follow the 30minutes chart till there is a two consecutive
candle close above sma5 confirming long, you may place a buy limit order just above nearest key
support level below open price and around sma5 line on daily chart. Application of pivot points may
help you find good spot to set your buy limit order.
Also for those who may want to take advantage of the retrace/pullback to sma5 on daily chart, you
may short for few pips using very small lot size on the 30minutes chart and exit at second
consecutive close of candle above sma5 on the 30minutes chart however this practice may be seen
as risky because by so doing you would be trading against the bigger trend and you could get caught
up in a web. However, to trade such retrace/pullback, you should make sure sma5 on 30minutes
chart is in DOWNTREND MODE.
THE SPGM-SYSTEM October 10, 2009
F o l l o w t h e r u l e s a n d b e s u c c e s s f u l
Page 13
SPGM SELL ENTRY:
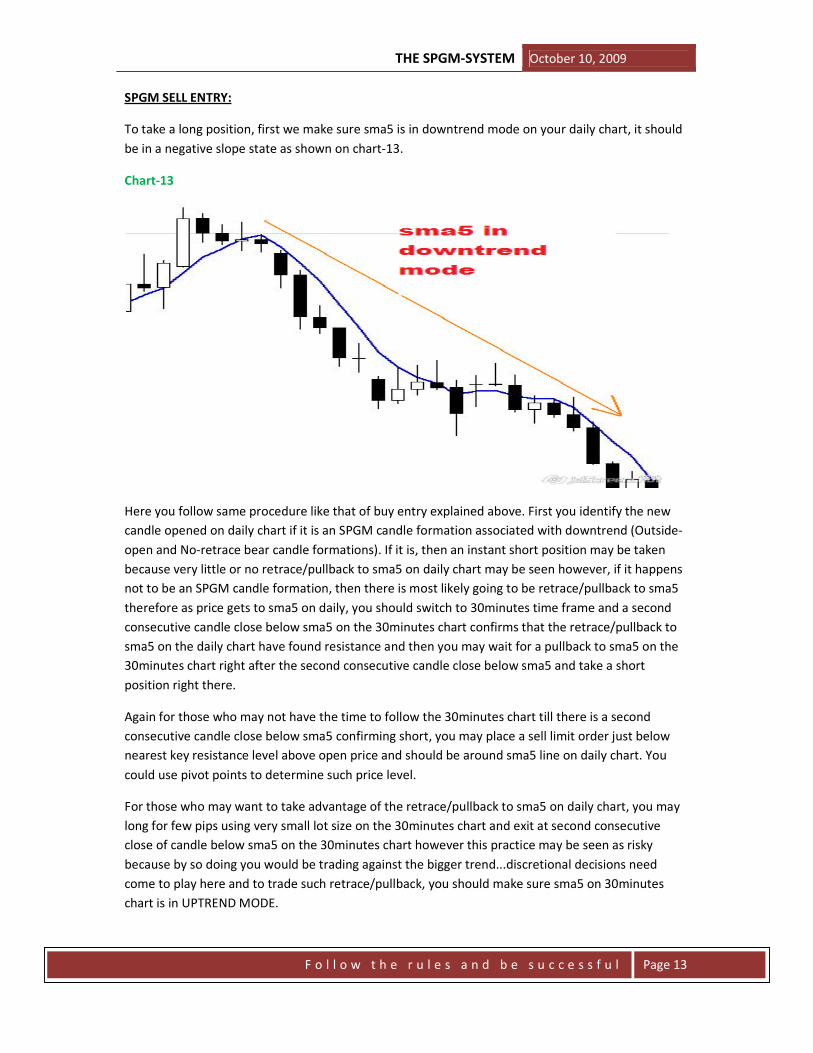
To take a long position, first we make sure sma5 is in downtrend mode on your daily chart, it should
be in a negative slope state as shown on chart-13.
Chart-13
Here you follow same procedure like that of buy entry explained above. First you identify the new
candle opened on daily chart if it is an SPGM candle formation associated with downtrend (Outside-
open and No-retrace bear candle formations). If it is, then an instant short position may be taken
because very little or no retrace/pullback to sma5 on daily chart may be seen however, if it happens
not to be an SPGM candle formation, then there is most likely going to be retrace/pullback to sma5
therefore as price gets to sma5 on daily, you should switch to 30minutes time frame and a second
consecutive candle close below sma5 on the 30minutes chart confirms that the retrace/pullback to
sma5 on the daily chart have found resistance and then you may wait for a pullback to sma5 on the
30minutes chart right after the second consecutive candle close below sma5 and take a short
position right there.
Again for those who may not have the time to follow the 30minutes chart till there is a second
consecutive candle close below sma5 confirming short, you may place a sell limit order just below
nearest key resistance level above open price and should be around sma5 line on daily chart. You
could use pivot points to determine such price level.
For those who may want to take advantage of the retrace/pullback to sma5 on daily chart, you may
long for few pips using very small lot size on the 30minutes chart and exit at second consecutive
close of candle below sma5 on the 30minutes chart however this practice may be seen as risky
because by so doing you would be trading against the bigger trend...discretional decisions need
come to play here and to trade such retrace/pullback, you should make sure sma5 on 30minutes
chart is in UPTREND MODE.
THE SPGM-SYSTEM October 10, 2009
F o l l o w t h e r u l e s a n d b e s u c c e s s f u l
Page 14
SPGM EXIT
I do not have any very special model in place to help determine safe exit point but the best I can
offer is that you should be conscious of key support/resistance price level on your chart. Also a fair
knowledge of your favourite currency pair average daily range can be very helpful. Alternatively, you
could ride the trend till SPGM declares reversal...the choice is yours.
SPGM STOP LOSS
Your stop loss should be at a safe distance between 30-50pips above/below most recent swing next
to entry point on the 30minutes chart.
You may as well choose to set your stop loss at fixed values below entry point. I trade mostly eurusd,
gbpusd, eurjpy, gbpjpy, audjpy, usdjpy, eurgbp and usdchf and I prefer to set a fixed value of 100pips
stop loss on eurusd, gbpusd, usdjpy, eurgbp and usdchf while I stick to a 150pips fixed stop loss for
gbpjpy, eurjpy and audjpy.
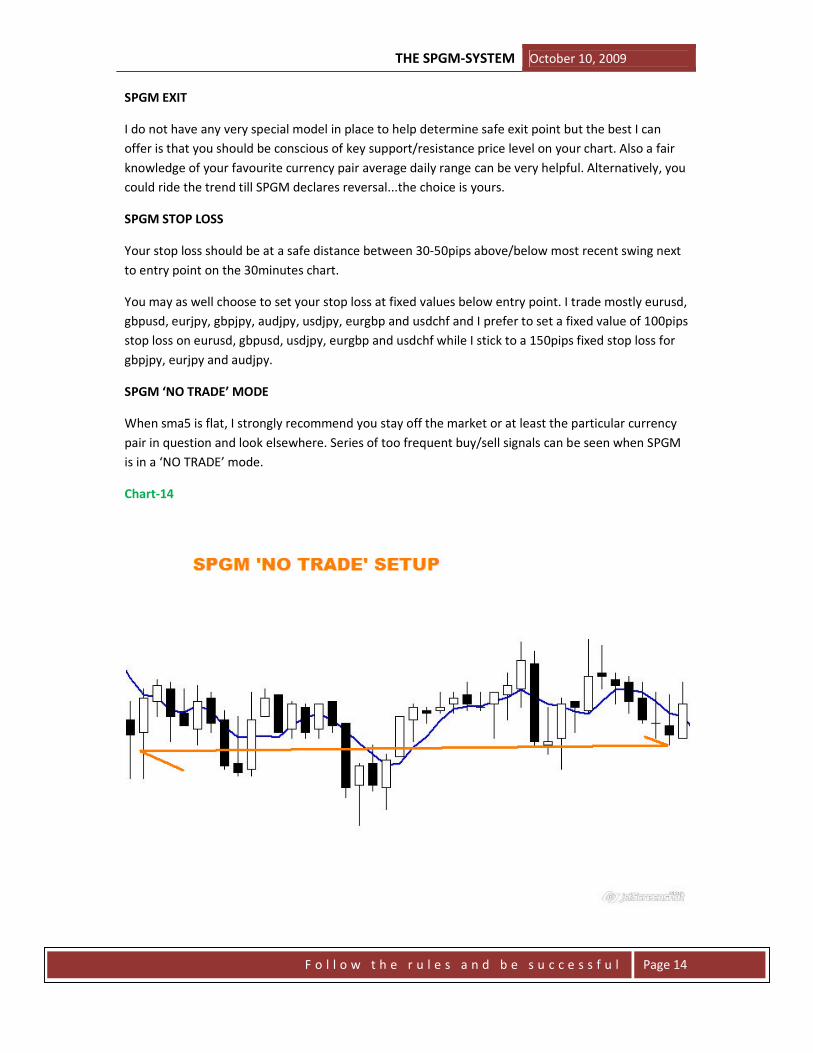
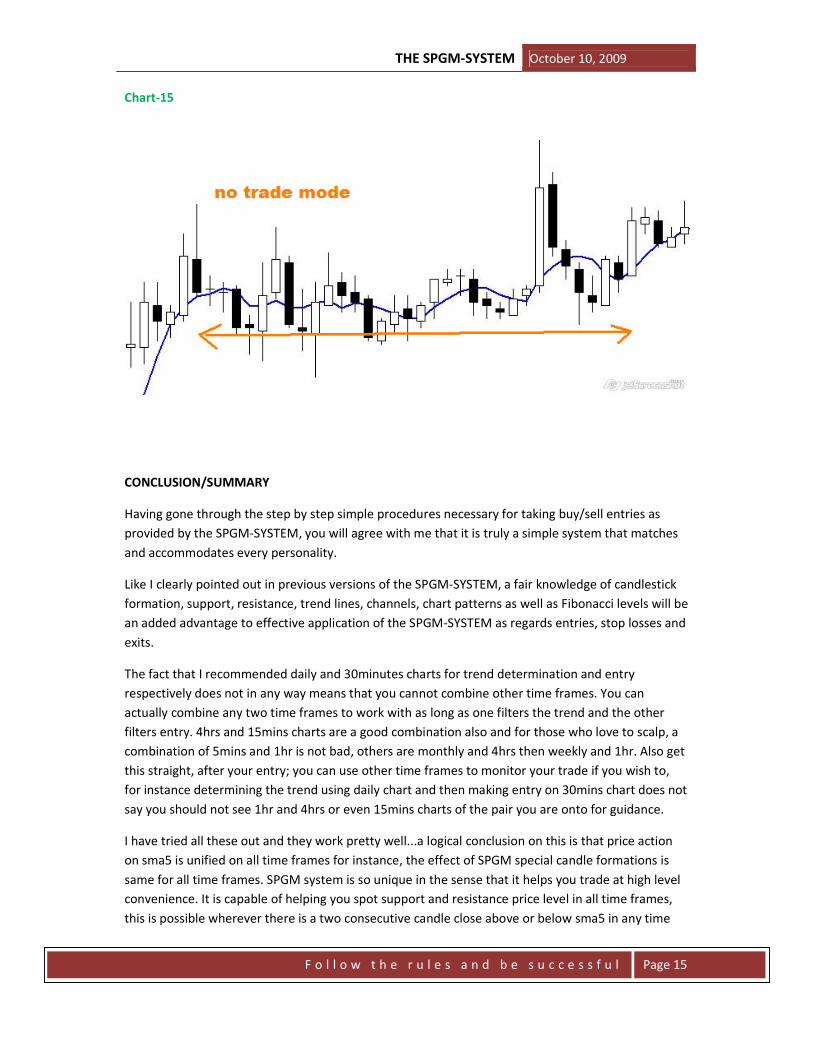
SPGM ‘NO TRADE’ MODE
When sma5 is flat, I strongly recommend you stay off the market or at least the particular currency
pair in question and look elsewhere. Series of too frequent buy/sell signals can be seen when SPGM
is in a ‘NO TRADE’ mode.
Chart-14
THE SPGM-SYSTEM October 10, 2009
F o l l o w t h e r u l e s a n d b e s u c c e s s f u l
Page 15
Chart-15
CONCLUSION/SUMMARY
Having gone through the step by step simple procedures necessary for taking buy/sell entries as
provided by the SPGM-SYSTEM, you will agree with me that it is truly a simple system that matches
and accommodates every personality.
Like I clearly pointed out in previous versions of the SPGM-SYSTEM, a fair knowledge of candlestick
formation, support, resistance, trend lines, channels, chart patterns as well as Fibonacci levels will be
an added advantage to effective application of the SPGM-SYSTEM as regards entries, stop losses and
exits.
The fact that I recommended daily and 30minutes charts for trend determination and entry
respectively does not in any way means that you cannot combine other time frames. You can
actually combine any two time frames to work with as long as one filters the trend and the other
filters entry. 4hrs and 15mins charts are a good combination also and for those who love to scalp, a
combination of 5mins and 1hr is not bad, others are monthly and 4hrs then weekly and 1hr. Also get
this straight, after your entry; you can use other time frames to monitor your trade if you wish to,
for instance determining the trend using daily chart and then making entry on 30mins chart does not
say you should not see 1hr and 4hrs or even 15mins charts of the pair you are onto for guidance.
I have tried all these out and they work pretty well...a logical conclusion on this is that price action
on sma5 is unified on all time frames for instance, the effect of SPGM special candle formations is
same for all time frames. SPGM system is so unique in the sense that it helps you trade at high level
convenience. It is capable of helping you spot support and resistance price level in all time frames,
this is possible wherever there is a two consecutive candle close above or below sma5 in any time

THE SPGM-SYSTEM October 10, 2009
F o l l o w t h e r u l e s a n d b e s u c c e s s f u l
Page 16
frame, the high/low point reached just before the second close of candle above/below sma5
signifies that price have found resistance/support around that high/low point reached before the
turn around. If however, the reversal due to such resistance/support in the lower time frame could
lead to a second consecutive candle close above/below sma5 in the next higher time frame to the
first, then it fully justifies the strength of the resistance/support.
Take for instance, if the move due to a two consecutive candle close above sma5 on 4hrs chart leads
to a two consecutive candle close above sma5 on the daily chart, that support level that resulted to
such bounce up could be deemed a very strong price level. The same principle applies to a two
consecutive candle close below sma5 in such time frames respectively.
Another aspect I will like to point out is the uniqueness of the SPGM special candle formations
especially when applied to higher time frames like weekly and monthly charts. When a no-retrace
bull candle or an inside-open bull candle formation forms on weekly and monthly charts, it could
suggest a very bullish week or month ahead. More so, when a no-retrace bear candle or an outside-
open bear candle forms on weekly or monthly charts, it could suggest a very bearish week or month
ahead. You could imagine the edge it could place you ahead of fellow traders who don’t use SPGM
guidance at taking trade decisions for that week or month in question.
The truth here is that SPGM is a trading package that has something to offer to any class of trader be
you a newbie, fairly experienced or a professional trader and finally, it offers you the generous
choice of adopting any trading style that soothes your personality, part time or full time, short term
or long term.
Believe it or not, SPGM is a universal trading system. Works for currencies, commodities, stocks,
futures, cfds and indexes. It also work great on FIXED-ODDS FINANCIAL TRADING, actually while
running my research on forex I was also test running it on fixed-odds and I can confidently tell you
this, SPGM is a tool that can nail the fixed-odds market any time any day and you can quote me on
this. I have tested it and it has delivered.
If you wish to take advantage of SPGM to conquer the fixed odds market and you don’t have a clue
on how to go about it or where to start from, then you can reach me through my contact and I will
be glad to hold you by the hand through all you need know to get started and of course how to apply
SPGM.

THE SPGM-SYSTEM October 10, 2009
F o l l o w t h e r u l e s a n d b e s u c c e s s f u l
Page 17
FINAL CALL
The road to SPGM-3 so far has been a very long and uneasy one. This is the final result of over 14
months of careful research and close observation of the system right from the crude version to
version 1, version 2 and finally SPGM-3. I invested time, money and energy just to get this far in
providing a system this simple and profitable and sharing it for free with the huge positive
response/testimonies I have gotten so far from those who have been testing it with me gives me a
true feeling of fulfilment.
I plan to setup an SPGM-SYSTEM based website soon so that many more can benefit from it. This
project is going to cost me but I truly don’t care. If however you feel like being part of the project or
partnering with me, then feel free to contact me via email at [email protected] I could use extra
hands in my researches.
Finally, this is the part where I say a big thank you to you all for taking time to read through my work
and I sincerely hope you find it profitable.
Follow the rules and be successful.
Good luck to you all!
d_analyst
Trading Futures and Options on Futures and Cash Forex transactions involves substantial Risk of loss and may not
be suitable for all investors. You should carefully consider whether trading is suitable for you in light of your
circumstances, knowledge and financial resources. You may lose all or more of your initial investment. Opinions,
market data and recommendations are subject to change at any time.


![G. VITALI - Optimization OnlineWe recall the SPGM introduced in [3, alg. SPG2] for the minimization of di erentiable functions on nonempty closed and convex sets. When SPGM is applied](https://img.pdfslide.us/doc/110x75/5e615de1cdc89540ff44a2bf/g-vitali-optimization-we-recall-the-spgm-introduced-in-3-alg-spg2-for-the.jpg)