Embed Size (px)
Citation preview
Spending on health and social care over the next 50 yearsWhy think long term?AuthorJohn Appleby
Published by
The King’s Fund
11–13 Cavendish Square
London W1G 0AN
Tel: 020 7307 2591
Fax: 020 7307 2801
www.kingsfund.org.uk
© The King’s Fund 2013
First published 2013 by The King’s Fund
Charity registration number: 1126980
All rights reserved, including the right of reproduction in whole or in part in any form
ISBN: 978 1 909029 03 3
A catalogue record for this publication is available from the British Library
Available from:
The King’s Fund
11–13 Cavendish Square
London W1G 0AN
Tel: 020 7307 2591
Fax: 020 7307 2801
Email: [email protected]
www.kingsfund.org.uk/publications
Edited by Fiona Weston
Typeset by Grasshopper Design Company
Printed in the UK by The King’s Fund
The King’s Fund is an independent charity working to improve health and health care in England. We help to shape policy and practice through research and analysis; develop individuals, teams and organisations; promote understanding of the health and social care system; and bring people together to learn, share knowledge and debate. Our vision is that the best possible care is available to all.
List of figures and tables ivAbout the author viAcknowledgements vii
Foreword viii
Summary ix
1 Introduction 1
2 Why think about the long term? 3
Sustainability 3 Implications for health care productivity and services 5 Wider economic impact of future health spending 7 Conclusions 7
3 What drives changes in health and social care spending? 8
Health care’s ‘cost disease’ 10 Conclusions 11
4 International analyses of future health spending 12
Multi-country spending projections 13 Single country spending forecasts 19 Conclusions 31
5 Future health and social care spending in the United Kingdom 32
Future spending drivers 32 Future spending 33 United Kingdom projections in multi-country studies 41 Conclusions 42
6 Spending choices (and consequences) 44
Higher spending? 44 Conclusions 50 Policy recommendations 51
References 52
Contents
© The King’s Fund 2013
iv © The King’s Fund 2013
Figure 1 UK NHS spending as a percentage of GDP 4
Figure 2 The public’s first and second priorities for extra government spending 6
Figure 3 Two estimates of causal factors accounting for growth in real per capita US health care spending, 1940–90 9
Figure 4 Total (public + private) health spending as a percentage of GDP, 1960–2010, all OECD countries 12
Figure 5 Projected public health care spending to 2060 under various scenarios: average of the 27 EU countries (plus Norway) 15
Figure 6 Projected public spending on health care to 2050 under various scenarios: OECD average 17
Figure 7 Projected public spending on long-term care to 2050 under various scenarios: OECD average 17
Figure 8 Projected potential growth in health care spending by 2040 18
Figure 9 US health care spending projections to 2082: ‘excess cost’ rate continues at historic averages 20
Figure 10 US health care spending projections to 2082: ‘excess cost’ rate limited in future 21
Figure 11 US total health expenditure as a percentage of GDP, 1970–2083 23
Figure 12 Three scenarios for future public health care spending in Denmark 24
Figure 13 Effect of various assumptions about demographic impact on Swiss health care spending by 2050 25
Figure 14 Overall impact of demographic and non-demographic effects on Swiss health care spending by 2050 26
Figure 15 Total and disease-specific health spending projections, Australia 2002/3 to 2032/3 27
Figure 16 Decomposition of factors accounting for changes in future spending, Australia 2002/3 to 2032/3 27
Figure 17 Three different projections for Australian public spending on health care 28
Figure 18 Projected health spend as a percentage of GDP: three scenarios with and without assumptions about improvements in technology 29
Figure 19 Projected spending on health and elderly care as a percentage of GDP: three scenarios with and without assumptions about improvements in technology 30
List of figures and tables
Figure 20 Willingness to pay for health outcomes in different spending scenarios: Sweden 31
Figure 21 Future UK health care spending scenarios: Wanless review 2002 34
Figure 22 Breakdown of factors contributing to Wanless’s ‘fully engaged’ spending scenario 35
Figure 23 Future social care spending, 2002 and 2026 37
Figure 24 Long-term UK health care spending projections: reports by the Treasury and the OBR, 2002–12 38
Figure 25 Long-term projections for health spending, 2016/17 to 2061/2 39
Figure 26 Long-term projections for long-term care spending, 2016/17 to 2061/2 40
Figure 27 European Commission projections: United Kingdom, 2007–60 41
Figure 28 OECD’s health and long-term care projections: United Kingdom, 2005–50 42
Figure 29 A century of health spending: projections of UK health care expenditure, 1960–2059 43
Figure 30 Productivity trends in the UK NHS 47
Figure 31 Attitudes of the British public to taxation and spending 48
Figure 32 Public sector net debt in health spending scenarios: OBR 49
Table 1 Average annual real changes in net UK NHS spending 3
Table 2 Alternative spending scenarios/drivers 13
Table 3 The Wanless review scenarios 34
Table 4 Three different scenarios for social care 36
Table 5 Non-interest spending projections as a percentage of GDP 40
Table 6 Possible future spending on UK health and long-term care: the OBR’s highest projections 45
v
List of figures and tables
© The King’s Fund 2013
vi © The King’s Fund 2013
John Appleby has been Chief Economist at The King’s Fund since 1998. He has researched and published widely on many aspects of health service funding, rationing, resource allocation and performance. He previously worked as an economist with the NHS in Birmingham and London, and at the universities of Birmingham and East Anglia as a senior lecturer in health economics. He is a visiting professor at the department of economics at City University. John’s current work includes research into the use of patient-reported outcome measures, payment systems and health services productivity. John has acted as an adviser to the UK government and parliament in various capacities.
About the author
vii© The King’s Fund 2013
The author would like to acknowledge the help and support provided in the preparation of this report by the following: Oliver Minton, Sophie Coronini-Cronberg. Tom Pybus (Office for Budget Responsibility) and Emmi Poteliakhoff (Department of Health) provided helpful comments on drafts of the report.
We are grateful to the Ministry of Health and Social Affairs, Sweden, for permission to reproduce the figures on pp 29, 30 and 31.
Acknowledgements
viii © The King’s Fund 2013
In this paper, John Appleby analyses the factors that influence the demand for health and social care, taking a long-term perspective. He shows that pressures to increase spending on health and social care will result in these services consuming an increasing proportion of gross domestic product. The exact proportion will depend on how quickly the economy itself grows, and on the choices made about the levels of taxation, government borrowing and public spending priorities.
Acknowledging the many uncertainties associated with long-term projections of the kind reviewed in this paper, it is clear that important decisions lie ahead. Although improvements in productivity should enable more value to be squeezed out of whatever level of funding is deemed to be affordable, it is likely that a gap will open up between the resources made available by government on the one hand, and the demands arising from population increases, rising national wealth, and medical advances on the other. The question that then arises is how might this gap be filled given the evidence summarised here?
The answer is as much political as technical. A great deal depends on one’s view of the role of the state and the individual, and how the balance might change over time. Will people be willing to pay the same or indeed increasing levels of taxes in order to fund public services adequately? Might the government be willing and able to increase borrowing to ensure the sustainability of valued public services such as health and social care? Or will there be a backlash against the role of the state, and an expectation that people should take greater personal responsibility for services that are currently paid for mainly through the public purse?
These questions are difficult but inescapable, and we shall be addressing them in the next stage of our Time to Think Differently programme. We want to inform and generate debate about alternative ways of paying for health and social care, the experience – both good and bad – of these approaches internationally, and the distributional and other consequences of doing so in the United Kingdom. We are also convinced that there is a strong argument that the time has come for a more fundamental review of the post-war settlement on the funding of health and social care.
In this work, our aim is to illuminate the choices that we face as a society, and to frame a debate about these issues, drawing on evidence, where possible, including the results of two deliberative events we have held jointly with Ipsos MORI and members of the public. Too often in the past changes to the funding of health and social care have been made by stealth rather than through open discussion of the options, with adverse consequences that have become apparent only after the event. By turning the spotlight on these issues now, our aim is to avoid this happening again and to contribute to an informed public debate on critical issues that affect every citizen.
Chris HamChief Executive The King’s Fund
Foreword
ix© The King’s Fund 2013
Fifty years ago, the National Health Service (NHS) in the United Kingdom consumed around 3.4 per cent of gross domestic product (GDP) Now, public spending on the NHS is nearly two-and-a-half times greater – amounting to 8.2 per cent of GDP and equivalent to seven times more in real terms.
Historically, the key drivers pushing up spending on health and long-term care include an increase in the size of the population, growth in national wealth, increases in the costs of providing care, and developments in medical technology. The ageing of the population is also a factor, although of much less importance than is generally supposed: increases in life expectancy tend simply to delay the time at which the health care costs associated with death are incurred rather than increasing these costs per se. This is an important point as it challenges the conventional thinking that spending on health care will rise inexorably as the population ages. In fact, the pressure to spend more will largely be driven by other factors.
If the next 50 years follow the trajectory of the past 50, then the United Kingdom could be spending nearly one-fifth of its entire wealth on the public provision of health and social care. However, higher spending on health and social care should not be seen solely as a debit or a burden. It is also a credit: higher spending would improve the population’s health, well-being and quality of life. It would also have wider positive impacts on economic activity and productivity, too.
Based on high-level modelling and a variety of assumptions, future trends for health and long-term care spending across many industrialised countries also suggest upward pressures on spending: across the 27 European Union countries (plus Norway), public spending could rise from 6.7 per cent of GDP in 2007 to 13 per cent by 2060. Across all Organisation for Economic Co-operation and Development nations, public health care spending is projected to rise from 5.7 per cent in 2005 to between 7.7 per cent and 9.6 per cent by 2050, and long-term care could more than double or possibly treble to between 2.4 per cent and 3.3 per cent of GDP over the same period. If private spending via social and other insurance schemes is added in, all of these figures increase considerably.
Projections for the United Kingdom show a wide range of possible spending futures, reflecting uncertainties about the long-term future and alternative approaches and assumptions made:
n a European Commission study shows public health care spending rising from around 7.5 per cent in 2007, to between 7.6 per cent and 14.9 per cent by 2060, depending on assumptions about population health, health service productivity and other factors
n the UK Office for Budget Responsibility’s latest health and long-term care projections suggest health care spending could range from 7.8 per cent to 16.6 per cent of GDP in 2061, compared with 6.8 per cent in 2016/17; on the higher projection, this would take spending per head of population from £1,745 to £9,914
n spending on long-term care in 2061 could range from 1.5 per cent to 2.5 per cent of GDP compared with 1.1 per cent in 2016, increasing per capita spending by more than fivefold from £276 to £1,491 on the higher projection.
Summary
x © The King’s Fund 2013
Spending on health and social care over the next 50 years
Spending nearly one-fifth of the United Kingdom’s entire GDP on health and social care over the next 50 years would be affordable – and would allow increased real spending on all other areas of the economy – if projections for a trebling in real GDP are achieved. Clearly, this would not be the case if growth is more sluggish.
However, all other things being equal, such spending would consume around half of all government revenues and, despite allowing an increase in the real level of spending, would mean reducing the proportion of government spending in non-health and social care areas from around 80 per cent in 2016 to around 50 per cent by 2061.
Moreover, as spending rises, diminishing returns are likely to set in, and at some point the additional cost could exceed either the additional health benefit, or the benefits to be had from spending on non-health and social care services.
All this implies that there are important political and social choices to be made about how much to spend, what it should be spent on and how this spending should be funded. These choices are not easy and will inevitably involve trade-offs.
One alternative to letting health and social care eat up a growing proportion of public expenditure would be to increase funding from taxes. Broadly speaking, if health spending increased by 1 per cent of GDP (around £15 billion) and all of this were funded through additional tax revenues, this would add around £570 a year to the tax bill of every household in the United Kingdom. Although this would maintain the current funding base, tax increases of the magnitude required to fund significant additional spending would, at some point, encounter public resistance.
In addition to or in place of increased taxation, government could simply borrow to increase health and social care spending. However, given the current macroeconomic situation and the state of public finances this seems unrealistic in the short to medium term and would be unsustainable in the longer term.
If no additional money were identified from other sources such as increased taxation, borrowing or reprioritising public spending the choices are limited to accepting a decreasing quality of service and/or a change in the balance between what is funded through the public purse and what by individuals through charges or insurance. These alternatives need careful consideration in relation to their revenue-raising potential, efficient use of taxpayers’ money, and impact on equity of access to care and use of services.
Policy recommendationsThis review suggests two sets of policy conclusions: the first concerns the possibilities for developing and refining the analytical basis of future projections; and the second the policy options arising from those projections.
Analytical basis of projections
n Given the scale of current spending on health and social care, and the likely pressures to spend even more in future, there is a clear need to carry out regular studies of these pressures to assess the long-term fiscal sustainability of such spending.
n There is room to improve and widen the scope of the projection methodologies used (while recognising the limitation posed by the uncertainty necessarily involved in such long-term projections). For example, it would be useful to assess the possible impact on spending of changes in government policy, a factor that is held constant in most projection studies. Indeed, as more evidence accumulates about the detailed relationship between population ageing and future health status – and therefore the possible pressures on spending – projection models will need to be updated.
xi
Summary
© The King’s Fund 2013
n Although the annual projections produced by the Office for Budget Responsibility as part of its analysis of fiscal sustainability provide a very useful high-level view of possible futures, there is a need for a more detailed investigation to be carried out from time to time – possibly every five years – along the lines of the 2002 analysis overseen by Sir Derek Wanless (Wanless 2002). This could also explore more detailed projections at, for example, a disease level (similar to a study by Goss [2008] in Australia). This would provide useful information to help inform the way patterns of spending might change within future health care budgets.
Spending policy choices
n Although better projection models will provide better information about future spending pressures, there seems little doubt that the pressure will be to spend more. There is therefore a need to understand both the consequences of higher spending and the options available to meet such spending pressures.
n To inform public debate, policy options should include the quantification of possible trade-offs with other government spending. They should also consider the scale of the possible impact on tax and borrowing. Analysis of the distributional, access and health consequences of any moves to change or supplement the current funding base of the NHS and long-term care need to be part of this debate.
n Of great importance is the need to assess the economic sustainability of increased spending. Although much higher spending over the long term may be affordable, more is not necessarily better, either in the aggregate or, more particularly, in terms of what the global budget is spent on. Although the National Institute for Health and Clinical Excellence aims to assess the latter, there is also a need to apply a similar economic approach to additional funding overall in order to ascertain whether any extra spending is worth the cost.

1© The King’s Fund 2013
Fifty years ago, the National Health Service (NHS) in the United Kingdom consumed around 3.4 per cent of gross domestic product (GDP) (Organisation for Economic Co-operation and Development 2012). Now, public spending on the NHS is nearly two-and-a-half times greater – amounting to 8.2 per cent of GDP and equivalent to seven times more in real terms.
As a proportion of government expenditure, the NHS in England now consumes close on one-fifth of all departmental spending – the largest in government and the equivalent of central spending on defence and education combined; and across the whole United Kingdom, one person in every 18 (5.6 per cent) is now employed by the NHS. How did this happen and what are the prospects for spending over the next 60 years?
The historic tendency has been for health care spending to grow – especially as national income increases – and, although there is variation in the actual figures, at a national level at least, the income elasticity of demand for health care tends to be above one, with increases in national income (GDP) leading to proportionately higher increases in health care spending.
But public health care spending in the United Kingdom is a matter of government policy and, therefore, choice. There is no reason that spending will consume such large proportions of GDP in the future or that it should. However, this raises the question of how much of the country’s national resources will and, more importantly, should be devoted to health care.
If the next 50 years follow the trajectory of the past 50, then by 2062 the United Kingdom could be spending nearly one-fifth of its entire wealth on the NHS, and employ around one in eight (12.5 per cent) of the working population.
Furthermore, as the demography of the population changes – in particular, a growing proportion of older people – not only will the need for social or long-term care become increasingly important, but the boundaries between what constitutes social care and what we consider health care to be are likely to become increasingly blurred. It therefore makes sense to consider both types of care service (just as many of the studies reviewed in this report do).
Increased spending on health and social care should not be considered a bad thing, of course. As an Organisation for Economic Co-operation and Development review (2010) put it, while spending is very likely to outpace the growth of national income, this reflects the value we place on the benefits we get from such spending. Increased spending will also deliver jobs, growth and well-being. Nevertheless, ‘…it will also put pressure on systems of health finance and we cannot be indifferent as to how we spend our health money’.
The most sophisticated attempt to think through and model possible future health and social care spending in the United Kingdom was carried out in 2002 by Derek Wanless on behalf of the then Chancellor, Gordon Brown. That review provided a scenario-based projection for health and social care spending up to 2022/3 and, importantly, recommended that such forecasts be carried out at regular intervals with updated
Introduction1
models and new information. The view then was that regular reworking of the forecasts (and the scenarios) would help inform debates about the effectiveness of spending, the comparability of quality of outcomes domestically and internationally, funding levels and funding sources – debates that would help create conditions for better engagement in a key aspect of policy.
Although the Treasury (and latterly the Office for Budget Responsibility, OBR) has, since 2002, produced a report looking at long-term projections for health, social care and other public spending (cf Office for Budget Responsibility 2012), no further official work along the lines and scale of Wanless’s review has been carried out. However, in 2007, The King’s Fund, together with Derek Wanless, produced a review – a ‘situation report’ – that was intended not to extend projections or to amend the original projection approaches, but rather to try to ascertain which of Wanless’s three scenarios was prevailing in 2007. The Fund’s review reiterated a need to carry out regular forecasting work that was similar (but not necessarily identical) to the 2002 review. It noted:
There are good reasons to carry out forecasting on a regular basis given the long-term nature of many of the decisions needing to be taken as well as the need to fix short-term resourcing decisions in the context of longer-term plans. The approach, using scenarios to capture particular uncertainties, based on demographic updates, an assessment of the health status and the future choices and demands of people and the aggregation of forecast costs seems robust.
(Wanless et al 2007)
The 2007 review also suggested that the Treasury or Department of Health should support a programme of work that would operate on a continuous basis to support regular reviews along the lines of that recommended in the 2002 review, and that as part of this there would be a need to analyse all the components of the forecasts previously made, using the latest available information and evidence about, for example, demographic changes, the health status of the population and the consequent likely demands, progress on productivity, progress on public health issues, progress on defining social care policy and the resulting needs and the relative long-term costs of resources to deliver services.
Our report brings together current knowledge and evidence about the reasons for thinking about the long-term future possible trajectories for health and social care spending, examples from other countries grappling with very similar issues concerning the fiscal and economic sustainability of spending, and examples of current analyses of possible future spending paths for the United Kingdom’s health care system.
2 © The King’s Fund 2013
Spending on health and social care over the next 50 years
3© The King’s Fund 2013
Despite the observation that prediction is very hard, especially about the future,1 and the fact that uncertainties expand almost exponentially the further into the future one goes, there are important reasons why it is worth thinking not just about what health and social care spending pressures may look like next year or in five years’ time, but what they might be in the next 50 or even 100 years.
In this section we briefly expand on the key reasons why it is important to think about the long-term future of spending, beginning with the question of the fiscal and economic sustainability of continuing historic trends in spending.
SustainabilityOne reason for the need to think about the long-term future of health and social care spending pressures is the sustainability of rising spending trends. Sustainability can be viewed in two ways (Organisation for Economic Co-operation and Development 2010): fiscal sustainability recognises the simple fact that someone has to pay for health care and that there will be limits not only to willingness to pay but also to national resources. On the other hand, economic sustainability is the notion that investing in health care beyond the point when decreasing returns set in and the marginal cost exceeds the marginal health benefit is unsustainable.
Fiscal sustainability
The most noticeable aspect of historic trends in health care spending in the United Kingdom is the upward trend in spending. This has varied from time to time – economic recessions, of course, affecting the size of the denominator (boosting the spending ratio) and post-recessionary times leading to lower or flat growth as government spending retrenches.
More broadly, over the period between 1950/1 and 2010/11, for example, net spending on the National Health Service (NHS) in the United Kingdom grew by around 4.04 per cent in real terms per annum (see Table 1, below). However, over a similar period (1955/6–2011/12), real gross domestic product (GDP) in the United Kingdom grew each year by 2.54 per cent. The result has been that the NHS has taken an increasing share of national income since the 1950s (see Figure 1, overleaf).
Why think about the long term?
2
1 An observation attributed to the American baseball player and manager Yogi Berra, but also to many others.
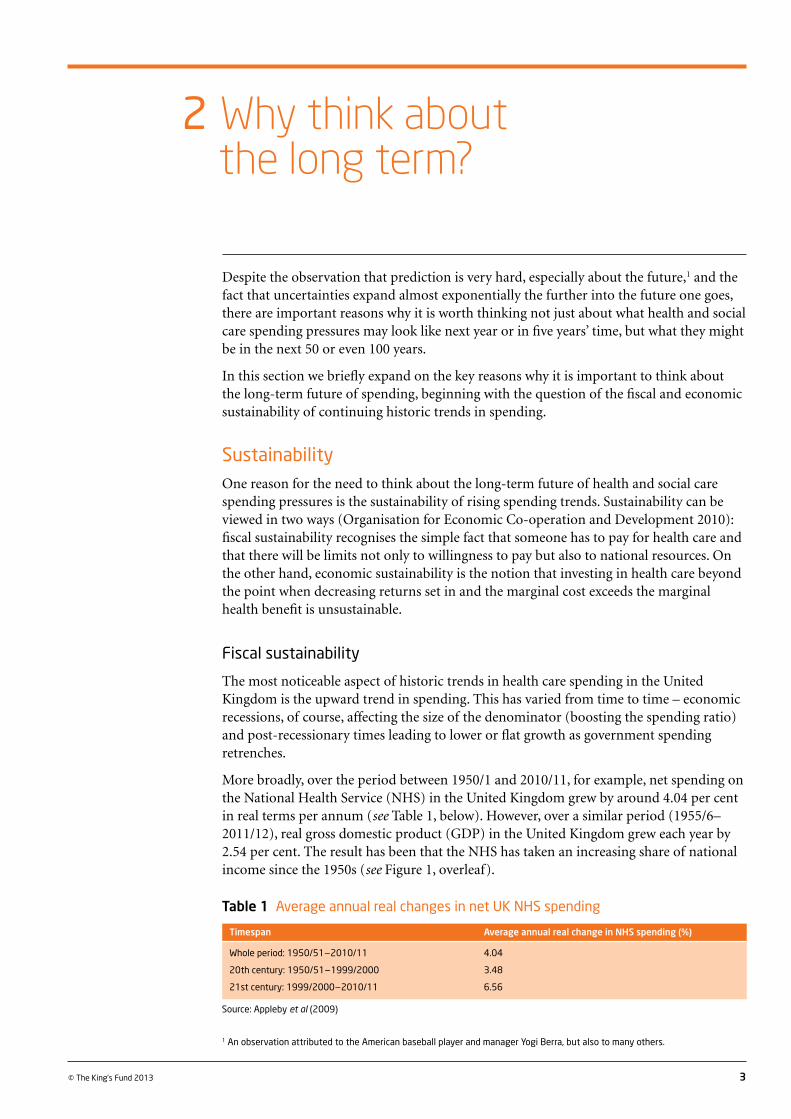
Table 1 Average annual real changes in net UK NHS spending
Timespan Average annual real change in NHS spending (%)
Whole period: 1950/51–2010/11 4.04
20th century: 1950/51–1999/2000 3.48
21st century: 1999/2000–2010/11 6.56
Source: Appleby et al (2009)
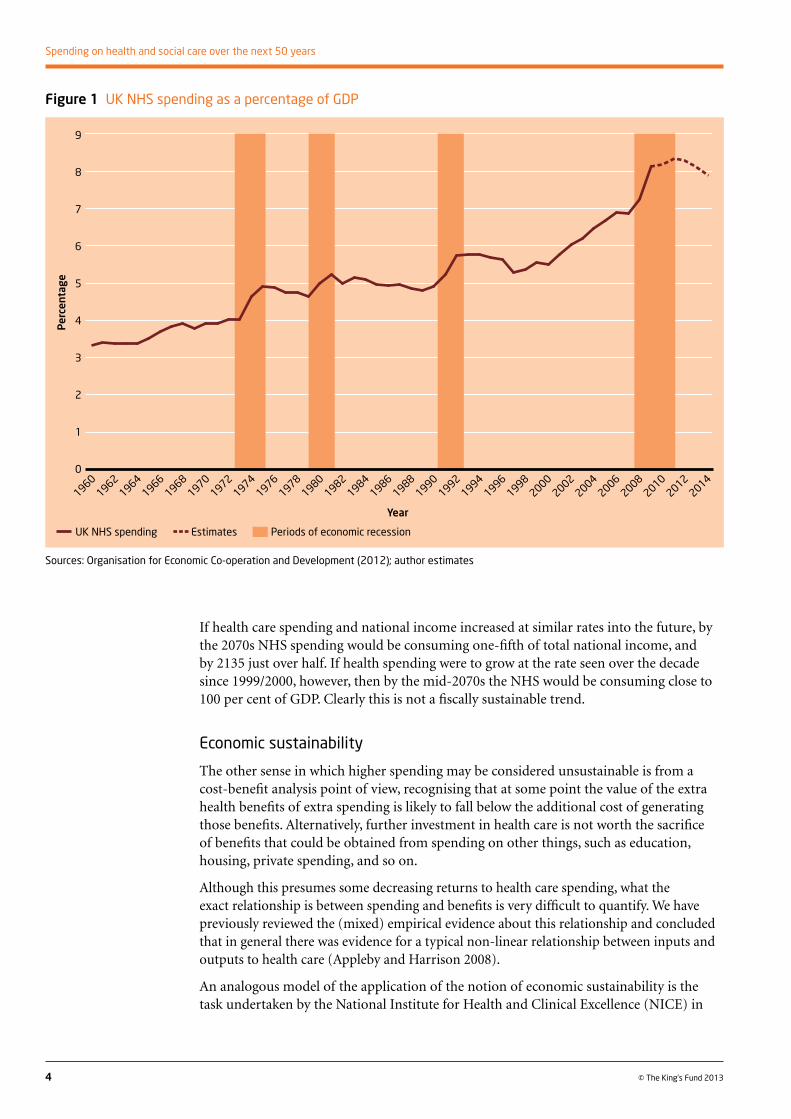
If health care spending and national income increased at similar rates into the future, by the 2070s NHS spending would be consuming one-fifth of total national income, and by 2135 just over half. If health spending were to grow at the rate seen over the decade since 1999/2000, however, then by the mid-2070s the NHS would be consuming close to 100 per cent of GDP. Clearly this is not a fiscally sustainable trend.
Economic sustainability
The other sense in which higher spending may be considered unsustainable is from a cost-benefit analysis point of view, recognising that at some point the value of the extra health benefits of extra spending is likely to fall below the additional cost of generating those benefits. Alternatively, further investment in health care is not worth the sacrifice of benefits that could be obtained from spending on other things, such as education, housing, private spending, and so on.
Although this presumes some decreasing returns to health care spending, what the exact relationship is between spending and benefits is very difficult to quantify. We have previously reviewed the (mixed) empirical evidence about this relationship and concluded that in general there was evidence for a typical non-linear relationship between inputs and outputs to health care (Appleby and Harrison 2008).
An analogous model of the application of the notion of economic sustainability is the task undertaken by the National Institute for Health and Clinical Excellence (NICE) in
4 © The King’s Fund 2013
Spending on health and social care over the next 50 years
Figure 1 UK NHS spending as a percentage of GDP
Sources: Organisation for Economic Co-operation and Development (2012); author estimates
9
8
7
6
5
4
3
2
1
0
19681960
Per
cent
age
19761970
19621972
19641974
19661978
19861980
19821984
19881996
19901992
19941998
20062014
20002008
20022010
20042012
UK NHS spending Estimates Periods of economic recession
Year
its health technology assessment work. However, in order for NICE to be able to reach a decision about whether to recommend a particular technology to the NHS, it must first decide on a value of the cost-effectiveness ratio above which a technology would be deemed not worth investing in. The chosen threshold range of £20,000–30,000 per quality-adjusted life year (QALY) used by NICE could also be used in an aggregate way and applied to marginal increases in the NHS budget as a whole to test for the tipping point where the incremental cost-effectiveness ratio increases above £30,000. In effect, spending increases on the NHS until no intervention or service can be found to give enough value to produce a cost per QALY of less than £30,000.
Leaving aside the huge practical problems of such a task, a more fundamental problem is that the original NICE threshold has little or no theoretical or empirical underpinning. The apparent flexibility of the NICE threshold is evident from the fact that it has remained unchanged in cash terms since 1998; inflation and a much larger NHS budget have effectively halved the real value of the threshold. Establishing a better empirical basis for the threshold is subject to ongoing work (Claxton et al 2012), the thrust of which is to quantify the actual cost per QALY produced by the NHS; any technology that exceeded this would not be deemed value for money as its introduction would crowd out a more cost-effective technology.
Some evidence about the public’s views on the priorities for government spending suggests a degree of trade-off between health and other forms of government spending. For example, a key driver for the political decision to spend significantly more on the NHS over the decade from 1999 was the expressed desire of the public for more of the country’s wealth to be devoted to health care, particularly publicly provided health care paid for from general taxation. The judgement was that the cost of increasing spending on health care was worth forgoing the benefits of spending on other things.
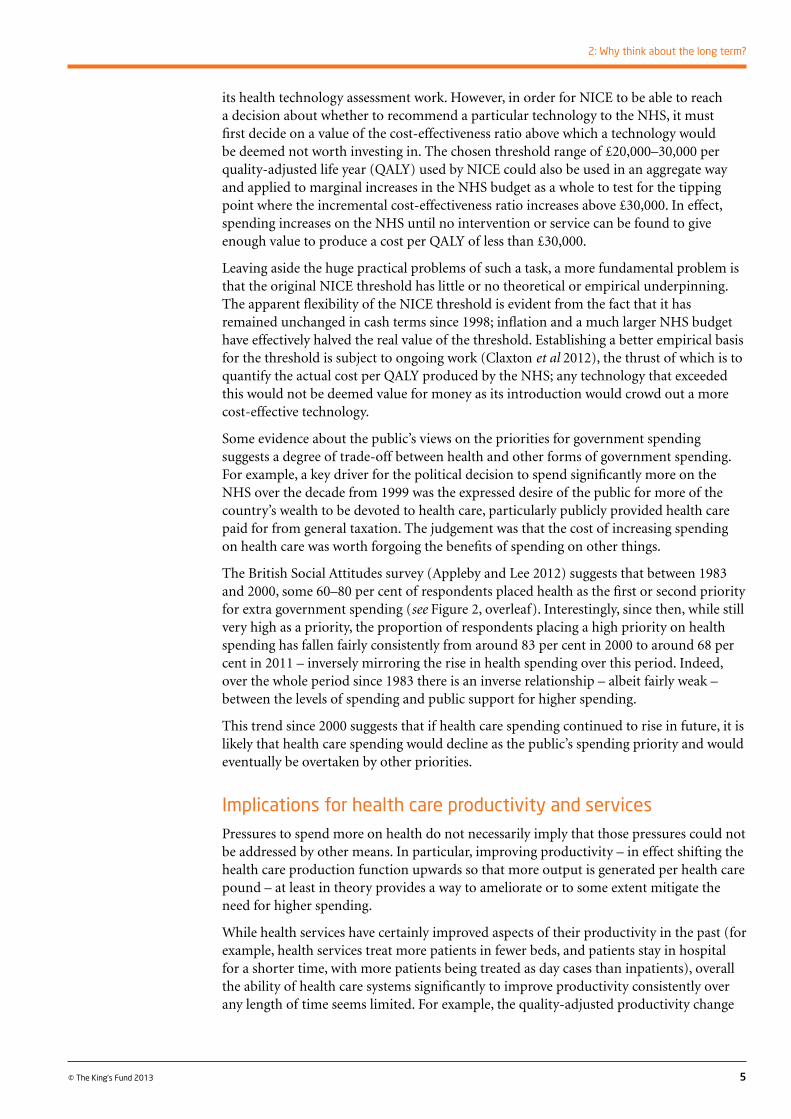
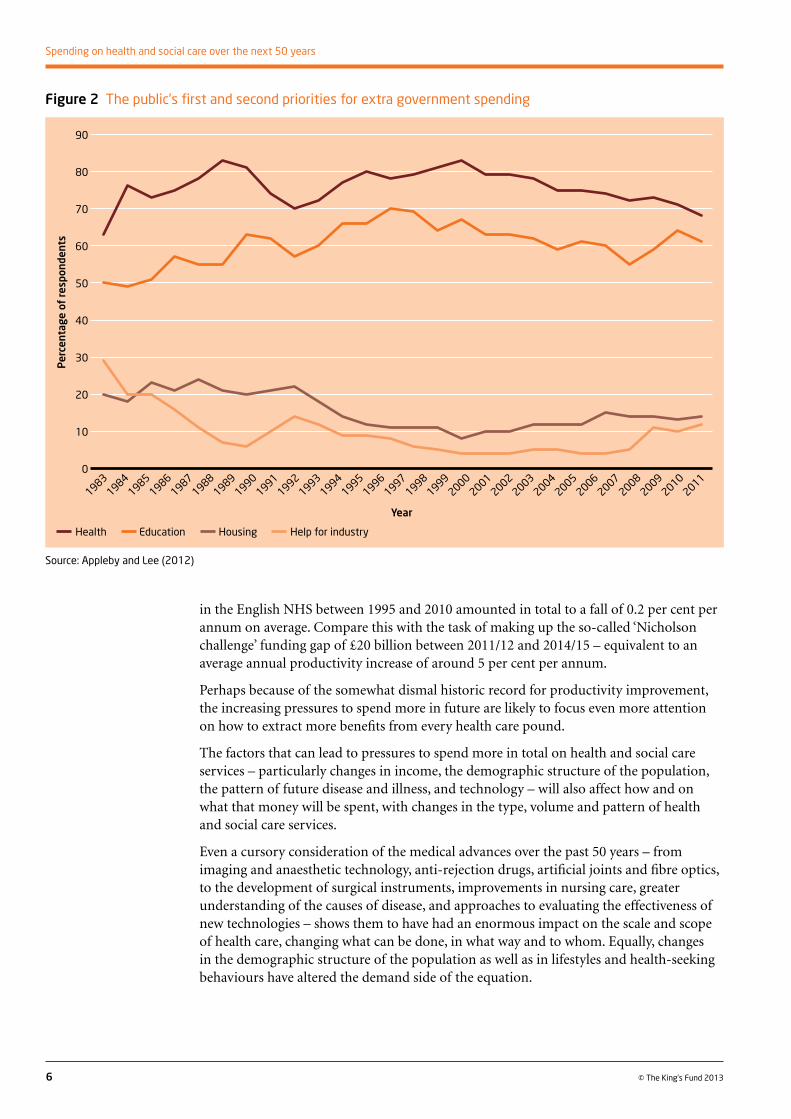
The British Social Attitudes survey (Appleby and Lee 2012) suggests that between 1983 and 2000, some 60–80 per cent of respondents placed health as the first or second priority for extra government spending (see Figure 2, overleaf). Interestingly, since then, while still very high as a priority, the proportion of respondents placing a high priority on health spending has fallen fairly consistently from around 83 per cent in 2000 to around 68 per cent in 2011 – inversely mirroring the rise in health spending over this period. Indeed, over the whole period since 1983 there is an inverse relationship – albeit fairly weak – between the levels of spending and public support for higher spending.
This trend since 2000 suggests that if health care spending continued to rise in future, it is likely that health care spending would decline as the public’s spending priority and would eventually be overtaken by other priorities.
Implications for health care productivity and services Pressures to spend more on health do not necessarily imply that those pressures could not be addressed by other means. In particular, improving productivity – in effect shifting the health care production function upwards so that more output is generated per health care pound – at least in theory provides a way to ameliorate or to some extent mitigate the need for higher spending.
While health services have certainly improved aspects of their productivity in the past (for example, health services treat more patients in fewer beds, and patients stay in hospital for a shorter time, with more patients being treated as day cases than inpatients), overall the ability of health care systems significantly to improve productivity consistently over any length of time seems limited. For example, the quality-adjusted productivity change
5
2: Why think about the long term?
© The King’s Fund 2013
in the English NHS between 1995 and 2010 amounted in total to a fall of 0.2 per cent per annum on average. Compare this with the task of making up the so-called ‘Nicholson challenge’ funding gap of £20 billion between 2011/12 and 2014/15 – equivalent to an average annual productivity increase of around 5 per cent per annum.
Perhaps because of the somewhat dismal historic record for productivity improvement, the increasing pressures to spend more in future are likely to focus even more attention on how to extract more benefits from every health care pound.
The factors that can lead to pressures to spend more in total on health and social care services – particularly changes in income, the demographic structure of the population, the pattern of future disease and illness, and technology – will also affect how and on what that money will be spent, with changes in the type, volume and pattern of health and social care services.
Even a cursory consideration of the medical advances over the past 50 years – from imaging and anaesthetic technology, anti-rejection drugs, artificial joints and fibre optics, to the development of surgical instruments, improvements in nursing care, greater understanding of the causes of disease, and approaches to evaluating the effectiveness of new technologies – shows them to have had an enormous impact on the scale and scope of health care, changing what can be done, in what way and to whom. Equally, changes in the demographic structure of the population as well as in lifestyles and health-seeking behaviours have altered the demand side of the equation.
6 © The King’s Fund 2013
Spending on health and social care over the next 50 years
Figure 2 The public’s first and second priorities for extra government spending
Source: Appleby and Lee (2012)
90
80
70
60
50
40
30
20
10
0
1983
Per
cent
age
of re
spon
dent
s
19871984
19851986
19881992
19891990
19911993
19972006
19942001
19952003
19962005
19982007
20042011
19992008
20002009
20022010
Health Education Housing Help for industry
Year
Wider economic impact of future health spendingChanges in health spending in the future can have significant consequences, not just for other public spending (as noted above), but for government borrowing and the wider economy, too.
For example, in the absence of any policy response (to cut/reprioritise spending and/or increase taxes), the latest projections for health spending to 2061 from the Office for Budget Responsibility (OBR) necessarily imply an increase in government borrowing, with the United Kingdom’s public sector net debt (PSND) increasing from around 66 per cent of GDP in 2012, to between 75 per cent and 233 per cent (with a central projection of 89 per cent) of GDP in 2061, depending on various assumptions about future NHS productivity and population health (Office for Budget Responsibility 2012).
These changes in the PSND arise even with what may appear to be relatively modest increases in health spending: the rise to 75 per cent for the PSND by 2061 implied by the OBR’s central projection is based on health spending of only 9.8 per cent of GDP; and the increase to 233 per cent is based on health spending rising to 15.5 per cent of GDP (Office for Budget Responsibility 2012).
So, the impact of rising health care spending on public sector debt (assuming no other policy action) could be, over future decades, substantial. However, such spending increases and the impact on government debt could also impact on the wider economy. As the OBR points out, running large fiscal deficits for long periods could reduce national savings, raise interest rates and ‘crowd out’ investment, leading to lower levels of output in the economy.
ConclusionsA continually rising trend in spending that threatens to be fiscally or economically unsustainable, or that threatens big cuts in other non-health care spending or an increase in borrowing, for example, is therefore not an inevitability. It depends on decisions taken by individuals, health care systems and politicians. However, the key point is that choices need to be made about future spending, and those choices must be informed both by knowledge about the sorts of future pressures that will bear on the need for spending, and by an understanding of the consequences and ramifications of the policy choices available.
Before describing the international experience and modelling work that has been carried out to investigate future possible spending for health and social care, the next section summarises some of the empirical evidence on the factors that drive changes in spending and that inform most projection analyses.
7
2: Why think about the long term?
© The King’s Fund 2013
8 © The King’s Fund 2013
In a (not altogether) trivial way, changes in spending on health and social care are driven largely by the choices of consumers of and payers for these services – individuals and notably governments. But what influences those choices? And, in particular, what influences the choice to spend not just more, but an increasing proportion, of a nation’s income?
In a recent comparative review of methods of projecting future health and social care spending in various Organisation for Economic Co-operation and Development (OECD) countries, Astolfi et al (2012) identify seven factors that are commonly used in models to project spending:
n demographic factors and health status
n income
n consumer/patient behaviours
n treatment practices
n technological progress
n health prices and productivity
n health care system organisation.
Different factors influence health and social or long-term care spending, of course. The latter is less influenced by technological changes, for example, and is more dependent on the level of informal care available.
Smith et al (2000) reported that two attempts to estimate the contribution made by various factors to the growth in US health care spending between 1940 and 1990 suggest that demographic factors are probably relatively insignificant.
The low importance attached to demographic factors runs counter to what has often been assumed. The average age of the population has been rising in most countries, and health spending rises with age, particularly towards the very end of life. However, a number of studies have found that, as the general level of health of the population has increased, the number of years of healthy life have been extended and the average age at death has risen, thus postponing most of the costs associated with dying.
For example, Seshamani and Gray (2004) found that proximity to death explained most of the increase in health spending at the end of life. The rest was due to age. Dixon et al (2004) found that the average number of bed days spent in hospital in the period before death does not increase with increasing age. Other work (Canadian Health Service Research Foundation 2003) suggests that the older the age at which people die, the lower health care costs tend to be, although their social care costs may be higher.
A further age-related factor for the United Kingdom and other ‘baby boom’ countries is the fact that over the next 30 or so years this generational bulge will start to contribute significantly to the overall death rate and to death-related health and social care costs.
What drives changes in health and social care spending?
3
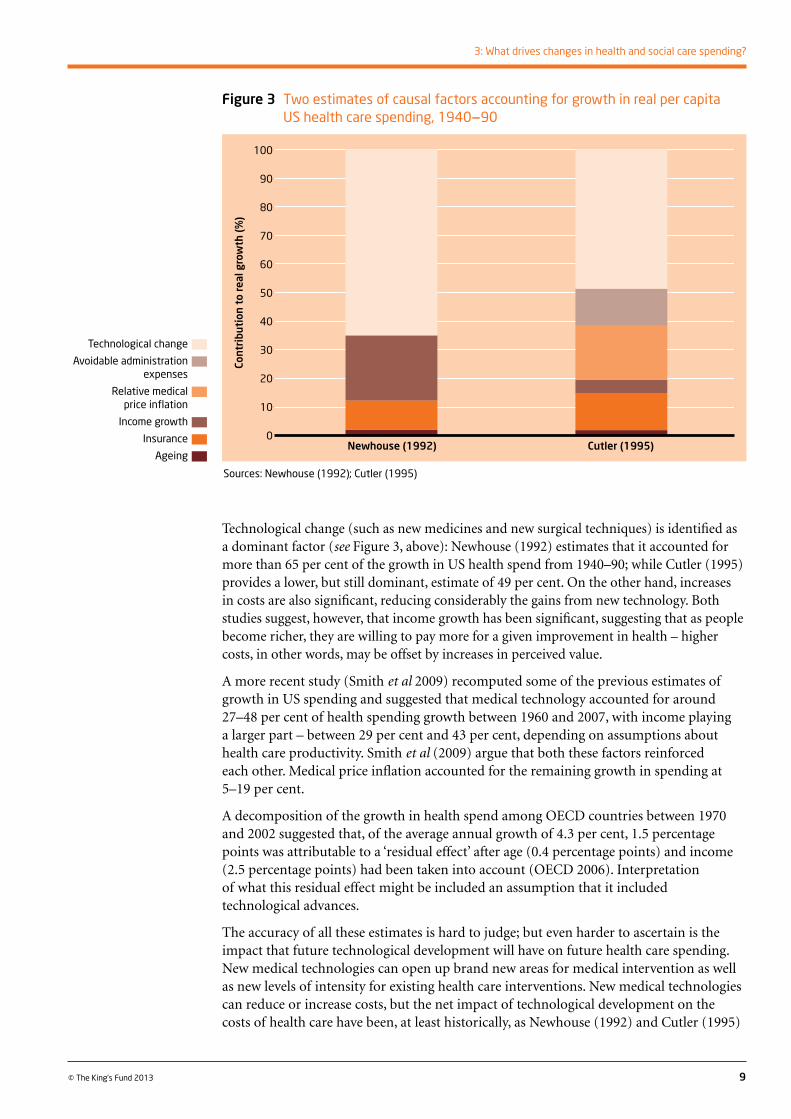
Technological change (such as new medicines and new surgical techniques) is identified as a dominant factor (see Figure 3, above): Newhouse (1992) estimates that it accounted for more than 65 per cent of the growth in US health spend from 1940–90; while Cutler (1995) provides a lower, but still dominant, estimate of 49 per cent. On the other hand, increases in costs are also significant, reducing considerably the gains from new technology. Both studies suggest, however, that income growth has been significant, suggesting that as people become richer, they are willing to pay more for a given improvement in health – higher costs, in other words, may be offset by increases in perceived value.
A more recent study (Smith et al 2009) recomputed some of the previous estimates of growth in US spending and suggested that medical technology accounted for around 27–48 per cent of health spending growth between 1960 and 2007, with income playing a larger part – between 29 per cent and 43 per cent, depending on assumptions about health care productivity. Smith et al (2009) argue that both these factors reinforced each other. Medical price inflation accounted for the remaining growth in spending at 5–19 per cent.
A decomposition of the growth in health spend among OECD countries between 1970 and 2002 suggested that, of the average annual growth of 4.3 per cent, 1.5 percentage points was attributable to a ‘residual effect’ after age (0.4 percentage points) and income (2.5 percentage points) had been taken into account (OECD 2006). Interpretation of what this residual effect might be included an assumption that it included technological advances.
The accuracy of all these estimates is hard to judge; but even harder to ascertain is the impact that future technological development will have on future health care spending. New medical technologies can open up brand new areas for medical intervention as well as new levels of intensity for existing health care interventions. New medical technologies can reduce or increase costs, but the net impact of technological development on the costs of health care have been, at least historically, as Newhouse (1992) and Cutler (1995)
9
3: What drives changes in health and social care spending?
© The King’s Fund 2013
Figure 3 Two estimates of causal factors accounting for growth in real per capita US health care spending, 1940–90
Cont
ribu
tion
to
real
gro
wth
(%)
Sources: Newhouse (1992); Cutler (1995)
100
90
80
70
60
50
40
30
20
10
0 Newhouse (1992) Cutler (1995)
Technological change
Avoidable administration expenses
Relative medical price inflation
Income growth
Insurance
Ageing
suggest, not only positive, but the major driver for increased health care spending. Smith et al (2009) conclude:
Income growth will continue to drive a rising health share of [gross domestic product] in decades to come, as spending on new medical technologies continues to increase more rapidly than incomes… [However] …Ultimately, this effect must diminish as the opportunity cost of additional growth in health spending rises – exacting a growing trade-off in the forgone consumption of all other goods and services.
As Astolfi et al (2012) note, the way health care systems are organised and funded will also, in part, explain differences in spending between countries and, possibly, future spending paths. For example, systems based on tax funding and a more centralised organisation of services (such as the National Health Service [NHS] in the United Kingdom) will tend to have stronger levers of control over total funding than more diffuse insurance-based systems (such as that used in France). The former are likely to spend less than the latter.
Health care’s ‘cost disease’A famous explanation of why health care costs (and by implication, spending) have risen inexorably over time was proposed by Baumol and Bowen in 1966 (Baumol and Bowen 1966), and elaborated on in Baumol et al 2012. They noted that in Beethoven’s time it took four musicians to play a piece of music written by Beethoven for a string quartet, and that it still takes only four musicians to do this – but that the real pay of those musicians would now be considerably higher than it was in Beethoven’s time. The productivity of string quartets inevitably falls over time it would seem: they suffer from a ‘cost disease’ – a situation in which, finding it difficult if not impossible to increase their productivity, they nevertheless find that they are able to command higher wages as employers compete for musicians who would otherwise take jobs in higher paid industries, industries that are able to pay more because of their ability to improve labour productivity.
Baumol and Bowen extended the observation to other labour-intensive industries, particularly health care, where, they suggested, a similar labour productivity/cost problem existed, with the consequence that, over time (and as real wages rose in the wider economy more or less in line with increasing productivity), health care costs would also rise despite a lack of similar increases in productivity (Baumol and Bowen 1966).
Although official aggregate measures of NHS productivity (see Figure 30, p 47) have shown virtually no improvement over many years, there have clearly been improvements in some more disaggregated measures – such as the number of patients treated per bed. However, at a system level it appears that such gains are offset in other ways – rising unit costs, for example, or greater treatment intensity per patient.
The long-term implications of Baumol and Bowen’s cost disease problem for health care is the double disadvantage of increases in its largest cost – labour – and little or limited offsetting improvements in productivity, while, as a consequence, real health spending will tend to rise at a slower rate than nominal spending as the relative price of health care rises.
Although NHS pay inflation has generally matched pay inflation in the economy as a whole, evidence of the Baumol and Bowen effect in terms of nominal and real spending as a proportion of GDP is, as the Office for Budget Responsibility observed (2012), less clear cut. Over the 14 years between 1986 and 2000, real and nominal spending moved more or less together. Since 2000, however, nominal spending has risen at a faster rate than real spending. Whether it will continue this ‘Baumol trend’ remains to be seen.
10 © The King’s Fund 2013
Spending on health and social care over the next 50 years
ConclusionsAnalysis of the causes of changes in historic trends in health and social care spending have shown that there are both demand and supply drivers. On the demand side, increases in population size overall and the proportion of high users of care – such as older people – have led to increased spending in all developed countries. However, the impact on the demand for (and hence spending on) care (including social or long-term care) is also affected by the health status of populations – particularly older people – and in the case of social care, changes in the number of informal carers over time.
The exact impact of the ageing of populations is complicated, but tends to be less important than the health care costs associated with death. Increases in life expectancy simply delay the time to increased demand and hence costs for both health and social care. A particular aspect of ageing for the United Kingdom over the next few decades, however, is the ageing of the baby-boom generation, which will see mortality increase and hence increases in death-related costs.
Other demand drivers include changes in countries’ incomes (gross domestic product) and changes in the lifestyle behaviours of the public (for example, rates of smoking and dietary habits).
However, one key set of factors that have driven changes in health care spending in the past – and are presumed to do so in the future – relate to the supply of health care. Treatment practices, the invention of new drugs, and developments in equipment and surgical techniques have not only expanded the range and scope of what is possible in health care, but have also led to higher spending. Furthermore, higher spending has been a consequence simply of higher health and social care input costs relative to the rest of the economy – Baumol’s ‘cost disease’.
The exact contribution of all these demand and supply factors on health and social care spending is hard to determine. However, much research has identified technology (often rather broadly defined) and income as accounting for the bulk of changes in spending, with age and population changes being of less importance.
11
3: What drives changes in health and social care spending?
© The King’s Fund 2013
12 © The King’s Fund 2013
The United Kingdom is, of course, not alone in facing decisions about future health and social care spending. This section therefore presents analyses of future spending from other countries and pan-national organisations such as the European Union (EU) and the Organisation for Economic Co-operation and Development (OECD) as they, too, grapple with such choices.
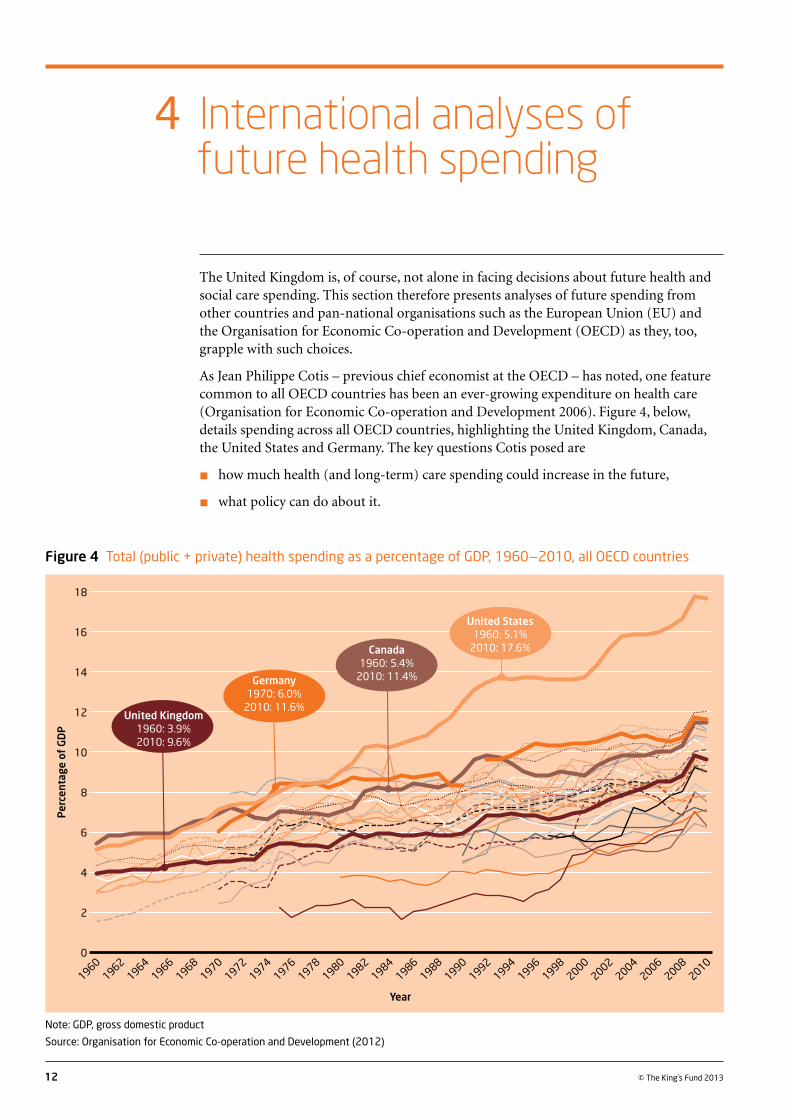
As Jean Philippe Cotis – previous chief economist at the OECD – has noted, one feature common to all OECD countries has been an ever-growing expenditure on health care (Organisation for Economic Co-operation and Development 2006). Figure 4, below, details spending across all OECD countries, highlighting the United Kingdom, Canada, the United States and Germany. The key questions Cotis posed are
n how much health (and long-term) care spending could increase in the future,
n what policy can do about it.
International analyses of future health spending
4
Figure 4 Total (public + private) health spending as a percentage of GDP, 1960–2010, all OECD countries
Note: GDP, gross domestic product
Source: Organisation for Economic Co-operation and Development (2012)
18
16
14
12
10
8
6
4
2
0
1960
Per
cent
age
of G
DP
19681962
19641966
19701978
19721974
19761980
20001988
20081982
20021984
20041986
20061990
20101998
19921994
1996
Year
United Kingdom1960: 3.9%2010: 9.6%
Germany1970: 6.0%
2010: 11.6%
United States1960: 5.1%
2010: 17.6%Canada1960: 5.4%
2010: 11.4%
Apart from work carried out by organisations such as the OECD and the EU examining future trends in health spending, many individual countries have engaged in regular or ad hoc forecasting as part of their government policy-making process.
In this section we provide some answers to Cotis’s first question – how much health and long-term care spending should increase in the future – using work from the OECD, the EU and the management consultancy McKinsey & Co, before focusing on eight studies in five countries (the United States, Denmark, Switzerland, Australia and Sweden).
The box, overleaf, sets out some background on the different general approaches adopted by different projection analyses, and some of the empirical evidence for those factors that, historically at least, have been found to drive changes in health spending, and form the underlying factors used in virtually all the projection analyses described here.
Multi-country spending projections
Projecting future health care expenditure at the European level: the European Commission
In 2010, the European Commission (an executive body of the EU) published a review of future health care public spending across EU countries, setting out to assess the demography-related risks facing public finances in the EU up to 2060 in order to establish adequate policy responses to demographic, social and economic developments (Przywara 2010).
The component-based projection model incorporated key drivers of health care spending – from the size, age structure and health care status of populations, to income, technology and relative price effects in the health care sector.
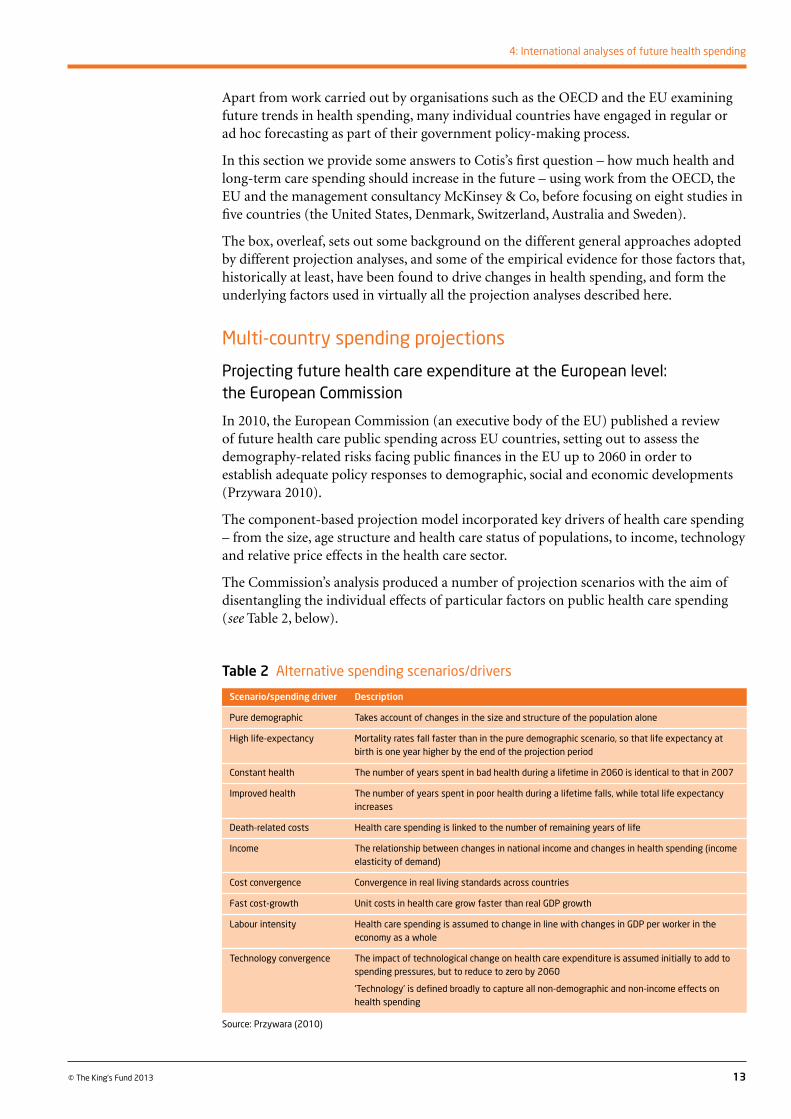
The Commission’s analysis produced a number of projection scenarios with the aim of disentangling the individual effects of particular factors on public health care spending (see Table 2, below).
13
4: International analyses of future health spending
© The King’s Fund 2013
Table 2 Alternative spending scenarios/drivers
Scenario/spending driver Description
Pure demographic Takes account of changes in the size and structure of the population alone
High life-expectancy Mortality rates fall faster than in the pure demographic scenario, so that life expectancy at birth is one year higher by the end of the projection period
Constant health The number of years spent in bad health during a lifetime in 2060 is identical to that in 2007
Improved health The number of years spent in poor health during a lifetime falls, while total life expectancy increases
Death-related costs Health care spending is linked to the number of remaining years of life
Income The relationship between changes in national income and changes in health spending (income elasticity of demand)
Cost convergence Convergence in real living standards across countries
Fast cost-growth Unit costs in health care grow faster than real GDP growth
Labour intensity Health care spending is assumed to change in line with changes in GDP per worker in the economy as a whole
Technology convergence The impact of technological change on health care expenditure is assumed initially to add to spending pressures, but to reduce to zero by 2060
‘Technology’ is defined broadly to capture all non-demographic and non-income effects on health spending
Source: Przywara (2010)
14 © The King’s Fund 2013
Spending on health and social care over the next 50 years
A guide to projecting the future
In a review of approaches to projecting and forecasting health care spending, researchers from the OECD (Astolfi et al 2012) identified three basic projection methods.
n micro-simulation models
n component-based models
n macro-level models.
Micro-simulation models
These usually take individual people as the unit of analysis, aggregating along various dimensions of characteristics (age, gender, geography, and so on) where desired and simulating behaviours to, for example, reflect the process of ageing. Such models can be used to project total spending on health care, but more often they are used to model the process and outcome of detailed policy options within health care. For example, Astolfi et al (2012) report on a dynamic micro-simulation model developed by Statistics Canada to assess the impact on acute and home care costs of an outpatient/early discharge strategy for breast cancer surgery patients.
As might be expected, micro-simulation models require a significant amount of data at very detailed levels as well as a sophisticated, quantified understanding of individuals’ behaviours and reactions to the policy variables being analysed.
Component-based models
These cover a range of approaches to projecting spending with different components of the model using different ways of projecting elements of spending. For example, cell-based or cohort-based models may split up a population by age, gender, health status, etc, and then multiply the unit costs associated with these ‘cohorts’ or ‘cells’ by the projected number of individuals in each cell to arrive at an aggregated spending level.
Macro-level models
These focus on aggregate health spending only, and typically involve the fitting of a regression line to historic spending trends and then extrapolating this into future years. Such projections may be reasonably accurate in the short term, but much less certain in the longer term.
Computable general equilibrium (CGE) models also adopt an aggregate point of view but attempt to measure the broader impacts (and feedbacks) across whole economies of changes in health/social care spending. The CMS Dynamic Computable General Equilibrium model, for example, splits the US economy into health and non-health care markets and models aggregate demand and supply in these markets on the basis of assumptions about the maximising habits of providers and consumers. Although heavily dependent on the assumptions adopted and specifications of the equations detailing the relationships between variables, dynamic CGE models can provide a fuller view of the interactive implications of future health and social care spending.
Although these separate scenarios focus on the individual impacts on spending of different factors, actual spending will of course be shaped by the combined and interrelated impacts of all these (and possibly other) factors. Ideally, it would therefore be useful to analyse all these factors together in one model. However, data limitations mean that the Commission’s overall model combines just three factors:
n demography: the ‘pure’ demographic impact of the ageing population
n morbidity: half of the extra years of life gained through higher life-expectancy are spent in good health (neutral assumption on the evolution of health status)
n income: income elasticity reducing to unity in 2060 from 1.1 in 2007.
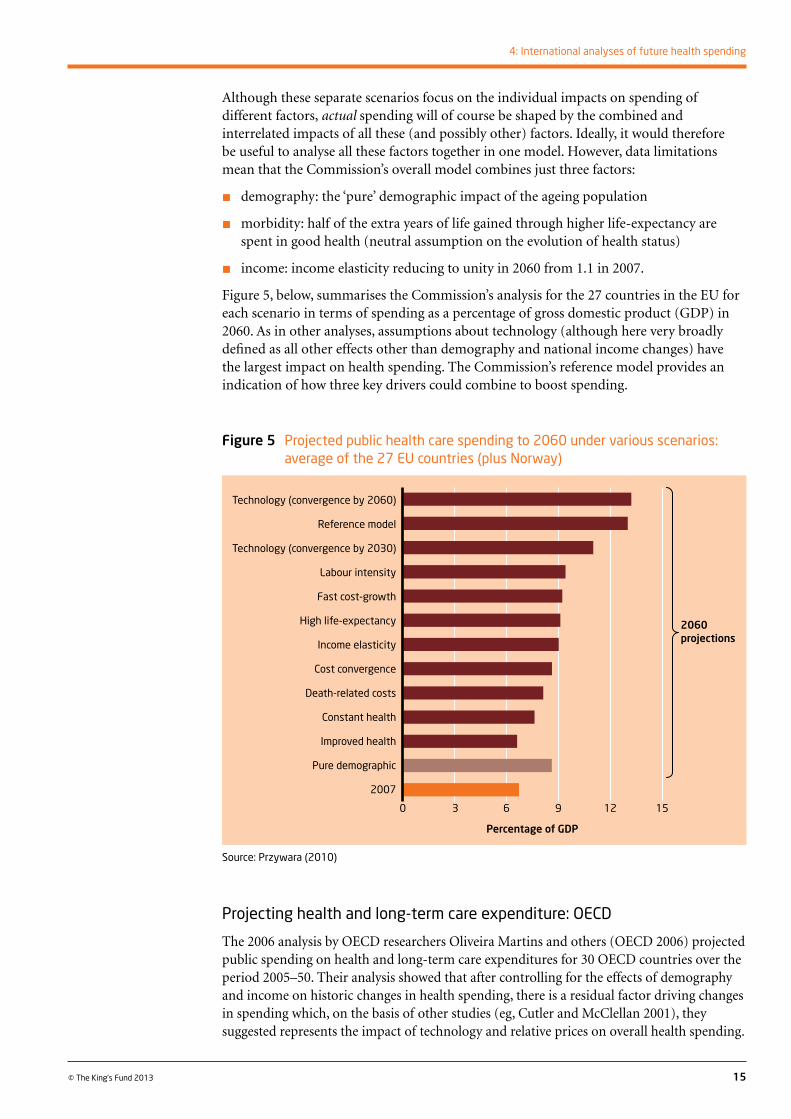
Figure 5, below, summarises the Commission’s analysis for the 27 countries in the EU for each scenario in terms of spending as a percentage of gross domestic product (GDP) in 2060. As in other analyses, assumptions about technology (although here very broadly defined as all other effects other than demography and national income changes) have the largest impact on health spending. The Commission’s reference model provides an indication of how three key drivers could combine to boost spending.
15
4: International analyses of future health spending
© The King’s Fund 2013
Figure 5 Projected public health care spending to 2060 under various scenarios: average of the 27 EU countries (plus Norway)
Source: Przywara (2010)
Percentage of GDP
0 3 6 9 12 15
Projecting health and long-term care expenditure: OECD
The 2006 analysis by OECD researchers Oliveira Martins and others (OECD 2006) projected public spending on health and long-term care expenditures for 30 OECD countries over the period 2005–50. Their analysis showed that after controlling for the effects of demography and income on historic changes in health spending, there is a residual factor driving changes in spending which, on the basis of other studies (eg, Cutler and McClellan 2001), they suggested represents the impact of technology and relative prices on overall health spending.
Technology (convergence by 2060)
Reference model
Technology (convergence by 2030)
Labour intensity
Fast cost-growth
High life-expectancy
Income elasticity
Cost convergence
Death-related costs
Constant health
Improved health
Pure demographic
2007
2060 projections
Of the 3.6 per cent average annual growth in health spending across the OECD between 1981 and 2002, they estimated that 0.3 percentage points was due to demographic change, 2.3 percentage points to increases in national incomes, and around 1 percentage point to the residual technology and relative price effects.
For health care spending, two scenarios were modelled from a component/cohort approach and involved different assumptions about the size of this residual factor in future years:
n cost pressure: here it was assumed that the residual effect – increases in spending attributable to technology and relative price effects – would continue at the historic rate of around 1 per cent per annum
n cost containment: in this scenario it was assumed that the residual cost pressure would start off at the historic rate of 1 per cent and taper off to zero by the end of the projection period.
Both scenarios included the effects of changes in demography and national income, with assumptions that included ‘healthy ageing’, in which gains in life expectancy are lived in good health, and that health spending would change at the same rate as income (ie, income elasticity = 1). The analysis also separated out a ‘demographic effect’ as a separate comparable projection.
A sensitivity analysis provided an idea of the propensity of the spending estimates to vary given changes in the assumptions about changes in the effects of income, technology and relative prices, as well as expectations about the future morbidity of populations.
For projections of long-term care spending, a similar framework was used, but with different factors driving changes in spending:
n cost pressure: here it was assumed that future populations would become less dependent over time, but that long-term care costs per dependant would increase in line with average labour productivity (the Baumol and Bowen effect, see Section 3, pp 10–11); that workforce participation rates for those aged 50–64 would increase in line with baseline labour-force projections (this acts as a proxy for the level of informal care available); and that income would have no impact on future spending
n cost containment: this was similar to the cost-pressure scenario except that the Baumol and Bowen effect was assumed to be half that in the cost-pressure scenario.
As with the health spending projections, a separate demographic effect was also modelled, and different factors were varied in a sensitivity analysis, introducing, for example, an assumption that long-term care spending rises in line with an increase in income, or that future populations could be more/less dependent than had been assumed in the cost-pressure and cost-containment scenarios, or that labour-force participation rates among 50–64-year-olds would be high, reducing the informal care available and therefore increasing the need to spend more public money on care.
The results of these projections suggested that, on average, in OECD countries government spending on health care could rise from around 5.7 per cent in 2005 to between 6.3 per cent and 9.6 per cent, depending on the assumptions made in the models (see Figure 6, opposite).
As in other analyses, the impact of demographic change was relatively small, adding 0.6 per cent of GDP to health spending on average across the OECD by 2050. The effect of demographic change alone varied from country to country – from virtually zero in Sweden to 1.6 per cent of GDP in Korea – reflecting variation in the stages different countries have reached in the ageing of their populations. Non-demographic factors (including effects from technology and relative prices) were the most important drivers of the increase in health care expenditure.
16 © The King’s Fund 2013
Spending on health and social care over the next 50 years
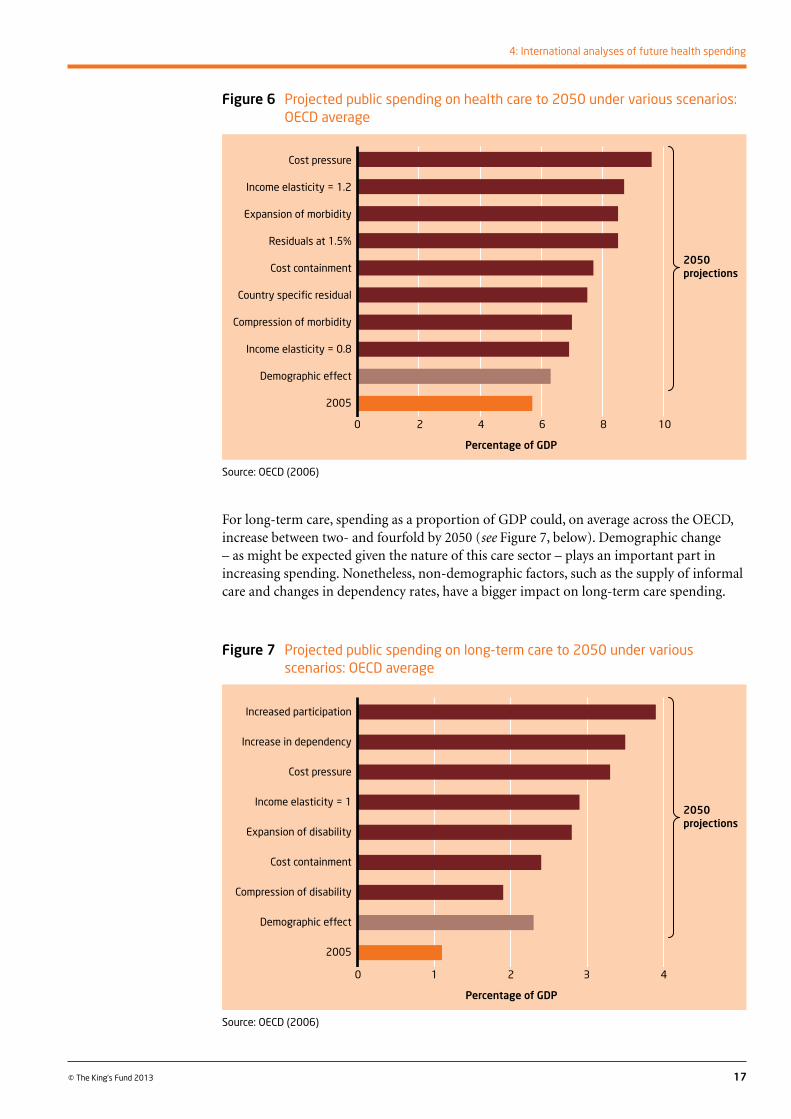
For long-term care, spending as a proportion of GDP could, on average across the OECD, increase between two- and fourfold by 2050 (see Figure 7, below). Demographic change – as might be expected given the nature of this care sector – plays an important part in increasing spending. Nonetheless, non-demographic factors, such as the supply of informal care and changes in dependency rates, have a bigger impact on long-term care spending.
17
4: International analyses of future health spending
© The King’s Fund 2013
Figure 6 Projected public spending on health care to 2050 under various scenarios: OECD average
Figure 7 Projected public spending on long-term care to 2050 under various scenarios: OECD average
Source: OECD (2006)
Percentage of GDP
0 2 4 6 8 10
Cost pressure
Income elasticity = 1.2
Expansion of morbidity
Residuals at 1.5%
Cost containment
Country specific residual
Compression of morbidity
Income elasticity = 0.8
Demographic effect
2005
2050 projections
Source: OECD (2006)
Percentage of GDP
0 1 2 3 4
Increased participation
Increase in dependency
Cost pressure
Income elasticity = 1
Expansion of disability
Cost containment
Compression of disability
Demographic effect
2005
2050 projections
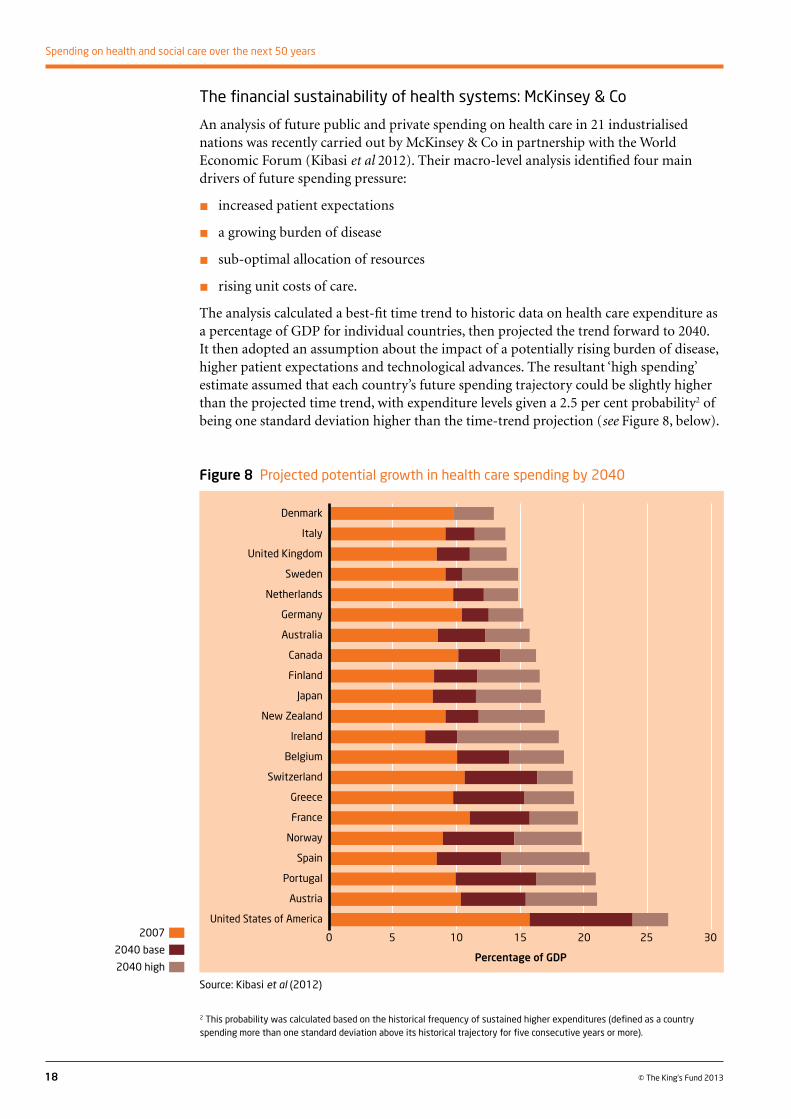
The financial sustainability of health systems: McKinsey & Co
An analysis of future public and private spending on health care in 21 industrialised nations was recently carried out by McKinsey & Co in partnership with the World Economic Forum (Kibasi et al 2012). Their macro-level analysis identified four main drivers of future spending pressure:
n increased patient expectations
n a growing burden of disease
n sub-optimal allocation of resources
n rising unit costs of care.
The analysis calculated a best-fit time trend to historic data on health care expenditure as a percentage of GDP for individual countries, then projected the trend forward to 2040. It then adopted an assumption about the impact of a potentially rising burden of disease, higher patient expectations and technological advances. The resultant ‘high spending’ estimate assumed that each country’s future spending trajectory could be slightly higher than the projected time trend, with expenditure levels given a 2.5 per cent probability2 of being one standard deviation higher than the time-trend projection (see Figure 8, below).
18 © The King’s Fund 2013
Spending on health and social care over the next 50 years
Figure 8 Projected potential growth in health care spending by 2040
Source: Kibasi et al (2012)
2007
2040 base
2040 high
2 This probability was calculated based on the historical frequency of sustained higher expenditures (defined as a country spending more than one standard deviation above its historical trajectory for five consecutive years or more).
Percentage of GDP
0 5 10 15 20 25 30
Denmark
Italy
United Kingdom
Sweden
Netherlands
Germany
Australia
Canada
Finland
Japan
New Zealand
Ireland
Belgium
Switzerland
Greece
France
Norway
Spain
Portugal
Austria
United States of America
The McKinsey & Co analysis offered two main approaches for dealing with rising spending pressures:
n doing less: for example, by rationing access to care, imposing budgets and allowing waiting times to rise; or shifting the financial burden to employers or households
n doing more: by, for example, increasing financing for health through taxation; or by boosting the budget by prioritising health care over other public expenditure.
Single country spending forecasts
The United States: 1
The US Congressional Budget Office3 (CBO) carries out regular analyses of health care spending including assessments of the costs of new legislation, as well as long-term projections of state and federal health spending (that is, Medicaid, Medicare and other government-funded health care schemes) and, with less sophistication, all other health care spending.
The CBO states that the exercise is not intended to provide a prediction of future spending because a key assumption is that the projections are made ‘under current law’ – that is, assuming no change in policy – whereas, in fact, there clearly will be changes in policy that will alter the outcome from the CBO’s projections. Instead, the CBO’s spending projections are intended to inform policy-makers and the public about ‘the scope of the problem [rising health care expenditure] facing the nation under current law’ so as to help enlighten future changes to policy.
The CBO’s analysis published in 2007 (Congressional Budget Office 2007), for example, details projections of federal spending on Medicare, Medicaid and national spending on health care over a 75-year period to 2082 using a combined component-based micro-simulation model approach.
The methodological approach adopted in making the projections calculates change attributable to rising prices and population changes, with the remainder treated as ‘excess growth’ – estimated historically to be between 2.0 per cent and 2.4 per cent per annum depending on the medical programme. The term ‘excess cost’ is not intended pejoratively, but rather in the sense that it is the change in per capita spending on health that is over and above the per capita growth in national income (GDP).
Together with projections on population size, ageing, and growth in GDP, the CBO estimates future spending paths for Medicaid, Medicare and all other health spending into the future. In line with other such studies, the impact of ageing is estimated to be relatively minor, cumulatively accounting for around 9 per cent of the growth in Medicaid and Medicare spending up to 2082, with excess costs accounting for 91 per cent.
A crucial set of assumptions about excess cost growth have to be made in order to avoid the obvious problem of projecting spending in excess of 100 per cent of GDP, however. Assumptions include the ‘automatic stabiliser’ effect noted by Smith et al (2009) – that is, that rising spending would, to an extent, be slowed as the opportunity cost of that spending (the value of the forgone benefits on non-health care consumption) increased, with the public being increasingly unwilling to make such sacrifices for additional health care. Furthermore, even though projections are carried out ‘under current law’, it is assumed that even under current law there would be some changes that, again, to some extent, would limit rising costs.
19
4: International analyses of future health spending
© The King’s Fund 2013
3 The Congressional Budget Office was set up in 1974 to produce independent, non-partisan analysis of economic and budgetary issues to support the Congressional budget process.
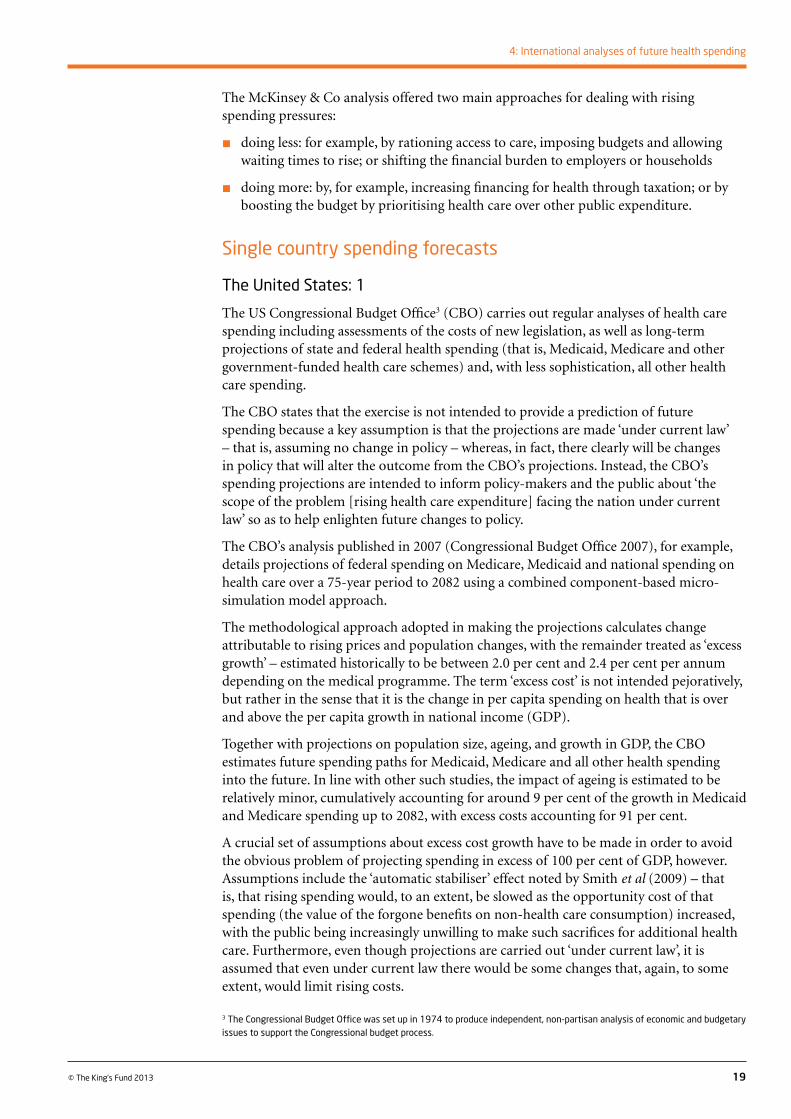
Assuming no change to the historic rate of excess costs, the CBO’s projections estimate that health care spending will absorb around 33.3 per cent in 2035, compared with 15.5 per cent in 2007. Thereafter, health care costs will continue to account for a steadily growing share of GDP, reaching 98.9 per cent by 2082 – leaving just 1.1 per cent of the American economy to be spent on everything else (see Figure 9, below).
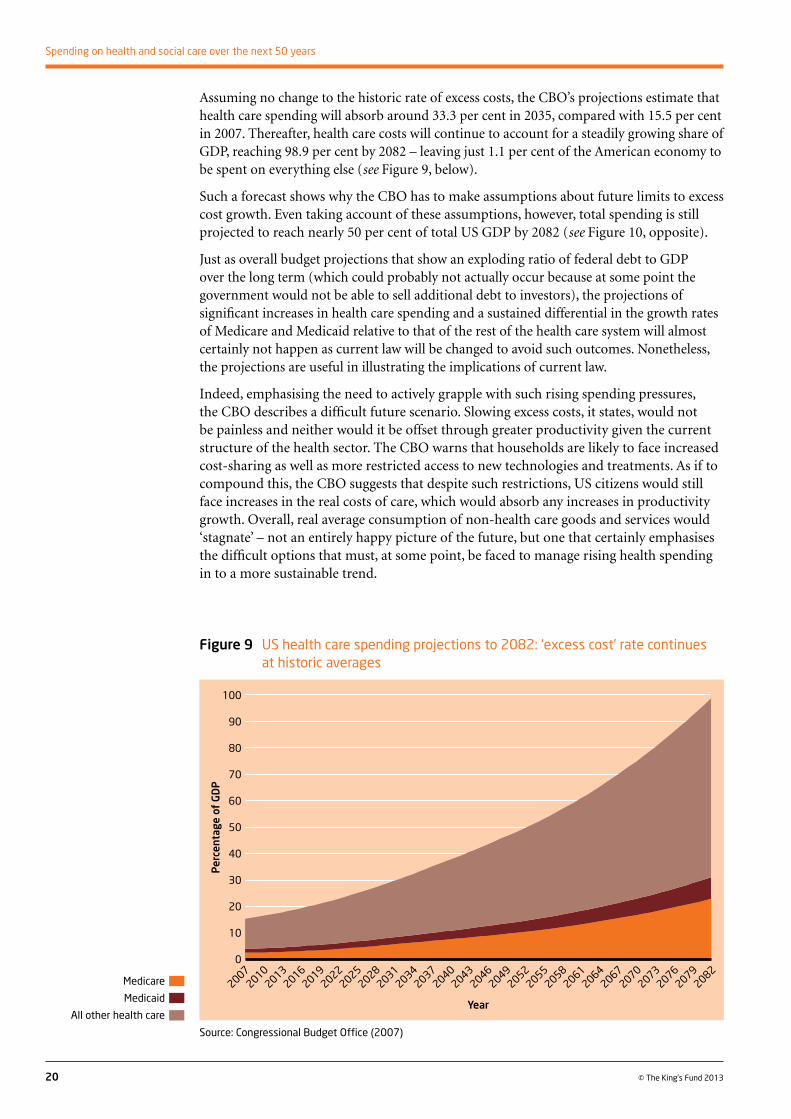
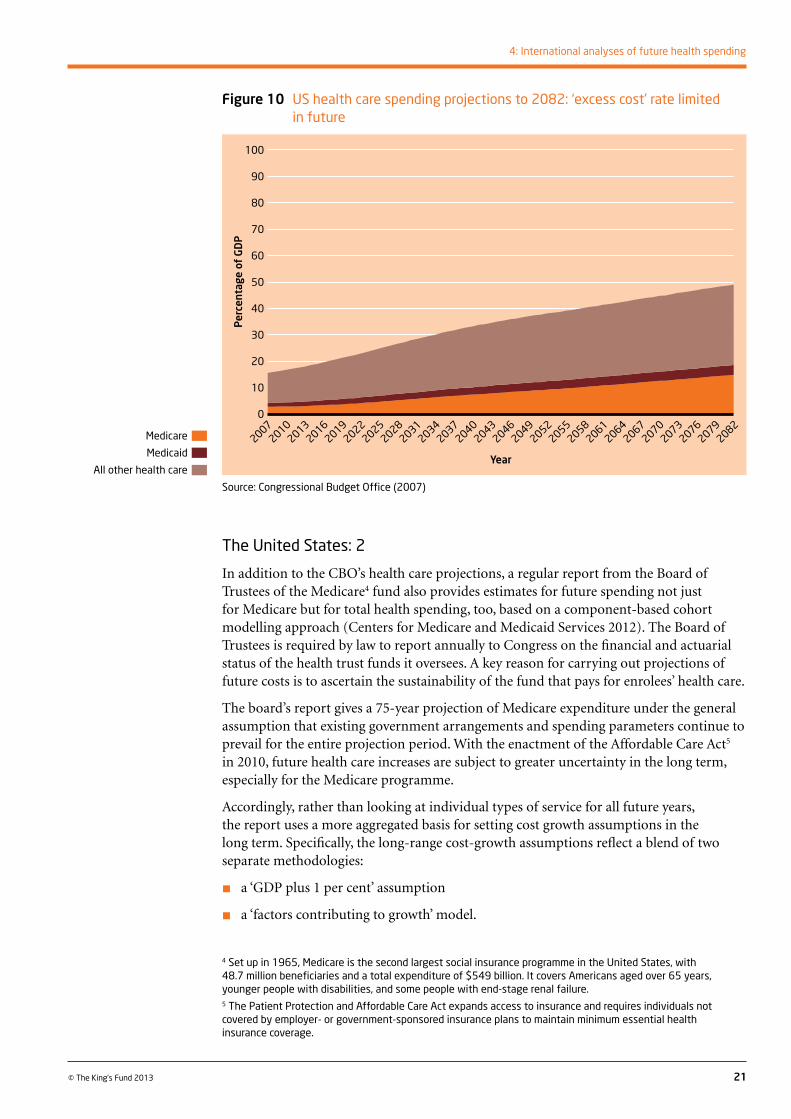
Such a forecast shows why the CBO has to make assumptions about future limits to excess cost growth. Even taking account of these assumptions, however, total spending is still projected to reach nearly 50 per cent of total US GDP by 2082 (see Figure 10, opposite).
Just as overall budget projections that show an exploding ratio of federal debt to GDP over the long term (which could probably not actually occur because at some point the government would not be able to sell additional debt to investors), the projections of significant increases in health care spending and a sustained differential in the growth rates of Medicare and Medicaid relative to that of the rest of the health care system will almost certainly not happen as current law will be changed to avoid such outcomes. Nonetheless, the projections are useful in illustrating the implications of current law.
Indeed, emphasising the need to actively grapple with such rising spending pressures, the CBO describes a difficult future scenario. Slowing excess costs, it states, would not be painless and neither would it be offset through greater productivity given the current structure of the health sector. The CBO warns that households are likely to face increased cost-sharing as well as more restricted access to new technologies and treatments. As if to compound this, the CBO suggests that despite such restrictions, US citizens would still face increases in the real costs of care, which would absorb any increases in productivity growth. Overall, real average consumption of non-health care goods and services would ‘stagnate’ – not an entirely happy picture of the future, but one that certainly emphasises the difficult options that must, at some point, be faced to manage rising health spending in to a more sustainable trend.
20 © The King’s Fund 2013
Spending on health and social care over the next 50 years
Figure 9 US health care spending projections to 2082: ‘excess cost’ rate continues at historic averages
Source: Congressional Budget Office (2007)
100
90
80
70
60
50
40
30
20
10
0
Per
cent
age
of G
DP
Year
20072019
20102013
20162022
20342025
20282031
20372067
20492079
20402070
20432073
20462076
20522082
20642055
20582061
Medicare
Medicaid
All other health care
The United States: 2
In addition to the CBO’s health care projections, a regular report from the Board of Trustees of the Medicare4 fund also provides estimates for future spending not just for Medicare but for total health spending, too, based on a component-based cohort modelling approach (Centers for Medicare and Medicaid Services 2012). The Board of Trustees is required by law to report annually to Congress on the financial and actuarial status of the health trust funds it oversees. A key reason for carrying out projections of future costs is to ascertain the sustainability of the fund that pays for enrolees’ health care.
The board’s report gives a 75-year projection of Medicare expenditure under the general assumption that existing government arrangements and spending parameters continue to prevail for the entire projection period. With the enactment of the Affordable Care Act5 in 2010, future health care increases are subject to greater uncertainty in the long term, especially for the Medicare programme.
Accordingly, rather than looking at individual types of service for all future years, the report uses a more aggregated basis for setting cost growth assumptions in the long term. Specifically, the long-range cost-growth assumptions reflect a blend of two separate methodologies:
n a ‘GDP plus 1 per cent’ assumption
n a ‘factors contributing to growth’ model.
21
4: International analyses of future health spending
© The King’s Fund 2013
Figure 10 US health care spending projections to 2082: ‘excess cost’ rate limited in future
Source: Congressional Budget Office (2007)
4 Set up in 1965, Medicare is the second largest social insurance programme in the United States, with 48.7 million beneficiaries and a total expenditure of $549 billion. It covers Americans aged over 65 years, younger people with disabilities, and some people with end-stage renal failure. 5 The Patient Protection and Affordable Care Act expands access to insurance and requires individuals not covered by employer- or government-sponsored insurance plans to maintain minimum essential health insurance coverage.
100
90
80
70
60
50
40
30
20
10
0
Year
20072019
20102013
20162022
20342025
20282031
20372067
20492079
20402070
20432073
20462076
20522082
20642055
20582061
Medicare
Medicaid
All other health care
Per
cent
age
of G
DP
The ‘GDP plus 1 per cent’ scenario reflects the relationship between the growth rate of the US health sector and that of the overall economy. The historic average excess cost growth in health care has exhibited volatility, but has usually been around 2 per cent. If this trend were to continue unchecked, the health sector would encompass most, if not all, of the US economy within the 75-year reporting horizon. Since producing only health care is an impossibility, the report chose a figure of 1 per cent as the excess cost growth. Although excess growth of 1 per cent per year over 75 years would lead to a health sector of unprecedented size as a share of the economy, such a growth pattern would still be consistent with historic increases in the absolute level of real consumption for non-health expenditure.
The ‘growth factors’ model separates growth in health spending into several major drivers:
n income growth
n relative medical price inflation
n insurance coverage
n the impact of technological development.
The model also makes assumptions with regard to:
n continuing improvements in medical technology
n the extent to which new medical technology affects costs
n society’s relative preference for improved health versus consumption of other goods and services.
The theory behind the model is that, should innovations in medical technology continue to increase in the future and add substantially to costs, as in the past, then eventually society would be unwilling and unable to devote a steadily increasing share of its income to obtaining better health. In other words, a limit to growth is reached when the opportunity cost of health spending reaches a point when it exceeds the health benefits of that spending.
The method used for developing medical price changes split the price into its two main factors: medical input price growth; and productivity growth. It then assumed that medical input price growth for the overall health sector would equal the increase in the hospital input price index over the long run (estimated at about 3.6 per cent per year).
Total Medicare expenditure was US$549 billion (about £340 billion) in 2011. The report’s projection suggests that, under current law, expenditure would increase at a faster pace than aggregate workers’ earnings or the economy overall, specifically from 3.7 per cent of GDP in 2011 to 6.7 per cent by 2086. If the reduced price increases for health services under current policy are not sustained and do not take full effect in the long run, then Medicare spending would instead represent roughly 10.4 per cent of GDP in 2086.
A 2009 memorandum from the Office of the Actuary/National Health Statistics Group supporting the annual report contains information on the health sector as a whole (Caldis 2009). Its projection sees the health sector share of GDP move from 16.2 per cent in 2007 (of which 3.2 per cent was Medicare spending) to just under 45 per cent in 2083 (of which 11.4 per cent is accounted for by Medicare). Over this time period, the US economy is also expected to at least double its current size in real terms (see Figure 11, opposite).
22 © The King’s Fund 2013
Spending on health and social care over the next 50 years
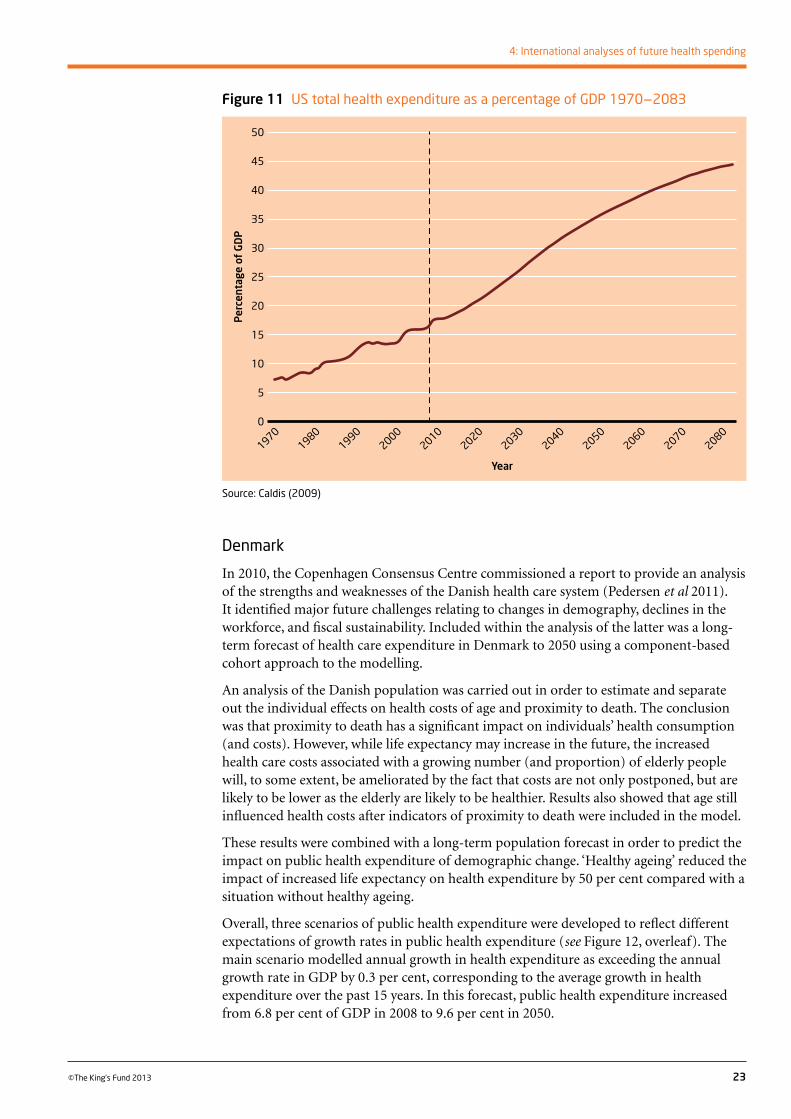
Denmark
In 2010, the Copenhagen Consensus Centre commissioned a report to provide an analysis of the strengths and weaknesses of the Danish health care system (Pedersen et al 2011). It identified major future challenges relating to changes in demography, declines in the workforce, and fiscal sustainability. Included within the analysis of the latter was a long-term forecast of health care expenditure in Denmark to 2050 using a component-based cohort approach to the modelling.
An analysis of the Danish population was carried out in order to estimate and separate out the individual effects on health costs of age and proximity to death. The conclusion was that proximity to death has a significant impact on individuals’ health consumption (and costs). However, while life expectancy may increase in the future, the increased health care costs associated with a growing number (and proportion) of elderly people will, to some extent, be ameliorated by the fact that costs are not only postponed, but are likely to be lower as the elderly are likely to be healthier. Results also showed that age still influenced health costs after indicators of proximity to death were included in the model.
These results were combined with a long-term population forecast in order to predict the impact on public health expenditure of demographic change. ‘Healthy ageing’ reduced the impact of increased life expectancy on health expenditure by 50 per cent compared with a situation without healthy ageing.
Overall, three scenarios of public health expenditure were developed to reflect different expectations of growth rates in public health expenditure (see Figure 12, overleaf). The main scenario modelled annual growth in health expenditure as exceeding the annual growth rate in GDP by 0.3 per cent, corresponding to the average growth in health expenditure over the past 15 years. In this forecast, public health expenditure increased from 6.8 per cent of GDP in 2008 to 9.6 per cent in 2050.
23
4: International analyses of future health spending
©The King’s Fund 2013
Figure 11 US total health expenditure as a percentage of GDP 1970–2083
Source: Caldis (2009)
50
45
40
35
30
25
20
15
10
5
0
Per
cent
age
of G
DP
Year
19702010
19801990
20002020
20602030
20402050
20702080
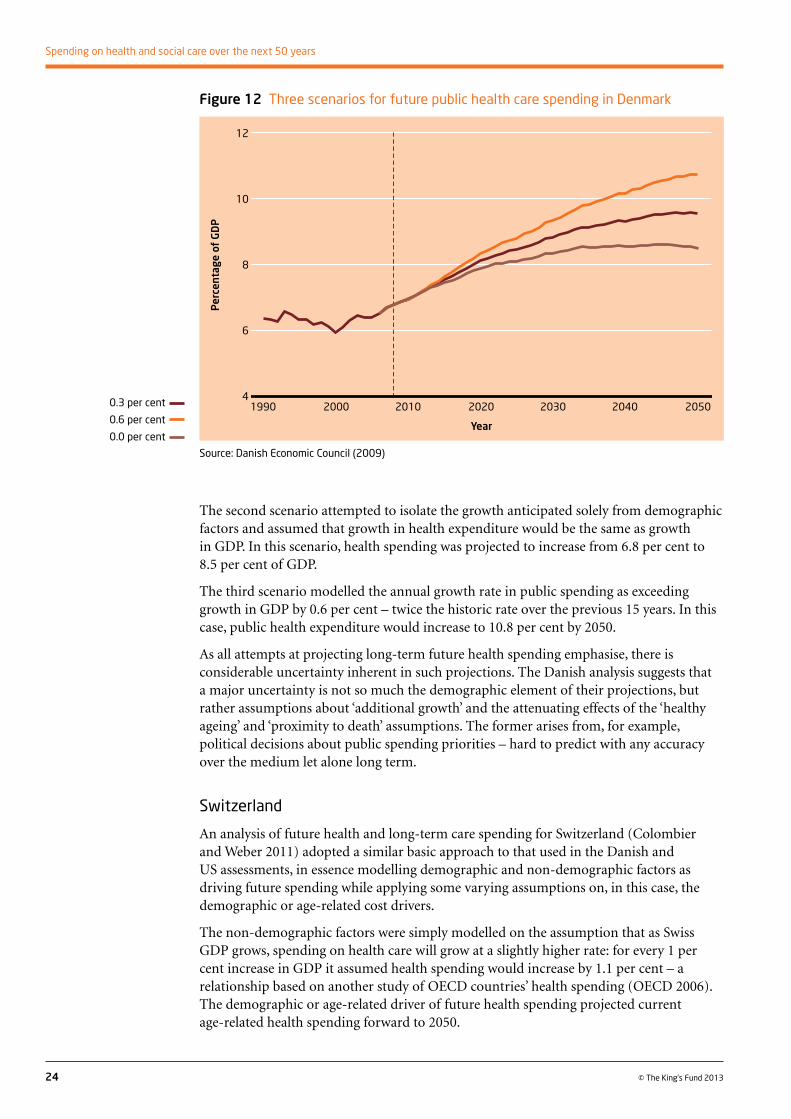
The second scenario attempted to isolate the growth anticipated solely from demographic factors and assumed that growth in health expenditure would be the same as growth in GDP. In this scenario, health spending was projected to increase from 6.8 per cent to 8.5 per cent of GDP.
The third scenario modelled the annual growth rate in public spending as exceeding growth in GDP by 0.6 per cent – twice the historic rate over the previous 15 years. In this case, public health expenditure would increase to 10.8 per cent by 2050.
As all attempts at projecting long-term future health spending emphasise, there is considerable uncertainty inherent in such projections. The Danish analysis suggests that a major uncertainty is not so much the demographic element of their projections, but rather assumptions about ‘additional growth’ and the attenuating effects of the ‘healthy ageing’ and ‘proximity to death’ assumptions. The former arises from, for example, political decisions about public spending priorities – hard to predict with any accuracy over the medium let alone long term.
Switzerland
An analysis of future health and long-term care spending for Switzerland (Colombier and Weber 2011) adopted a similar basic approach to that used in the Danish and US assessments, in essence modelling demographic and non-demographic factors as driving future spending while applying some varying assumptions on, in this case, the demographic or age-related cost drivers.
The non-demographic factors were simply modelled on the assumption that as Swiss GDP grows, spending on health care will grow at a slightly higher rate: for every 1 per cent increase in GDP it assumed health spending would increase by 1.1 per cent – a relationship based on another study of OECD countries’ health spending (OECD 2006). The demographic or age-related driver of future health spending projected current age-related health spending forward to 2050.
24 © The King’s Fund 2013
Spending on health and social care over the next 50 years
Figure 12 Three scenarios for future public health care spending in Denmark
Source: Danish Economic Council (2009)
12
10
8
6
4
Per
cent
age
of G
DP
Year
1990 2000 2010 2020 2030 2040 20500.3 per cent
0.6 per cent
0.0 per cent
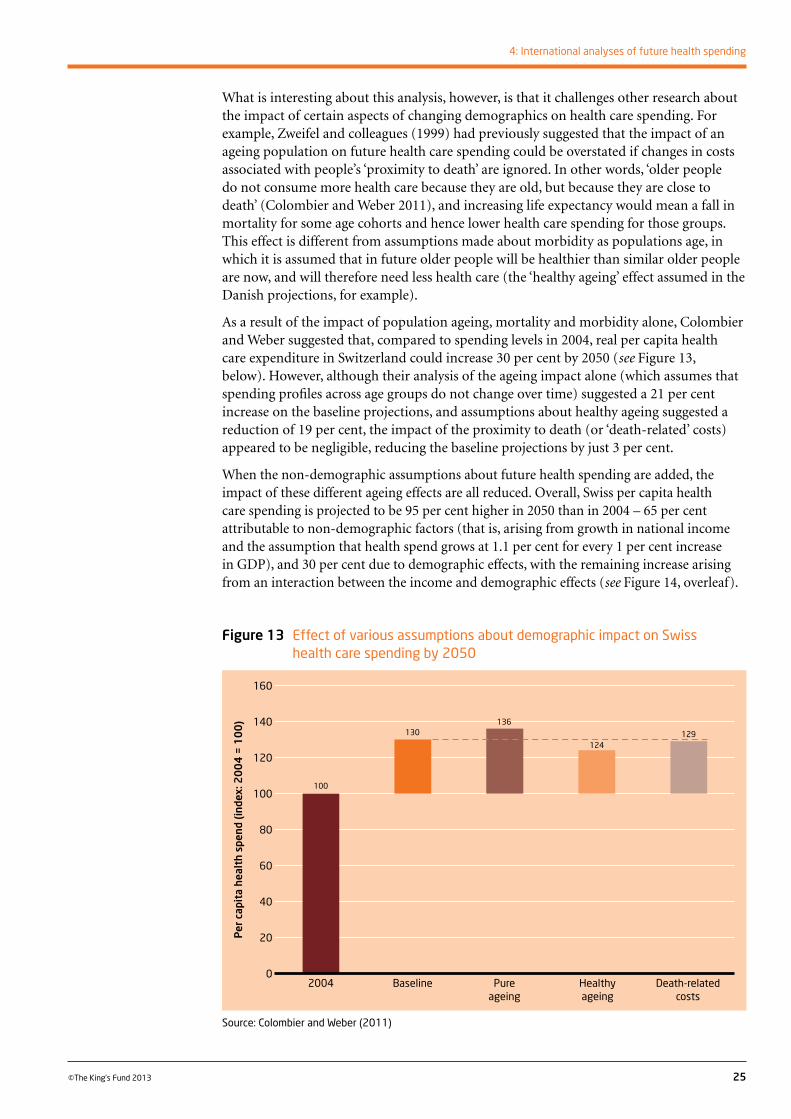
What is interesting about this analysis, however, is that it challenges other research about the impact of certain aspects of changing demographics on health care spending. For example, Zweifel and colleagues (1999) had previously suggested that the impact of an ageing population on future health care spending could be overstated if changes in costs associated with people’s ‘proximity to death’ are ignored. In other words, ‘older people do not consume more health care because they are old, but because they are close to death’ (Colombier and Weber 2011), and increasing life expectancy would mean a fall in mortality for some age cohorts and hence lower health care spending for those groups. This effect is different from assumptions made about morbidity as populations age, in which it is assumed that in future older people will be healthier than similar older people are now, and will therefore need less health care (the ‘healthy ageing’ effect assumed in the Danish projections, for example).
As a result of the impact of population ageing, mortality and morbidity alone, Colombier and Weber suggested that, compared to spending levels in 2004, real per capita health care expenditure in Switzerland could increase 30 per cent by 2050 (see Figure 13, below). However, although their analysis of the ageing impact alone (which assumes that spending profiles across age groups do not change over time) suggested a 21 per cent increase on the baseline projections, and assumptions about healthy ageing suggested a reduction of 19 per cent, the impact of the proximity to death (or ‘death-related’ costs) appeared to be negligible, reducing the baseline projections by just 3 per cent.
When the non-demographic assumptions about future health spending are added, the impact of these different ageing effects are all reduced. Overall, Swiss per capita health care spending is projected to be 95 per cent higher in 2050 than in 2004 – 65 per cent attributable to non-demographic factors (that is, arising from growth in national income and the assumption that health spend grows at 1.1 per cent for every 1 per cent increase in GDP), and 30 per cent due to demographic effects, with the remaining increase arising from an interaction between the income and demographic effects (see Figure 14, overleaf).
25
4: International analyses of future health spending
©The King’s Fund 2013
Figure 13 Effect of various assumptions about demographic impact on Swiss health care spending by 2050
Source: Colombier and Weber (2011)
160
140
120
100
80
60
40
20
0
Per
cap
ita
heal
th s
pend
(ind
ex: 2
00
4 =
10
0)
2004 Baseline Pure Healthy Death-related ageing ageing costs
100
130136
124129
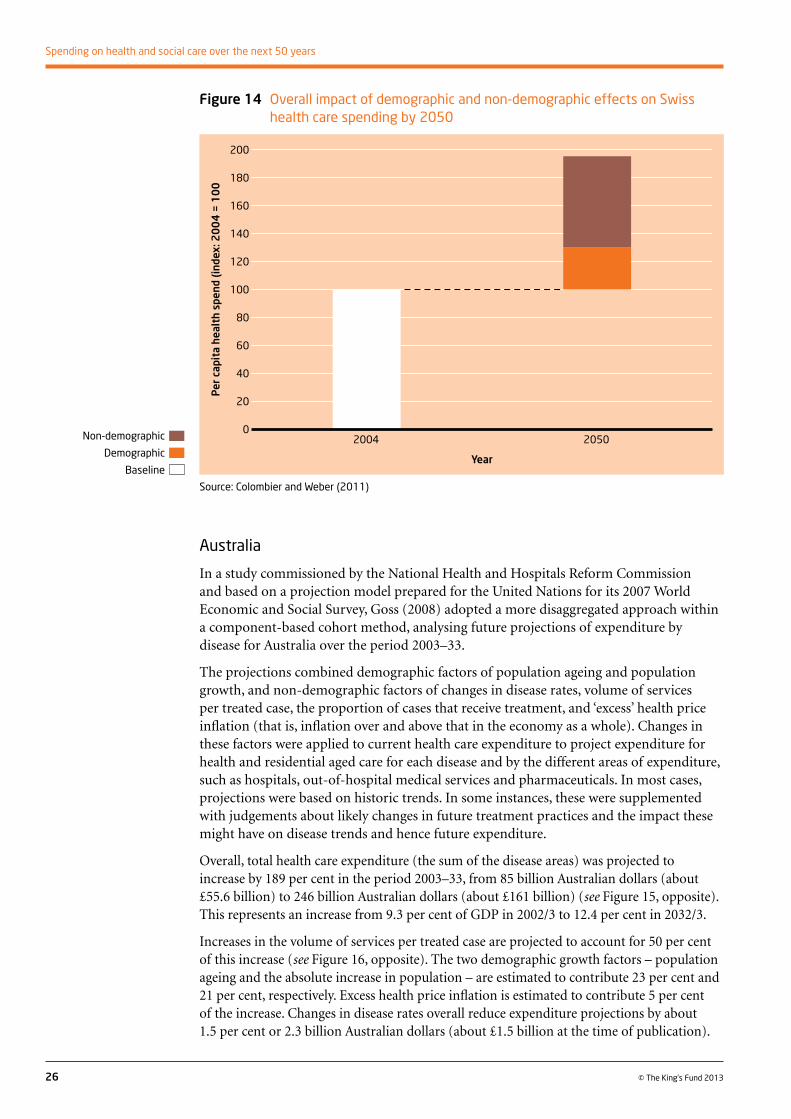
Australia
In a study commissioned by the National Health and Hospitals Reform Commission and based on a projection model prepared for the United Nations for its 2007 World Economic and Social Survey, Goss (2008) adopted a more disaggregated approach within a component-based cohort method, analysing future projections of expenditure by disease for Australia over the period 2003–33.
The projections combined demographic factors of population ageing and population growth, and non-demographic factors of changes in disease rates, volume of services per treated case, the proportion of cases that receive treatment, and ‘excess’ health price inflation (that is, inflation over and above that in the economy as a whole). Changes in these factors were applied to current health care expenditure to project expenditure for health and residential aged care for each disease and by the different areas of expenditure, such as hospitals, out-of-hospital medical services and pharmaceuticals. In most cases, projections were based on historic trends. In some instances, these were supplemented with judgements about likely changes in future treatment practices and the impact these might have on disease trends and hence future expenditure.
Overall, total health care expenditure (the sum of the disease areas) was projected to increase by 189 per cent in the period 2003–33, from 85 billion Australian dollars (about £55.6 billion) to 246 billion Australian dollars (about £161 billion) (see Figure 15, opposite). This represents an increase from 9.3 per cent of GDP in 2002/3 to 12.4 per cent in 2032/3.
Increases in the volume of services per treated case are projected to account for 50 per cent of this increase (see Figure 16, opposite). The two demographic growth factors – population ageing and the absolute increase in population – are estimated to contribute 23 per cent and 21 per cent, respectively. Excess health price inflation is estimated to contribute 5 per cent of the increase. Changes in disease rates overall reduce expenditure projections by about 1.5 per cent or 2.3 billion Australian dollars (about £1.5 billion at the time of publication).
26 © The King’s Fund 2013
Spending on health and social care over the next 50 years
Figure 14 Overall impact of demographic and non-demographic effects on Swiss health care spending by 2050
Source: Colombier and Weber (2011)
200
180
160
140
120
100
80
60
40
20
0
Per
cap
ita
heal
th s
pend
(ind
ex: 2
00
4 =
10
0
Year
2004 2050Non-demographic
Demographic
Baseline
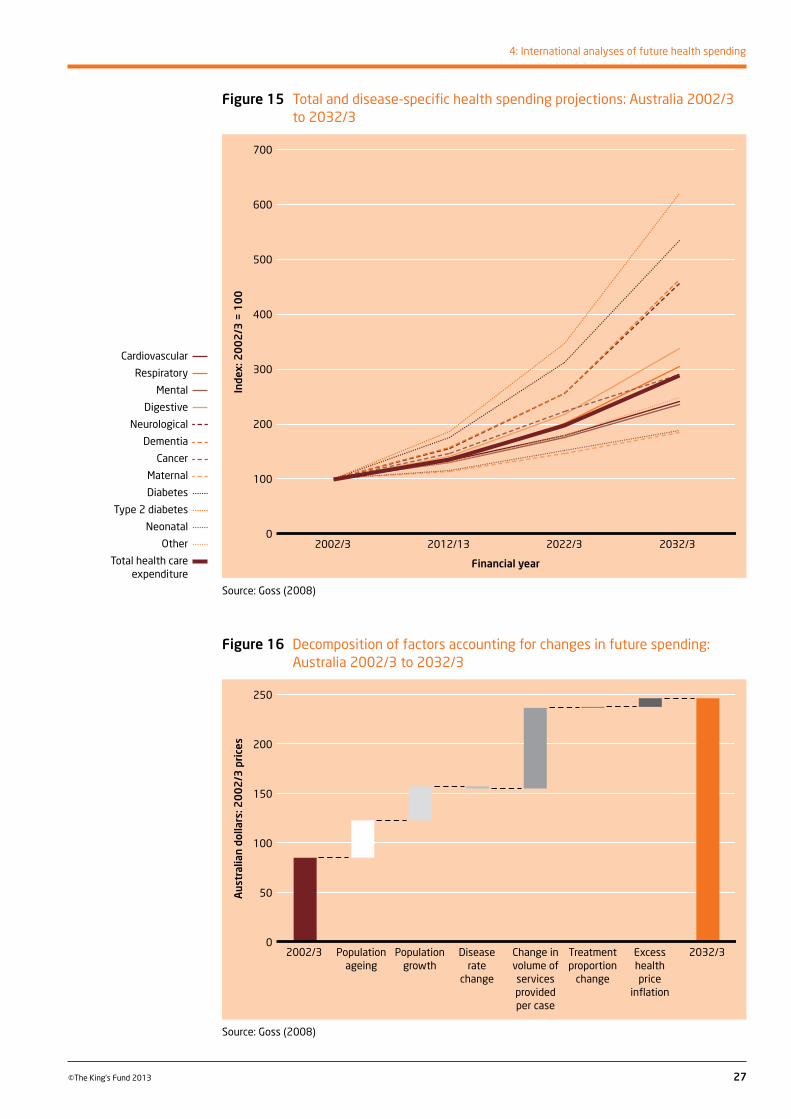
27
4: International analyses of future health spending
©The King’s Fund 2013
Figure 15 Total and disease-specific health spending projections: Australia 2002/3 to 2032/3
Figure 16 Decomposition of factors accounting for changes in future spending: Australia 2002/3 to 2032/3
Source: Goss (2008)
Source: Goss (2008)
700
600
500
400
300
200
100
0
250
200
150
100
50
0
Inde
x: 2
00
2/3
= 1
00
Aus
tral
ian
dolla
rs: 2
00
2/3
pri
ces
2002/3 2012/13 2022/3 2032/3
Financial year
Cardiovascular
Respiratory
Mental
Digestive
Neurological
Dementia
Cancer
Maternal
Diabetes
Type 2 diabetes
Neonatal
Other
Total health care expenditure
2002/3 Population Population Disease Change in Treatment Excess 2032/3 ageing growth rate volume of proportion health change services change price provided inflation per case
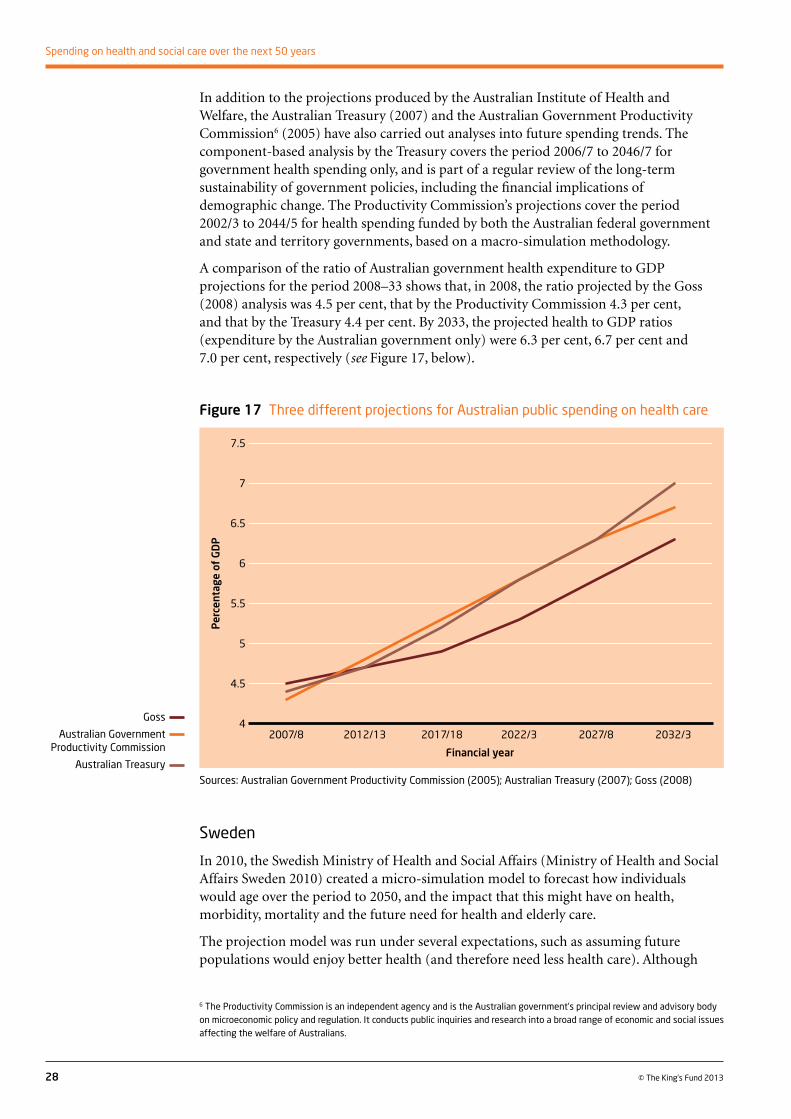
In addition to the projections produced by the Australian Institute of Health and Welfare, the Australian Treasury (2007) and the Australian Government Productivity Commission6 (2005) have also carried out analyses into future spending trends. The component-based analysis by the Treasury covers the period 2006/7 to 2046/7 for government health spending only, and is part of a regular review of the long-term sustainability of government policies, including the financial implications of demographic change. The Productivity Commission’s projections cover the period 2002/3 to 2044/5 for health spending funded by both the Australian federal government and state and territory governments, based on a macro-simulation methodology.
A comparison of the ratio of Australian government health expenditure to GDP projections for the period 2008–33 shows that, in 2008, the ratio projected by the Goss (2008) analysis was 4.5 per cent, that by the Productivity Commission 4.3 per cent, and that by the Treasury 4.4 per cent. By 2033, the projected health to GDP ratios (expenditure by the Australian government only) were 6.3 per cent, 6.7 per cent and 7.0 per cent, respectively (see Figure 17, below).
28 © The King’s Fund 2013
Spending on health and social care over the next 50 years
Sweden
In 2010, the Swedish Ministry of Health and Social Affairs (Ministry of Health and Social Affairs Sweden 2010) created a micro-simulation model to forecast how individuals would age over the period to 2050, and the impact that this might have on health, morbidity, mortality and the future need for health and elderly care.
The projection model was run under several expectations, such as assuming future populations would enjoy better health (and therefore need less health care). Although
Figure 17 Three different projections for Australian public spending on health care
Sources: Australian Government Productivity Commission (2005); Australian Treasury (2007); Goss (2008)
7.5
7
6.5
6
5.5
5
4.5
4
Per
cent
age
of G
DP
Financial year
2007/8 2012/13 2017/18 2022/3 2027/8 2032/3
6 The Productivity Commission is an independent agency and is the Australian government’s principal review and advisory body on microeconomic policy and regulation. It conducts public inquiries and research into a broad range of economic and social issues affecting the welfare of Australians.
Goss
Australian Government Productivity Commission
Australian Treasury
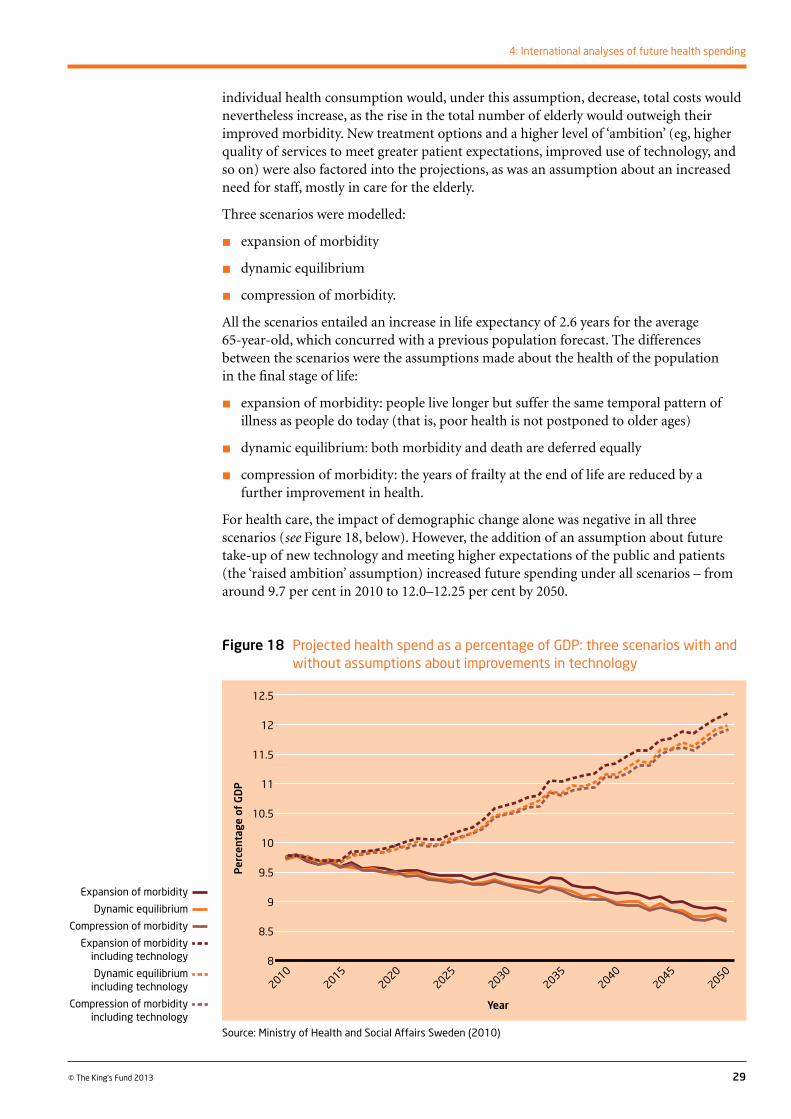
individual health consumption would, under this assumption, decrease, total costs would nevertheless increase, as the rise in the total number of elderly would outweigh their improved morbidity. New treatment options and a higher level of ‘ambition’ (eg, higher quality of services to meet greater patient expectations, improved use of technology, and so on) were also factored into the projections, as was an assumption about an increased need for staff, mostly in care for the elderly.
Three scenarios were modelled:
n expansion of morbidity
n dynamic equilibrium
n compression of morbidity.
All the scenarios entailed an increase in life expectancy of 2.6 years for the average 65-year-old, which concurred with a previous population forecast. The differences between the scenarios were the assumptions made about the health of the population in the final stage of life:
n expansion of morbidity: people live longer but suffer the same temporal pattern of illness as people do today (that is, poor health is not postponed to older ages)
n dynamic equilibrium: both morbidity and death are deferred equally
n compression of morbidity: the years of frailty at the end of life are reduced by a further improvement in health.
For health care, the impact of demographic change alone was negative in all three scenarios (see Figure 18, below). However, the addition of an assumption about future take-up of new technology and meeting higher expectations of the public and patients (the ‘raised ambition’ assumption) increased future spending under all scenarios – from around 9.7 per cent in 2010 to 12.0–12.25 per cent by 2050.
29
4: International analyses of future health spending
© The King’s Fund 2013
Figure 18 Projected health spend as a percentage of GDP: three scenarios with and without assumptions about improvements in technology
Source: Ministry of Health and Social Affairs Sweden (2010)
12.5
12
11.5
11
10.5
10
9.5
9
8.5
8
Per
cent
age
of G
DP
Year
20102015
20202025
20302035
20402045
2050
Expansion of morbidity
Dynamic equilibrium
Compression of morbidity
Expansion of morbidity including technology
Dynamic equilibrium including technology
Compression of morbidity including technology
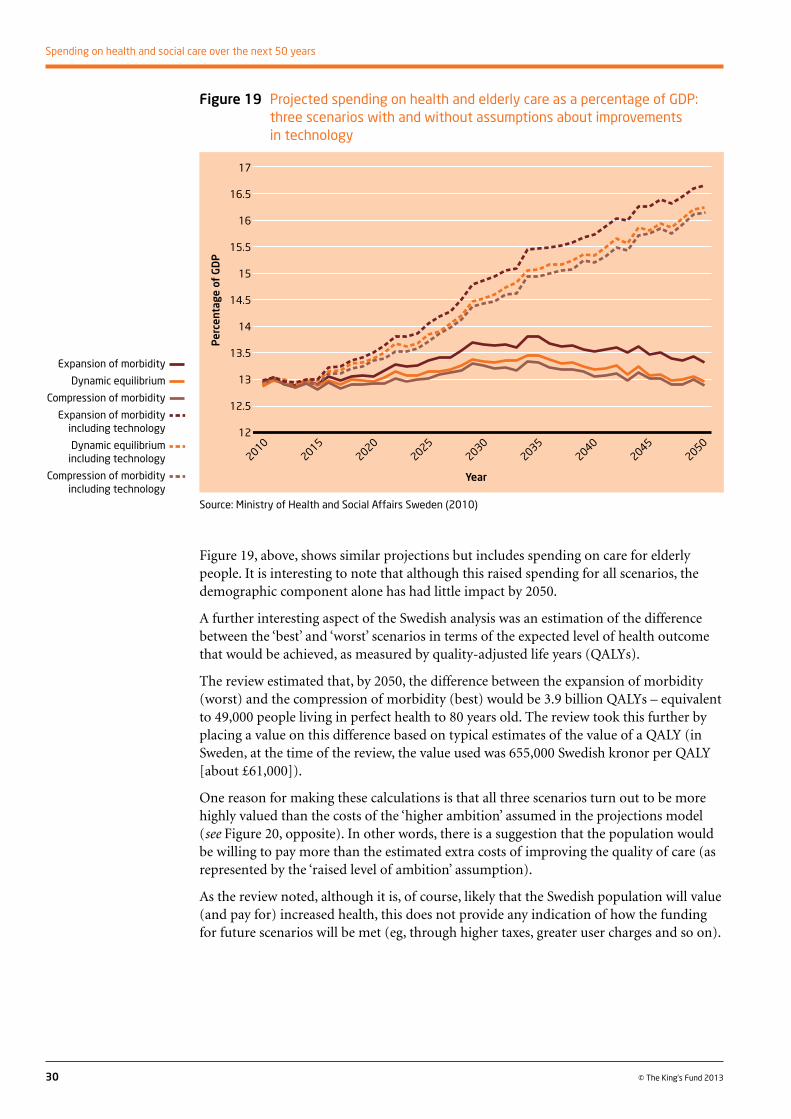
Figure 19, above, shows similar projections but includes spending on care for elderly people. It is interesting to note that although this raised spending for all scenarios, the demographic component alone has had little impact by 2050.
A further interesting aspect of the Swedish analysis was an estimation of the difference between the ‘best’ and ‘worst’ scenarios in terms of the expected level of health outcome that would be achieved, as measured by quality-adjusted life years (QALYs).
The review estimated that, by 2050, the difference between the expansion of morbidity (worst) and the compression of morbidity (best) would be 3.9 billion QALYs – equivalent to 49,000 people living in perfect health to 80 years old. The review took this further by placing a value on this difference based on typical estimates of the value of a QALY (in Sweden, at the time of the review, the value used was 655,000 Swedish kronor per QALY [about £61,000]).
One reason for making these calculations is that all three scenarios turn out to be more highly valued than the costs of the ‘higher ambition’ assumed in the projections model (see Figure 20, opposite). In other words, there is a suggestion that the population would be willing to pay more than the estimated extra costs of improving the quality of care (as represented by the ‘raised level of ambition’ assumption).
As the review noted, although it is, of course, likely that the Swedish population will value (and pay for) increased health, this does not provide any indication of how the funding for future scenarios will be met (eg, through higher taxes, greater user charges and so on).
30 © The King’s Fund 2013
Spending on health and social care over the next 50 years
Figure 19 Projected spending on health and elderly care as a percentage of GDP: three scenarios with and without assumptions about improvements in technology
Source: Ministry of Health and Social Affairs Sweden (2010)
17
16.5
16
15.5
15
14.5
14
13.5
13
12.5
12
Per
cent
age
of G
DP
Year
20102015
20202025
20302035
20402045
2050
Expansion of morbidity
Dynamic equilibrium
Compression of morbidity
Expansion of morbidity including technology
Dynamic equilibrium including technology
Compression of morbidity including technology
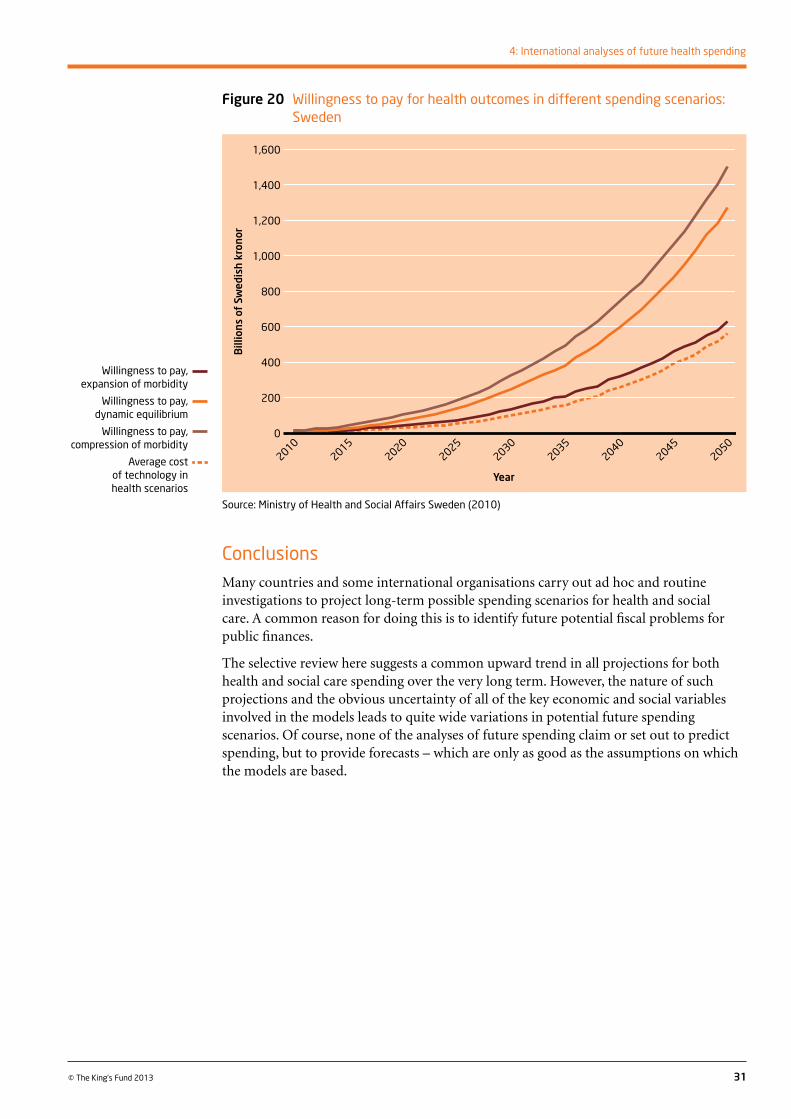
ConclusionsMany countries and some international organisations carry out ad hoc and routine investigations to project long-term possible spending scenarios for health and social care. A common reason for doing this is to identify future potential fiscal problems for public finances.
The selective review here suggests a common upward trend in all projections for both health and social care spending over the very long term. However, the nature of such projections and the obvious uncertainty of all of the key economic and social variables involved in the models leads to quite wide variations in potential future spending scenarios. Of course, none of the analyses of future spending claim or set out to predict spending, but to provide forecasts – which are only as good as the assumptions on which the models are based.
31
4: International analyses of future health spending
© The King’s Fund 2013
Figure 20 Willingness to pay for health outcomes in different spending scenarios: Sweden
Source: Ministry of Health and Social Affairs Sweden (2010)
1,600
1,400
1,200
1,000
800
600
400
200
0
Bill
ions
of
Swed
ish
kron
or
Year
20102015
20202025
20302035
20402045
2050
Willingness to pay, expansion of morbidity
Willingness to pay, dynamic equilibrium
Willingness to pay, compression of morbidity
Average cost of technology in health scenarios
32 © The King’s Fund 2013
A key conclusion to be drawn from international analyses of the long-term prospects for spending on health and social care is that pressures to spend more on health and social care will be unrelenting in all countries. So what are the prospects for the United Kingdom? Here we first recap on the major drivers of health and social care spending from the perspective of the United Kingdom, and then review the evidence from three United Kingdom-focused analyses and two international studies that included estimates for the United Kingdom.
Future spending driversAs the review by Astolfi and colleagues (2012) noted, the reason studies of future health and social care spending tend to project increases in spending lie in future changes in those factors influencing spending on health and social care: demography, national income, technology, costs, and, for long-term care in particular, the size of the informal care sector and the dependency ratio. Different projections and analytical methods provide different views of the future, but all agree that these key drivers have been (and will be) responsible for increased spending in future.
Demography
Population projections for the United Kingdom suggest that the total population will grow from 62.3 million in 2010 to 81.5 million in 2060 (an increase of 31 per cent), and to 89.3 million by 2085 (an increase of 43 per cent) (Office for National Statistics 2012). The composition of the population will also change. The main consumers of health care are older people, and the proportion of people older than 60 years will increase from around 23 per cent in 2010 to 31 per cent by 2060, and 34 per cent by 2085. The proportion of people older than 75 years is likely to more than double, from around 8 per cent in 2010 to 17.5 per cent by 2085 (Office for National Statistics 2012). These changes will increase the pressure to spend more on health and on social care in particular – although the scale of this pressure will not be as important as either changes in national income or technology.
Income
Although the United Kingdom is in the midst of one of its deepest and longest economic recessions, long-term projections for the United Kingdom’s income (as measured by gross domestic product, GDP) are upward. There will be further recessionary periods over the next 50 years, but, for example, the Office For Budget Responsibility (OBR) projects real increases in GDP of around 2.2 per cent per annum between 2012/13 and 2061/2 (OBR 2012). In other words, if these projections hold true, over the next 50 years, national GDP will treble in real terms and, given the evidence on the choices we tend to make about what we spend extra money on, we are likely to choose health care.
Future health and social care spending in the United Kingdom
5
Technology
Various projection studies define ‘technology’ in different ways. However, it includes not just advances in medical technology – new drugs, different treatments, and so on – but more general influences on demand by supply-side factors (supply- or supplier-induced demand). Some projection studies simply treat technology as the residual factor after income and population influences on historic changes in health and social care spending have been accounted for.
Analyses that have decomposed the drivers of spending have found that this residual or ‘excess cost’ factor has a bigger impact on spending than changes in population and population ageing. By its nature, it is difficult to predict what a realistic value might be for such a variable. The projection study for the Organisation for Economic Co-operation and Development (OECD) countries (OECD 2006) suggested that out of an average annual real growth in spending in the United Kingdom between 1970 and 2002 of 3.8 per cent, 1.5 percentage points (around 40 per cent) could be attributable to this factor (or rather, other factors after accounting for the impact of population and income changes). Such a value would, over 50 years, double the spending on health care.
Costs
Historically, the costs of the inputs to health care have tended to rise at a slightly higher rate than costs in the economy as a whole. The theoretical economic reasons why this might be have been detailed by Baumol et al (2012). Between 1974/5 and 2007/8, pay and prices in the English National Health Service (NHS) rose by around 1,000 per cent – nearly twice the increase in the general measure of inflation across the economy, the GDP deflator. Again, current events (the public sector pay freeze) aside, it seems likely that, in the words of Baumol and colleagues, this ‘cost disease’ will continue.
Future spending
Securing our future health: taking a long-term view – Wanless
The terms of reference for the 2002 Wanless review of future spending needs comprised an examination of the technological, demographic and medical trends that may affect the health service in the United Kingdom as a whole, and the identifying of key factors that would determine the financial and other resources required to ensure that the NHS could provide a publicly funded, comprehensive, high-quality service over the 20 years from 2002 to 2022 (Wanless 2002).
The approach taken by the review focused on the outcomes to be achieved by the health service and its conclusions were based on a ‘vision’ of health services in 2022 that would deliver better access, higher quality care and a more patient-centred service. In addition, over the short term, priorities included improvements in patient safety, increasing capacity and reducing waiting times.
Future spending was determined by costing this new vision of the NHS while also taking account of other drivers of spending, such as changes in population size and demographic structure, future levels of health care productivity, and relative health care inflation rates.
Given the huge uncertainty about the way in which the key cost-driver factors would change in the future, the review produced three separate scenarios to model variations in key assumptions and views of the future (see Table 3, overleaf).
33
5: Future health and social care spending in the United Kingdom
© The King’s Fund 2013
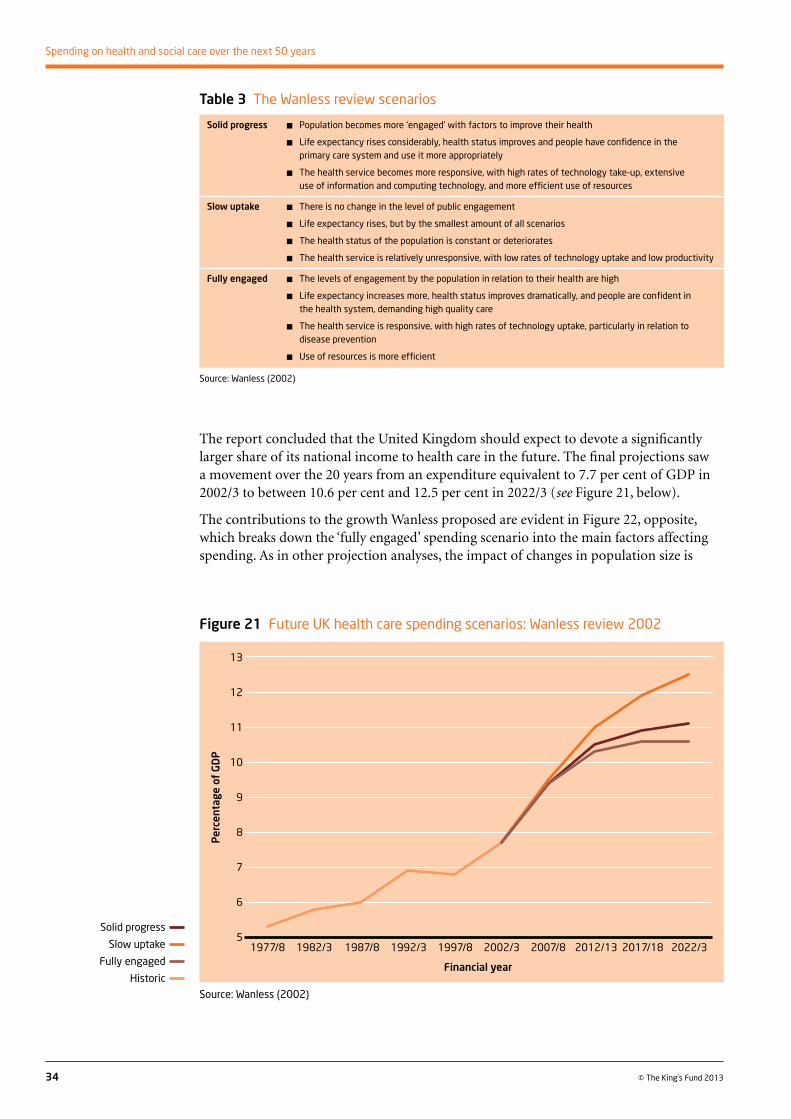
The report concluded that the United Kingdom should expect to devote a significantly larger share of its national income to health care in the future. The final projections saw a movement over the 20 years from an expenditure equivalent to 7.7 per cent of GDP in 2002/3 to between 10.6 per cent and 12.5 per cent in 2022/3 (see Figure 21, below).
The contributions to the growth Wanless proposed are evident in Figure 22, opposite, which breaks down the ‘fully engaged’ spending scenario into the main factors affecting spending. As in other projection analyses, the impact of changes in population size is
34 © The King’s Fund 2013
Spending on health and social care over the next 50 years
Table 3 The Wanless review scenarios
Solid progress n Population becomes more ‘engaged’ with factors to improve their health
n Life expectancy rises considerably, health status improves and people have confidence in the primary care system and use it more appropriately
n The health service becomes more responsive, with high rates of technology take-up, extensive use of information and computing technology, and more efficient use of resources
Slow uptake n There is no change in the level of public engagement
n Life expectancy rises, but by the smallest amount of all scenarios
n The health status of the population is constant or deteriorates
n The health service is relatively unresponsive, with low rates of technology uptake and low productivity
Fully engaged n The levels of engagement by the population in relation to their health are high
n Life expectancy increases more, health status improves dramatically, and people are confident in the health system, demanding high quality care
n The health service is responsive, with high rates of technology uptake, particularly in relation to disease prevention
n Use of resources is more efficient
Source: Wanless (2002)
Figure 21 Future UK health care spending scenarios: Wanless review 2002
Source: Wanless (2002)
13
12
11
10
9
8
7
6
5
Per
cent
age
of G
DP
1977/8 1982/3 1987/8 1992/3 1997/8 2002/3 2007/8 2012/13 2017/18 2022/3
Financial year
Solid progress
Slow uptake
Fully engaged
Historic

relatively minor. It is improvements in quality – in the Wanless scenarios modelled as the implementation of ‘national service frameworks’ (NSFs)7 and encompassing the adoption of new medical technology – that account for the largest single impact on future spending, around 60 per cent of the total increase in spending aside from the off-setting assumption about future productivity improvements.
Wanless’s original remit excluded social care spending. However, he considered it important to take an integrated approach to both health and social care services. His 2002 review therefore included a limited analysis of personal social services for England covering spending on elderly people and adults with mental health problems and physical and learning difficulties.
The projection for social care services relied only on population projections and assumptions about changes in the level of ill health as assumed in the three scenarios for health care, that is, a reduction in ill health in the ‘fully engaged’ scenario, an increase for ‘slow uptake’, and constant levels in ‘solid progress’. On this basis, future social care spending was projected to rise from around £6.4 billion in 2002/3 to between £10.0 billion and £11.0 billion by 2022/3, depending on the scenario.
35
5: Future health and social care spending in the United Kingdom
© The King’s Fund 2013
7 NSFs set out best practice along a pathway of care for disease areas such as cancer or diabetes. See, for example, the NHS Choices website. Available at: www.nhs.uk/NHSEngland/NSF/Pages/Nationalserviceframeworks.aspx (accessed on 12 December 2012).
Figure 22 Breakdown of factors contributing to Wanless’s ‘fully engaged’ spending scenario
Note: ICT, information and computing technology
Source: Wanless et al (2007), based on Wanless (2002)
220
200
180
160
140
120
100
80
60
40
20
0
£ b
illio
ns
Real pay
and
price effe
ct
New NSFs
Current N
SFs
NHS spend 2
002/3
Faste
r acc
ess (r
educing
waiting ti
mes)
Improv
ing clinica
l
govern
ance
NHS capita
l spend
(inclu
ding ICT)
Demography,
population
health an
d health-
seekin
g behaviour To
tal
Producti
vity
68.0
8.8
75.2
12.3 1.6
6.97.2
20.6 46.5
154.0
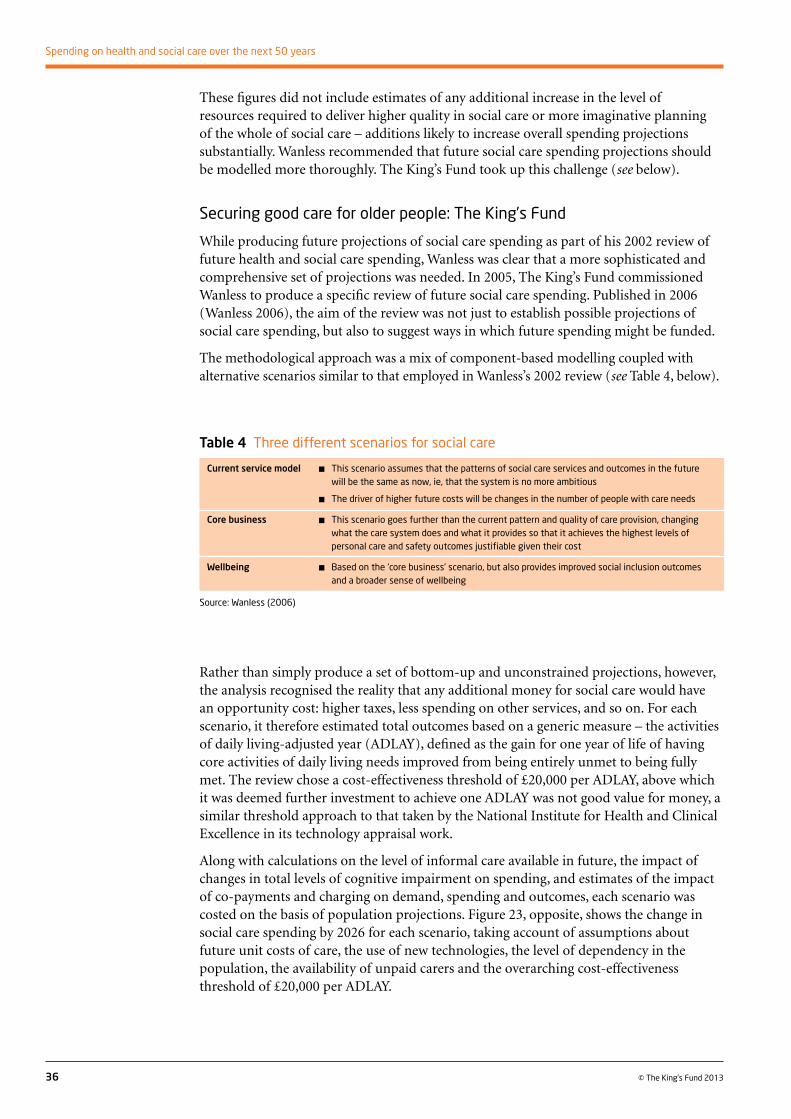
These figures did not include estimates of any additional increase in the level of resources required to deliver higher quality in social care or more imaginative planning of the whole of social care – additions likely to increase overall spending projections substantially. Wanless recommended that future social care spending projections should be modelled more thoroughly. The King’s Fund took up this challenge (see below).
Securing good care for older people: The King’s Fund
While producing future projections of social care spending as part of his 2002 review of future health and social care spending, Wanless was clear that a more sophisticated and comprehensive set of projections was needed. In 2005, The King’s Fund commissioned Wanless to produce a specific review of future social care spending. Published in 2006 (Wanless 2006), the aim of the review was not just to establish possible projections of social care spending, but also to suggest ways in which future spending might be funded.
The methodological approach was a mix of component-based modelling coupled with alternative scenarios similar to that employed in Wanless’s 2002 review (see Table 4, below).
36 © The King’s Fund 2013
Spending on health and social care over the next 50 years
Table 4 Three different scenarios for social care
Current service model n This scenario assumes that the patterns of social care services and outcomes in the future will be the same as now, ie, that the system is no more ambitious
n The driver of higher future costs will be changes in the number of people with care needs
Core business n This scenario goes further than the current pattern and quality of care provision, changing what the care system does and what it provides so that it achieves the highest levels of personal care and safety outcomes justifiable given their cost
Wellbeing n Based on the ‘core business’ scenario, but also provides improved social inclusion outcomes and a broader sense of wellbeing
Source: Wanless (2006)
Rather than simply produce a set of bottom-up and unconstrained projections, however, the analysis recognised the reality that any additional money for social care would have an opportunity cost: higher taxes, less spending on other services, and so on. For each scenario, it therefore estimated total outcomes based on a generic measure – the activities of daily living-adjusted year (ADLAY), defined as the gain for one year of life of having core activities of daily living needs improved from being entirely unmet to being fully met. The review chose a cost-effectiveness threshold of £20,000 per ADLAY, above which it was deemed further investment to achieve one ADLAY was not good value for money, a similar threshold approach to that taken by the National Institute for Health and Clinical Excellence in its technology appraisal work.
Along with calculations on the level of informal care available in future, the impact of changes in total levels of cognitive impairment on spending, and estimates of the impact of co-payments and charging on demand, spending and outcomes, each scenario was costed on the basis of population projections. Figure 23, opposite, shows the change in social care spending by 2026 for each scenario, taking account of assumptions about future unit costs of care, the use of new technologies, the level of dependency in the population, the availability of unpaid carers and the overarching cost-effectiveness threshold of £20,000 per ADLAY.

Under the ‘current service model’, spending would increase from 1.1 per cent of GDP to 1.5 per cent by 2026. For the other scenarios, the baseline spending would be higher given the higher specifications for social care assumed in the models. Spending by 2026 for both enhanced care futures would be around 2.0 per cent of GDP – almost exactly the same as a later estimate (1.99 per cent) using a combination of macro- and micro-simulation models (Wittenberg et al 2011).
Long-term fiscal sustainability reports: the Treasury and the OBR
In 2002, the Treasury launched the first of what were to become annual reports reviewing the long term (that is, 50 years into the future) fiscal sustainability of the public finances – from tax revenues to public spending and the overall state of the UK economy. Acknowledged as a huge task replete with significant uncertainties, nonetheless the 2002 review noted: ‘a good understanding of the challenges which arise is essential for the Government to make the right long-term strategic policy decisions and to ensure that government policy will be long-term sustainable’ (HM Treasury 2002).
Since 2002, 10 reviews have been published (there was no review in 2007), with the OBR taking over responsibility for producing them in 2010.
As Figure 24, overleaf, shows, although different reports projected various future levels of health spending, with roughly a 1.5 percentage point gap between the highest and lowest projections, perhaps more significant is the fact that previous reports were fairly consistent in terms of the scale of future increases over the 50-year periods examined: all projected increases of just greater than 2 percentage points of GDP – little different from the historic time trend between 1960 and 2011.
37
5: Future health and social care spending in the United Kingdom
© The King’s Fund 2013
Figure 23 Future social care spending, 2002 and 2026
Source: Wanless (2006)
2.5
2
1.5
1
0.5
0
Per
cent
age
of G
DP
Current service model Core business Wellbeing2002
2026
2002 baseline spend:
£10.1 bn
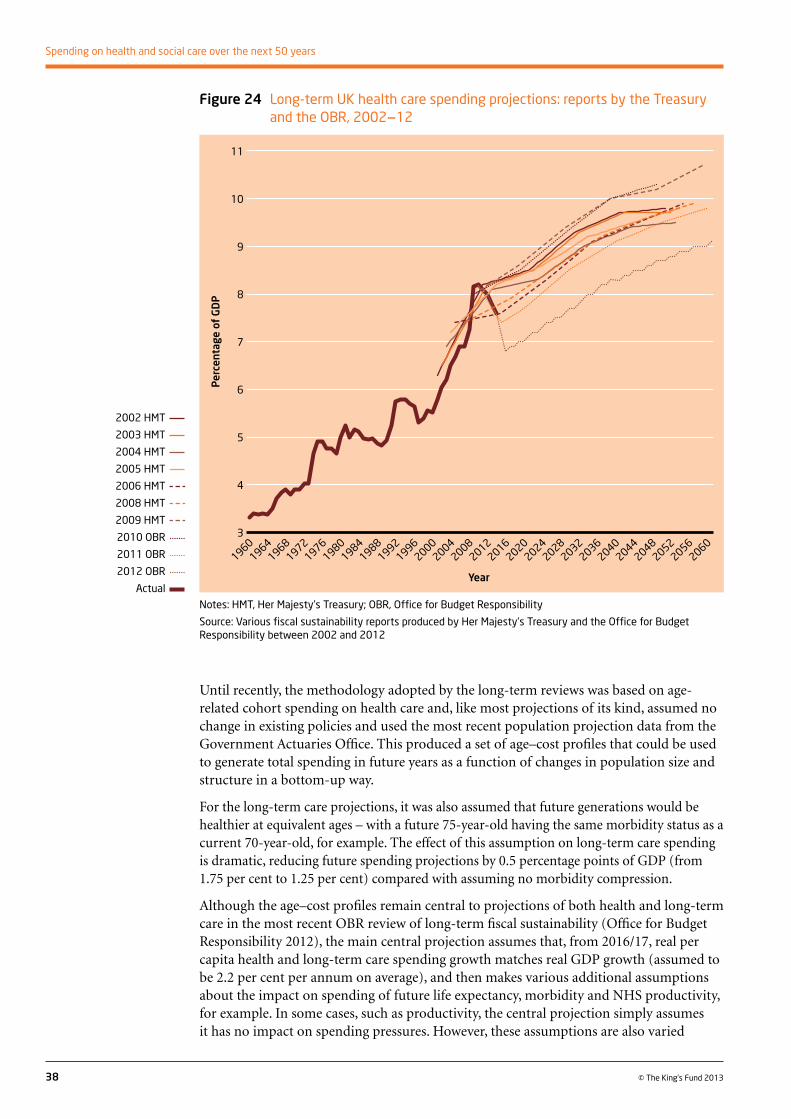
Until recently, the methodology adopted by the long-term reviews was based on age-related cohort spending on health care and, like most projections of its kind, assumed no change in existing policies and used the most recent population projection data from the Government Actuaries Office. This produced a set of age–cost profiles that could be used to generate total spending in future years as a function of changes in population size and structure in a bottom-up way.
For the long-term care projections, it was also assumed that future generations would be healthier at equivalent ages – with a future 75-year-old having the same morbidity status as a current 70-year-old, for example. The effect of this assumption on long-term care spending is dramatic, reducing future spending projections by 0.5 percentage points of GDP (from 1.75 per cent to 1.25 per cent) compared with assuming no morbidity compression.
Although the age–cost profiles remain central to projections of both health and long-term care in the most recent OBR review of long-term fiscal sustainability (Office for Budget Responsibility 2012), the main central projection assumes that, from 2016/17, real per capita health and long-term care spending growth matches real GDP growth (assumed to be 2.2 per cent per annum on average), and then makes various additional assumptions about the impact on spending of future life expectancy, morbidity and NHS productivity, for example. In some cases, such as productivity, the central projection simply assumes it has no impact on spending pressures. However, these assumptions are also varied
38 © The King’s Fund 2013
Spending on health and social care over the next 50 years
Figure 24 Long-term UK health care spending projections: reports by the Treasury and the OBR, 2002–12
Notes: HMT, Her Majesty’s Treasury; OBR, Office for Budget Responsibility
Source: Various fiscal sustainability reports produced by Her Majesty’s Treasury and the Office for Budget Responsibility between 2002 and 2012
11
10
9
8
7
6
5
4
3
Per
cent
age
of G
DP
19601976
19641968
19721980
19841988
19921996
20162012
20002004
20082024
20202060
20522056
20322028
20402036
20482044
Year
2002 HMT
2003 HMT
2004 HMT
2005 HMT
2006 HMT
2008 HMT
2009 HMT
2010 OBR
2011 OBR
2012 OBR
Actual
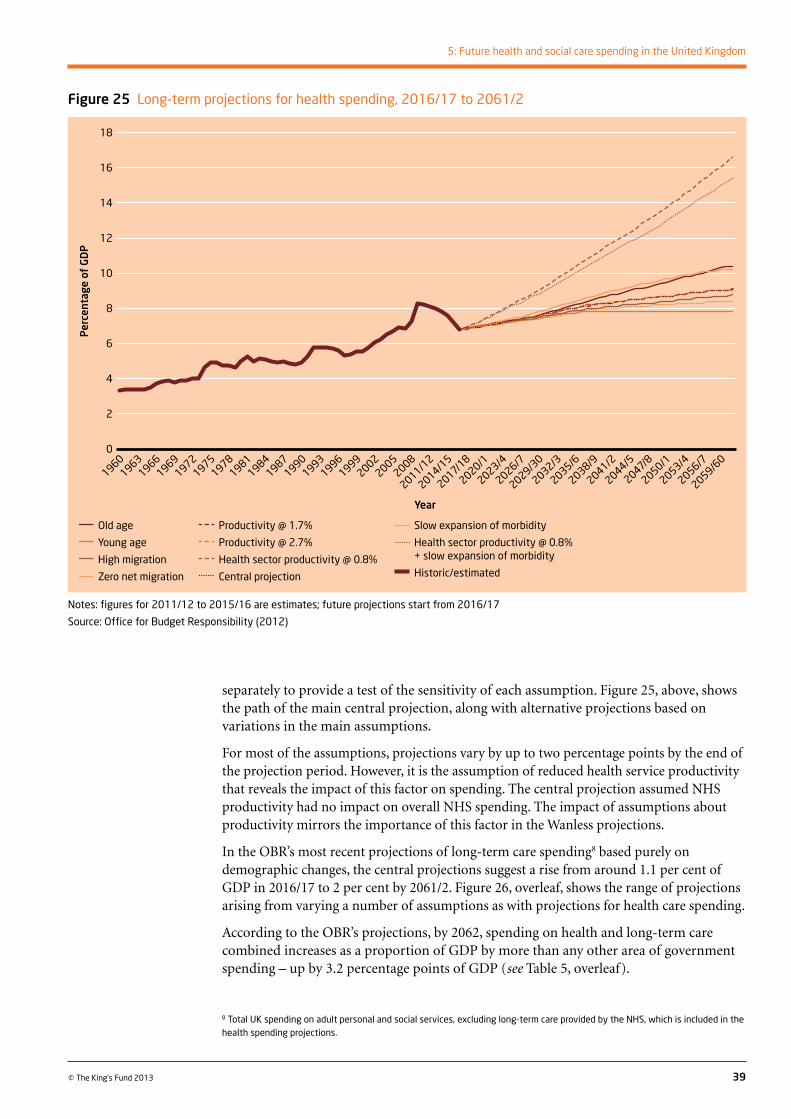
separately to provide a test of the sensitivity of each assumption. Figure 25, above, shows the path of the main central projection, along with alternative projections based on variations in the main assumptions.
For most of the assumptions, projections vary by up to two percentage points by the end of the projection period. However, it is the assumption of reduced health service productivity that reveals the impact of this factor on spending. The central projection assumed NHS productivity had no impact on overall NHS spending. The impact of assumptions about productivity mirrors the importance of this factor in the Wanless projections.
In the OBR’s most recent projections of long-term care spending8 based purely on demographic changes, the central projections suggest a rise from around 1.1 per cent of GDP in 2016/17 to 2 per cent by 2061/2. Figure 26, overleaf, shows the range of projections arising from varying a number of assumptions as with projections for health care spending.
According to the OBR’s projections, by 2062, spending on health and long-term care combined increases as a proportion of GDP by more than any other area of government spending – up by 3.2 percentage points of GDP (see Table 5, overleaf).
39
5: Future health and social care spending in the United Kingdom
© The King’s Fund 2013
Figure 25 Long-term projections for health spending, 2016/17 to 2061/2
Notes: figures for 2011/12 to 2015/16 are estimates; future projections start from 2016/17
Source: Office for Budget Responsibility (2012)
18
16
14
12
10
8
6
4
2
0
Per
cent
age
of G
DP
19601972
19631966
19691975
1987
2014/15
19781996
19812002
19842008
1990
2020/1
2011/12
2044/51993
2026/71999
2032/32005
2038/9
2017/18
2047/8
2041/2
2059/60
2023/4
2050/1
2029/30
2053/4
2035/6
2056/7
Year
8 Total UK spending on adult personal and social services, excluding long-term care provided by the NHS, which is included in the health spending projections.
Old age
Young age
High migration
Zero net migration
Productivity @ 1.7%
Productivity @ 2.7%
Health sector productivity @ 0.8%
Central projection
Slow expansion of morbidity
Health sector productivity @ 0.8% + slow expansion of morbidity
Historic/estimated
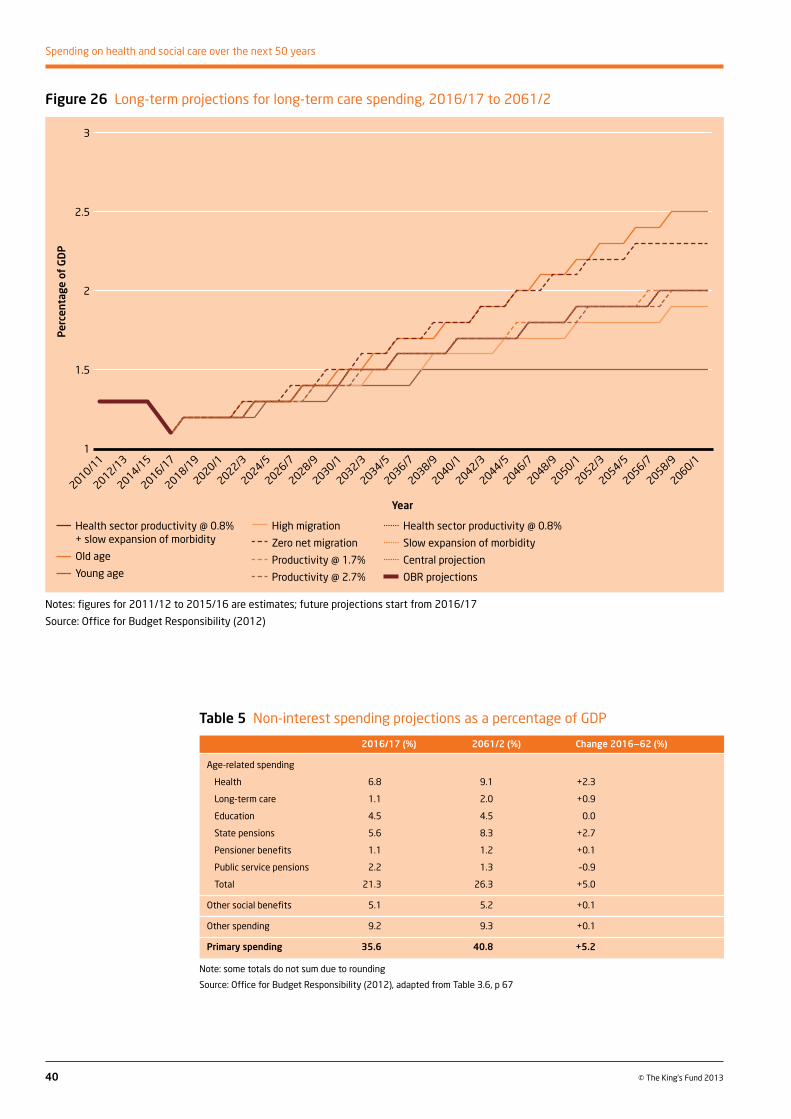
40 © The King’s Fund 2013
Spending on health and social care over the next 50 years
Figure 26 Long-term projections for long-term care spending, 2016/17 to 2061/2
Notes: figures for 2011/12 to 2015/16 are estimates; future projections start from 2016/17
Source: Office for Budget Responsibility (2012)
Table 5 Non-interest spending projections as a percentage of GDP
2016/17 (%) 2061/2 (%) Change 2016–62 (%)
Age-related spending
Health 6.8 9.1 +2.3
Long-term care 1.1 2.0 +0.9
Education 4.5 4.5 0.0
State pensions 5.6 8.3 +2.7
Pensioner benefits 1.1 1.2 +0.1
Public service pensions 2.2 1.3 –0.9
Total 21.3 26.3 +5.0
Other social benefits 5.1 5.2 +0.1
Other spending 9.2 9.3 +0.1
Primary spending 35.6 40.8 +5.2
Note: some totals do not sum due to rounding
Source: Office for Budget Responsibility (2012), adapted from Table 3.6, p 67
3
2.5
2
1.5
1
Per
cent
age
of G
DP
2010/11
2018/19
2012/13
2014/15
2016/17
2020/1
2028/9
2046/7
2022/3
2034/5
2024/5
2038/9
2026/7
2042/3
2030/1
2050/1
2044/5
2032/3
2054/5
2036/7
2058/9
2040/1
2048/9
2060/1
2052/3
2056/7
Year
Health sector productivity @ 0.8% + slow expansion of morbidity
Old age
Young age
High migration
Zero net migration
Productivity @ 1.7%
Productivity @ 2.7%
Health sector productivity @ 0.8%
Slow expansion of morbidity
Central projection
OBR projections
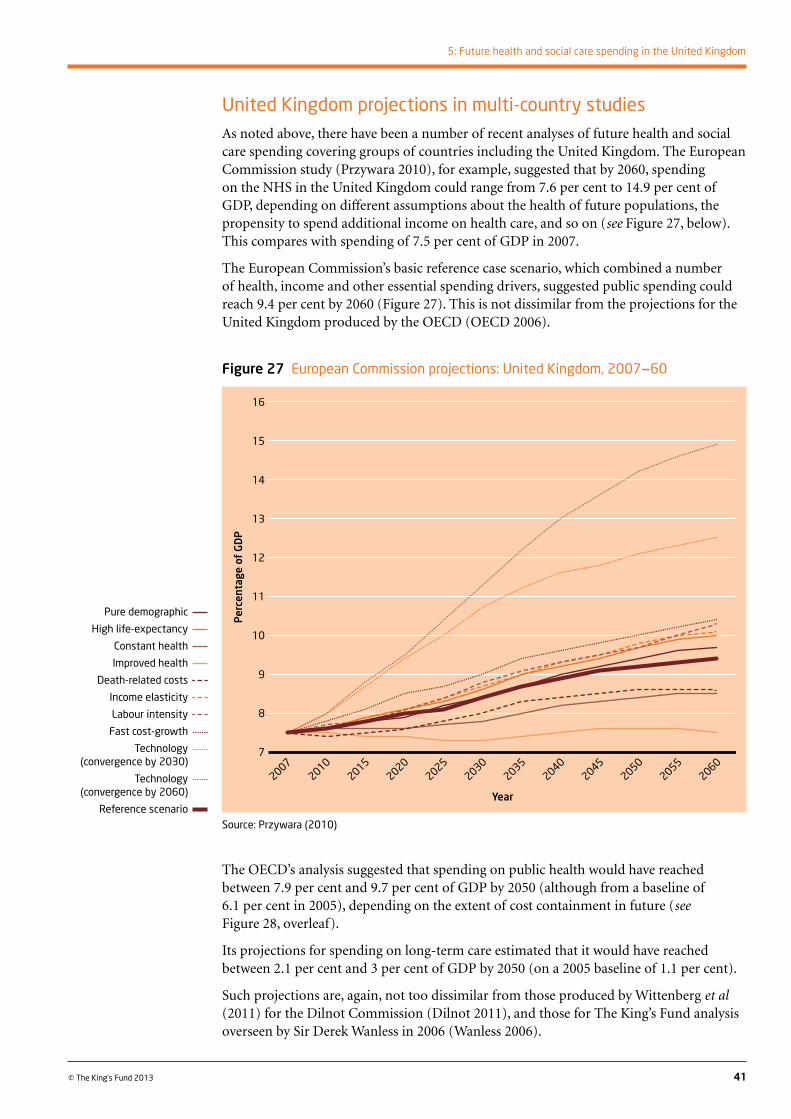
United Kingdom projections in multi-country studiesAs noted above, there have been a number of recent analyses of future health and social care spending covering groups of countries including the United Kingdom. The European Commission study (Przywara 2010), for example, suggested that by 2060, spending on the NHS in the United Kingdom could range from 7.6 per cent to 14.9 per cent of GDP, depending on different assumptions about the health of future populations, the propensity to spend additional income on health care, and so on (see Figure 27, below). This compares with spending of 7.5 per cent of GDP in 2007.
The European Commission’s basic reference case scenario, which combined a number of health, income and other essential spending drivers, suggested public spending could reach 9.4 per cent by 2060 (Figure 27). This is not dissimilar from the projections for the United Kingdom produced by the OECD (OECD 2006).
41
5: Future health and social care spending in the United Kingdom
© The King’s Fund 2013
The OECD’s analysis suggested that spending on public health would have reached between 7.9 per cent and 9.7 per cent of GDP by 2050 (although from a baseline of 6.1 per cent in 2005), depending on the extent of cost containment in future (see Figure 28, overleaf).
Its projections for spending on long-term care estimated that it would have reached between 2.1 per cent and 3 per cent of GDP by 2050 (on a 2005 baseline of 1.1 per cent).
Such projections are, again, not too dissimilar from those produced by Wittenberg et al (2011) for the Dilnot Commission (Dilnot 2011), and those for The King’s Fund analysis overseen by Sir Derek Wanless in 2006 (Wanless 2006).
Figure 27 European Commission projections: United Kingdom, 2007–60
Source: Przywara (2010)
16
15
14
13
12
11
10
9
8
7
Per
cent
age
of G
DP
20072010
20152035
20202025
20302040
20602045
20502055
Year
Pure demographic
High life-expectancy
Constant health
Improved health
Death-related costs
Income elasticity
Labour intensity
Fast cost-growth
Technology (convergence by 2030)
Technology (convergence by 2060)
Reference scenario
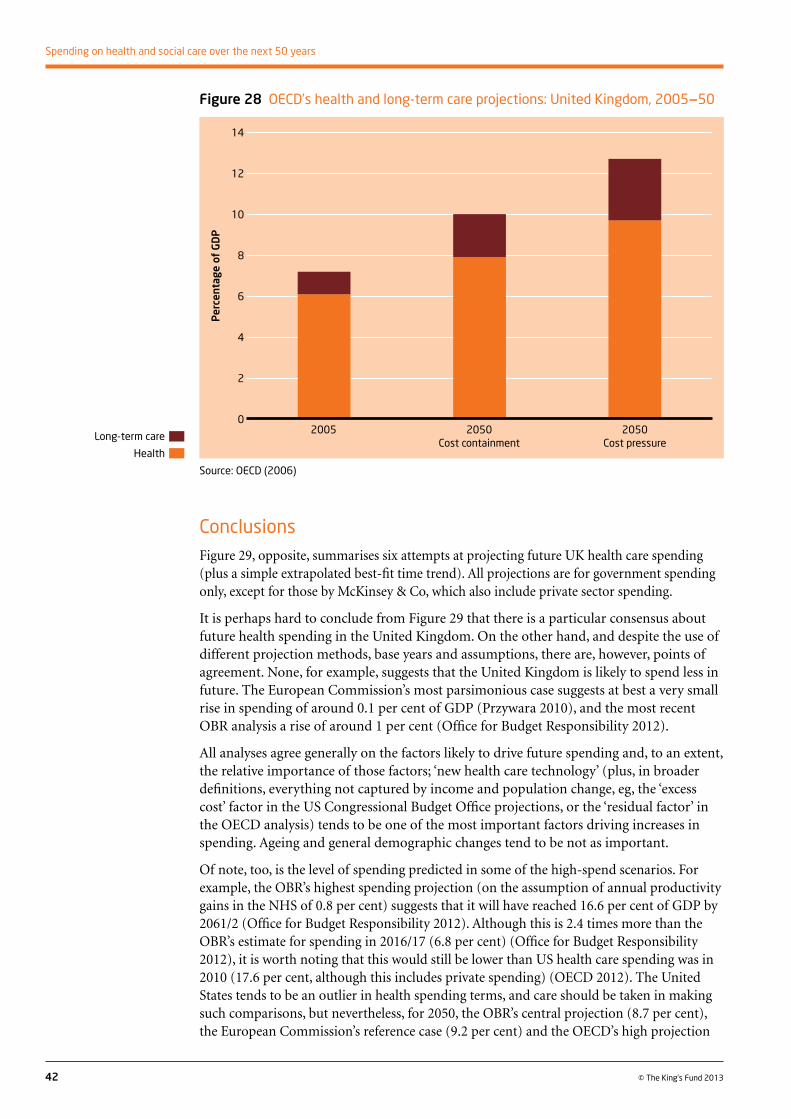
ConclusionsFigure 29, opposite, summarises six attempts at projecting future UK health care spending (plus a simple extrapolated best-fit time trend). All projections are for government spending only, except for those by McKinsey & Co, which also include private sector spending.
It is perhaps hard to conclude from Figure 29 that there is a particular consensus about future health spending in the United Kingdom. On the other hand, and despite the use of different projection methods, base years and assumptions, there are, however, points of agreement. None, for example, suggests that the United Kingdom is likely to spend less in future. The European Commission’s most parsimonious case suggests at best a very small rise in spending of around 0.1 per cent of GDP (Przywara 2010), and the most recent OBR analysis a rise of around 1 per cent (Office for Budget Responsibility 2012).
All analyses agree generally on the factors likely to drive future spending and, to an extent, the relative importance of those factors; ‘new health care technology’ (plus, in broader definitions, everything not captured by income and population change, eg, the ‘excess cost’ factor in the US Congressional Budget Office projections, or the ‘residual factor’ in the OECD analysis) tends to be one of the most important factors driving increases in spending. Ageing and general demographic changes tend to be not as important.
Of note, too, is the level of spending predicted in some of the high-spend scenarios. For example, the OBR’s highest spending projection (on the assumption of annual productivity gains in the NHS of 0.8 per cent) suggests that it will have reached 16.6 per cent of GDP by 2061/2 (Office for Budget Responsibility 2012). Although this is 2.4 times more than the OBR’s estimate for spending in 2016/17 (6.8 per cent) (Office for Budget Responsibility 2012), it is worth noting that this would still be lower than US health care spending was in 2010 (17.6 per cent, although this includes private spending) (OECD 2012). The United States tends to be an outlier in health spending terms, and care should be taken in making such comparisons, but nevertheless, for 2050, the OBR’s central projection (8.7 per cent), the European Commission’s reference case (9.2 per cent) and the OECD’s high projection
42 © The King’s Fund 2013
Spending on health and social care over the next 50 years
Figure 28 OECD’s health and long-term care projections: United Kingdom, 2005–50
Source: OECD (2006)
14
12
10
8
6
4
2
0
Per
cent
age
of G
DP
2005 2050 2050 Cost containment Cost pressure
Long-term care
Health
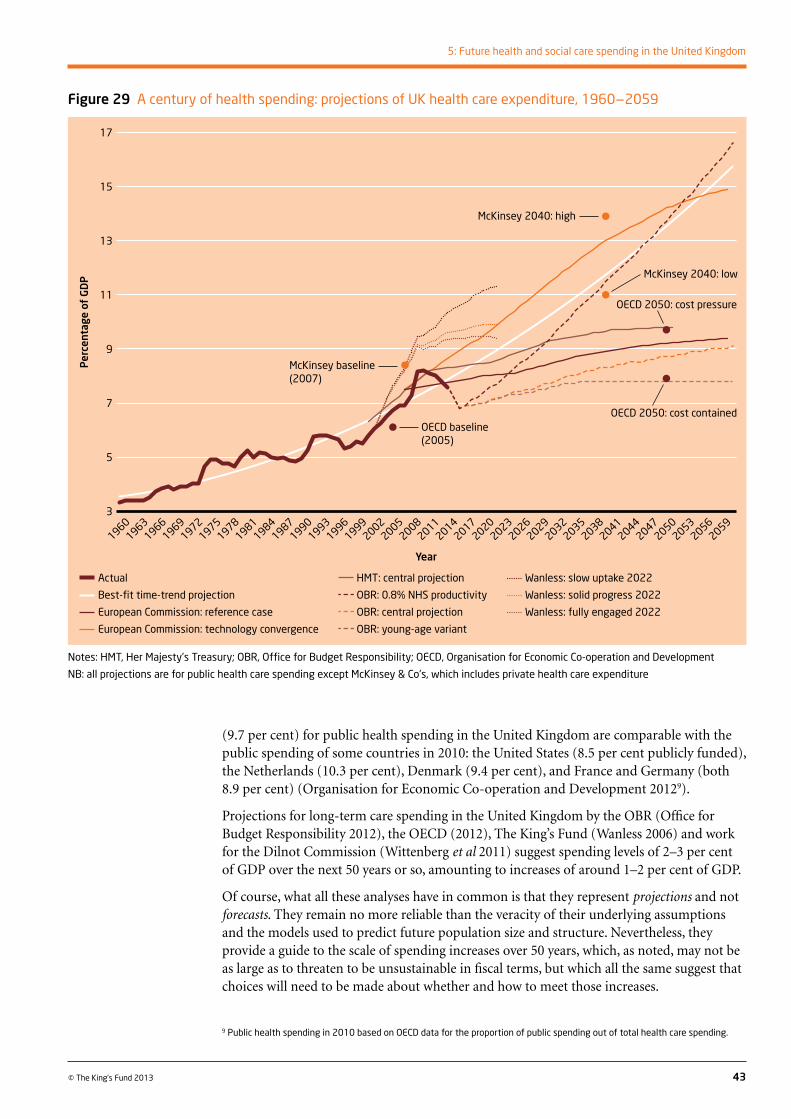
HMT: central projection
OBR: 0.8% NHS productivity
OBR: central projection
OBR: young-age variant
(9.7 per cent) for public health spending in the United Kingdom are comparable with the public spending of some countries in 2010: the United States (8.5 per cent publicly funded), the Netherlands (10.3 per cent), Denmark (9.4 per cent), and France and Germany (both 8.9 per cent) (Organisation for Economic Co-operation and Development 20129).
Projections for long-term care spending in the United Kingdom by the OBR (Office for Budget Responsibility 2012), the OECD (2012), The King’s Fund (Wanless 2006) and work for the Dilnot Commission (Wittenberg et al 2011) suggest spending levels of 2–3 per cent of GDP over the next 50 years or so, amounting to increases of around 1–2 per cent of GDP.
Of course, what all these analyses have in common is that they represent projections and not forecasts. They remain no more reliable than the veracity of their underlying assumptions and the models used to predict future population size and structure. Nevertheless, they provide a guide to the scale of spending increases over 50 years, which, as noted, may not be as large as to threaten to be unsustainable in fiscal terms, but which all the same suggest that choices will need to be made about whether and how to meet those increases.
43
5: Future health and social care spending in the United Kingdom
© The King’s Fund 2013
Figure 29 A century of health spending: projections of UK health care expenditure, 1960–2059
Notes: HMT, Her Majesty’s Treasury; OBR, Office for Budget Responsibility; OECD, Organisation for Economic Co-operation and Development
NB: all projections are for public health care spending except McKinsey & Co’s, which includes private health care expenditure
17
15
13
11
9
7
5
3
Per
cent
age
of G
DP
19601972
19631966
19691975
19871978
19811984
19902008
19931996
20022014
20382020
20262032
Year
Actual
Best-fit time-trend projection
European Commission: reference case
European Commission: technology convergence
9 Public health spending in 2010 based on OECD data for the proportion of public spending out of total health care spending.
20171999
20052011
20232044
20292035
20412047
20592050
20532056
McKinsey baseline (2007)
OECD baseline (2005)
McKinsey 2040: high
McKinsey 2040: low
OECD 2050: cost pressure
OECD 2050: cost contained
Wanless: slow uptake 2022
Wanless: solid progress 2022
Wanless: fully engaged 2022
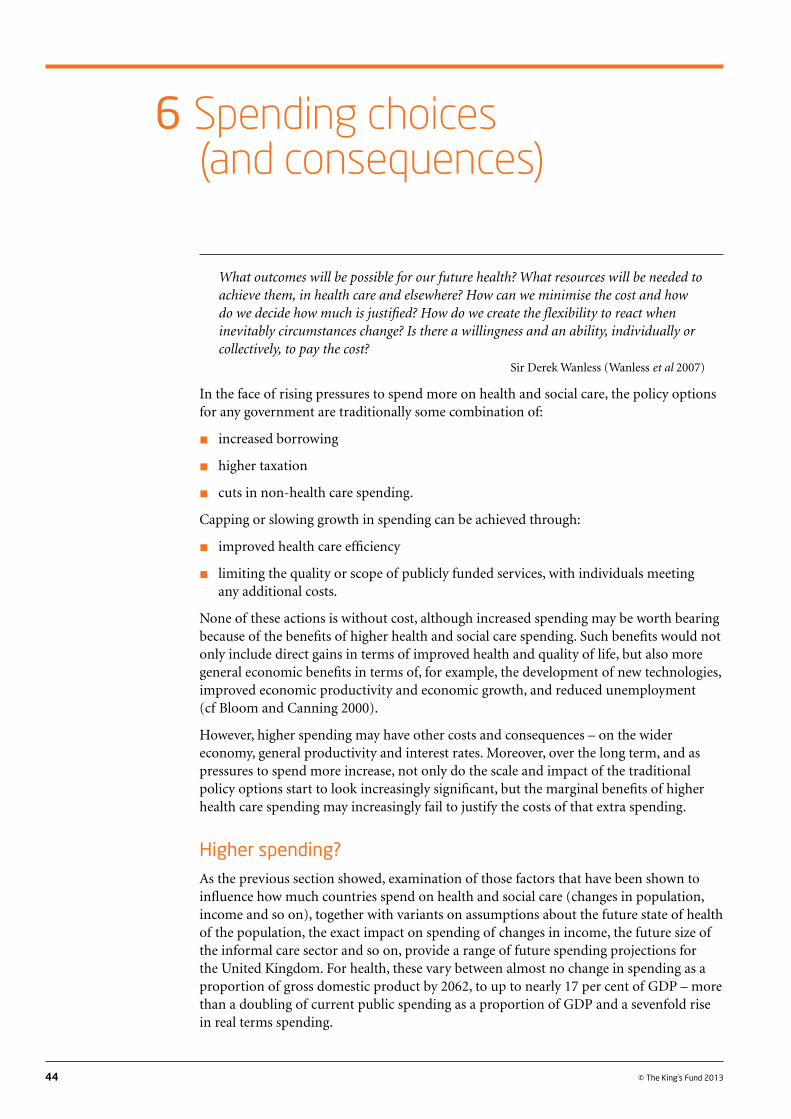
44 © The King’s Fund 2013
What outcomes will be possible for our future health? What resources will be needed to achieve them, in health care and elsewhere? How can we minimise the cost and how do we decide how much is justified? How do we create the flexibility to react when inevitably circumstances change? Is there a willingness and an ability, individually or collectively, to pay the cost?
Sir Derek Wanless (Wanless et al 2007)
In the face of rising pressures to spend more on health and social care, the policy options for any government are traditionally some combination of:
n increased borrowing
n higher taxation
n cuts in non-health care spending.
Capping or slowing growth in spending can be achieved through:
n improved health care efficiency
n limiting the quality or scope of publicly funded services, with individuals meeting any additional costs.
None of these actions is without cost, although increased spending may be worth bearing because of the benefits of higher health and social care spending. Such benefits would not only include direct gains in terms of improved health and quality of life, but also more general economic benefits in terms of, for example, the development of new technologies, improved economic productivity and economic growth, and reduced unemployment (cf Bloom and Canning 2000).
However, higher spending may have other costs and consequences – on the wider economy, general productivity and interest rates. Moreover, over the long term, and as pressures to spend more increase, not only do the scale and impact of the traditional policy options start to look increasingly significant, but the marginal benefits of higher health care spending may increasingly fail to justify the costs of that extra spending.
Higher spending?As the previous section showed, examination of those factors that have been shown to influence how much countries spend on health and social care (changes in population, income and so on), together with variants on assumptions about the future state of health of the population, the exact impact on spending of changes in income, the future size of the informal care sector and so on, provide a range of future spending projections for the United Kingdom. For health, these vary between almost no change in spending as a proportion of gross domestic product by 2062, to up to nearly 17 per cent of GDP – more than a doubling of current public spending as a proportion of GDP and a sevenfold rise in real terms spending.
Spending choices (and consequences)
6
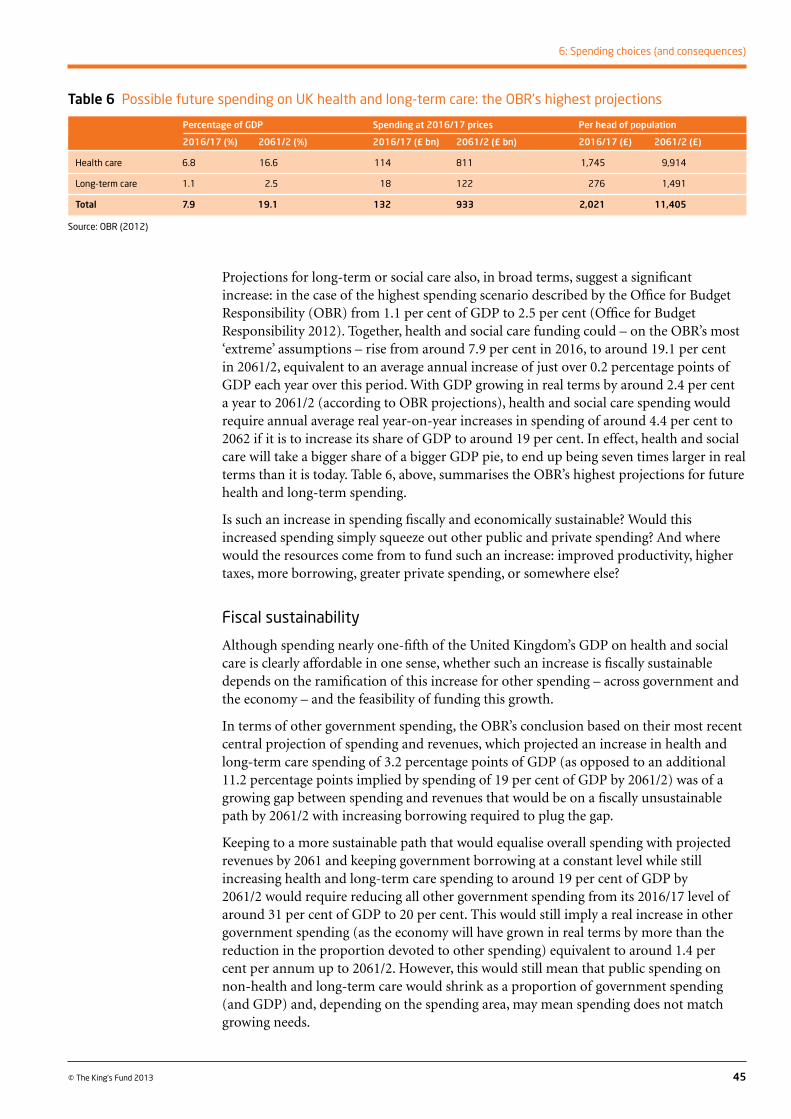
Projections for long-term or social care also, in broad terms, suggest a significant increase: in the case of the highest spending scenario described by the Office for Budget Responsibility (OBR) from 1.1 per cent of GDP to 2.5 per cent (Office for Budget Responsibility 2012). Together, health and social care funding could – on the OBR’s most ‘extreme’ assumptions – rise from around 7.9 per cent in 2016, to around 19.1 per cent in 2061/2, equivalent to an average annual increase of just over 0.2 percentage points of GDP each year over this period. With GDP growing in real terms by around 2.4 per cent a year to 2061/2 (according to OBR projections), health and social care spending would require annual average real year-on-year increases in spending of around 4.4 per cent to 2062 if it is to increase its share of GDP to around 19 per cent. In effect, health and social care will take a bigger share of a bigger GDP pie, to end up being seven times larger in real terms than it is today. Table 6, above, summarises the OBR’s highest projections for future health and long-term spending.
Is such an increase in spending fiscally and economically sustainable? Would this increased spending simply squeeze out other public and private spending? And where would the resources come from to fund such an increase: improved productivity, higher taxes, more borrowing, greater private spending, or somewhere else?
Fiscal sustainability
Although spending nearly one-fifth of the United Kingdom’s GDP on health and social care is clearly affordable in one sense, whether such an increase is fiscally sustainable depends on the ramification of this increase for other spending – across government and the economy – and the feasibility of funding this growth.
In terms of other government spending, the OBR’s conclusion based on their most recent central projection of spending and revenues, which projected an increase in health and long-term care spending of 3.2 percentage points of GDP (as opposed to an additional 11.2 percentage points implied by spending of 19 per cent of GDP by 2061/2) was of a growing gap between spending and revenues that would be on a fiscally unsustainable path by 2061/2 with increasing borrowing required to plug the gap.
Keeping to a more sustainable path that would equalise overall spending with projected revenues by 2061 and keeping government borrowing at a constant level while still increasing health and long-term care spending to around 19 per cent of GDP by 2061/2 would require reducing all other government spending from its 2016/17 level of around 31 per cent of GDP to 20 per cent. This would still imply a real increase in other government spending (as the economy will have grown in real terms by more than the reduction in the proportion devoted to other spending) equivalent to around 1.4 per cent per annum up to 2061/2. However, this would still mean that public spending on non-health and long-term care would shrink as a proportion of government spending (and GDP) and, depending on the spending area, may mean spending does not match growing needs.
45
6: Spending choices (and consequences)
© The King’s Fund 2013
Table 6 Possible future spending on UK health and long-term care: the OBR’s highest projections
Percentage of GDP Spending at 2016/17 prices Per head of population
2016/17 (%) 2061/2 (%) 2016/17 (£ bn) 2061/2 (£ bn) 2016/17 (£) 2061/2 (£)
Health care 6.8 16.6 114 811 1,745 9,914
Long-term care 1.1 2.5 18 122 276 1,491
Total 7.9 19.1 132 933 2,021 11,405
Source: OBR (2012)
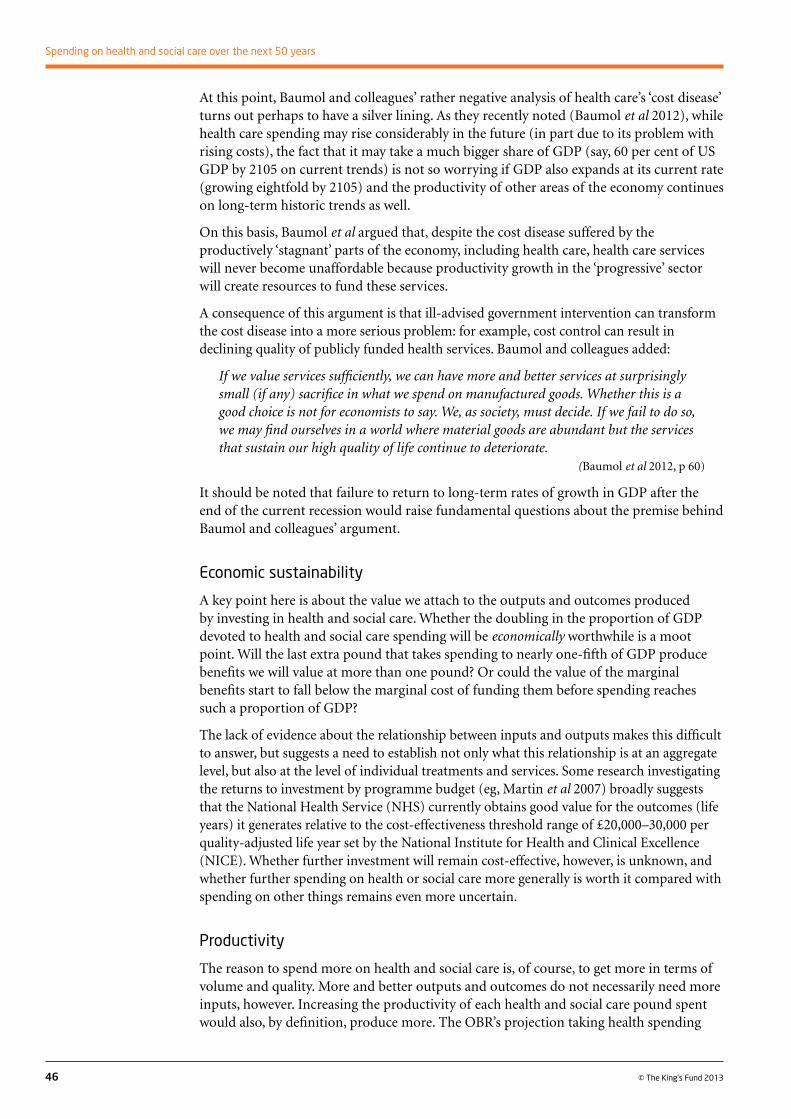
At this point, Baumol and colleagues’ rather negative analysis of health care’s ‘cost disease’ turns out perhaps to have a silver lining. As they recently noted (Baumol et al 2012), while health care spending may rise considerably in the future (in part due to its problem with rising costs), the fact that it may take a much bigger share of GDP (say, 60 per cent of US GDP by 2105 on current trends) is not so worrying if GDP also expands at its current rate (growing eightfold by 2105) and the productivity of other areas of the economy continues on long-term historic trends as well.
On this basis, Baumol et al argued that, despite the cost disease suffered by the productively ‘stagnant’ parts of the economy, including health care, health care services will never become unaffordable because productivity growth in the ‘progressive’ sector will create resources to fund these services.
A consequence of this argument is that ill-advised government intervention can transform the cost disease into a more serious problem: for example, cost control can result in declining quality of publicly funded health services. Baumol and colleagues added:
If we value services sufficiently, we can have more and better services at surprisingly small (if any) sacrifice in what we spend on manufactured goods. Whether this is a good choice is not for economists to say. We, as society, must decide. If we fail to do so, we may find ourselves in a world where material goods are abundant but the services that sustain our high quality of life continue to deteriorate.
(Baumol et al 2012, p 60)
It should be noted that failure to return to long-term rates of growth in GDP after the end of the current recession would raise fundamental questions about the premise behind Baumol and colleagues’ argument.
Economic sustainability
A key point here is about the value we attach to the outputs and outcomes produced by investing in health and social care. Whether the doubling in the proportion of GDP devoted to health and social care spending will be economically worthwhile is a moot point. Will the last extra pound that takes spending to nearly one-fifth of GDP produce benefits we will value at more than one pound? Or could the value of the marginal benefits start to fall below the marginal cost of funding them before spending reaches such a proportion of GDP?
The lack of evidence about the relationship between inputs and outputs makes this difficult to answer, but suggests a need to establish not only what this relationship is at an aggregate level, but also at the level of individual treatments and services. Some research investigating the returns to investment by programme budget (eg, Martin et al 2007) broadly suggests that the National Health Service (NHS) currently obtains good value for the outcomes (life years) it generates relative to the cost-effectiveness threshold range of £20,000–30,000 per quality-adjusted life year set by the National Institute for Health and Clinical Excellence (NICE). Whether further investment will remain cost-effective, however, is unknown, and whether further spending on health or social care more generally is worth it compared with spending on other things remains even more uncertain.
Productivity
The reason to spend more on health and social care is, of course, to get more in terms of volume and quality. More and better outputs and outcomes do not necessarily need more inputs, however. Increasing the productivity of each health and social care pound spent would also, by definition, produce more. The OBR’s projection taking health spending
46 © The King’s Fund 2013
Spending on health and social care over the next 50 years
to 16.6 per cent of GDP by 2061/2, for example, assumes annual productivity gains in the NHS of just 0.8 per cent per year (OBR 2012). Higher productivity would reduce the need to spend so much more, while maintaining improvements in volume and quality.
Although improvements in productivity will offset some of the need to spend more, experience suggests that it is likely to account for only a relatively small proportion of the spending increase. As Figure 30, above, suggests, even the short-term productivity challenge for the English NHS looks daunting compared with historic achievements.
Taxation and other government spending
Sticking with assumptions about total government spending, receipts and, therefore, borrowing, revenues would increase enough over the period to 2061/2 to cover additional health and social care spending of 19 per cent of GDP plus additional real spending in all other government expenditure without any increase in tax rates. However, as noted above, this would still mean that public spending on non-health and long-term care would shrink significantly as a proportion of total government expenditure and, depending on the spending area, could mean spending did not match growing needs.
Maintaining all other levels of spending, however, and funding all extra spending through taxation (rather than, say, borrowing), would require a significant increase in tax rates, as identified by a joint analysis on future funding of the NHS by The King’s Fund and the Institute for Fiscal Studies (IFS) (Appleby et al 2009), and updated by the IFS
47
6: Spending choices (and consequences)
© The King’s Fund 2013
Figure 30 Productivity trends in the UK NHS
Note: the size of the circles is in proportion to the size of the gain/loss in productivity
Sources: data for 1995–2008 from Peñaloza et al 2010; data for 2009–10 are estimates by The King’s Fund
240
220
200
180
160
140
120
100
What went into the NHS: inputs (1995 = 100)
Wha
t th
e N
HS
prod
uced
: qua
lity-
adju
sted
out
puts
(19
95
= 1
00
)
Positive annual productivity gain
Negative annual productivity gain
100 120 140 160 180 200 220 240
5% Average annual
productivity gain
–0.2% Average annual
productivity gain achieved 1995–2010
2005
2010
2000
2011
2014
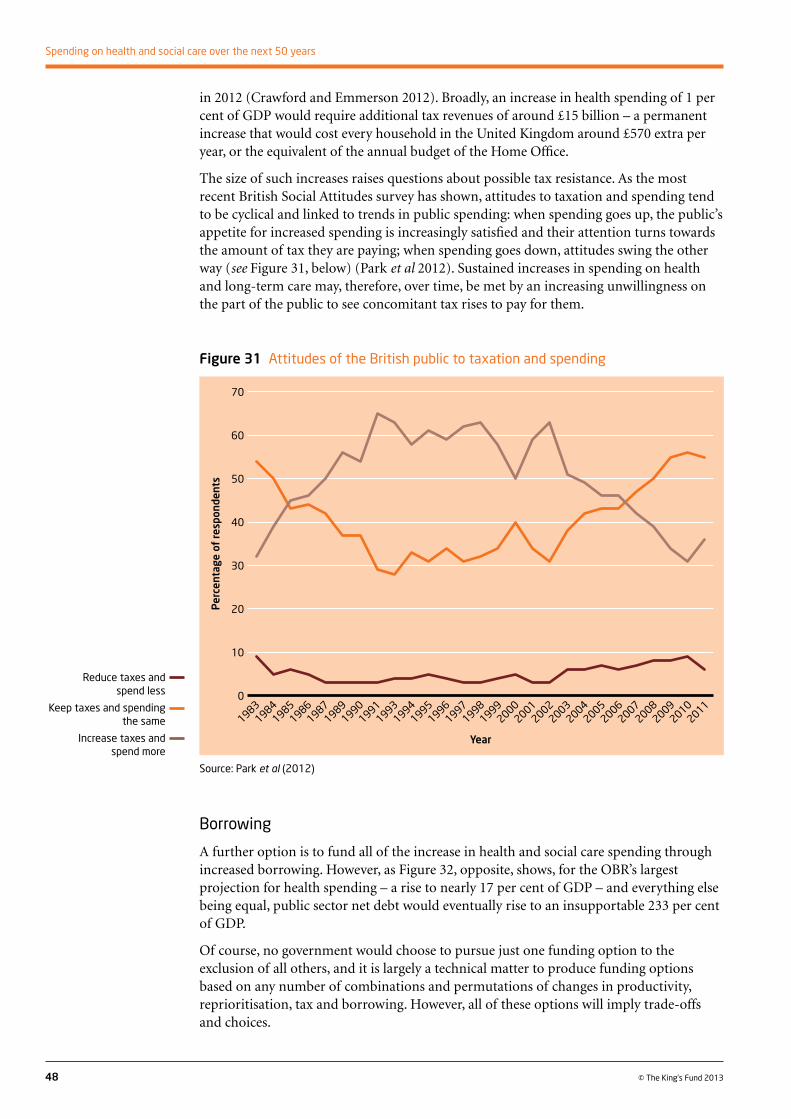
in 2012 (Crawford and Emmerson 2012). Broadly, an increase in health spending of 1 per cent of GDP would require additional tax revenues of around £15 billion – a permanent increase that would cost every household in the United Kingdom around £570 extra per year, or the equivalent of the annual budget of the Home Office.
The size of such increases raises questions about possible tax resistance. As the most recent British Social Attitudes survey has shown, attitudes to taxation and spending tend to be cyclical and linked to trends in public spending: when spending goes up, the public’s appetite for increased spending is increasingly satisfied and their attention turns towards the amount of tax they are paying; when spending goes down, attitudes swing the other way (see Figure 31, below) (Park et al 2012). Sustained increases in spending on health and long-term care may, therefore, over time, be met by an increasing unwillingness on the part of the public to see concomitant tax rises to pay for them.
48 © The King’s Fund 2013
Spending on health and social care over the next 50 years
Figure 31 Attitudes of the British public to taxation and spending
Source: Park et al (2012)
70
60
50
40
30
20
10
0
Per
cent
age
of re
spon
dent
s
19831984
19871985
19861989
19901991
19931999
19981995
19941997
19962001
20002011
20102009
20082003
20022005
20042007
2006
Year
Borrowing
A further option is to fund all of the increase in health and social care spending through increased borrowing. However, as Figure 32, opposite, shows, for the OBR’s largest projection for health spending – a rise to nearly 17 per cent of GDP – and everything else being equal, public sector net debt would eventually rise to an insupportable 233 per cent of GDP.
Of course, no government would choose to pursue just one funding option to the exclusion of all others, and it is largely a technical matter to produce funding options based on any number of combinations and permutations of changes in productivity, reprioritisation, tax and borrowing. However, all of these options will imply trade-offs and choices.
Reduce taxes and spend less
Keep taxes and spending the same
Increase taxes and spend more
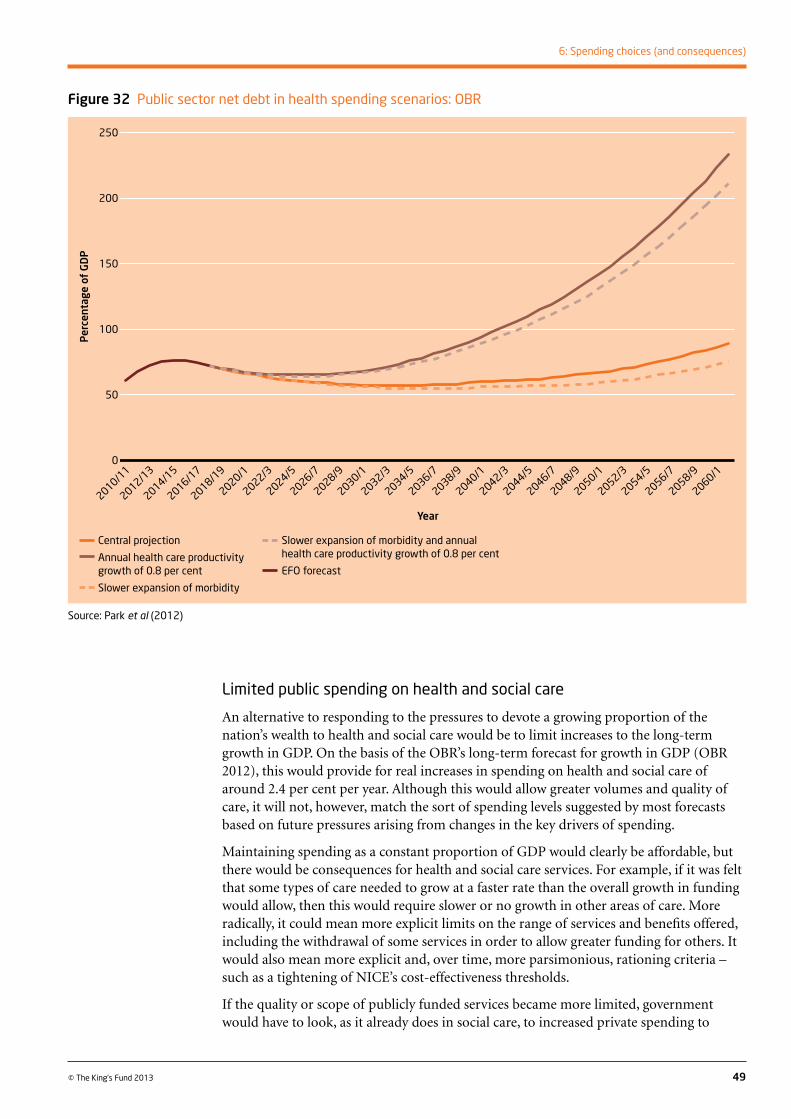
Limited public spending on health and social care
An alternative to responding to the pressures to devote a growing proportion of the nation’s wealth to health and social care would be to limit increases to the long-term growth in GDP. On the basis of the OBR’s long-term forecast for growth in GDP (OBR 2012), this would provide for real increases in spending on health and social care of around 2.4 per cent per year. Although this would allow greater volumes and quality of care, it will not, however, match the sort of spending levels suggested by most forecasts based on future pressures arising from changes in the key drivers of spending.
Maintaining spending as a constant proportion of GDP would clearly be affordable, but there would be consequences for health and social care services. For example, if it was felt that some types of care needed to grow at a faster rate than the overall growth in funding would allow, then this would require slower or no growth in other areas of care. More radically, it could mean more explicit limits on the range of services and benefits offered, including the withdrawal of some services in order to allow greater funding for others. It would also mean more explicit and, over time, more parsimonious, rationing criteria – such as a tightening of NICE’s cost-effectiveness thresholds.
If the quality or scope of publicly funded services became more limited, government would have to look, as it already does in social care, to increased private spending to
49
6: Spending choices (and consequences)
© The King’s Fund 2013
Figure 32 Public sector net debt in health spending scenarios: OBR
Source: Park et al (2012)
250
200
150
100
50
0
Per
cent
age
of G
DP
2014/15
Year
2018/19
2022/3
2026/7
2030/1
2034/5
2016/17
2020/1
2024/5
2028/9
2032/3
2036/7
2038/9
2042/3
2046/7
2050/1
2054/5
2058/9
2040/1
2044/5
2048/9
2052/3
2056/7
2060/1
2010/11
2012/13
Central projection
Annual health care productivity growth of 0.8 per cent
Slower expansion of morbidity
Slower expansion of morbidity and annual health care productivity growth of 0.8 per cent
EFO forecast
fill the gap between demand for health care and its cost. This would involve some combination of increased use of private health insurance and additional user charges.
However, moving away from (or supplementing) general taxation as the main source of funding risks problems in terms of the efficiency of collection, the amount that can be raised, the fairness of the funding, and the consequences for equity of access to care.
ConclusionsAs in the past, future spending trends will be the outcome of policy choices, decisions that reflect a complex mix of political and macro-economic circumstances. These decisions will be based in part on changing health care needs, wants and desires, but also on changes in the unit costs of providing care relative to inflation in the economy as a whole, and the capacity of health and social care services to generate productivity gains. Future spending levels and the sources of spending are therefore not primarily technical matters but need to involve public debate and deliberation. This debate should draw on evidence from both the United Kingdom and other countries about the consequences of different decisions on people with different incomes and the impact on the use of the NHS and long-term care.
Overall, taking the OBR’s highest health and social care projection – more than doubling spending on health and social care from around 8 per cent of GDP to more than 19 per cent by 2061/2 (higher than the upper scenarios from studies by the European Commission and the Organisation for Economic Co-operation and Development) – as illustrative, suggests such spending could be fiscally sustainable. However, financing such growth would require choices to be made about the acceptable level of impact on other government spending, taxation rates, patient/user charges, and so on. It also assumes that there will be a return to long-term rates of growth in GDP after the end of the current recession.
Even though other government spending could rise in real terms, such spending would need to be weighed against the need to increase the share of GDP – for state pensions, in particular – projected by the OBR. In other words, although there would be room for spending growth, it might not be enough to cover the increased pressures of demand.
Moreover, as spending rises, diminishing returns are likely to set in and at some point the additional cost could exceed either the additional health benefit, or the benefits of spending on non-health and social care services.
All of this implies that there are important political and social choices to be made, not only about the aggregate of spending from the public purse, but also the types and volumes of services that should be provided and how they should be funded. If GDP growth continues to be sluggish over a prolonged period, then these choices will become much more difficult.
The choice of not responding to growing pressures to spend more would also have consequences. The growth in public spending could be limited to the growth in real GDP over time, for example, through tighter rationing criteria and/or more explicit limits on what the NHS and social care systems offer to patients and users.
50 © The King’s Fund 2013
Spending on health and social care over the next 50 years
Policy recommendationsBroadly, grappling with these issues requires the carrying out of regular projections of possible future spending pressures to assess the scale of future spending paths. This review suggests two sets of policy conclusions: the first concerns the possibilities for developing and refining the analytical basis of future projections; and the second the policy options arising from those projections.
Analytical basis of projections
n Given the scale of spending on health and social care now, and the likely pressures to spend even more in future, there is a clear need to carry out regular studies of these pressures to assess the long-term fiscal sustainability of such spending.
n There is room to improve and widen the scope of the projection methodologies used (while recognising the limits of uncertainty involved in such long-term projections), such as assessing the possible impact on spending of changes in government policy, which are held constant in most projection studies. Moreover, as more evidence accumulates about the detailed relationship between population ageing and future health status, and therefore the possible future pressures on spending, projection models will need to be updated.
n Although the annual projections produced by the OBR as part of its analysis of fiscal sustainability provide a very useful high-level view of possible futures, there is a need to carry out a more detailed investigation from time to time – possibly every five years – along the lines of the 2002 analysis overseen by Sir Derek Wanless (Wanless 2002). This could also explore more detailed projections at, for example, a disease level (similar to the 2008 study for Australia [Goss 2008]). This would provide useful information to help inform the way patterns of spending might change within future health care budgets.
Spending policy choices
n Although better projection models will provide better information about future spending pressures, there seems little doubt that the pressure will be to spend more. There is a need therefore to understand both the consequences of higher spending and the options available to meet such spending pressures.
n To inform public debate, policy options should include the quantification of possible trade-offs with other government spending. They should also consider the scale of the possible impact on tax and borrowing. Analysis of the distributional, access and health consequences of any moves to change the funding base of the NHS and long-term care need to be part of this debate.
n Of great importance is the need to assess the economic sustainability of increased spending more thoroughly. Although much higher spending over the long term may be affordable, more is not necessarily better, either in the aggregate or, more particularly, in terms of what the global budget is spent on. Although NICE aims to assess the latter, there is also a need to apply a similar economic approach to additional funding overall in order to ascertain whether any extra spending is worth the cost.
51
6: Spending choices (and consequences)
© The King’s Fund 2013
52 © The King’s Fund 2013
Appleby J, Crawford R, Emmerson C (2009). How Cold Will It Be? Prospects for NHS funding: 2011–17. London: The King’s Fund/Institute for Fiscal Studies. Available at: www.kingsfund.org.uk/sites/files/kf/How-Cold-Will-It-Be-Prospects-NHS-funding-2011-2017-John-Appleby-Roweena%20Crawford-Carl-Emmerson-The-Kings-Fund-July-2009.pdf (accessed on 5 December 2012).
Appleby J, Harrison A (2008). Spending on Health Care. How much is enough? London: The King’s Fund. Available at: www.kingsfund.org.uk/sites/files/kf/field/field_publication_file/spending-health-care-how-much-is-enough-john-appleby-tony-harrison-kings-fund-9-february-2006.pdf (accessed on 20 December 2012).
Appleby J, Lee L (2012). ‘Health care in Britain: is there a problem, and what needs to change?’ in Park A, Clery E, Curtice J, Phillips M, Utting D (eds), British Social Attitudes: the 29th Report. London: NatCen Social Research. Available at: www.bsa-29.natcen.ac.uk/media/13421/bsa29_full_report.pdf (accessed on 5 December 2012).
Astolfi R, Lorenzoni L, Oderkirk J (2012). ‘Informing policy makers about future health spending: a comparative analysis of forecasting methods in OECD countries’. Health Policy, vol 107, no 1, pp 1–10.
Australian Government Productivity Commission (2005). Impacts of Advances in Medical Technology in Australia. Productivity Commission Research Report. Melbourne: Productivity Commission. Available at: www.pc.gov.au/__data/assets/pdf_file/0003/17193/medicaltechnology.pdf (accessed on 5 December 2012).
Australian Treasury (2007). Intergenerational Report 2007. Canberra: Commonwealth of Australia. Available at: http://archive.treasury.gov.au/documents/1239/PDF/IGR_2007_final_report.pdf (accessed on 5 December 2012).
Baumol W, Bowen W (1966). Performing Arts—The Economic Dilemma: A study of problems common to theater, opera, music, and dance. New York: 20th Century Fund.
Baumol W, de Ferranti D, Malach M, Pablos-Méndez A, Tabish H, Wu LG (2012). The Cost Disease: Why computers get cheaper and health care doesn’t. New Haven, CT: Yale University Press.
Bloom DE, Canning D (2000). ‘Policy forum: public health. The health and wealth of nations’. Science, vol 287, no 5456, pp 1207–09.
Caldis TG (2009). The Long-Term Projection Assumptions for Medicare and Aggregate National Health Expenditures. Memorandum from the Office of the Actuary/National Health Statistics Group. Baltimore: Department of Health and Human Services, Centers for Medicare and Medicaid Services. Available at: www.cms.gov/Research-Statistics-Data-and-Systems/Statistics-Trends-and-Reports/ReportsTrustFunds/downloads/projectionmethodology.pdf (accessed on 5 December 2012).
References
Canadian Health Services Research Foundation (2003). Myth: The cost of dying is an increasing strain on the healthcare system [online]. Canadian Foundation for Healthcare Improvement [formerly Canadian Health Services Research Foundation] website. Available at: www.cfhi-fcass.ca/publicationsandresources/Mythbusters/ArticleView/03-06-01/d6b0f9d9-52dd-450d-b67d-d95967f2bde2.aspx (accessed on 20 December 2012).
Centers for Medicare and Medicaid Services (2012). 2012 Annual Report of the Boards of Trustees of the Federal Hospital Insurance and Federal Supplementary Medical Insurance Trust Funds [online]. Centers for Medicare and Medicaid Services website. Available at: www.cms.gov/Research-Statistics-Data-and-Systems/Statistics-Trends-and-Reports/ReportsTrustFunds/Downloads/TR2012.pdf (accessed on 5 December 2012).
Claxton K, Palmer S, Spackman E, Bojke L, Longworth L (2012). ‘Informing a decision framework for when NICE should recommend the use of health technologies only in the context of an appropriately designed programme of evidence development’. Centre for Health Economics website. Available at: www.york.ac.uk/che/research/teehta/methodological-research/#tab-4 (accessed on 5 December 2012).
Colombier C, Weber W (2011). ‘Projecting health-care expenditure for Switzerland: further evidence against the “red-herring” hypothesis’. International Journal of Health Planning and Management, vol 26, no 3, pp 246–63 (epub 2010). Available at: http://mpra.ub.uni-muenchen.de/26745/2/MPRA_paper_26745.pdf (accessed on 5 December 2012).
Congressional Budget Office (2007). The Long-Term Outlook for Health Care Spending: Sources of growth in projected federal spending on Medicare and Medicaid. Washington DC: Congress of the United States Congressional Budget Office. Available at: www.cbo.gov/sites/default/files/cbofiles/ftpdocs/87xx/doc8758/11-13-lt-health.pdf (accessed on 5 December 2012).
Crawford R, Emmerson C (2012). NHS and Social Care Funding: The outlook to 2021/22. London: Nuffield Trust. Available at: www.nuffieldtrust.org.uk/sites/files/nuffield/publication/120704_nhs-social-care-funding-outlook-2021-22-update2.pdf (accessed on 20 December 2012).
Cutler DM (1995). Technology, Health Costs, and the NIH. Paper prepared for the National Institutes of Health Roundtable on the Economics of Biomedical Research. Cambridge, MA: Harvard University and the National Bureau of Economic Research.
Cutler DM, McClellan M (2001). ‘Is technological change in medicine worth it?’ Health Affairs, vol 20, no 5, pp 11–29.
Danish Economic Council (2009). Danish Economy: Health 2009. Copenhagen: Danish Economic Council. Available at: www.dors.dk/graphics/Synkron-Library/Publikationer/Rapporter/Efter%E5r%202009/Diskussionsopl%E6g/English%20Summary.pdf (accessed on 20 December 2012).
Dilnot A (2011). Fairer Care Funding: The Report of the Commission on Funding of Care and Support. London: Commission on Funding of Care and Support. Available at: www.dilnotcommission.dh.gov.uk/our-report/ (accessed on 5 December 2012).
Dixon J, Lewis R, Rosen R, Finlayson B, Gray D (2004). Managing chronic disease: what can we learn from the US experience? The King’s Fund: The King’s Fund. Available at: www.kingsfund.org.uk/publications/managing-chronic-disease (accessed on 14 January 2013).
53
References
© The King’s Fund 2013
Goss J (2008). Projection of Australian Health Care Expenditure by Disease, 2003 to 2033. Health and Welfare Expenditure series number 36. Canberra: Australian Institute of Health and Welfare. Available at: www.aihw.gov.au/publication-detail/?id=6442468187&tab=2 (accessed on 5 December 2012).
Her Majesty’s Treasury (2002). Long-Term Public Finance Report: An analysis of fiscal sustainability. London: HMSO. Available at: www.hm-treasury.gov.uk/d/adsustain02-394kb.PDF (accessed on 5 December 2012).
Kibasi T, Teitelbaum J, Henke N (2012). The Financial Sustainability of Health Systems: A case for change. Geneva: World Economic Forum and McKinsey & Company.
Martin S, Rice N, Smith PC (2007). Further Evidence on the Link Between Health Care Spending and Health Outcomes in England. CHE Research Paper 32. York: Centre for Health Economics, University of York. Available at: www.york.ac.uk/media/che/documents/papers/researchpapers/rp32_link_between_health_care_spending_and_health_outcomes.pdf (accessed on 5 December 2012).
Ministry of Health and Social Affairs Sweden (2010). The Future Need for Care: Results from the Lev Project. Stockholm: Ministry of Health and Social Affairs Sweden. Available at: www.government.se/futureneedforcare (accessed on 5 December 2012).
Newhouse JP (1992). ‘Medical care costs: how much welfare loss?’ Journal of Economic Perspectives, vol 6, no 3, pp 3–21.
Office for Budget Responsibility (2012). Office for Budget Responsibility: Economic and fiscal outlook. Report. Cm 8303. Norwich: The Stationery Office. Available at: http://budgetresponsibility.independent.gov.uk/wordpress/docs/March-2012-EFO1.pdf (accessed on 5 December 2012).
Office for National Statistics (2012). 2010-based National Population Projections Reference Volume: Chapter 2: Results. Series PP2. London: Office for National Statistics. Available at: www.ons.gov.uk/ons/dcp171776_253934.pdf (accessed on 5 December 2012).
Organisation for Economic Co-operation and Development (2012). ‘OECD Health Data 2012 – frequently requested data’. Organisation for Economic Co-operation and Development website. Available at: www.oecd.org/els/healthpoliciesanddata/oecdhealthdata2012-frequentlyrequesteddata.htm (accessed on 5 December 2012).
Organisation for Economic Co-operation and Development (2010). Health System Priorities when Money is Tight. OECD Health Ministerial Meeting, Paris, 7–8 October. Paris: Organisation for Economic Co-operation and Development. Available at: www.oecd.org/health/ministerial/46098466.pdf (accessed on 5 December 2012).
Organisation for Economic Co-operation and Development (2006). Projecting OECD Health And Long-Term Care Expenditures: What are the main drivers? Economics Department Working Paper no 477. Paris: Organisation for Economic Co-operation and Development. Available at: www.oecd.org/tax/publicfinanceandfiscalpolicy/36085940.pdf (accessed on 5 December 2012).
Park A, Clery E, Curtice J, Phillips M, Utting D (eds) (2012). British Social Attitudes: The 29th Report. London: NatCen Social Research. Available at: www.bsa-29.natcen.ac.uk/media/13421/bsa29_full_report.pdf (accessed on 5 December 2012).
Pedersen KM, Bech M, Vrangbæk K (2011). The Danish Health Care System: An analysis of strengths, weaknesses, opportunities and threats (SWOT analysis). Health Economics Papers 2011: 2. Odense: University of Southern Denmark. Available at: http://static.sdu.dk/mediafiles/7/5/9/%7B75984BC0-ABF1-4B47-B482-B96CF527DA39%7D20112.pdf (accessed on 5 December 2012).
54 © The King’s Fund 2013
Spending on health and social care over the next 50 years
Peñaloza M-C, Hardie M, Wild R, Mills K (2010). Public Service Output, Inputs and Productivity: Healthcare. London: UK Centre for the Measurement of Government Activity. Available at: www.ons.gov.uk/ons/rel/psa/public-service-productivity/public-service-output--input-and-productivity--healthcare/index.html (accessed on 5 December 2012).
Przywara B (2010). European Economy. Projecting Future Health Care Expenditure at European Level: Drivers, methodology and main results. Economic papers 417. Brussels: European Commission. Available at: http://ec.europa.eu/economy_finance/publications/economic_paper/2010/pdf/ecp417_en.pdf (accessed on 5 December 2012).
Seshamani M, Gray A (2004). ‘A longitudinal study of the effects of age and time to death on hospital costs’. Journal of Health Economics vol 23, pp 217–35.
Smith S, Newhouse JP, Freeland MS (2009). ‘Income, insurance, and technology: why does health spending outpace economic growth?’ Health Affairs, vol 28, no 5, pp 1276–84. Available at: http://content.healthaffairs.org/content/28/5/1276.full (accessed on 5 December 2012).
Smith SD, Heffler SK, Freeland MS (2000). ‘The impact of technological change on health care cost spending: an evaluation of the literature’. Healthcare Financing Administration. Centers for Medicare and Medicaid Services website. Available at: www.cms.gov/Research-Statistics-Data-and-Systems/Statistics-Trends-and-Reports/NationalHealthExpendData/downloads/tech_2000_0810.pdf (accessed on 20 December 2012).
Wanless D (2006). Securing Good Care for Older People: Taking a long-term view. London: The King’s Fund. Available at: www.kingsfund.org.uk/sites/files/kf/field/field_publication_file/securing-good-care-for-older-people-wanless-2006.pdf (accessed on 5 December 2012).
Wanless D (2002). Securing Our Future Health Care: Taking a long-term view. Final report. London: Her Majesty’s Treasury. Available at: http://webarchive.nationalarchives.gov.uk/+/http://www.hm-treasury.gov.uk/consult_wanless_final.htm (accessed on 5 December 2012).
Wanless D, Appleby J, Harrison A, Patel D (2007). Our Future Health Secured? A review of NHS funding and performance. London: The King’s Fund. Available at: www.kingsfund.org.uk/publications/our-future-health-secured (accessed on 5 December 2012).
Wittenberg R, Hu B, Hancock R, Morciano M, Comas- Herrera A, Malley J, King D (2011). Projections of Demand for and Costs of Social Care for Older People in England, 2010 to 2030, under Current and Alternative Funding Systems: Report of research for the Commission on Funding of Care and Support. Personal Social Services Research Unit discussion paper 2811/2. Canterbury: University of Kent. Available at: http://eprints.lse.ac.uk/40720/1/2811-2.pdf (accessed on 5 December 2012).
Zweifel P, Felder S, Meiers M (1999). ‘Ageing of population and health care expenditure: a red herring?’ Health Economics, vol 8, no 6, pp 485–96.
55
References
© The King’s Fund 2013