Embed Size (px)
Citation preview

Spending and Utilization in Medical Services – Dashboard Menu Data Parameters in Spending and Utilization for Medical Services CY 2012 Medical Spending vs. All Other Service Spending (Total: $6,091,240,210) CY 2013 Medical Spending vs. All Other Service Spending (Total: $6,335,428,003) Medical Spending: All Members, Child, Adult Member Months (MMs): All Members, Child, Adult Medical Spending: Per Member Per Month (PMPM) Cost -All Members, Child, Adult Quarterly Growth Trend for Medical Services: MMs vs. PMPM – All Members Quarterly Growth Trend for Medical Services: MMs vs. PMPM – Child Quarterly Growth Trend for Medical Services: MMs vs. PMPM – Adult Average Members in CT Medical Assistance Program Annually: All Members, Child, Adult Per Capita for Medical Only: All Members, Child, Adult Distinct Members Received Medical Services: All Members, Child, Adult Cost per Distinct Member Who Received Medical Services Medical Spending by HUSKY Program Distinct Members Who Received Services by HUSKY Program Per Member Per Month (PMPM) Cost by HUSKY Program Medical Spending by Category of Service PMPM Costs by Category Of Service Distinct Members by Category of Service Utilization Per 1000 Member Months by Category of Service CY 2012 - Spending Distribution by Category of Service CY 2013 - Spending Distribution by Category of Service Overall CY 2012 – 2013 Cost Variance by Category, Unit Cost and Utilization Impact
Source: Connecticut Department of Social Services.

Data Parameters in Spending and Utilization for Medical Services
• CY 2012 data represents claims of date of service 1/1/2012 – 12/31/2012 with Paid Run-Out of 22 months
• CY 2013 data represents claims of date of service 1/1/2013 – 12/31/2013 with Paid
Run-Out of 10 months • All data for CY 2012 & CY 2013 include claims Paid Through 10/31/2014 • All HUSKY Health, Charter Oak members, Limited Benefit members except Dual
members (i.e., members who are eligible for both Medicare and Medicaid) are included. Data does not contain a factor for Incurred But Not Reported (IBNR)
• Children defined as Age 0 to 20 • Adult defined as Age 21 and above
Source: Connecticut Department of Social Services.
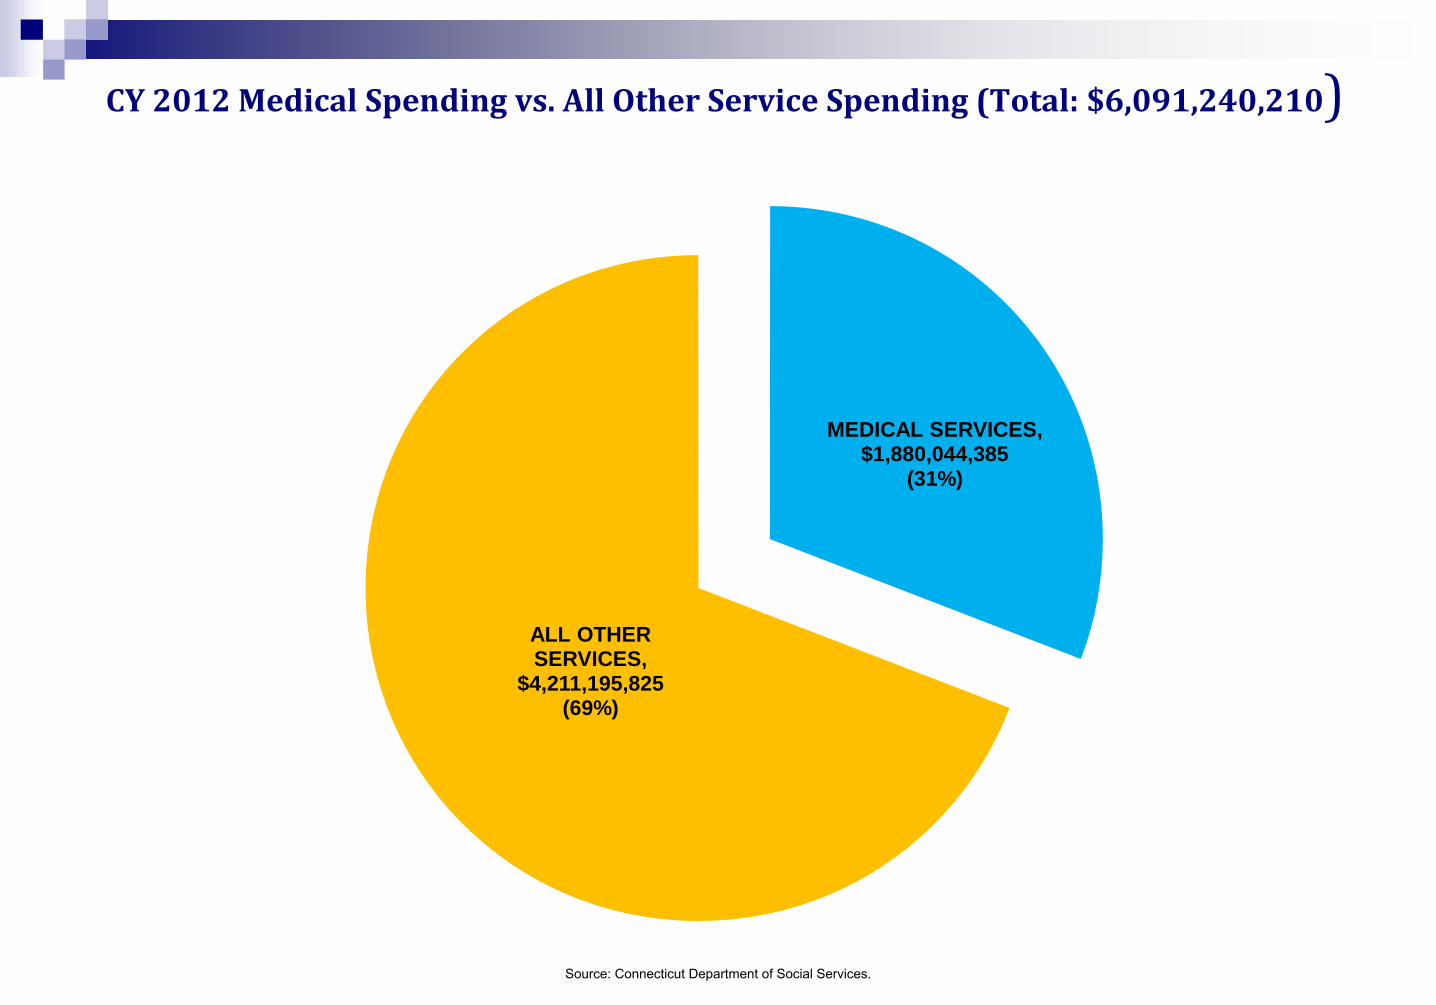
CY 2012 Medical Spending vs. All Other Service Spending (Total: $6,091,240,210)
MEDICAL SERVICES, $1,880,044,385
(31%)
ALL OTHER SERVICES,
$4,211,195,825 (69%)
Source: Connecticut Department of Social Services.

CY 2013 Medical Spending vs. All Other Service Spending (Total: $6,335,428,003)
MEDICAL SERVICES, $2,033,514,311
(32%)
ALL OTHER SERVICES, $4,301,913,692
(68%)
Source: Connecticut Department of Social Services.
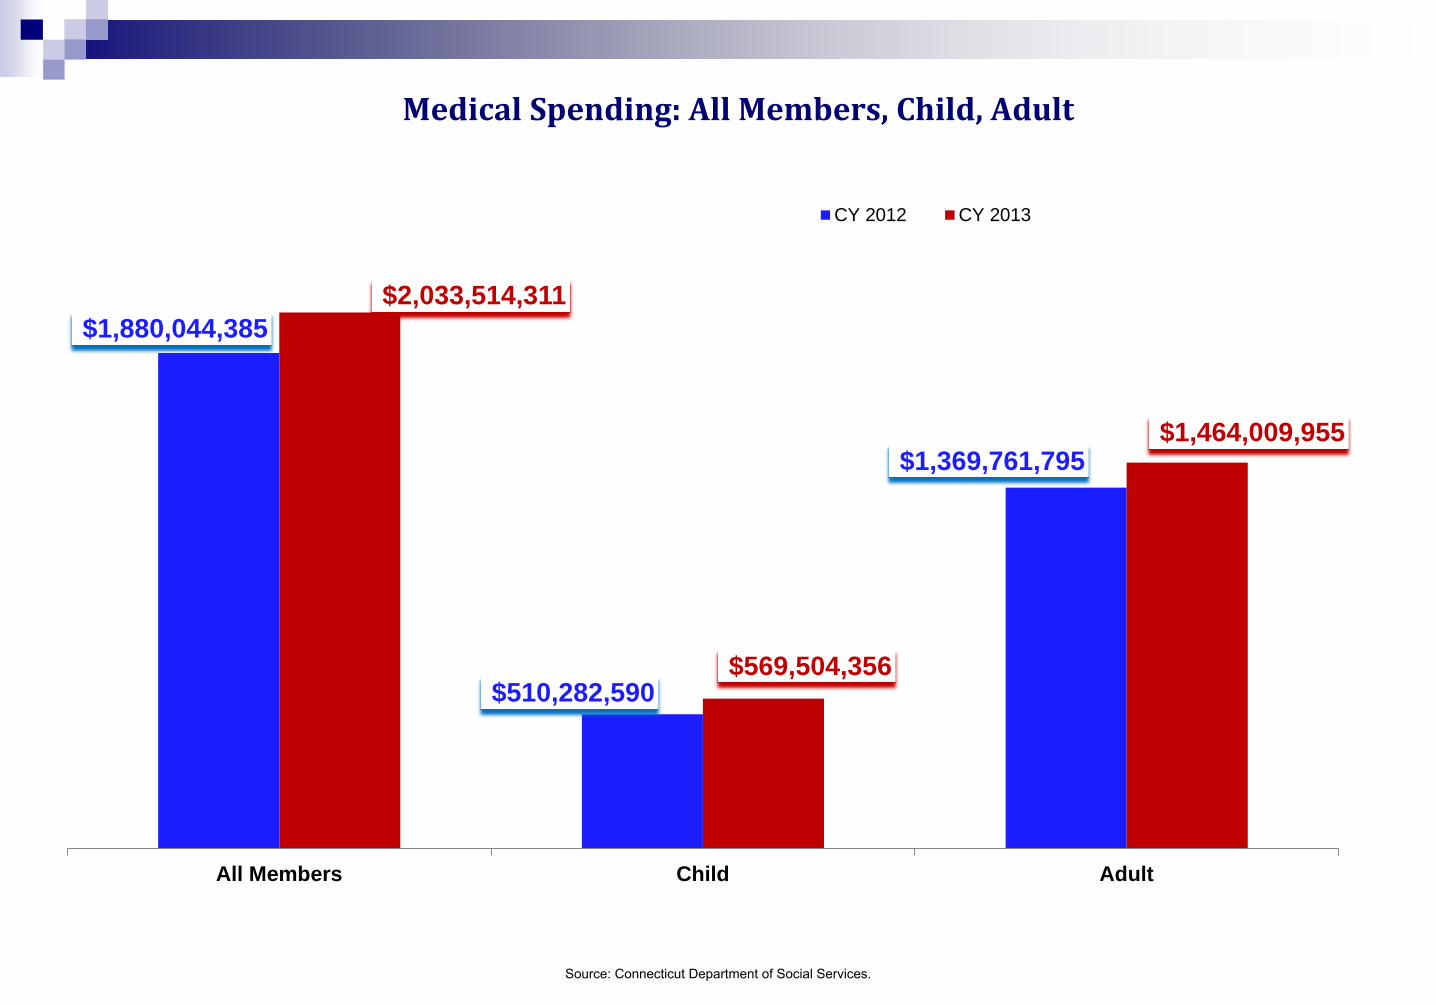
Medical Spending: All Members, Child, Adult
$1,880,044,385
$510,282,590
$1,369,761,795
$2,033,514,311
$569,504,356
$1,464,009,955
All Members Child Adult
CY 2012 CY 2013
Source: Connecticut Department of Social Services.

Member Months (MMS): All Members, Child, Adult (*Member Months defined as cumulative members in a year counting each member enrolled in each month)
7,877,907
3,546,989
4,330,918
8,153,146
3,739,251
4,413,895
0
1,000,000
2,000,000
3,000,000
4,000,000
5,000,000
6,000,000
7,000,000
8,000,000
9,000,000
All Members Child Adult
CY 2012 CY 2013
Source: Connecticut Department of Social Services.

Medical Spending: Per Member Per Month Cost – All, Child, Adult (*Per Member Per Month (PMPM) = Total Cost divided by Total Member Months)
$239
$144
$316
$249
$152
$332
All PMPM Child PMPM Adult PMPM
CY 2012 CY 2013
Source: Connecticut Department of Social Services.
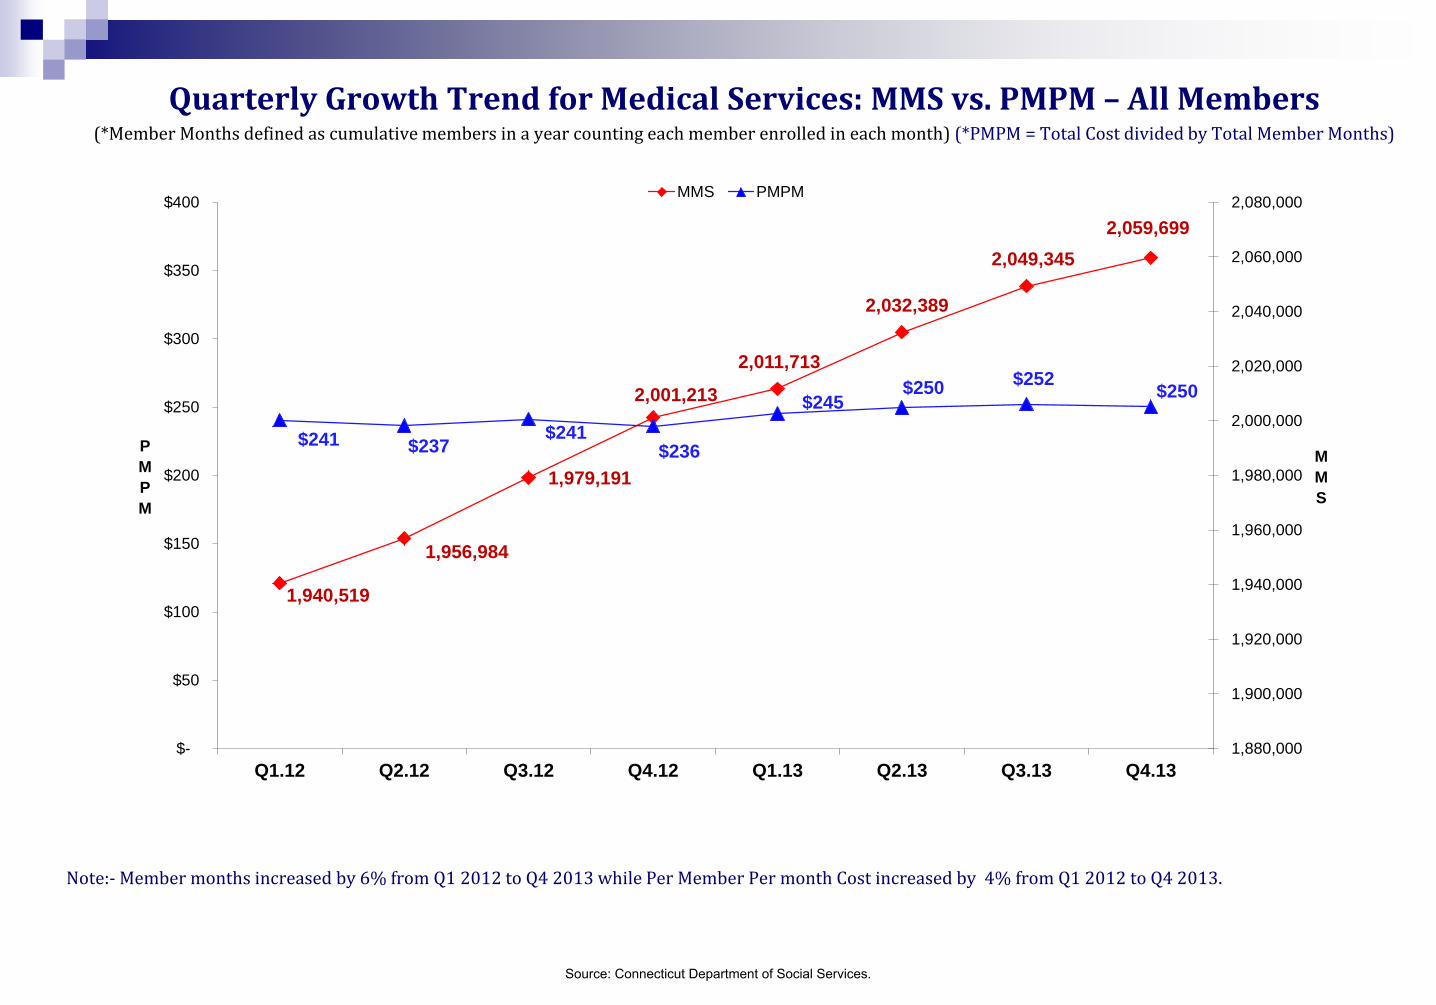
Quarterly Growth Trend for Medical Services: MMS vs. PMPM – All Members (*Member Months defined as cumulative members in a year counting each member enrolled in each month) (*PMPM = Total Cost divided by Total Member Months)
Note:- Member months increased by 6% from Q1 2012 to Q4 2013 while Per Member Per month Cost increased by 4% from Q1 2012 to Q4 2013.
1,940,519
1,956,984
1,979,191
2,001,213
2,011,713
2,032,389
2,049,345 2,059,699
$241 $237 $241
$236
$245 $250 $252 $250
$-
$50
$100
$150
$200
$250
$300
$350
$400
Q1.12 Q2.12 Q3.12 Q4.12 Q1.13 Q2.13 Q3.13 Q4.13 1,880,000
1,900,000
1,920,000
1,940,000
1,960,000
1,980,000
2,000,000
2,020,000
2,040,000
2,060,000
2,080,000
PMPM
MMS
MMS PMPM
Source: Connecticut Department of Social Services.
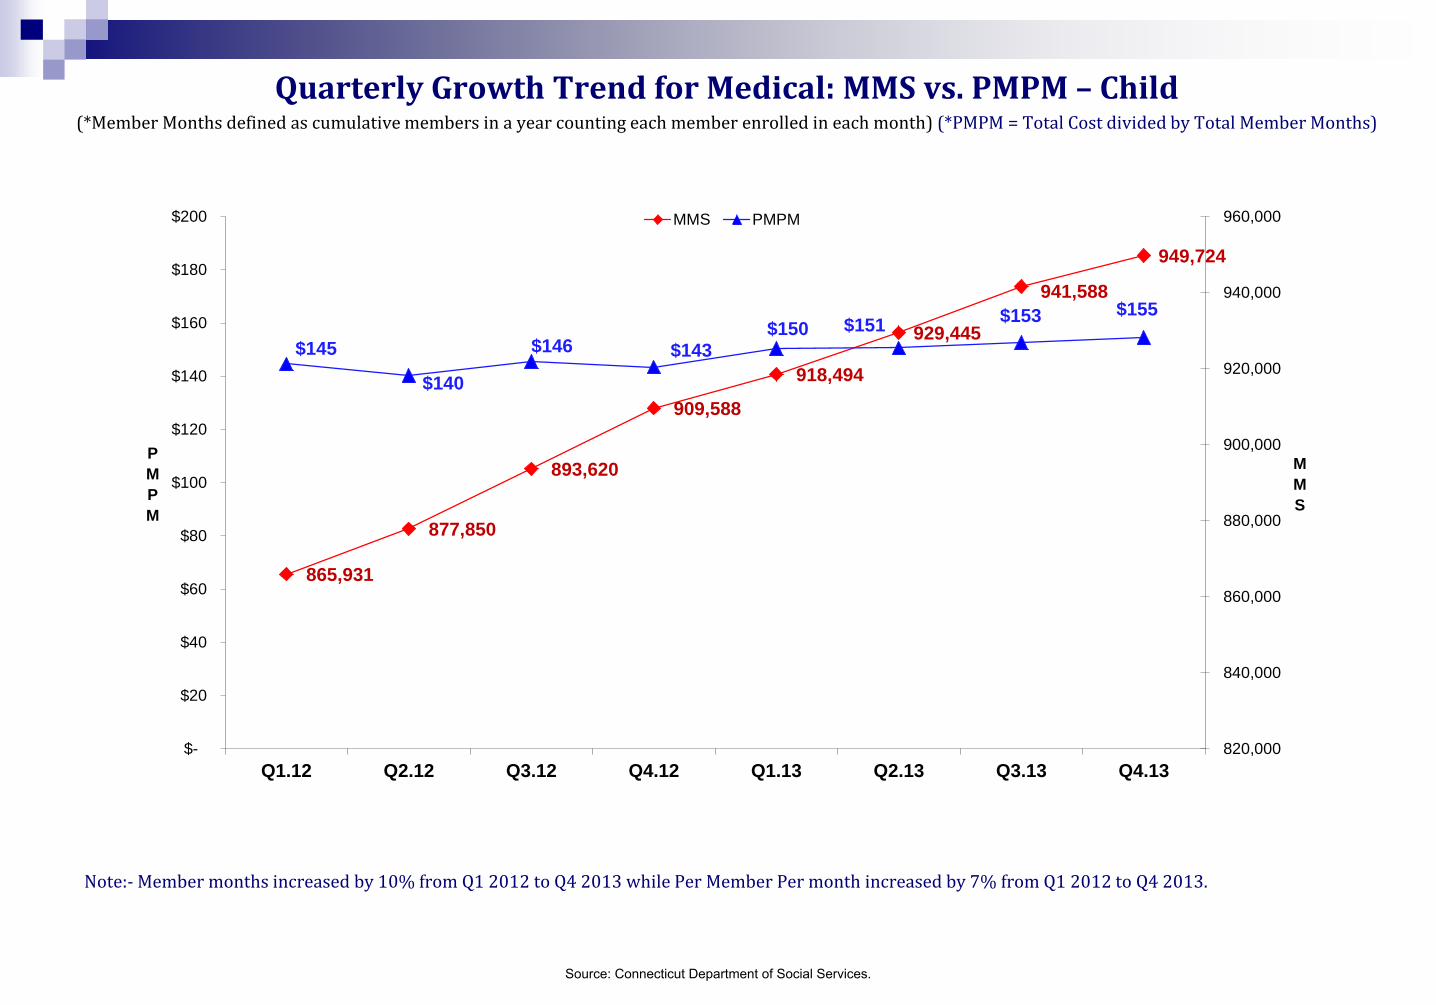
Quarterly Growth Trend for Medical: MMS vs. PMPM – Child
(*Member Months defined as cumulative members in a year counting each member enrolled in each month) (*PMPM = Total Cost divided by Total Member Months)
Note:- Member months increased by 10% from Q1 2012 to Q4 2013 while Per Member Per month increased by 7% from Q1 2012 to Q4 2013.
865,931
877,850
893,620
909,588
918,494
929,445
941,588
949,724
$145
$140
$146 $143 $150 $151 $153 $155
$-
$20
$40
$60
$80
$100
$120
$140
$160
$180
$200
Q1.12 Q2.12 Q3.12 Q4.12 Q1.13 Q2.13 Q3.13 Q4.13 820,000
840,000
860,000
880,000
900,000
920,000
940,000
960,000
PMPM
MMS
MMS PMPM
Source: Connecticut Department of Social Services.

Quarterly Growth Trend for Medical: MMS vs. PMPM – Adult
(*Member Months defined as cumulative members in a year counting each member enrolled in each month) (*PMPM = Total Cost divided by Total Member Months)
Note:- Member months increased by 3% from Q1 2012 to Q4 2013 while Per Member Per month increased by 5% from Q1 2012 to Q4 2013.
1,074,588 1,079,134
1,085,571
1,091,625 1,093,219
1,102,944
1,107,757
1,109,975 $316 $313 $320 $313
$324 $332 $336
$332
$-
$50
$100
$150
$200
$250
$300
$350
$400
Q1.12 Q2.12 Q3.12 Q4.12 Q1.13 Q2.13 Q3.13 Q4.13 1,050,000
1,060,000
1,070,000
1,080,000
1,090,000
1,100,000
1,110,000
1,120,000
PMPM
MMS
MMS PMPM
Source: Connecticut Department of Social Services.

Average Members in CT Medical Assistance Program -All Members, Child, Adult
656,492
295,582
360,910
679,429
311,604
367,825
0
100,000
200,000
300,000
400,000
500,000
600,000
700,000
800,000
All Members Child Adult
CY 2012 CY 2013
Source: Connecticut Department of Social Services.

Per Capita for Medical Only– All Members, Child, Adult (* Per Capita means cost per person in a year. [Per Capita = Total Cost divided by Total number of members])
$2,864
$1,726
$3,795
$2,993
$1,828
$3,980
All Members Child Adult
CY 2012 CY 2013
Source: Connecticut Department of Social Services.

Distinct Members Received Medical Services: All Members, Child, Adult
637,163
292,697 344,466
658,021
308,914 349,107
All Members Child Adult
CY 2012 CY 2013
Source: Connecticut Department of Social Services.
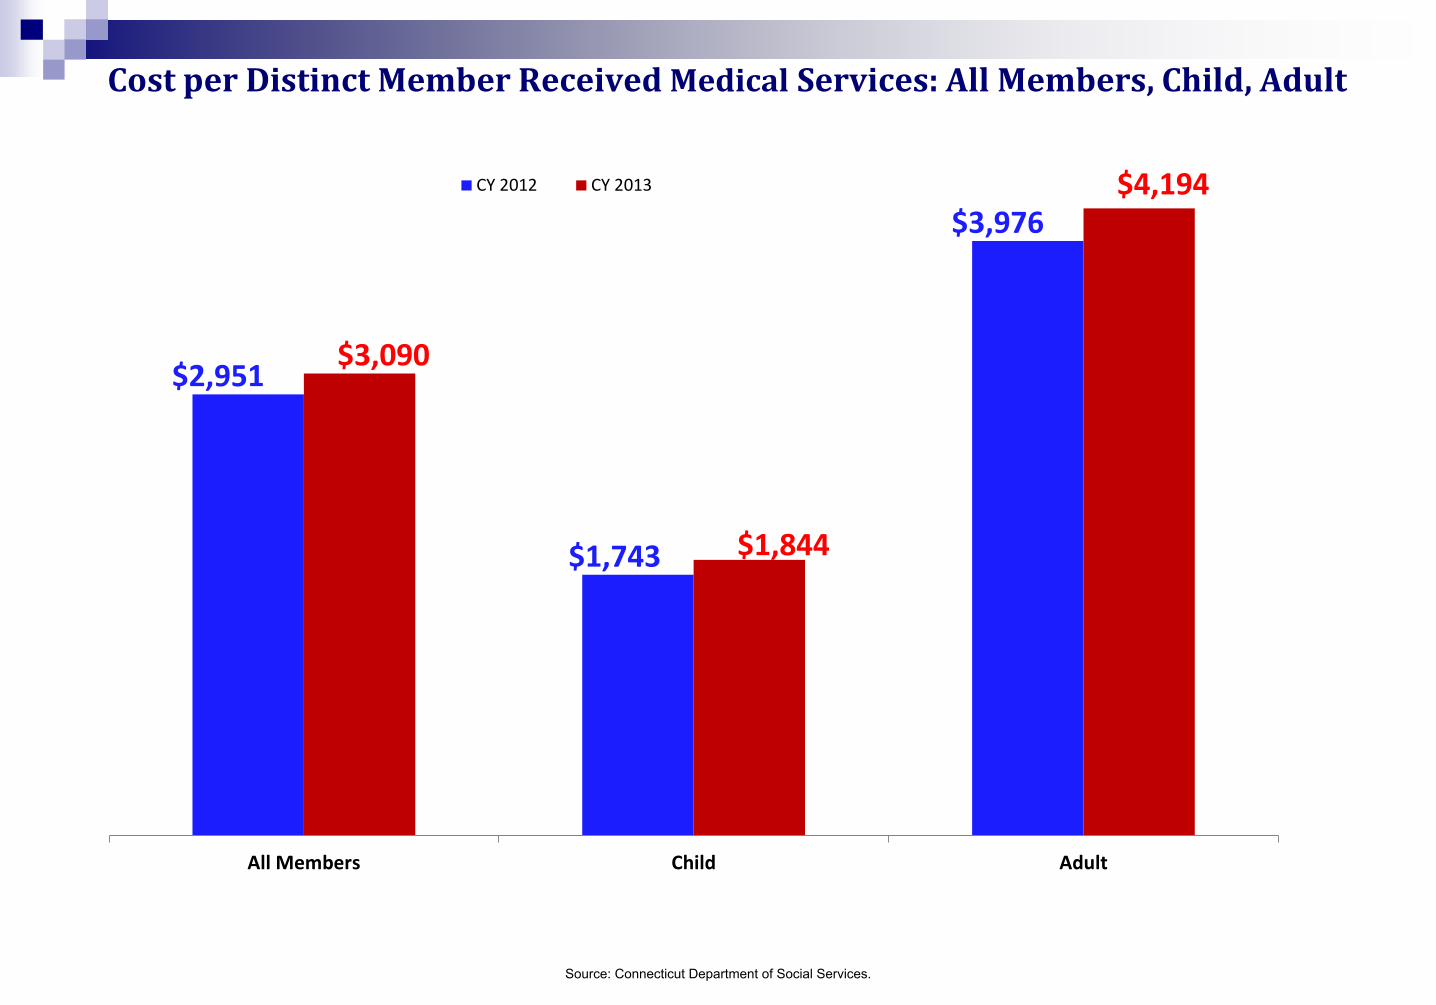
Cost per Distinct Member Received Medical Services: All Members, Child, Adult
$2,951
$1,743
$3,976
$3,090
$1,844
$4,194
All Members Child Adult
CY 2012 CY 2013
Source: Connecticut Department of Social Services.

Medical Spending by HUSKY Program
$957,862,674
$13,542,923
$469,017,377
$411,001,938
$575,129 $23,079,787
$4,964,558
$1,037,015,781
$14,622,548
$481,947,689 $476,056,957
$1,230,454 $19,721,577 $2,919,306 $-
$200,000,000
$400,000,000
$600,000,000
$800,000,000
$1,000,000,000
$1,200,000,000
HUSKY A HUSKY B HUSKY C HUSKY D LIMITED BENEFIT CHARTER OAK OTHER
CY 2012
CY 2013
Source: Connecticut Department of Social Services.

Distinct Members Who Received Medical Services by HUSKY Program
437,488
17,287
80,956 103,968
2,426 7,632
449,644
16,216
81,052
114,660
4,056 5,613 0
50,000
100,000
150,000
200,000
250,000
300,000
350,000
400,000
450,000
500,000
HUSKY A HUSKY B HUSKY C HUSKY D LIMITED BENEFIT CHARTER OAK
CY 2012 CY 2013
Source: Connecticut Department of Social Services.

Per Member Per Month (PMPM) Medical Cost by HUSKY Program
$181
$79
$384 $370
$58
$297
$191
$90
$393 $384
$35
$359
HUSKY A HUSKY B HUSKY C HUSKY D LIMITED BENEFIT (FP& TB)
CHARTER OAK
CY 2012 CY 2013
Source: Connecticut Department of Social Services.

Medical Spending by Category of Service
$108,351,783
$63,668,651
$1,083,197
$25,586,670 $15,130,022
$283,455,735
$26,144,872
$95,028,230
$22,809,654
$141,902,693
$3,756,155
$338,061,376
$11,560,515
$173,938,070
$569,566,761
$1,880,044,385
$108,818,577
$62,402,755
$1,215,319 $34,875,529
$21,658,693
$344,220,085
$29,553,164
$94,616,488
$25,421,478
$142,938,325
$3,827,047
$387,405,903
$10,650,660
$198,259,320
$567,650,969
$2,033,514,311
All Other
Durable Medical Equipment
Independent Radiology
Independent Laboratory
Other Practitioner
Physician Services – All
Vision
FQHC – Medical
Clinical Services
Home Health Services
Hospice
Hospital Outpatient – All Other
Hospital Outpatient - Non Emergent
Hospital Outpatient – Emergency
Hospital Inpatient
Total
CY 2013
CY 2012
Source: Connecticut Department of Social Services.

PMPM Costs by Category of Service
$13.75
$8.08
$0.14
$3.25
$1.92
$35.98
$3.32
$12.06
$2.90
$18.01
$0.48
$42.91
$1.47
$22.08
$72.30
$13.35
$7.65
$0.15
$4.28
$2.66
$42.22
$3.62
$11.60
$3.12
$17.53
$0.47
$47.52
$1.31
$24.32
$69.62
All Other
Durable Medical Equipment
Independent Radiology
Independent Laboratory
Other Practitioner
Physician Services – All
Vision
FQHC – Medical
Clinical Services
Home Health Services
Hospice
Hospital Outpatient – All Other
Hospital Outpatient - Non Emergent
Hospital Outpatient – Emergency
Hospital Inpatient
CY 2013 CY 2012
Source: Connecticut Department of Social Services.

Distinct Members by Category of Service
58,969
77,744
3,944
212,912
84,605
476,791
151,902
169,715
50,514
23,616
452
259,819
100,296
216,377
64,506
62,120
81,708
4,828
226,138
104,913
490,416
162,119
175,528
55,516
24,196
490
266,673
91,620
224,853
64,592
All Other
Durable Medical Equipment
Independent Radiology
Independent Laboratory
Other Practitioner
Physician Services – All
Vision
FQHC – Medical
Clinical Services
Home Health Services
Hospice
Hospital Outpatient – All Other
Hospital Outpatient - Non Emergent
Hospital Outpatient – Emergency
Hospital InpatientCY 2013 CY 2012
Source: Connecticut Department of Social Services.
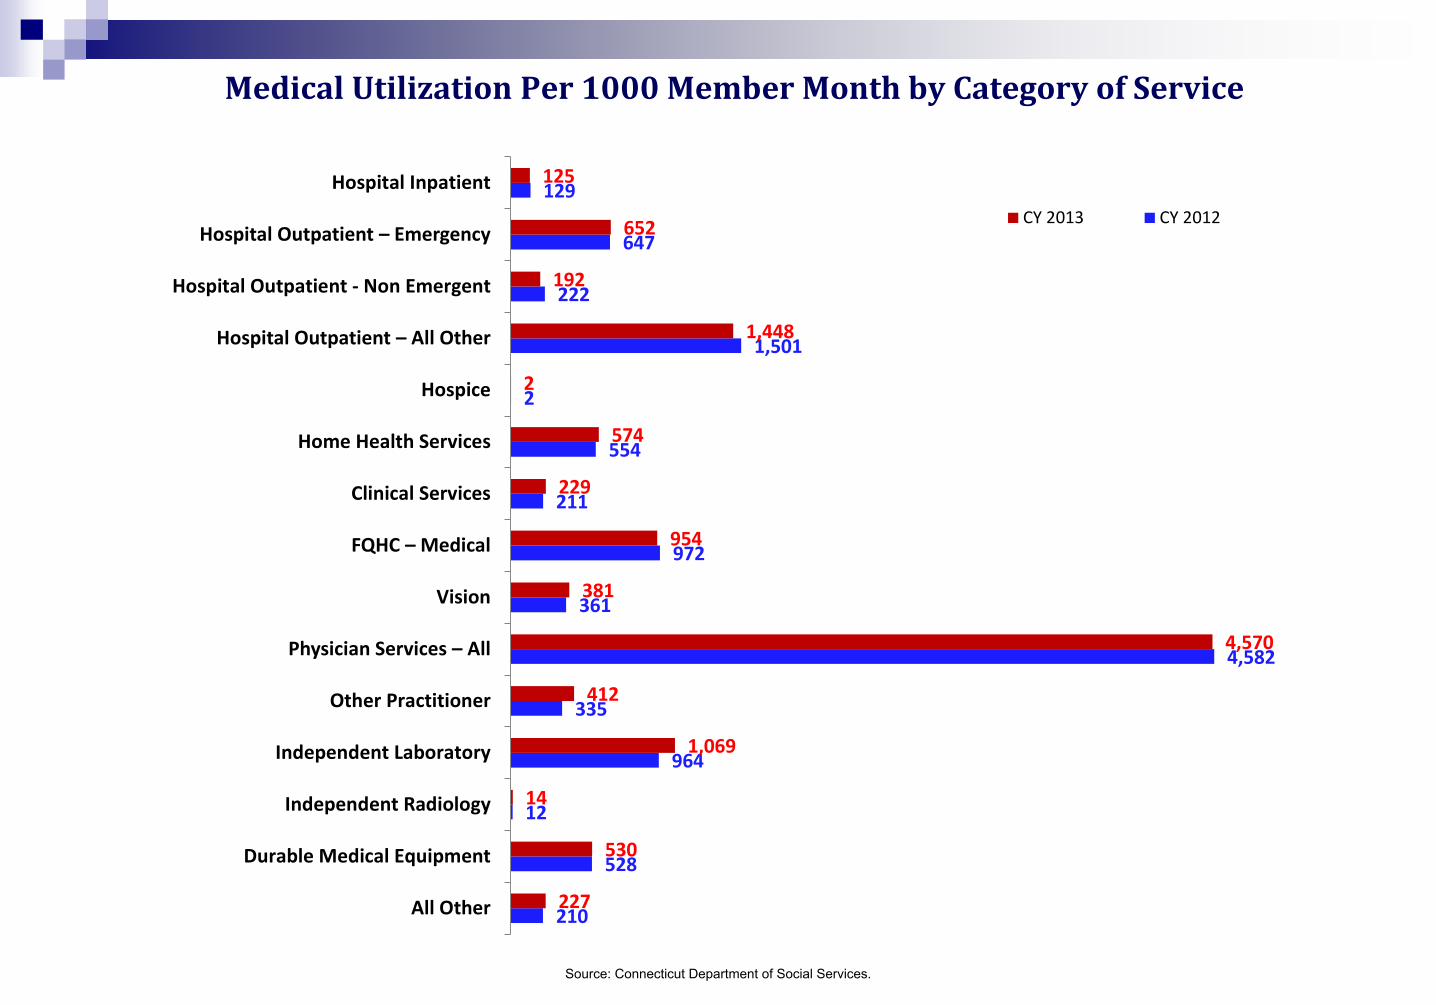
Medical Utilization Per 1000 Member Month by Category of Service
210
528
12
964
335
4,582
361
972
211
554
2
1,501
222
647
129
227
530
14
1,069
412
4,570
381
954
229
574
2
1,448
192
652
125
All Other
Durable Medical Equipment
Independent Radiology
Independent Laboratory
Other Practitioner
Physician Services – All
Vision
FQHC – Medical
Clinical Services
Home Health Services
Hospice
Hospital Outpatient – All Other
Hospital Outpatient - Non Emergent
Hospital Outpatient – Emergency
Hospital Inpatient
CY 2013 CY 2012
Source: Connecticut Department of Social Services.

CY 2012 - Medical Spending Distribution by Category of Service
22
30%
28% 1%
16%
8%
1% 5%
0% 2% 0%
6% 3% Hospital InPatient
Hospital OutPatient
IndependentLaboratoryPhysician+OtherPractHome Health
Clinic Servicses
FQHC Medical
IndependentRadiologyVision
Hospice
All Other
Durable MedicalEquipment
Source: Connecticut Department of Social Services.
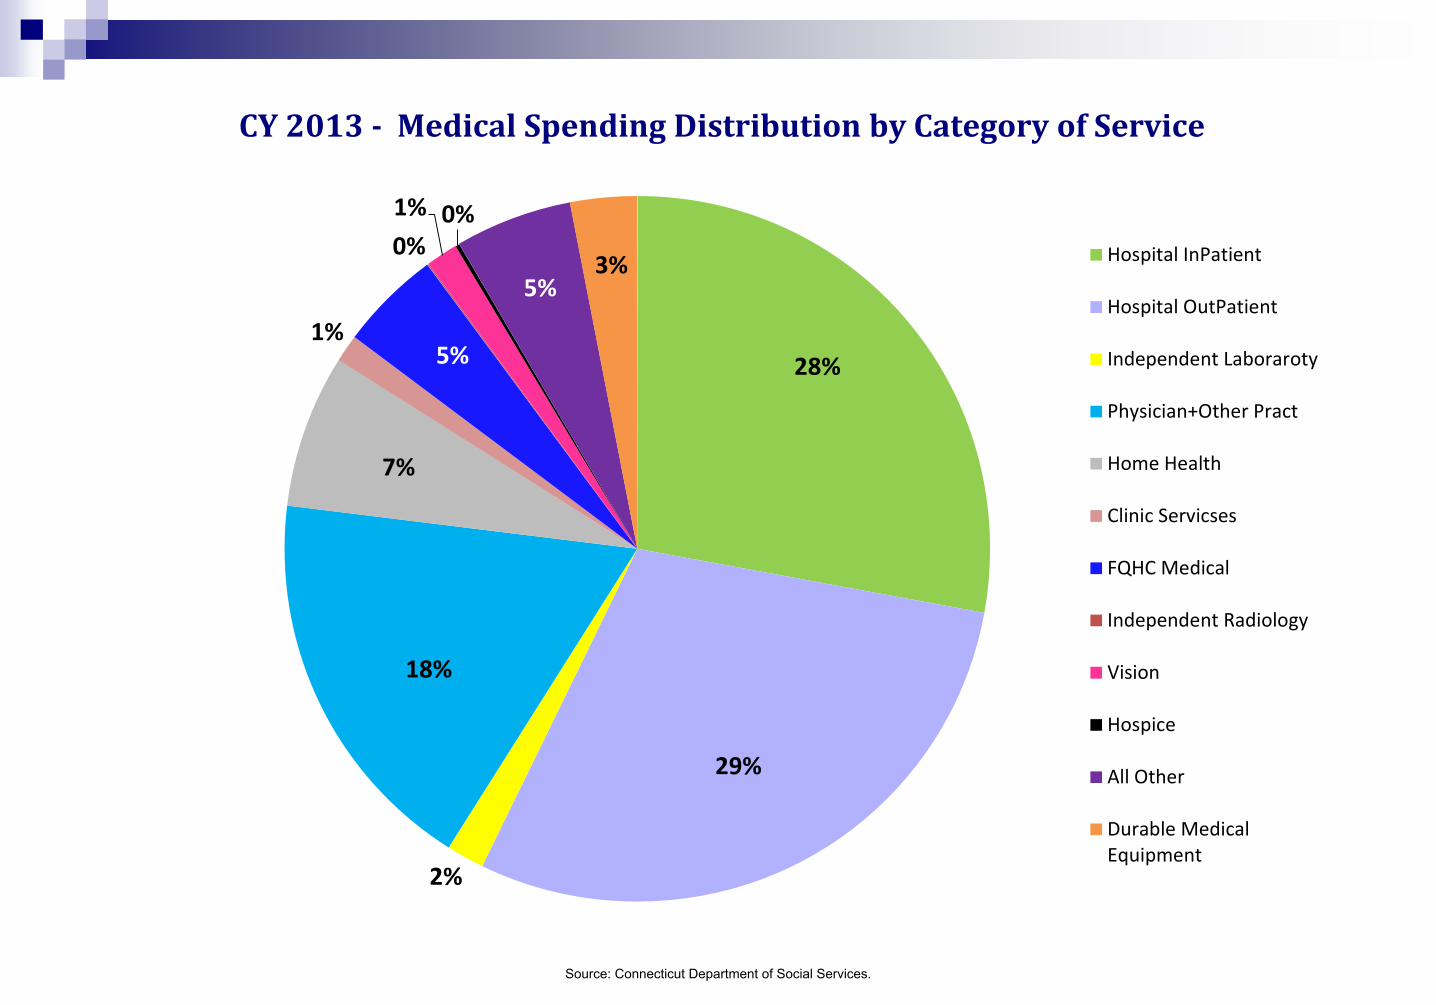
CY 2013 - Medical Spending Distribution by Category of Service
28%
29%
2%
18%
7%
1% 5%
0% 1% 0%
5% 3% Hospital InPatient
Hospital OutPatient
Independent Laboraroty
Physician+Other Pract
Home Health
Clinic Servicses
FQHC Medical
Independent Radiology
Vision
Hospice
All Other
Durable MedicalEquipment
Source: Connecticut Department of Social Services.
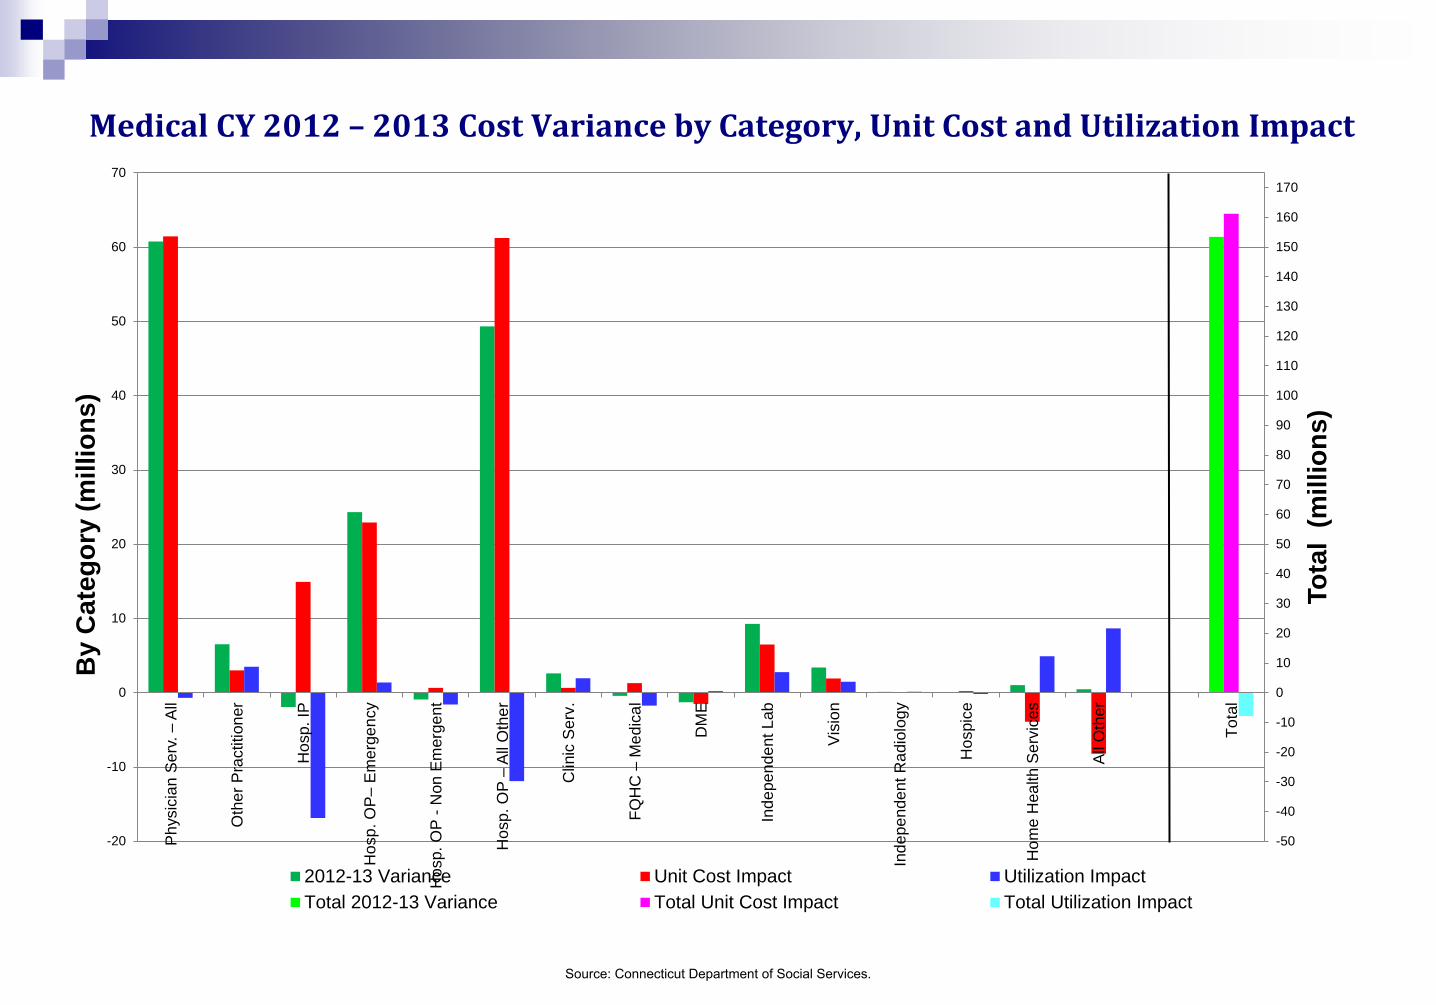
Medical CY 2012 – 2013 Cost Variance by Category, Unit Cost and Utilization Impact
-50
-40
-30
-20
-10
0
10
20
30
40
50
60
70
80
90
100
110
120
130
140
150
160
170
-20
-10
0
10
20
30
40
50
60
70P
hysi
cian
Ser
v. –
All
Oth
er P
ract
ition
er
Hos
p. IP
Hos
p. O
P–
Em
erge
ncy
Hos
p. O
P -
Non
Em
erge
nt
Hos
p. O
P –
All
Oth
er
Clin
ic S
erv.
FQH
C –
Med
ical
DM
E
Inde
pend
ent L
ab
Vis
ion
Inde
pend
ent R
adio
logy
Hos
pice
Hom
e H
ealth
Ser
vice
s
All
Oth
er
Tota
l
Tota
l (m
illio
ns)
By
Cat
egor
y (m
illio
ns)
2012-13 Variance Unit Cost Impact Utilization ImpactTotal 2012-13 Variance Total Unit Cost Impact Total Utilization Impact
Source: Connecticut Department of Social Services.