Embed Size (px)
Citation preview
2018 UK
Spencer StuartBoard Index
spencer stuart71
international comparison
aBoUt spenCer stUart
At Spencer Stuart, we know how much leadership matters. We are trusted by organizations around the world to help them make the senior- level leadership decisions that have a lasting impact on their enterprises. Through our exec-utive search, board and leadership advisory services, we help build and enhance high- performing teams for select clients ranging from major multinationals to emerging companies to nonprofit institutions.
Privately held since 1956, we focus on delivering knowl-edge, insight and results through the collaborative efforts of a team of experts — now spanning 57 offices, 30 coun-tries and more than 50 practice specialties. Boards and leaders consistently turn to Spencer Stuart to help address their evolving leadership needs in areas such as senior- level executive search, board recruitment, board effective-ness, succession planning, in- depth senior management assessment and many other facets of organizational effec-tiveness. For more information on Spencer Stuart, please visit www.spencerstuart.com.
Social Media @ Spencer StuartStay up to date on the trends and topics that are relevant to your business and career.
© 2017 Spencer Stuart. All rights reserved. For information about copying, distributing and displaying this work, contact: [email protected].
@Spencer Stuart
2018 uk spencer stuart board index 1
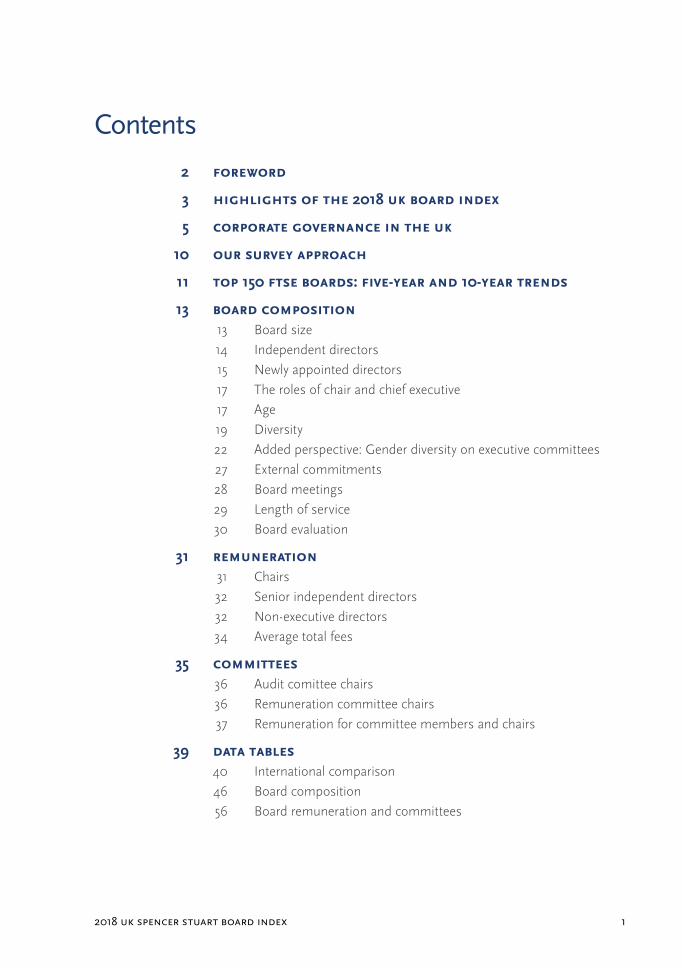
Contents
2 Foreword
3 HigHligHts oF tHe 2018 UK Board index
5 Corporate governanCe in tHe UK
10 oUr sUrvey approaCH
11 top 150 Ftse Boards: Five-year and 10-year trends
13 Board Composition 13 Board size 14 Independent directors 15 Newly appointed directors 17 The roles of chair and chief executive 17 Age 19 Diversity 22 Added perspective: Gender diversity on executive committees 27 External commitments 28 Board meetings 29 Length of service 30 Board evaluation
31 remUneration 31 Chairs 32 Senior independent directors 32 Non-executive directors 34 Average total fees
35 Committees 36 Audit comittee chairs 36 Remuneration committee chairs 37 Remuneration for committee members and chairs
39 data taBles 40 International comparison 46 Board composition 56 Board remuneration and committees
spencer stuart2
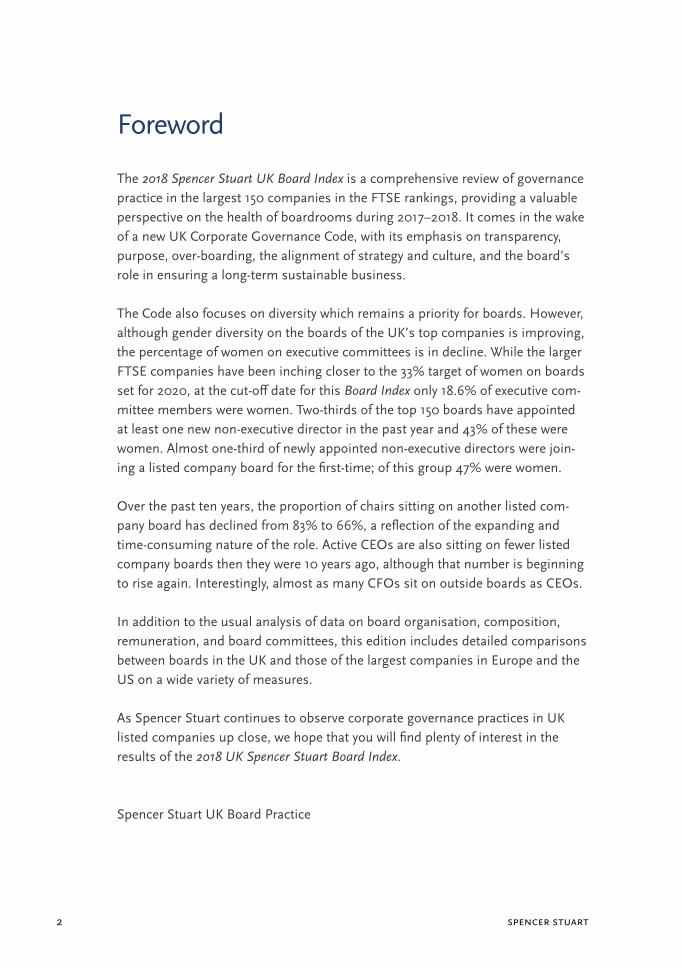
Foreword
The 2018 Spencer Stuart UK Board Index is a comprehensive review of governance practice in the largest 150 companies in the FTSE rankings, providing a valuable perspective on the health of boardrooms during 2017–2018. It comes in the wake of a new UK Corporate Governance Code, with its emphasis on transparency, purpose, over-boarding, the alignment of strategy and culture, and the board’s role in ensuring a long-term sustainable business.
The Code also focuses on diversity which remains a priority for boards. However, although gender diversity on the boards of the UK’s top companies is improving, the percentage of women on executive committees is in decline. While the larger FTSE companies have been inching closer to the 33% target of women on boards set for 2020, at the cut-off date for this Board Index only 18.6% of executive com-mittee members were women. Two-thirds of the top 150 boards have appointed at least one new non-executive director in the past year and 43% of these were women. Almost one-third of newly appointed non-executive directors were join-ing a listed company board for the first-time; of this group 47% were women.
Over the past ten years, the proportion of chairs sitting on another listed com-pany board has declined from 83% to 66%, a reflection of the expanding and time-consuming nature of the role. Active CEOs are also sitting on fewer listed company boards then they were 10 years ago, although that number is beginning to rise again. Interestingly, almost as many CFOs sit on outside boards as CEOs.
In addition to the usual analysis of data on board organisation, composition, remuneration, and board committees, this edition includes detailed comparisons between boards in the UK and those of the largest companies in Europe and the US on a wide variety of measures.
As Spencer Stuart continues to observe corporate governance practices in UK listed companies up close, we hope that you will find plenty of interest in the results of the 2018 UK Spencer Stuart Board Index.
Spencer Stuart UK Board Practice
2018 uk spencer stuart board index 3
Highlights of the 2018 UK Board Index
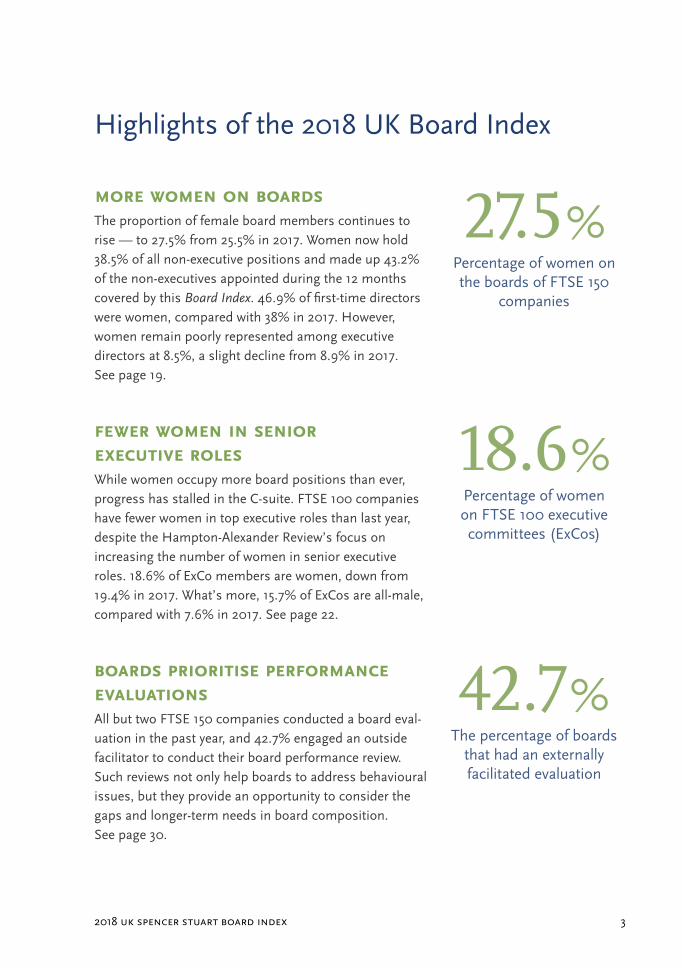
more women on BoardsThe proportion of female board members continues to rise — to 27.5% from 25.5% in 2017. Women now hold 38.5% of all non-executive positions and made up 43.2% of the non-executives appointed during the 12 months covered by this Board Index. 46.9% of first-time directors were women, compared with 38% in 2017. However, women remain poorly represented among executive directors at 8.5%, a slight decline from 8.9% in 2017. See page 19.
Fewer women in senior exeCUtive rolesWhile women occupy more board positions than ever, progress has stalled in the C-suite. FTSE 100 companies have fewer women in top executive roles than last year, despite the Hampton-Alexander Review’s focus on increasing the number of women in senior executive roles. 18.6% of ExCo members are women, down from 19.4% in 2017. What’s more, 15.7% of ExCos are all-male, compared with 7.6% in 2017. See page 22.
Boards prioritise perFormanCe evalUationsAll but two FTSE 150 companies conducted a board eval-uation in the past year, and 42.7% engaged an outside facilitator to conduct their board performance review. Such reviews not only help boards to address behavioural issues, but they provide an opportunity to consider the gaps and longer-term needs in board composition. See page 30.
27.5 % Percentage of women on the boards of FTSE 150
companies
18.6 % Percentage of women on FTSE 100 executive committees (ExCos)
42.7 % The percentage of boards
that had an externally facilitated evaluation
spencer stuart4
HigHligHts of tHe 2018 uk board index
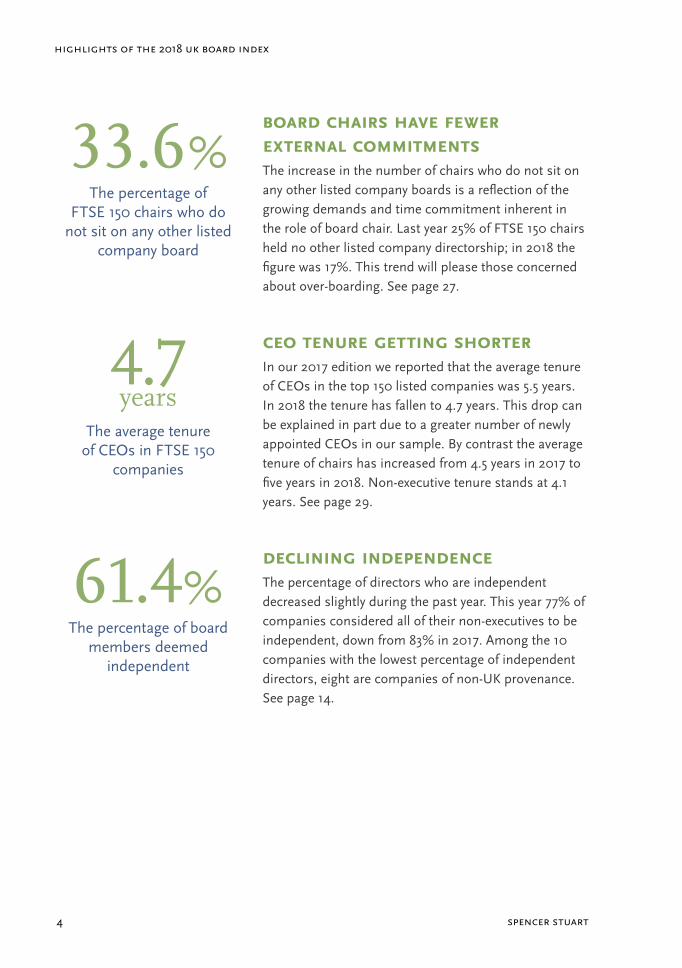
Board CHairs Have Fewer external CommitmentsThe increase in the number of chairs who do not sit on any other listed company boards is a reflection of the growing demands and time commitment inherent in the role of board chair. Last year 25% of FTSE 150 chairs held no other listed company directorship; in 2018 the figure was 17%. This trend will please those concerned about over-boarding. See page 27.
Ceo tenUre getting sHorterIn our 2017 edition we reported that the average tenure of CEOs in the top 150 listed companies was 5.5 years. In 2018 the tenure has fallen to 4.7 years. This drop can be explained in part due to a greater number of newly appointed CEOs in our sample. By contrast the average tenure of chairs has increased from 4.5 years in 2017 to five years in 2018. Non-executive tenure stands at 4.1 years. See page 29.
deClining independenCeThe percentage of directors who are independent decreased slightly during the past year. This year 77% of companies considered all of their non-executives to be independent, down from 83% in 2017. Among the 10 companies with the lowest percentage of independent directors, eight are companies of non-UK provenance. See page 14.
33.6 % The percentage of
FTSE 150 chairs who do not sit on any other listed
company board
4.7 years
The average tenure of CEOs in FTSE 150
companies
61.4 % The percentage of board
members deemed independent
2018 uk spencer stuart board index 5
2017 was a year of consultation and proposals; 2018 has seen the publication of new and updated codes and legislation and the implementation of previously announced initiatives. Inevitably, further consultations are ongoing.
The new codes and regulations have a focus on long-term success, sustainability and stakeholders. Following the collapse of Carillion at the beginning of the year, which brought into even sharper focus the responsibilities and behaviours of directors, these new codes and regulations also aim to (re)build trust in compa-nies and the bodies which oversee their regulation. The current UK Corporate Governance Code (the “Code”) emerged out of consultation, but also built on government-backed proposals, including the 2016 paper on corporate culture from the Financial Reporting Council (FRC), the Hampton-Alexander Review reports on gender diversity, and the Parker Review on ethnic diversity.
The FRC published the new Code in July 2018, together with the updated Guidance on Board Effectiveness. The FRC took the opportunity to refashion the Code, with some issues now covered in its Guidelines, resulting in a “shorter, sharper” Code. There is more emphasis on companies reporting on how they have applied the Code rather than merely explaining where they have diverged from it. Although the new Code applies to financial years starting after January 2019, the content was widely anticipated and it will be interesting to see how companies are already incorporating the new principles and provisions in their 2018 reporting.
The consultation for the Code included questions regarding a future update to the Stewardship Code. Informed by the responses, proposals for the updated Stewardship Code will be published in late 2018.
Corporate Governance in the UK
spencer stuart6
in the spotlight
Board composition
From the perspective of board composition, the Code is keen to encourage better board succession planning and a clearer definition of important issues to be con-sidered when appointing directors. Chairman tenure has been redefined; there is further guidance on the identification of conflicts of interest; and boards are urged to examine closely the capability of directors to devote sufficient time to the role.
For many years the audit committee has been required to include a financial expert, and it is hoped that the performance of remuneration committees will be improved by the requirement to appoint as chair a director who has previously served on a remuneration committee for at least a year.
The question of employee directors has gained further traction, with companies given a choice as to how this might be implemented. How companies choose to organise this remains to be seen. Of the Board Index constituents, only Capita has so far announced that employees are to be invited to apply for two board seats.
Companies continue to work towards attaining the targets set by the Hampton-Alexander and Parker reviews on gender and ethnic diversity respectively. The latest figures from Hampton-Alexander, published in June, show that while FTSE 100 companies are on track to achieve the 2020 target of 33% of board and senior positions to be held by women, FTSE 250 companies are lagging behind and pres-sure will increase to recruit further women directors. For further information regarding the companies in the Board Index, see the sections on women directors (page 19) and gender diversity on executive committees (page 22).
2018 uk spencer stuart board index 7
Smaller and private companies
Discussions have continued to extend coverage of corporate governance guidelines beyond the larger quoted companies. Although the companies affected fall outside the scope of this Board Index, there are nevertheless two new codes of interest:
» tHe wates Corporate governanCe prinCiples For large private Companies (draFt) was published in June. Consultation closed in September and finalised principles are scheduled for publication in December. These will also provide a framework to align with government reporting requirements.
» tHe QUoted Companies allianCe (QCa) has updated its Corporate Governance Code, aimed at small and medium-sized companies, to align with a new requirement (effective 28 September 2018) that AIM companies must choose a corporate governance code with which they will comply. Companies may choose any recognised code and will then have to report how they have applied the code and where they have deviated from it.
Government
Following last year’s report from the Department for Business, Enterprise & Industrial Strategy (BEIS) and further consultation, a new Statutory Instrument was approved by Parliament in July. The Companies (Miscellaneous Reporting) Regulations 2018 are intended to reinforce company reporting on matters cov-ered by Section 172 of the Companies Act 2006 dealing with the responsibility of directors to act in the best interests of the company as a whole. They also address reporting on pay ratios and employee, business and shareholder relationships. The Regulations are timed to come into effect at the same time as the new Corporate Governance Code, that is with reference to financial years beginning on or after January 2019.
In recent years there has been increasingly high-profile scrutiny of the role and impact of the FRC. This was brought further into the spotlight following the collapse of Carillion. In April, the Government launched an independent review of the FRC, chaired by Sir John Kingman, chair of Legal & General. The review is addressing the role of the FRC, its powers, effectiveness and influence. Consultation closed in August and findings are due by the end of 2018.
spencer stuart8
in the spotlight
The publication in April 2018 of the gender pay gap in companies in Great Britain with over 250 employees caused much soul-searching and numerous declara-tions of intent to close the gap over time. Every sector was found to have a pay gap that favours men. The median pay gap was 9.7%.
Investment Association Public Register
As we flagged in last year’s Board Index, the Government asked the Investment Association to develop and maintain a Public Register and this was launched in December 2017. Its aim is to bring together in one place a list of companies which have received significant (>20%) shareholder opposition to resolutions at their AGM, or indeed withdrew resolutions ahead of the meeting, and to highlight the processes adopted to address the concerns which such votes reveal.
Of the constituents of the current Board Index, 19 appear in the Register, having had such votes against either the remuneration policy or the remuneration report; eight had such votes against the re-election of specific directors.
Premium listing for companies with controlling state shareholder
At the time of last year’s Board Index the Financial Conduct Authority (FCA) had recently closed consultation on its paper proposing the creation of a new pre-mium listing category for companies controlled by a sovereign state shareholder. New rules were finalised in June 2018 and the new premium listing category came into effect on 1 July. Companies in this category will have to hold an inde-pendent shareholder vote on the election of independent directors, as do compa-nies in the existing Premium Listing category. The Listing Requirements do not specify an obligation to have independent directors, but companies are obliged to report compliance or otherwise with the UK Corporate Governance Code.
2018 uk spencer stuart board index 9
Our survey approach
The 2018 UK Spencer Stuart Board Index covers the largest 150 companies listed by market value at the end of April 2018, excluding investment trusts.
The purpose of the survey is to provide a comprehensive review of practice in these 150 companies at a given point, comparing it with previous years and draw-ing on it to identify significant trends.
Information has been compiled from publicly available sources. Board composi-tion data were taken at 30 April 2018 and the remuneration data are, for the most part, those published in the latest annual report. ExCo data are taken from com-pany websites.
There are 20 changes of constituent from last year. Thirteen of these slipped down the rankings and three merged with other companies. Four of last year’s constitu-ents were acquired: Booker by Tesco; GKN by Melrose Industries; TP ICAP by CME and Worldpay by Vantiv. In addition, Wolseley changed its name to Ferguson. Since the cut-off, Sky has been acquired by Comcast; Shire has been acquired by Takeda; and the takeover of Randgold by Barrick Gold has been announced.
Of the new entrants, 13 have been included in previous editions of the Board Index.
The industrial and manufacturing sector accounts for 38% of the constituents, followed by the broad financial services sector with 25%, consumer with 19%, technology, media and telecoms with 10%, and healthcare with 7%.
Among the constituents of the Index one company, TUI, organises its boards according to the German two-tier structure and, within the supervisory board, the practice of co-determination. This means that 50% of supervisory board mem-bers are employee representatives and 50% shareholder representatives. For the purposes of this Index we are taking into account only the shareholder represent-atives, as equivalent to independent non-executives.
spencer stuart10
our survey approacH
Chairs are excluded from the split between executive and non-executive directors and their tenure is treated separately. However, they are included in categories such as foreign directors, women, and average age. Director tenure is taken from the company's public listing or (de)merger date. In discussing CEOs and CFOs we are concerned only with those who sit on the board of their company.
‘Foreign directors’ are defined as being of different nationality from the company on whose board they sit. The term ‘non-UK nationals’ refers to anyone who does not have a UK citizenship.
The ‘new directors’ category of our tables relates to directors who were appointed in the calendar year preceding the cut-off date, i.e. between 1 May 2017 and 30 April 2018.
In our tables we state remuneration data in the currency used by the respective companies in their annual report. For the purpose of our broader analysis, we convert all figures to sterling, using the Bank of England average exchange rate for the relevant financial year.
2018 uk spencer stuart board index 11
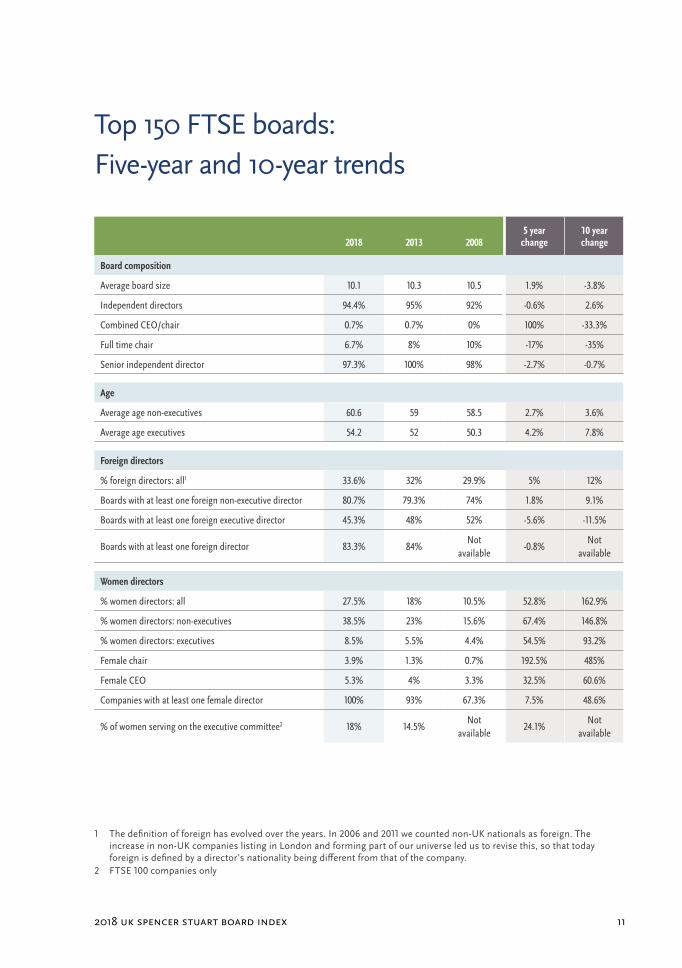
Top 150 FTSE boards: Five-year and 10-year trends
2018 2013 20085 year
change10 year change
Board composition
Average board size 10.1 10.3 10.5 1.9% -3.8%
Independent directors 94.4% 95% 92% -0.6% 2.6%
Combined CEO/chair 0.7% 0.7% 0% 100% -33.3%
Full time chair 6.7% 8% 10% -17% -35%
Senior independent director 97.3% 100% 98% -2.7% -0.7%
Age
Average age non-executives 60.6 59 58.5 2.7% 3.6%
Average age executives 54.2 52 50.3 4.2% 7.8%
Foreign directors
% foreign directors: all1 33.6% 32% 29.9% 5% 12%
Boards with at least one foreign non-executive director 80.7% 79.3% 74% 1.8% 9.1%
Boards with at least one foreign executive director 45.3% 48% 52% -5.6% -11.5%
Boards with at least one foreign director 83.3% 84%Not
available-0.8%
Not available
Women directors
% women directors: all 27.5% 18% 10.5% 52.8% 162.9%
% women directors: non-executives 38.5% 23% 15.6% 67.4% 146.8%
% women directors: executives 8.5% 5.5% 4.4% 54.5% 93.2%
Female chair 3.9% 1.3% 0.7% 192.5% 485%
Female CEO 5.3% 4% 3.3% 32.5% 60.6%
Companies with at least one female director 100% 93% 67.3% 7.5% 48.6%
% of women serving on the executive committee2 18% 14.5%Not
available24.1%
Not available
1 The definition of foreign has evolved over the years. In 2006 and 2011 we counted non-UK nationals as foreign. The increase in non-UK companies listing in London and forming part of our universe led us to revise this, so that today foreign is defined by a director’s nationality being different from that of the company.
2 FTSE 100 companies only
spencer stuart12
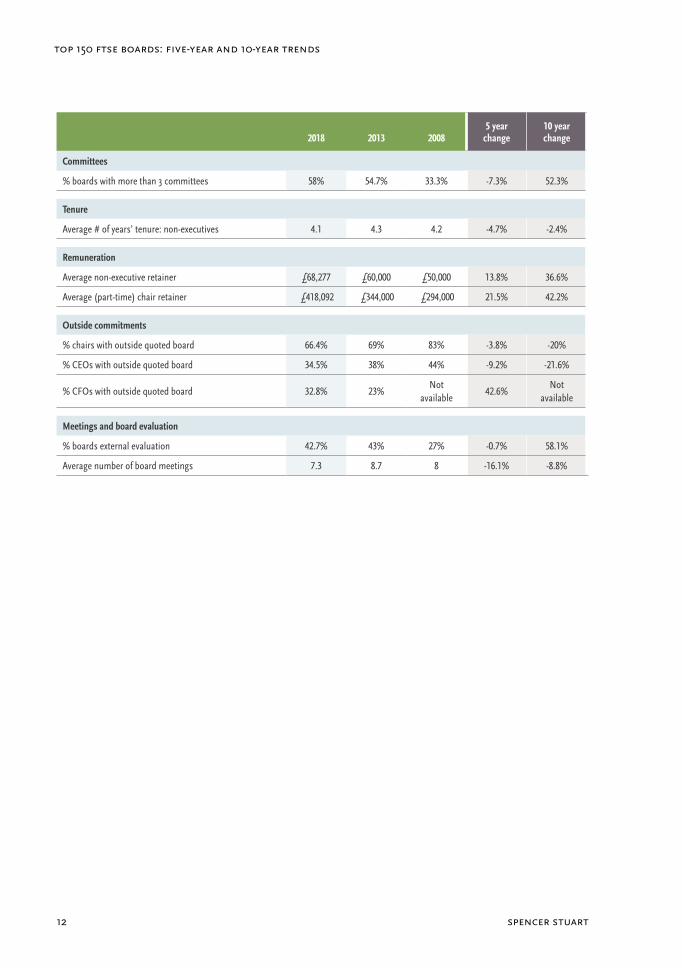
top 150 ftse boards: five-year and 10-year trends
2018 2013 20085 year
change10 year change
Committees
% boards with more than 3 committees 58% 54.7% 33.3% -7.3% 52.3%
Tenure
Average # of years’ tenure: non-executives 4.1 4.3 4.2 -4.7% -2.4%
Remuneration
Average non-executive retainer £68,277 £60,000 £50,000 13.8% 36.6%
Average (part-time) chair retainer £418,092 £344,000 £294,000 21.5% 42.2%
Outside commitments
% chairs with outside quoted board 66.4% 69% 83% -3.8% -20%
% CEOs with outside quoted board 34.5% 38% 44% -9.2% -21.6%
% CFOs with outside quoted board 32.8% 23%Not
available42.6%
Not available
Meetings and board evaluation
% boards external evaluation 42.7% 43% 27% -0.7% 58.1%
Average number of board meetings 7.3 8.7 8 -16.1% -8.8%
2018 uk spencer stuart board index 13
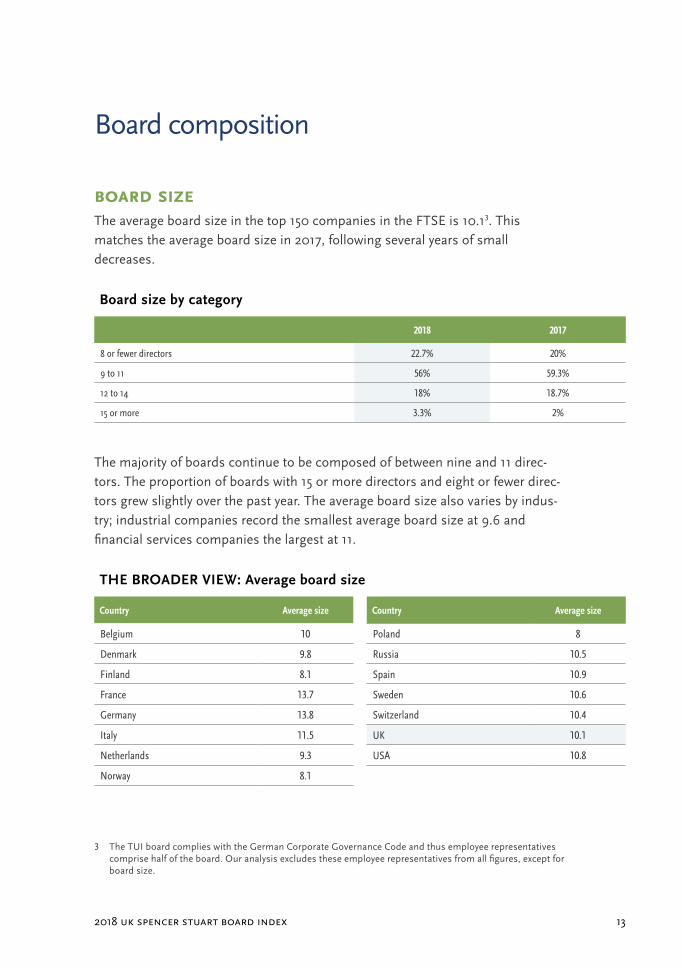
Board composition
Board siZeThe average board size in the top 150 companies in the FTSE is 10.13. This matches the average board size in 2017, following several years of small decreases.
Board size by category
2018 2017
8 or fewer directors 22.7% 20%
9 to 11 56% 59.3%
12 to 14 18% 18.7%
15 or more 3.3% 2%
The majority of boards continue to be composed of between nine and 11 direc-tors. The proportion of boards with 15 or more directors and eight or fewer direc-tors grew slightly over the past year. The average board size also varies by indus-try; industrial companies record the smallest average board size at 9.6 and financial services companies the largest at 11.
THE BROADER VIEW: Average board size
Country Average size Country Average size
Belgium 10 Poland 8
Denmark 9.8 Russia 10.5
Finland 8.1 Spain 10.9
France 13.7 Sweden 10.6
Germany 13.8 Switzerland 10.4
Italy 11.5 UK 10.1
Netherlands 9.3 USA 10.8
Norway 8.1
3 The TUI board complies with the German Corporate Governance Code and thus employee representatives comprise half of the board. Our analysis excludes these employee representatives from all figures, except for board size.
spencer stuart14
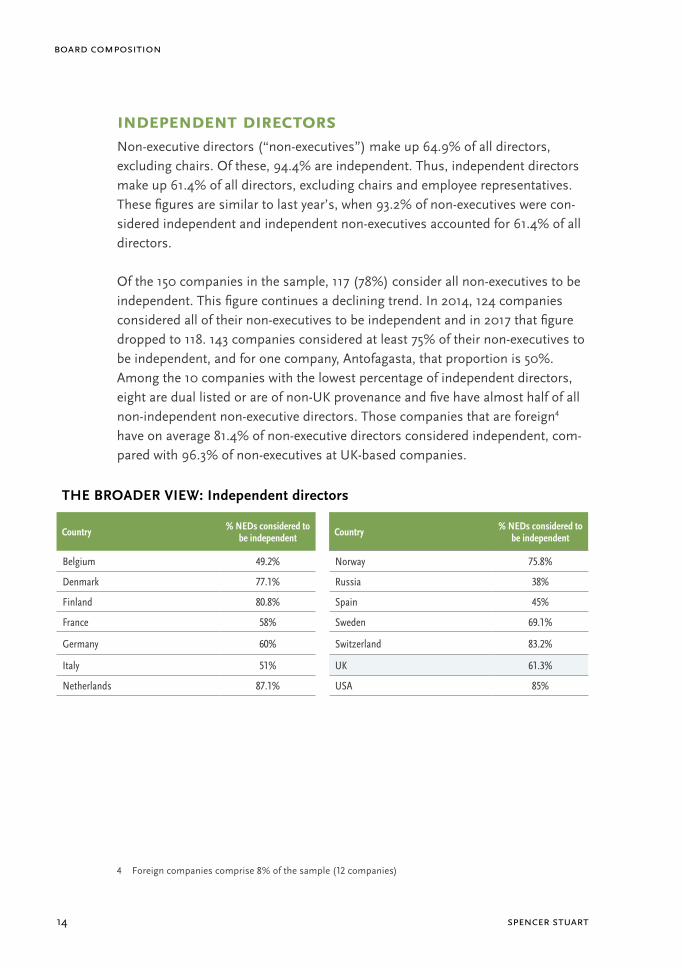
board composition
independent direCtorsNon-executive directors (“non-executives”) make up 64.9% of all directors, excluding chairs. Of these, 94.4% are independent. Thus, independent directors make up 61.4% of all directors, excluding chairs and employee representatives. These figures are similar to last year’s, when 93.2% of non-executives were con-sidered independent and independent non-executives accounted for 61.4% of all directors.
Of the 150 companies in the sample, 117 (78%) consider all non-executives to be independent. This figure continues a declining trend. In 2014, 124 companies considered all of their non-executives to be independent and in 2017 that figure dropped to 118. 143 companies considered at least 75% of their non-executives to be independent, and for one company, Antofagasta, that proportion is 50%. Among the 10 companies with the lowest percentage of independent directors, eight are dual listed or are of non-UK provenance and five have almost half of all non-independent non-executive directors. Those companies that are foreign4 have on average 81.4% of non-executive directors considered independent, com-pared with 96.3% of non-executives at UK-based companies.
THE BROADER VIEW: Independent directors
Country % NEDs considered to be independent Country % NEDs considered to
be independent
Belgium 49.2% Norway 75.8%
Denmark 77.1% Russia 38%
Finland 80.8% Spain 45%
France 58% Sweden 69.1%
Germany 60% Switzerland 83.2%
Italy 51% UK 61.3%
Netherlands 87.1% USA 85%
4 Foreign companies comprise 8% of the sample (12 companies)
2018 uk spencer stuart board index 15
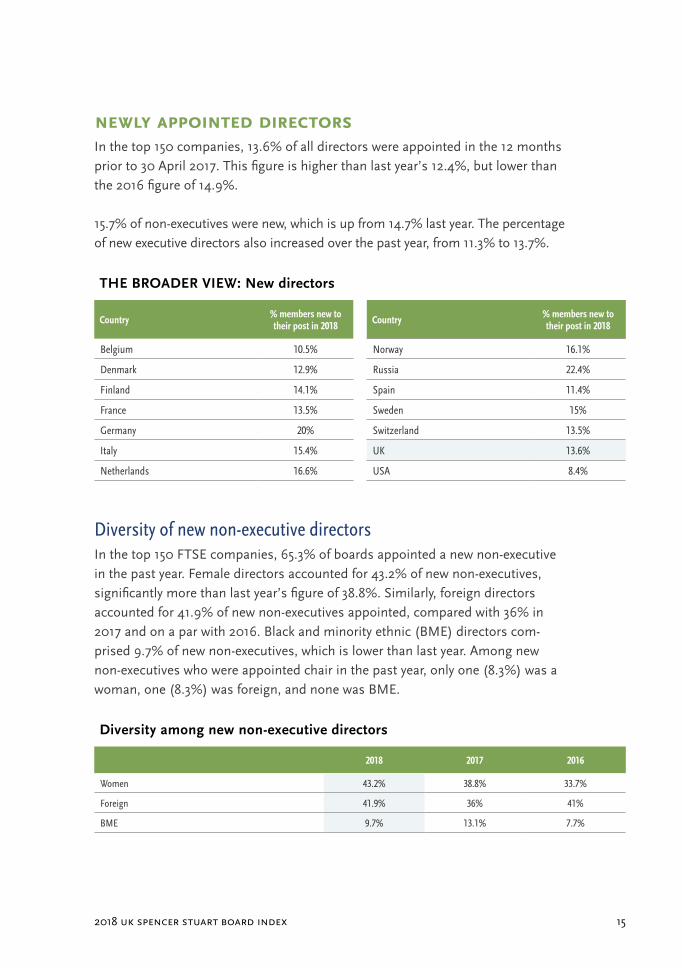
newly appointed direCtorsIn the top 150 companies, 13.6% of all directors were appointed in the 12 months prior to 30 April 2017. This figure is higher than last year’s 12.4%, but lower than the 2016 figure of 14.9%.
15.7% of non-executives were new, which is up from 14.7% last year. The percentage of new executive directors also increased over the past year, from 11.3% to 13.7%.
THE BROADER VIEW: New directors
Country % members new to their post in 2018 Country % members new to
their post in 2018
Belgium 10.5% Norway 16.1%
Denmark 12.9% Russia 22.4%
Finland 14.1% Spain 11.4%
France 13.5% Sweden 15%
Germany 20% Switzerland 13.5%
Italy 15.4% UK 13.6%
Netherlands 16.6% USA 8.4%
Diversity of new non- executive directorsIn the top 150 FTSE companies, 65.3% of boards appointed a new non-executive in the past year. Female directors accounted for 43.2% of new non-executives, significantly more than last year’s figure of 38.8%. Similarly, foreign directors accounted for 41.9% of new non-executives appointed, compared with 36% in 2017 and on a par with 2016. Black and minority ethnic (BME) directors com-prised 9.7% of new non-executives, which is lower than last year. Among new non-executives who were appointed chair in the past year, only one (8.3%) was a woman, one (8.3%) was foreign, and none was BME.
Diversity among new non- executive directors
2018 2017 2016
Women 43.2% 38.8% 33.7%
Foreign 41.9% 36% 41%
BME 9.7% 13.1% 7.7%
spencer stuart16
board composition
Background of new non- executive directorsIn line with last year’s findings, the majority of newly appointed non-executives have backgrounds in financial services (32.7%) or industrial (29.2%) companies. Of those new directors whose background is in financial services, 33.5% are women. Turning to new directors with industrial backgrounds, women account for 34.3% of the cohort.
Among new non-executives, there are 12 new chairs in our sample. All of these chairs had previous non-executive experience on the board of a quoted company, seven had CEO experience, and half had executive experience in financial services.
The majority (74.2%) of the new non-executive directors had a general manage-ment, divisional CEO, or CEO background — a level close to last year’s 72.8%. Of these, 40% are women. A further 16.1% of new non-executives had a CFO/audit background; of these, 40% are women.
First- time non- executive directorsIn this year’s sample, 31.6% of new non-executives were first-time directors of a publicly listed company. This is slightly lower than last year’s figure of 34%. Of these first-time appointments, 46.9% are female, a significant increase from 38% in 2017 and higher than the 43.6% average for all new non-executives. Furthermore, 51% of first-time non-executives are foreign, compared with 39.3% of all new non-executives. This figure is also significantly higher than the 33% recorded last year.
Of the newly appointed chairs, all had previous listed company board experience, although only 75% of them had previously chaired a listed company.
2018 uk spencer stuart board index 17
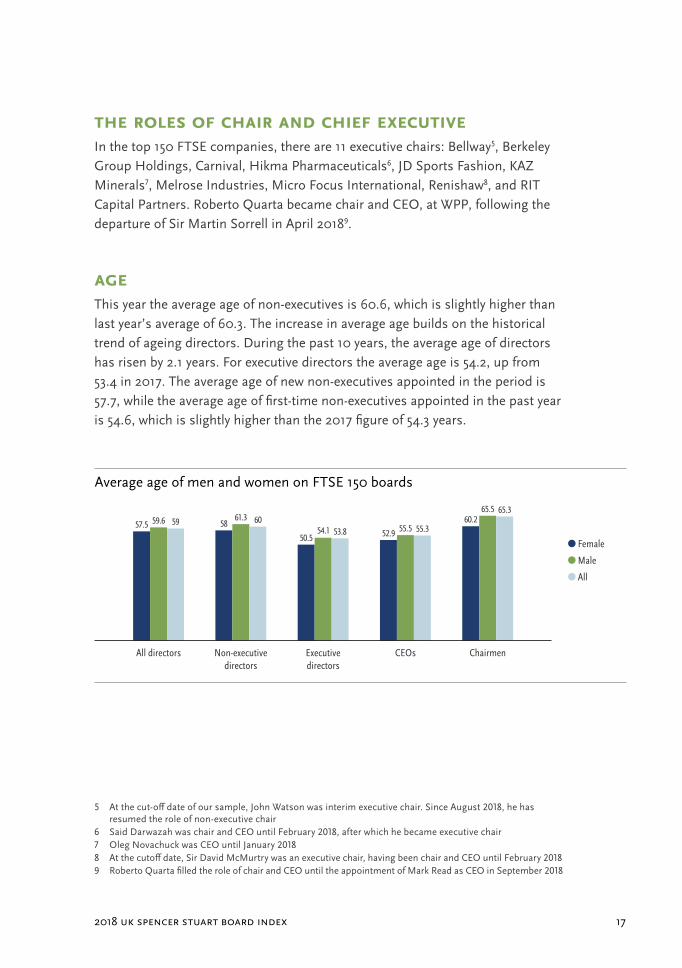
tHe roles oF CHair and CHieF exeCUtiveIn the top 150 FTSE companies, there are 11 executive chairs: Bellway5, Berkeley Group Holdings, Carnival, Hikma Pharmaceuticals6, JD Sports Fashion, KAZ Minerals7, Melrose Industries, Micro Focus International, Renishaw8, and RIT Capital Partners. Roberto Quarta became chair and CEO, at WPP, following the departure of Sir Martin Sorrell in April 20189.
ageThis year the average age of non-executives is 60.6, which is slightly higher than last year’s average of 60.3. The increase in average age builds on the historical trend of ageing directors. During the past 10 years, the average age of directors has risen by 2.1 years. For executive directors the average age is 54.2, up from 53.4 in 2017. The average age of new non-executives appointed in the period is 57.7, while the average age of first-time non-executives appointed in the past year is 54.6, which is slightly higher than the 2017 figure of 54.3 years.
5 At the cut-off date of our sample, John Watson was interim executive chair. Since August 2018, he has resumed the role of non-executive chair
6 Said Darwazah was chair and CEO until February 2018, after which he became executive chair7 Oleg Novachuck was CEO until January 20188 At the cutoff date, Sir David McMurtry was an executive chair, having been chair and CEO until February 20189 Roberto Quarta filled the role of chair and CEO until the appointment of Mark Read as CEO in September 2018
Average age of men and women on FTSE 150 boards
Executive directors
CEOs ChairmenNon-executive directors
All directors
57.5 59.6 59 6053.8 55.3
65.3
5861.3
52.9 55.550.5
54.160.2
65.5
Female
Male
All
spencer stuart18
board composition
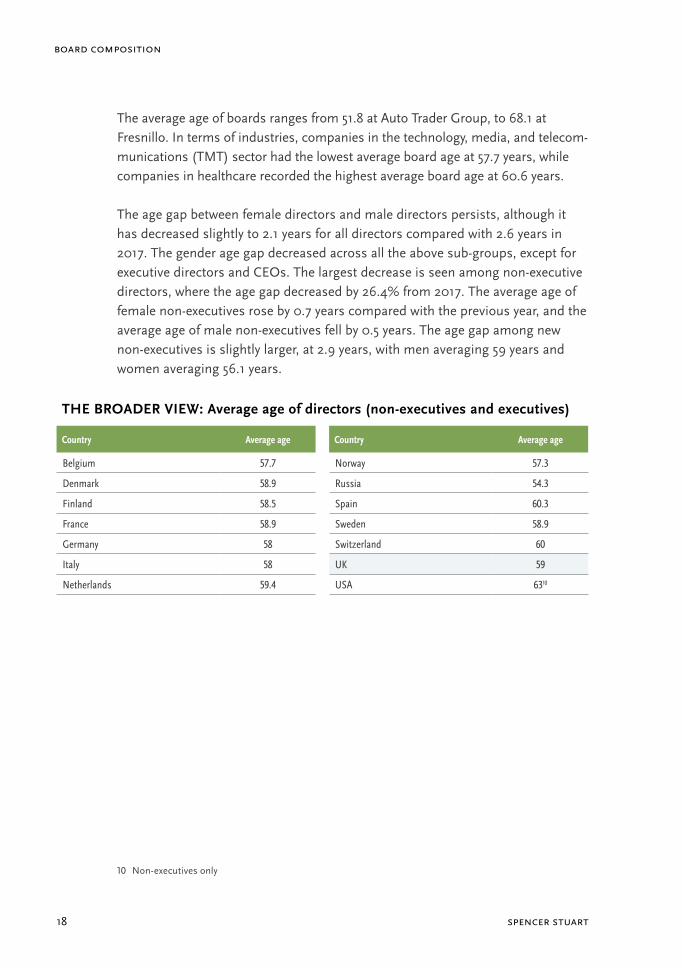
The average age of boards ranges from 51.8 at Auto Trader Group, to 68.1 at Fresnillo. In terms of industries, companies in the technology, media, and telecom-munications (TMT) sector had the lowest average board age at 57.7 years, while companies in healthcare recorded the highest average board age at 60.6 years.
The age gap between female directors and male directors persists, although it has decreased slightly to 2.1 years for all directors compared with 2.6 years in 2017. The gender age gap decreased across all the above sub-groups, except for executive directors and CEOs. The largest decrease is seen among non-executive directors, where the age gap decreased by 26.4% from 2017. The average age of female non-executives rose by 0.7 years compared with the previous year, and the average age of male non-executives fell by 0.5 years. The age gap among new non-executives is slightly larger, at 2.9 years, with men averaging 59 years and women averaging 56.1 years.
THE BROADER VIEW: Average age of directors (non-executives and executives)
Country Average age Country Average age
Belgium 57.7 Norway 57.3
Denmark 58.9 Russia 54.3
Finland 58.5 Spain 60.3
France 58.9 Sweden 58.9
Germany 58 Switzerland 60
Italy 58 UK 59
Netherlands 59.4 USA 6310
10 Non-executives only
2018 uk spencer stuart board index 19
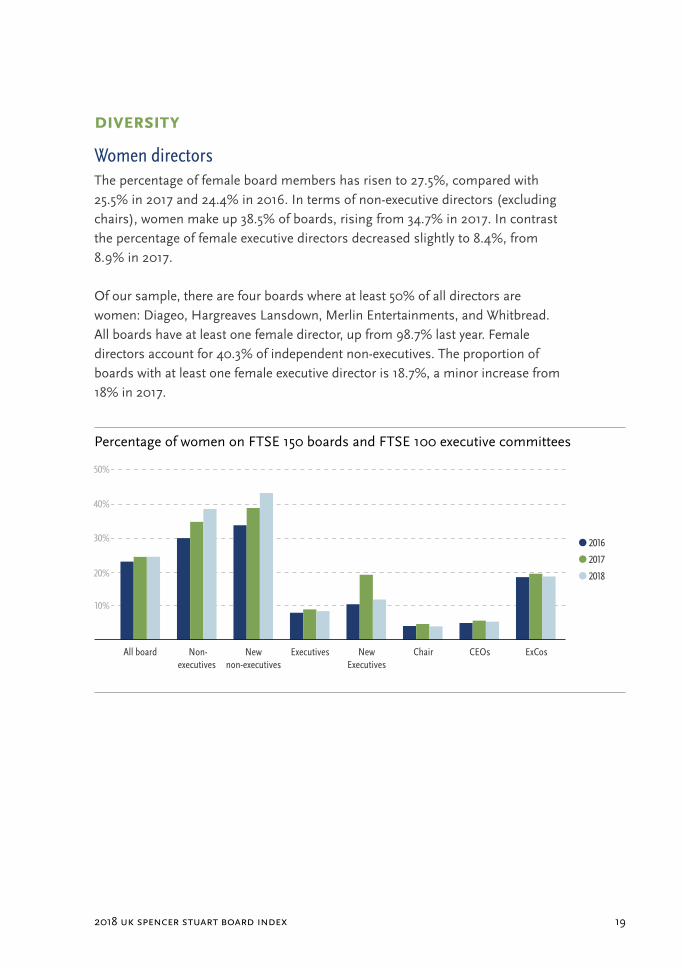
diversity
Women directorsThe percentage of female board members has risen to 27.5%, compared with 25.5% in 2017 and 24.4% in 2016. In terms of non-executive directors (excluding chairs), women make up 38.5% of boards, rising from 34.7% in 2017. In contrast the percentage of female executive directors decreased slightly to 8.4%, from 8.9% in 2017.
Of our sample, there are four boards where at least 50% of all directors are women: Diageo, Hargreaves Lansdown, Merlin Entertainments, and Whitbread. All boards have at least one female director, up from 98.7% last year. Female directors account for 40.3% of independent non-executives. The proportion of boards with at least one female executive director is 18.7%, a minor increase from 18% in 2017.
Executives New Executives
Chair CEOs ExCosNon- executives
New non-executives
All board
2016
2017
2018
40%
50%
30%
20%
10%
Percentage of women on FTSE 150 boards and FTSE 100 executive committees
spencer stuart20
board composition
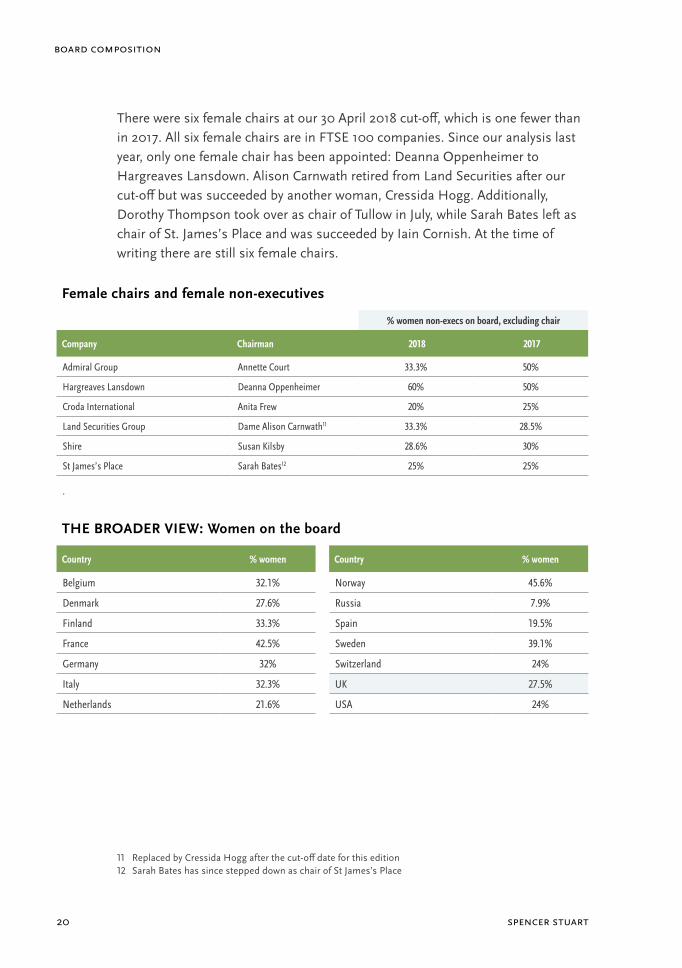
There were six female chairs at our 30 April 2018 cut-off, which is one fewer than in 2017. All six female chairs are in FTSE 100 companies. Since our analysis last year, only one female chair has been appointed: Deanna Oppenheimer to Hargreaves Lansdown. Alison Carnwath retired from Land Securities after our cut-off but was succeeded by another woman, Cressida Hogg. Additionally, Dorothy Thompson took over as chair of Tullow in July, while Sarah Bates left as chair of St. James’s Place and was succeeded by Iain Cornish. At the time of writing there are still six female chairs.
Female chairs and female non-executives
% women non-execs on board, excluding chair
Company Chairman 2018 2017
Admiral Group Annette Court 33.3% 50%
Hargreaves Lansdown Deanna Oppenheimer 60% 50%
Croda International Anita Frew 20% 25%
Land Securities Group Dame Alison Carnwath11 33.3% 28.5%
Shire Susan Kilsby 28.6% 30%
St James’s Place Sarah Bates12 25% 25%
.
THE BROADER VIEW: Women on the board
Country % women Country % women
Belgium 32.1% Norway 45.6%
Denmark 27.6% Russia 7.9%
Finland 33.3% Spain 19.5%
France 42.5% Sweden 39.1%
Germany 32% Switzerland 24%
Italy 32.3% UK 27.5%
Netherlands 21.6% USA 24%
11 Replaced by Cressida Hogg after the cut-off date for this edition12 Sarah Bates has since stepped down as chair of St James’s Place
2018 uk spencer stuart board index 21
Hampton-alexander review A target has been set for FTSE 350 companies to have 33% women on their boards by 2020.
The most recent figures from the Hampton-Alexander Review, released in November 2018, show that across all FTSE 350 companies 26.7% of directors are women, up from 24.5% in October 2017. For the FTSE 100 the figure is 30.2% (up from 27.7% last year) and in the FTSE 250 the figure is 24.9% (up from 22.8% last year).
In our sample of the top 150 FTSE companies, 40 companies (just under 27%) have reached the 33% target. This marks an increase from last year’s 21%, but the figure still represents a significant shortfall.
Hampton-Alexander also set a new target for FTSE 100 companies of 33% female representation in executive committees (ExCos) and direct reports to ExCo, also by 2020. We do not track below ExCo level, but our analysis of FTSE 100 ExCos, where information is available, shows that 18.6% of ExCo members are women (see chart on page 22).
spencer stuart22
board composition
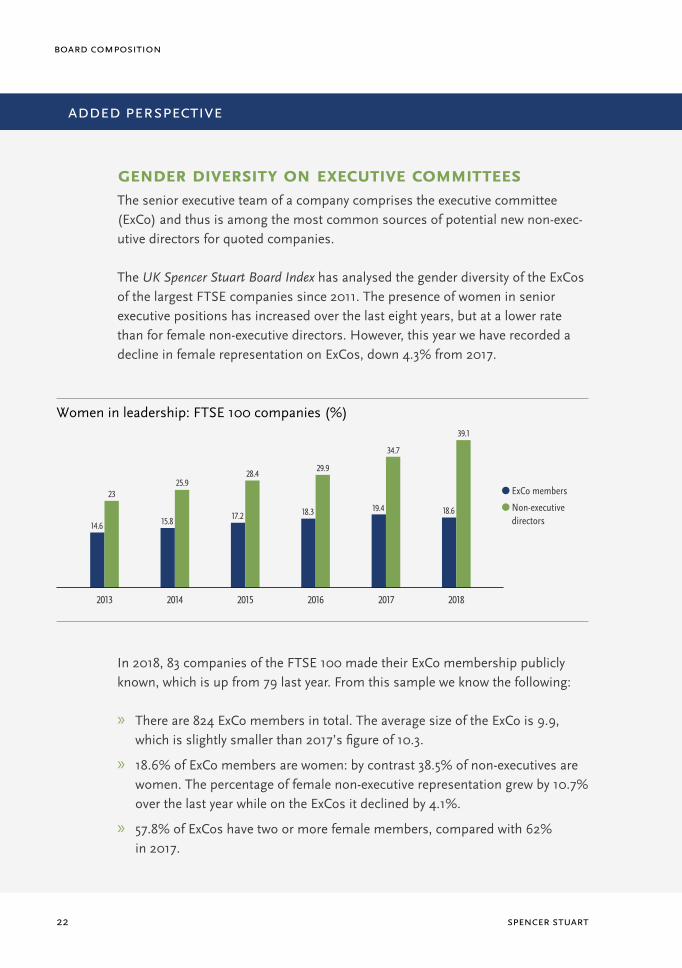
gender diversity on exeCUtive CommitteesThe senior executive team of a company comprises the executive committee (ExCo) and thus is among the most common sources of potential new non-exec-utive directors for quoted companies.
The UK Spencer Stuart Board Index has analysed the gender diversity of the ExCos of the largest FTSE companies since 2011. The presence of women in senior executive positions has increased over the last eight years, but at a lower rate than for female non-executive directors. However, this year we have recorded a decline in female representation on ExCos, down 4.3% from 2017.
In 2018, 83 companies of the FTSE 100 made their ExCo membership publicly known, which is up from 79 last year. From this sample we know the following:
» There are 824 ExCo members in total. The average size of the ExCo is 9.9, which is slightly smaller than 2017’s figure of 10.3.
» 18.6% of ExCo members are women: by contrast 38.5% of non-executives are women. The percentage of female non-executive representation grew by 10.7% over the last year while on the ExCos it declined by 4.1%.
» 57.8% of ExCos have two or more female members, compared with 62% in 2017.
2016
18.3
29.9
2014
15.8
25.9
2017
19.4
34.7
2013
14.6
23
2015
17.2
28.4
Women in leadership: FTSE 100 companies (%)
2018
18.6
39.1
ExCo members
Non-executive directors
added perspective
2018 uk spencer stuart board index 23
» 15.7% of ExCos are all-male, up from 7.6% in 2017.
» 36.6% of women on ExCos hold a non-executive directorship on another listed company. This is a 93.7% increase from 2017.
» 28.1% of women on ExCos are in HR roles, a proportion very close to that for the preceding year.
» The average age of women on FTSE 100 ExCos is 51.5, which is 0.9 years higher than in 2017.
» UK nationals comprise 53% of ExCo members, down from 61.6% in 2017.
» 37.6% of ExCo members are foreign, of whom 28.1% are from the US. (‘Foreign’ is defined as being of different nationality from that of the company.)
» The largest ExCos are seen at Carnival and Randgold Resources, each with 24 members. The smallest are at Compass Group, Fresnillo, Micro Focus International and SSE, each at four members.
» Eight companies have four or more women on their ExCo; none of these com-panies had a female CEO or chair.
» 10.2% of all ExCo members fall into the BME category, similar to the 2017 figure of 10.6%.
In six of the eight companies where the CEO is female, the percentage of women serving on the ExCo is above the FTSE 100 average of 18.6%.
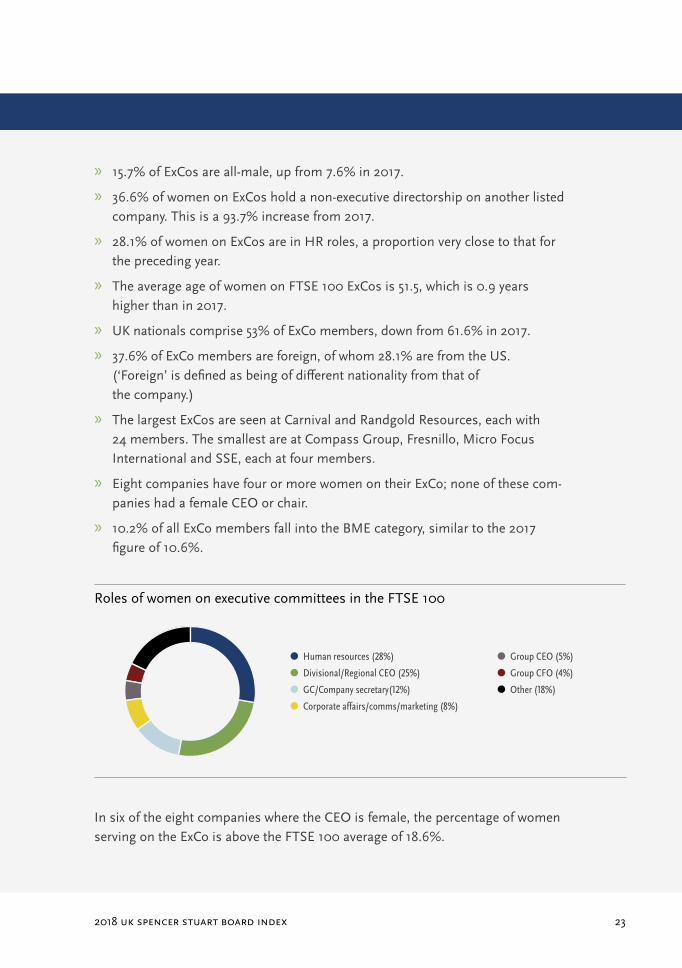
Human resources (28%)
Divisional/Regional CEO (25%)
GC/Company secretary(12%)
Corporate affairs/comms/marketing (8%)
Group CEO (5%)
Group CFO (4%)
Other (18%)
Roles of women on executive committees in the FTSE 100
added perspective
spencer stuart24
board composition
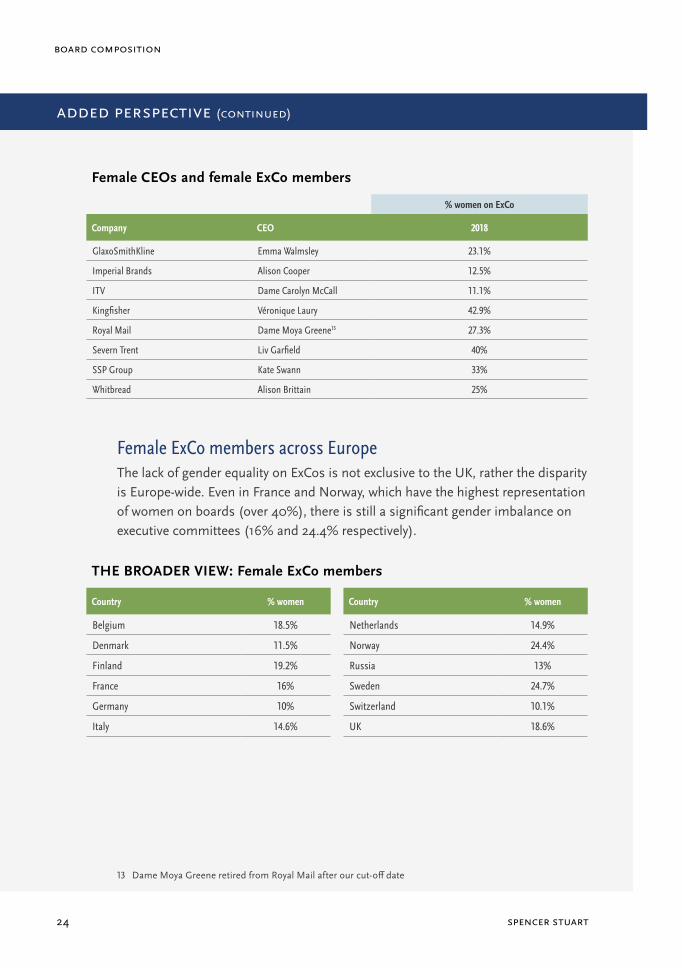
Female CEOs and female ExCo members
% women on ExCo
Company CEO 2018
GlaxoSmithKline Emma Walmsley 23.1%
Imperial Brands Alison Cooper 12.5%
ITV Dame Carolyn McCall 11.1%
Kingfisher Véronique Laury 42.9%
Royal Mail Dame Moya Greene13 27.3%
Severn Trent Liv Garfield 40%
SSP Group Kate Swann 33%
Whitbread Alison Brittain 25%
Female ExCo members across EuropeThe lack of gender equality on ExCos is not exclusive to the UK, rather the disparity is Europe-wide. Even in France and Norway, which have the highest representation of women on boards (over 40%), there is still a significant gender imbalance on executive committees (16% and 24.4% respectively).
THE BROADER VIEW: Female ExCo members
Country % women Country % women
Belgium 18.5% Netherlands 14.9%
Denmark 11.5% Norway 24.4%
Finland 19.2% Russia 13%
France 16% Sweden 24.7%
Germany 10% Switzerland 10.1%
Italy 14.6% UK 18.6%
13 Dame Moya Greene retired from Royal Mail after our cut-off date
added perspective (continued)
2018 uk spencer stuart board index 25
Foreign directorsIn our analysis, foreign directors are defined as having a nationality that differs from that of the company. On this basis, foreign directors make up 33.6% of all directors compared with 32.3% in 2017. The percentage of companies with at least one foreign director on their board continues to rise. This year, 83.3% of companies have at least one foreign director on their board, up from 79.3% in 2017. 80.7% of companies have at least one foreign non-executive director and 45.3% of companies have at least one foreign executive director on their board. Those companies with no foreign directors are businesses whose activities are focused exclusively on the UK.
Of the 25 boards with no foreign directors, 10 are in financial services and a fur-ther 10 are in industrial. Six companies are composed of more than 80% foreign directors. An average of 3.7 nationalities are represented on the boards in our cohort, up from 3.3 last year. On the boards of 24 companies at least six different nationalities are present. No one industry has disproportionately more foreign directors than any other.
Turning to all chairs, 20.5% are foreign, while 25.8% are non-UK nationals. For CEOs this figure is higher: 30.6% are foreign and 34.7% are non-UK nationals. At 16 companies both the CEO and the chair are foreign. Of these companies, four are in healthcare and three are in TMT. 14.7% of companies have non-UK nation-als as both chair and CEO.
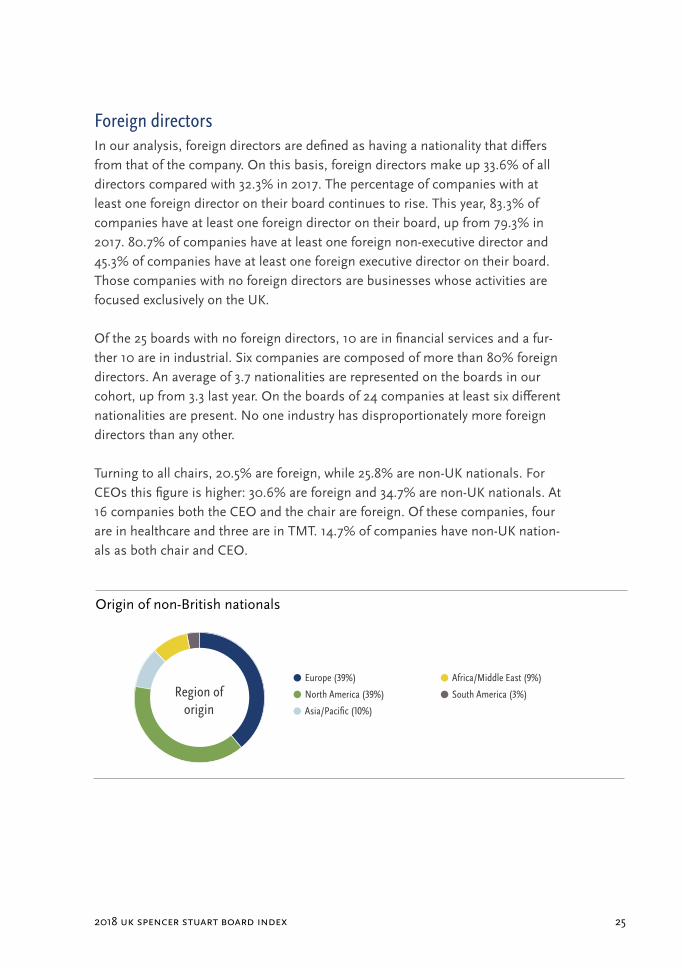
Origin of non-British nationals
Europe (39%)
North America (39%)
Asia/Pacific (10%)
Africa/Middle East (9%)
South America (3%)Region of origin
spencer stuart26
board composition
19.5% of all deputy chairs and senior independent directors are foreign, while 21.8% are non-UK nationals.
THE BROADER VIEW: Foreign directors
Country % foreign directors on boards Country % foreign directors
on boards
Belgium 30.4% Norway 28.2%
Denmark 39.4% Russia 26.3%
Finland 33.8% Spain 19.8%
France 35% Sweden 33.6%
Germany 25.3% Switzerland 58.2%
Italy 10.1% UK 33.3%
Netherlands 39% USA 8.2%
EthnicityThis is the fourth year that we have sought to determine the proportion of black and minority ethnic (BME) directors in our top 150 FTSE sample.
This year, 8% of total board members were identified as BME. If looking at the UK, west European, US, and Australian companies as a group, the percentage increase in BME membership rose to 7.5%, from 6.7% last year. Among non-ex-ecutive directors, 10.9% are BME; the comparable figure for executive directors is 3.8%. UK national BME directors represent 2% of the total sample, continuing the gradual upwards trend from 1.9% in 2017 and 1.6% in 2016. Of the total cohort of BME directors, 25.4% are UK nationals, falling from last year’s 29.6%.
The 2016 Parker Review encouraged companies to aim for a target of one director of colour by 2021 for FTSE 100 boards and by 2024 for FTSE 250 boards. The review also urged organisations to develop a pipeline of board-ready candidates in their executive ranks, and to enhance transparency in this area.
2018 uk spencer stuart board index 27
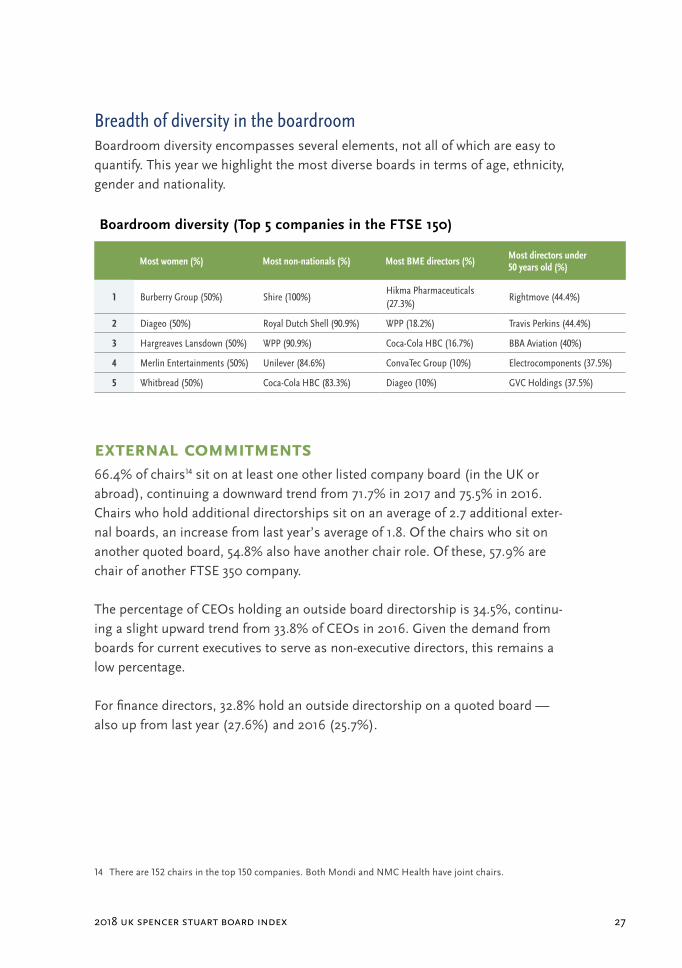
Breadth of diversity in the boardroomBoardroom diversity encompasses several elements, not all of which are easy to quantify. This year we highlight the most diverse boards in terms of age, ethnicity, gender and nationality.
Boardroom diversity (Top 5 companies in the FTSE 150)
Most women (%) Most non-nationals (%) Most BME directors (%) Most directors under 50 years old (%)
1 Burberry Group (50%) Shire (100%)Hikma Pharmaceuticals (27.3%)
Rightmove (44.4%)
2 Diageo (50%) Royal Dutch Shell (90.9%) WPP (18.2%) Travis Perkins (44.4%)
3 Hargreaves Lansdown (50%) WPP (90.9%) Coca-Cola HBC (16.7%) BBA Aviation (40%)
4 Merlin Entertainments (50%) Unilever (84.6%) ConvaTec Group (10%) Electrocomponents (37.5%)
5 Whitbread (50%) Coca-Cola HBC (83.3%) Diageo (10%) GVC Holdings (37.5%)
external Commitments66.4% of chairs14 sit on at least one other listed company board (in the UK or abroad), continuing a downward trend from 71.7% in 2017 and 75.5% in 2016. Chairs who hold additional directorships sit on an average of 2.7 additional exter-nal boards, an increase from last year’s average of 1.8. Of the chairs who sit on another quoted board, 54.8% also have another chair role. Of these, 57.9% are chair of another FTSE 350 company.
The percentage of CEOs holding an outside board directorship is 34.5%, continu-ing a slight upward trend from 33.8% of CEOs in 2016. Given the demand from boards for current executives to serve as non-executive directors, this remains a low percentage.
For finance directors, 32.8% hold an outside directorship on a quoted board — also up from last year (27.6%) and 2016 (25.7%).
14 There are 152 chairs in the top 150 companies. Both Mondi and NMC Health have joint chairs.
spencer stuart28
board composition
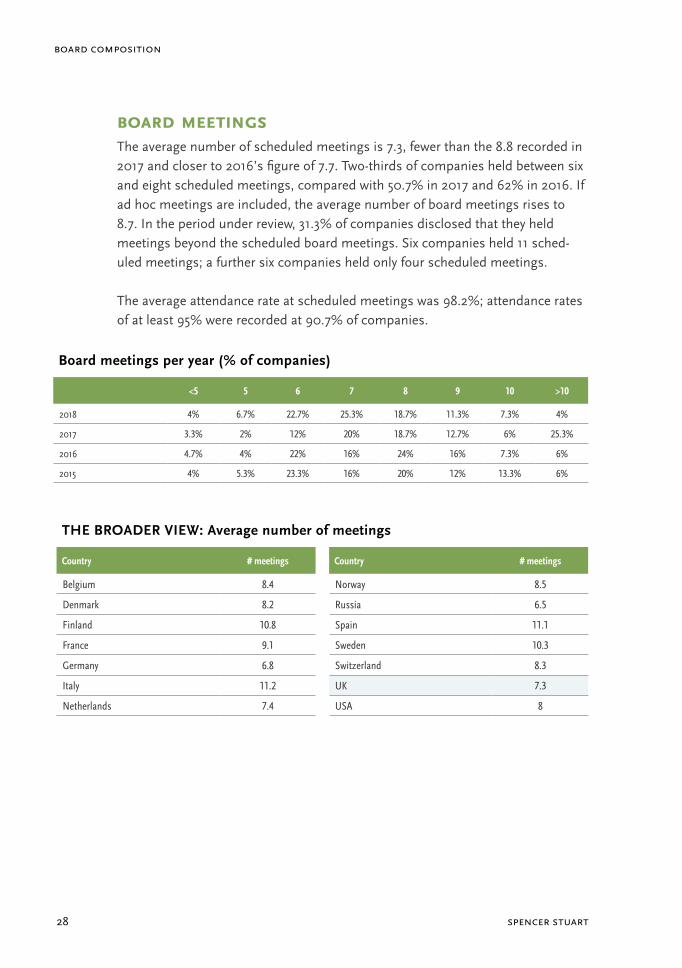
Board meetingsThe average number of scheduled meetings is 7.3, fewer than the 8.8 recorded in 2017 and closer to 2016’s figure of 7.7. Two-thirds of companies held between six and eight scheduled meetings, compared with 50.7% in 2017 and 62% in 2016. If ad hoc meetings are included, the average number of board meetings rises to 8.7. In the period under review, 31.3% of companies disclosed that they held meetings beyond the scheduled board meetings. Six companies held 11 sched-uled meetings; a further six companies held only four scheduled meetings.
The average attendance rate at scheduled meetings was 98.2%; attendance rates of at least 95% were recorded at 90.7% of companies.
Board meetings per year (% of companies)
<5 5 6 7 8 9 10 >10
2018 4% 6.7% 22.7% 25.3% 18.7% 11.3% 7.3% 4%
2017 3.3% 2% 12% 20% 18.7% 12.7% 6% 25.3%
2016 4.7% 4% 22% 16% 24% 16% 7.3% 6%
2015 4% 5.3% 23.3% 16% 20% 12% 13.3% 6%
THE BROADER VIEW: Average number of meetings
Country # meetings Country # meetings
Belgium 8.4 Norway 8.5
Denmark 8.2 Russia 6.5
Finland 10.8 Spain 11.1
France 9.1 Sweden 10.3
Germany 6.8 Switzerland 8.3
Italy 11.2 UK 7.3
Netherlands 7.4 USA 8
2018 uk spencer stuart board index 29
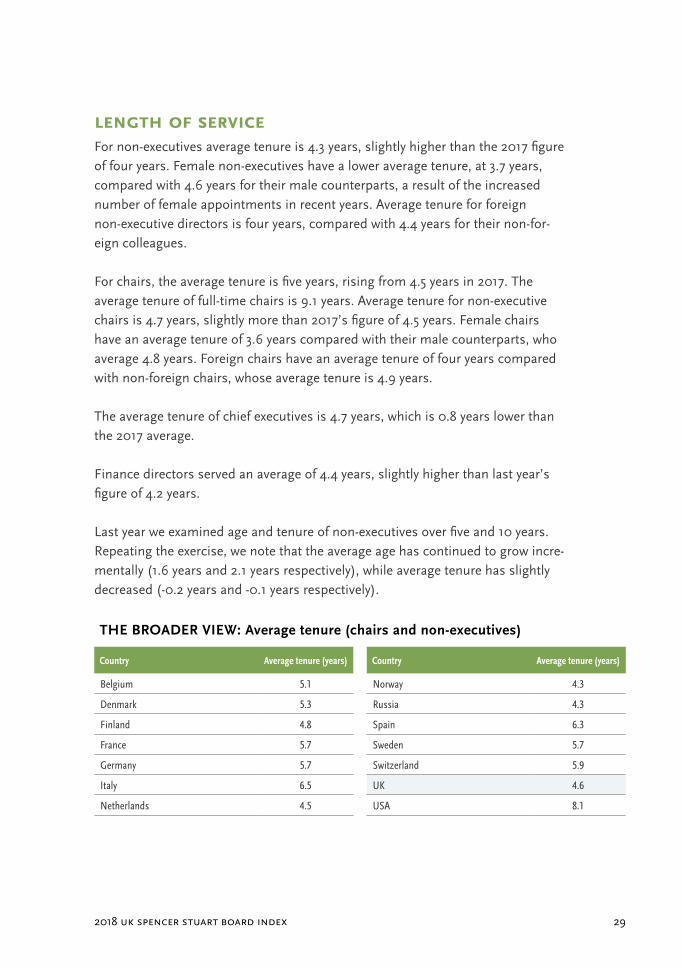
lengtH oF serviCeFor non-executives average tenure is 4.3 years, slightly higher than the 2017 figure of four years. Female non-executives have a lower average tenure, at 3.7 years, compared with 4.6 years for their male counterparts, a result of the increased number of female appointments in recent years. Average tenure for foreign non-executive directors is four years, compared with 4.4 years for their non-for-eign colleagues.
For chairs, the average tenure is five years, rising from 4.5 years in 2017. The average tenure of full-time chairs is 9.1 years. Average tenure for non-executive chairs is 4.7 years, slightly more than 2017’s figure of 4.5 years. Female chairs have an average tenure of 3.6 years compared with their male counterparts, who average 4.8 years. Foreign chairs have an average tenure of four years compared with non-foreign chairs, whose average tenure is 4.9 years.
The average tenure of chief executives is 4.7 years, which is 0.8 years lower than the 2017 average.
Finance directors served an average of 4.4 years, slightly higher than last year’s figure of 4.2 years.
Last year we examined age and tenure of non-executives over five and 10 years. Repeating the exercise, we note that the average age has continued to grow incre-mentally (1.6 years and 2.1 years respectively), while average tenure has slightly decreased (-0.2 years and -0.1 years respectively).
THE BROADER VIEW: Average tenure (chairs and non-executives)
Country Average tenure (years) Country Average tenure (years)
Belgium 5.1 Norway 4.3
Denmark 5.3 Russia 4.3
Finland 4.8 Spain 6.3
France 5.7 Sweden 5.7
Germany 5.7 Switzerland 5.9
Italy 6.5 UK 4.6
Netherlands 4.5 USA 8.1
spencer stuart30
board composition
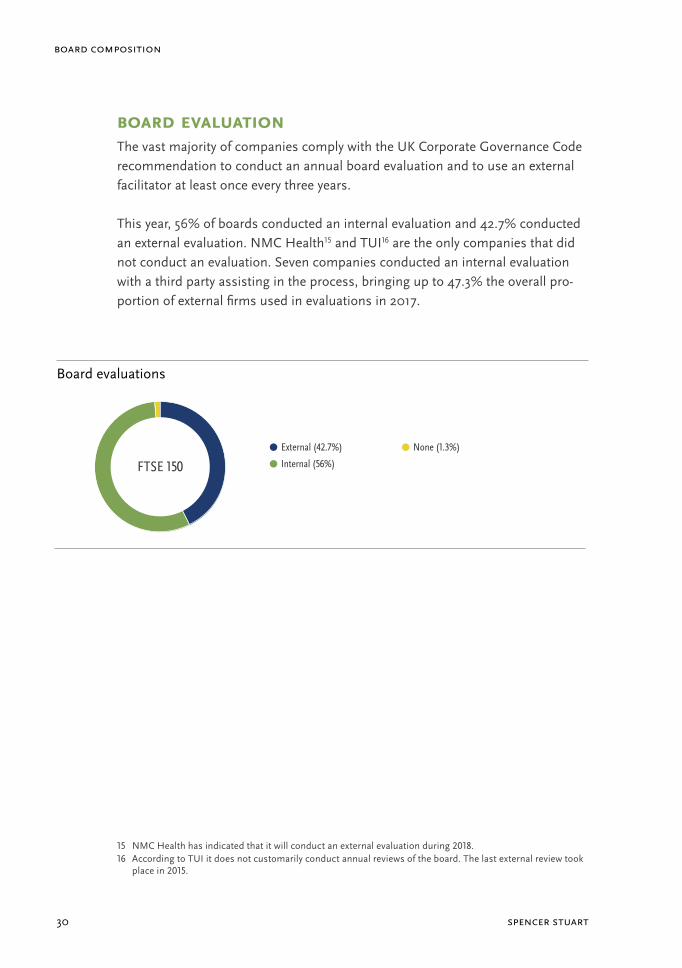
Board evalUationThe vast majority of companies comply with the UK Corporate Governance Code recommendation to conduct an annual board evaluation and to use an external facilitator at least once every three years.
This year, 56% of boards conducted an internal evaluation and 42.7% conducted an external evaluation. NMC Health15 and TUI16 are the only companies that did not conduct an evaluation. Seven companies conducted an internal evaluation with a third party assisting in the process, bringing up to 47.3% the overall pro-portion of external firms used in evaluations in 2017.
15 NMC Health has indicated that it will conduct an external evaluation during 2018.16 According to TUI it does not customarily conduct annual reviews of the board. The last external review took
place in 2015.
Board evaluations
External (42.7%)
Internal (56%)
None (1.3%)
FTSE 150
2018 uk spencer stuart board index 31
Remuneration
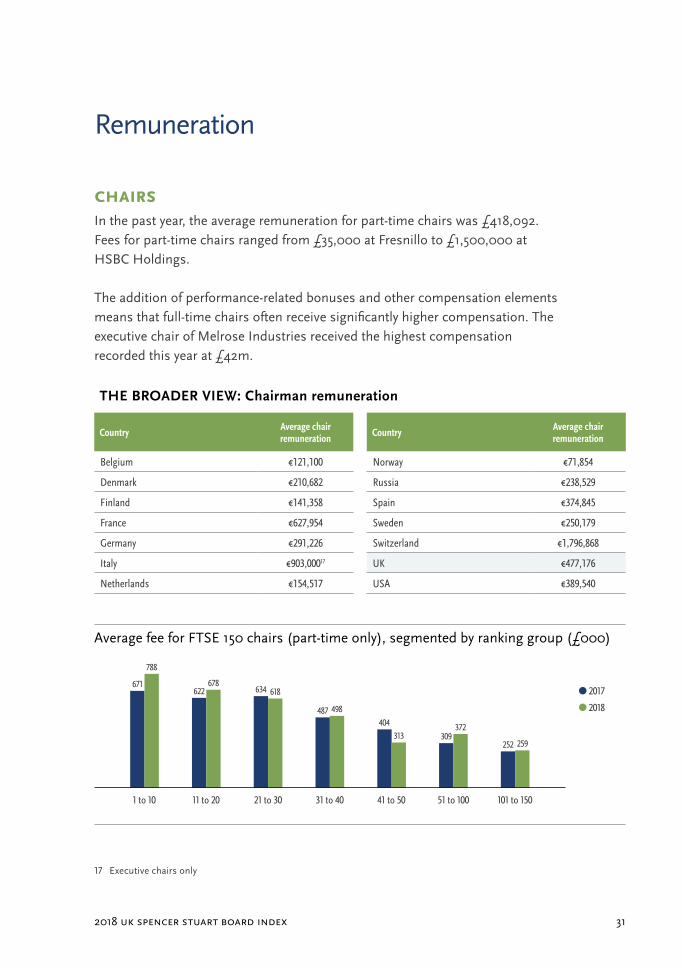
CHairsIn the past year, the average remuneration for part-time chairs was £418,092. Fees for part-time chairs ranged from £35,000 at Fresnillo to £1,500,000 at HSBC Holdings.
The addition of performance-related bonuses and other compensation elements means that full-time chairs often receive significantly higher compensation. The executive chair of Melrose Industries received the highest compensation recorded this year at £42m.
THE BROADER VIEW: Chairman remuneration
Country Average chair remuneration Country Average chair
remuneration
Belgium €121,100 Norway €71,854
Denmark €210,682 Russia €238,529
Finland €141,358 Spain €374,845
France €627,954 Sweden €250,179
Germany €291,226 Switzerland €1,796,868
Italy €903,00017 UK €477,176
Netherlands €154,517 USA €389,540
17 Executive chairs only
31 to 40 41 to 50 51 to 100 101 to 15011 to 20 21 to 301 to 10
Average fee for FTSE 150 chairs (part-time only), segmented by ranking group (£000)
671
788
404313
634 618
252 259
622678
309372
487 498
2017
2018
spencer stuart32
remuneration
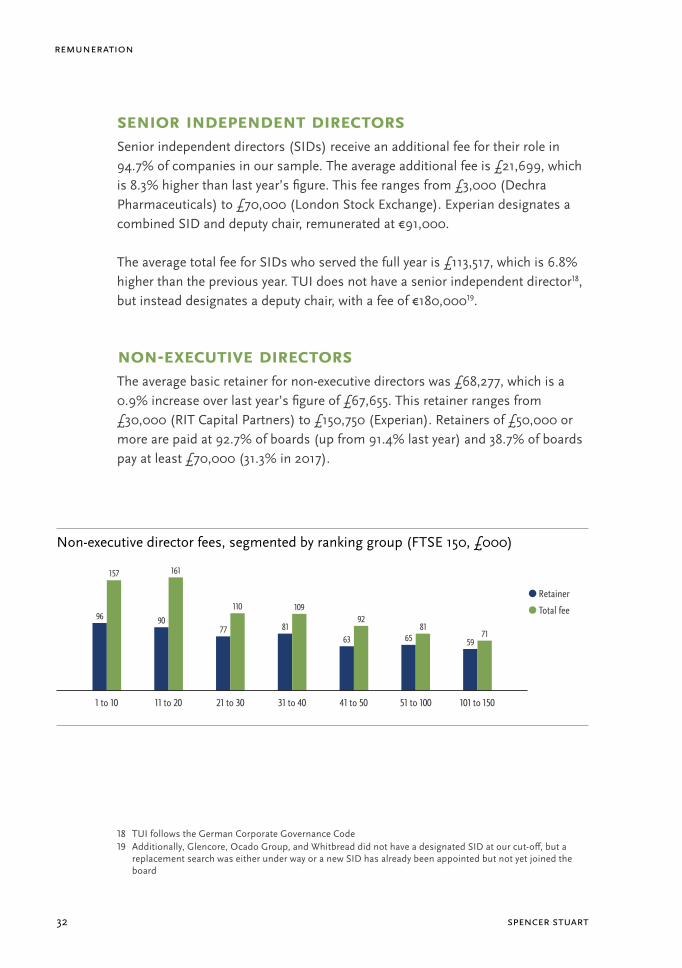
senior independent direCtorsSenior independent directors (SIDs) receive an additional fee for their role in 94.7% of companies in our sample. The average additional fee is £21,699, which is 8.3% higher than last year’s figure. This fee ranges from £3,000 (Dechra Pharmaceuticals) to £70,000 (London Stock Exchange). Experian designates a combined SID and deputy chair, remunerated at €91,000.
The average total fee for SIDs who served the full year is £113,517, which is 6.8% higher than the previous year. TUI does not have a senior independent director18, but instead designates a deputy chair, with a fee of €180,00019.
non- exeCUtive direCtorsThe average basic retainer for non-executive directors was £68,277, which is a 0.9% increase over last year’s figure of £67,655. This retainer ranges from £30,000 (RIT Capital Partners) to £150,750 (Experian). Retainers of £50,000 or more are paid at 92.7% of boards (up from 91.4% last year) and 38.7% of boards pay at least £70,000 (31.3% in 2017).
18 TUI follows the German Corporate Governance Code19 Additionally, Glencore, Ocado Group, and Whitbread did not have a designated SID at our cut-off, but a
replacement search was either under way or a new SID has already been appointed but not yet joined the board
Non-executive director fees, segmented by ranking group (FTSE 150, £000)
31 to 40 41 to 50 51 to 100 101 to 15011 to 20 21 to 301 to 10
96
157
63
9277
110
5971
90
161
658181
109Retainer
Total fee
2018 uk spencer stuart board index 33
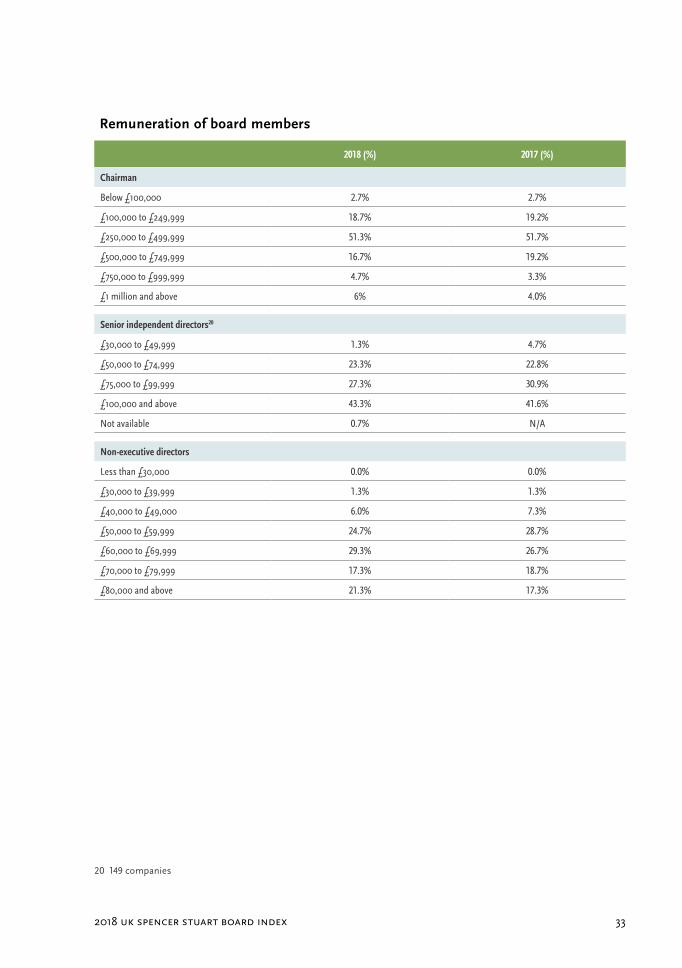
Remuneration of board members
2018 (%) 2017 (%)
Chairman
Below £100,000 2.7% 2.7%
£100,000 to £249,999 18.7% 19.2%
£250,000 to £499,999 51.3% 51.7%
£500,000 to £749,999 16.7% 19.2%
£750,000 to £999,999 4.7% 3.3%
£1 million and above 6% 4.0%
Senior independent directors20
£30,000 to £49,999 1.3% 4.7%
£50,000 to £74,999 23.3% 22.8%
£75,000 to £99,999 27.3% 30.9%
£100,000 and above 43.3% 41.6%
Not available 0.7% N/A
Non- executive directors
Less than £30,000 0.0% 0.0%
£30,000 to £39,999 1.3% 1.3%
£40,000 to £49,000 6.0% 7.3%
£50,000 to £59,999 24.7% 28.7%
£60,000 to £69,999 29.3% 26.7%
£70,000 to £79,999 17.3% 18.7%
£80,000 and above 21.3% 17.3%
20 149 companies
spencer stuart34
remuneration
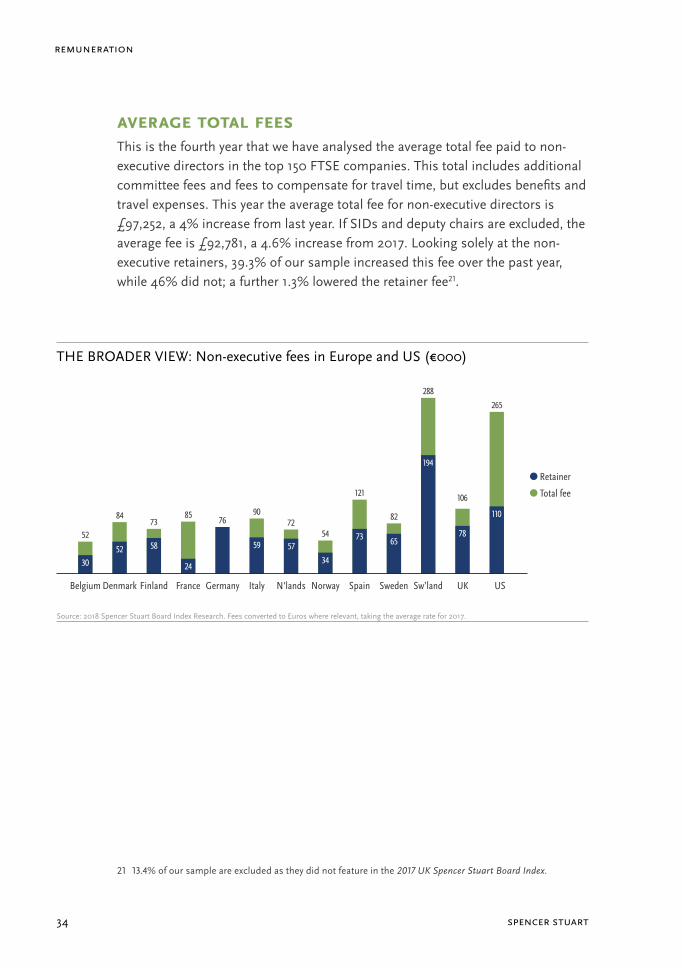
average total FeesThis is the fourth year that we have analysed the average total fee paid to non- executive directors in the top 150 FTSE companies. This total includes additional committee fees and fees to compensate for travel time, but excludes benefits and travel expenses. This year the average total fee for non-executive directors is £97,252, a 4% increase from last year. If SIDs and deputy chairs are excluded, the average fee is £92,781, a 4.6% increase from 2017. Looking solely at the non- executive retainers, 39.3% of our sample increased this fee over the past year, while 46% did not; a further 1.3% lowered the retainer fee21.
21 13.4% of our sample are excluded as they did not feature in the 2017 UK Spencer Stuart Board Index.
Germany Norway UKSw’landSwedenSpainItaly N'landsFranceFinlandDenmarkBelgium US
THE BROADER VIEW: Non- executive fees in Europe and US (€000)
Source: 2018 Spencer Stuart Board Index Research. Fees converted to Euros where relevant, taking the average rate for 2017.
30 2434
194
5273 78
58 5759 65
110
52
8576
54
288
84
121 106
73 7290 82
265
Retainer
Total fee
2018 uk spencer stuart board index 35
Committees
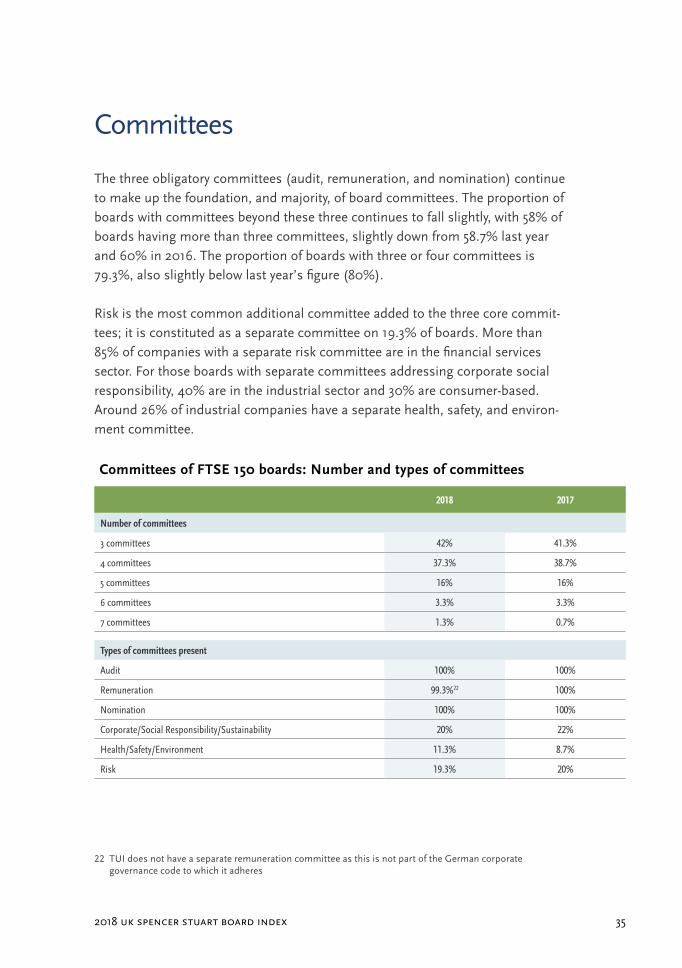
The three obligatory committees (audit, remuneration, and nomination) continue to make up the foundation, and majority, of board committees. The proportion of boards with committees beyond these three continues to fall slightly, with 58% of boards having more than three committees, slightly down from 58.7% last year and 60% in 2016. The proportion of boards with three or four committees is 79.3%, also slightly below last year’s figure (80%).
Risk is the most common additional committee added to the three core commit-tees; it is constituted as a separate committee on 19.3% of boards. More than 85% of companies with a separate risk committee are in the financial services sector. For those boards with separate committees addressing corporate social responsibility, 40% are in the industrial sector and 30% are consumer-based. Around 26% of industrial companies have a separate health, safety, and environ-ment committee.
Committees of FTSE 150 boards: Number and types of committees
2018 2017
Number of committees
3 committees 42% 41.3%
4 committees 37.3% 38.7%
5 committees 16% 16%
6 committees 3.3% 3.3%
7 committees 1.3% 0.7%
Types of committees present
Audit 100% 100%
Remuneration 99.3%22 100%
Nomination 100% 100%
Corporate/Social Responsibility/Sustainability 20% 22%
Health/Safety/Environment 11.3% 8.7%
Risk 19.3% 20%
22 TUI does not have a separate remuneration committee as this is not part of the German corporate governance code to which it adheres
spencer stuart36
committees
The annual average number of audit committee meetings was 5.2, down slightly from last year’s 5.3. The meeting count ranges from two to 14. Similarly, the aver-age number of remuneration committee meetings is 5.2, down from 5.5 in 2017. The range of meetings was two to 12. For nomination committee meetings, the average was four, up from 3.9 in 2017. The range for nomination committee meetings was two to 12. Several boards held ad hoc committee meetings in addi-tion to scheduled meetings.
For companies that maintained a separate risk committee, the average number of meetings was 6.1, up from 5.6 in 2017. The range of meetings was from two to 12.
aUdit Committee CHairsThe majority of audit chairs (64.7%) continue to come from CFO backgrounds. Of those with a CFO background, 9% also have a background as an audit partner. In total, 24% of audit chairs have been audit partners in a major accounting firm, up from 20% last year. The proportion of audit chairs held by women is 21.9%, up from 18% in 2017. Among audit chairs, 21.2% are non-UK nationals and 3.3% are BME.
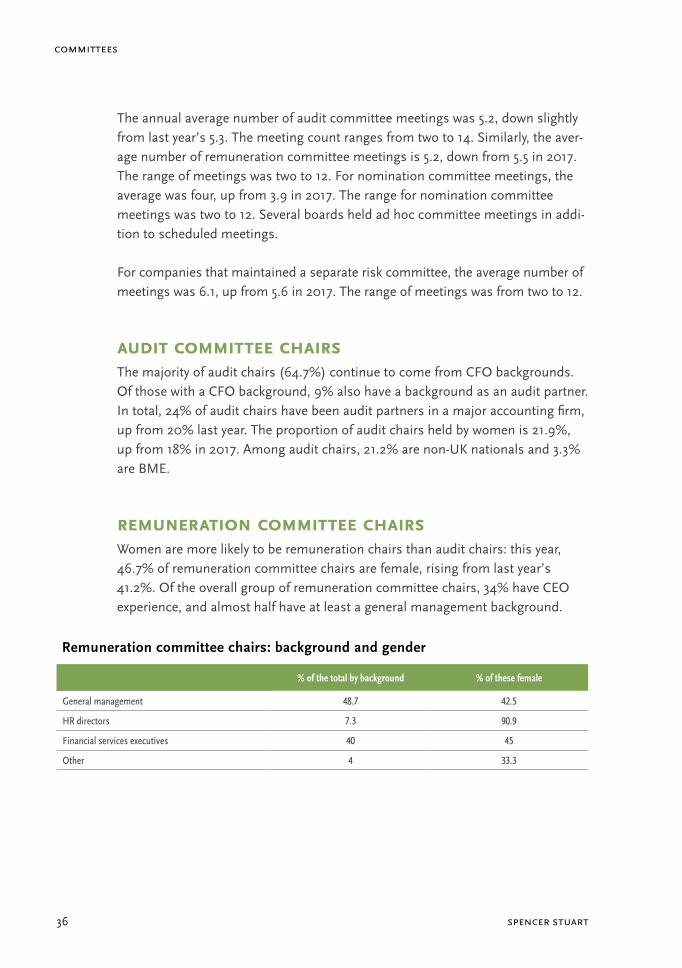
remUneration Committee CHairsWomen are more likely to be remuneration chairs than audit chairs: this year, 46.7% of remuneration committee chairs are female, rising from last year’s 41.2%. Of the overall group of remuneration committee chairs, 34% have CEO experience, and almost half have at least a general management background.
Remuneration committee chairs: background and gender
% of the total by background % of these female
General management 48.7 42.5
HR directors 7.3 90.9
Financial services executives 40 45
Other 4 33.3
2018 uk spencer stuart board index 37
remUneration For Committee memBers and CHairsRemuneration for committee membership continues to grow slightly. Both TUI and Polymetal International pay a per-meeting attendance fee, in addition to separate fees for committee membership and the committee chair. Audit and risk chairs continue to receive the highest fees, followed by chairs of remuneration committees. Only 28% of our sample remunerated nomination chairs separately, as most are also chairs of the board.
Retainers paid to audit committee chairs have risen by 2.7% to an average of £24,54223, with fees ranging from £5,000 to £110,458. TUI continues to pay the highest fee at €126,00024, followed by GlaxoSmithKline (£80,000) and Evraz ($100,000). John Wood Group and Dechra Pharmaceuticals each pay the lowest fee, at £5,000.
Remuneration committee chairs receive an average fee of £21,15325, an increase of 4.2% on 2017. The range of the fee paid is £5,000 (John Wood Group and Dechra Pharmaceuticals) to £71,400 (Lloyds Banking Group).
Risk committee chairs continue to receive the highest average retainer, at £34,155. This is 6% higher than last year’s figure, and represents the highest percentage growth among committee chair retainer fees. The fee range is from £10,000 (Hargreaves Lansdown) to £75,000 (Prudential).
23 Not all companies disclose audit committee chair fees24 TUI remunerates audit, presiding, and strategy committee chairs at three times the base fee, plus a €1,000
per-meeting fee to both chairs and members25 Not all companies disclose remuneration committee chair fees
spencer stuart38
committees
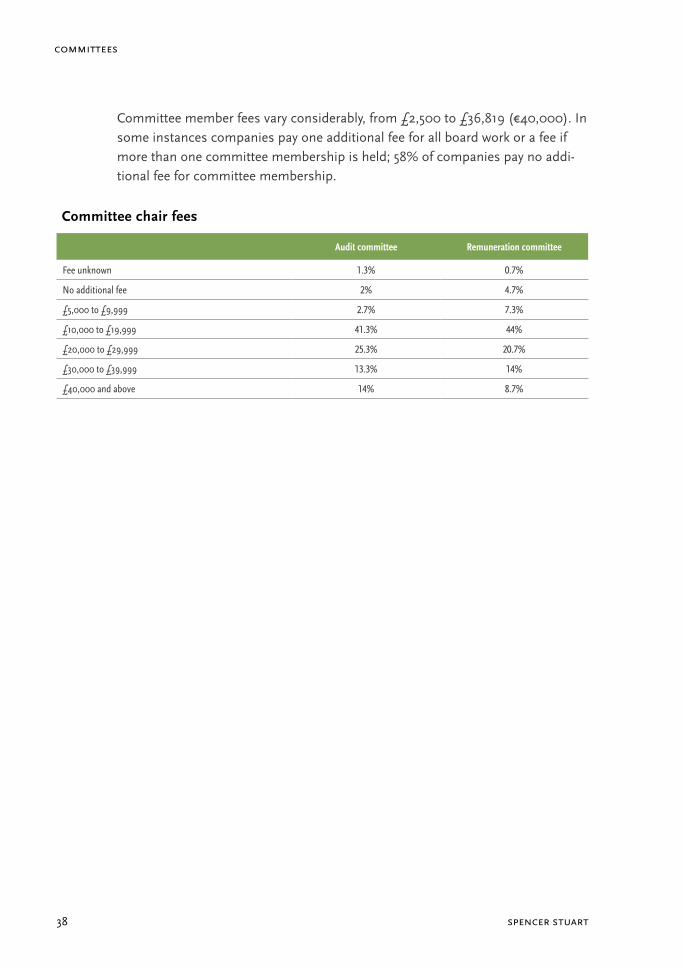
Committee member fees vary considerably, from £2,500 to £36,819 (€40,000). In some instances companies pay one additional fee for all board work or a fee if more than one committee membership is held; 58% of companies pay no addi-tional fee for committee membership.
Committee chair fees
Audit committee Remuneration committee
Fee unknown 1.3% 0.7%
No additional fee 2% 4.7%
£5,000 to £9,999 2.7% 7.3%
£10,000 to £19,999 41.3% 44%
£20,000 to £29,999 25.3% 20.7%
£30,000 to £39,999 13.3% 14%
£40,000 and above 14% 8.7%
2018 uk spencer stuart board index 39
Data tables
International comparison
Board composition
Board remuneration and committees
spencer stuart40
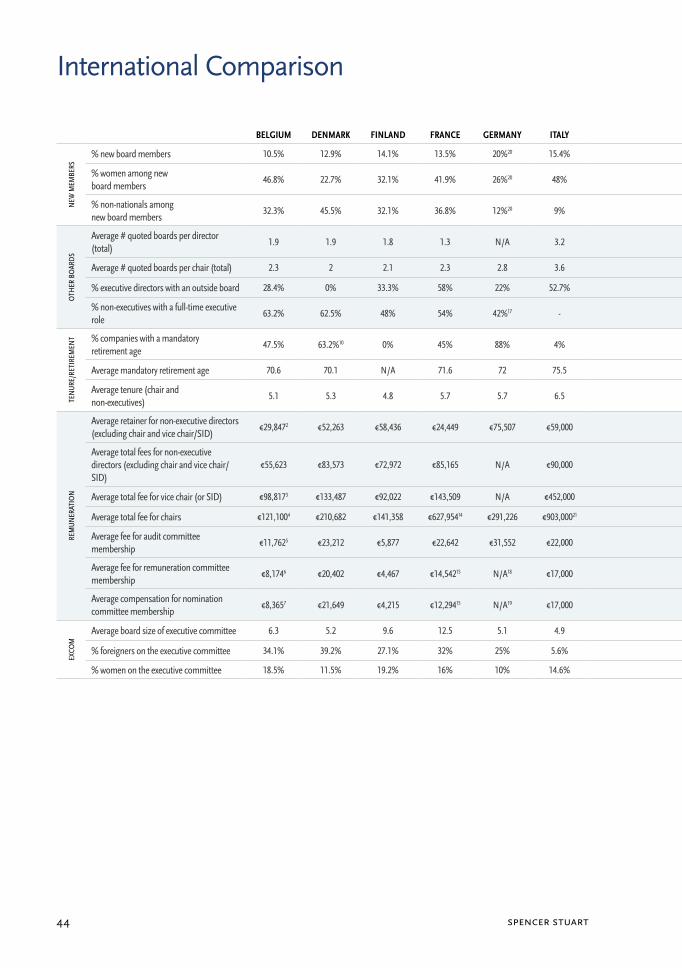
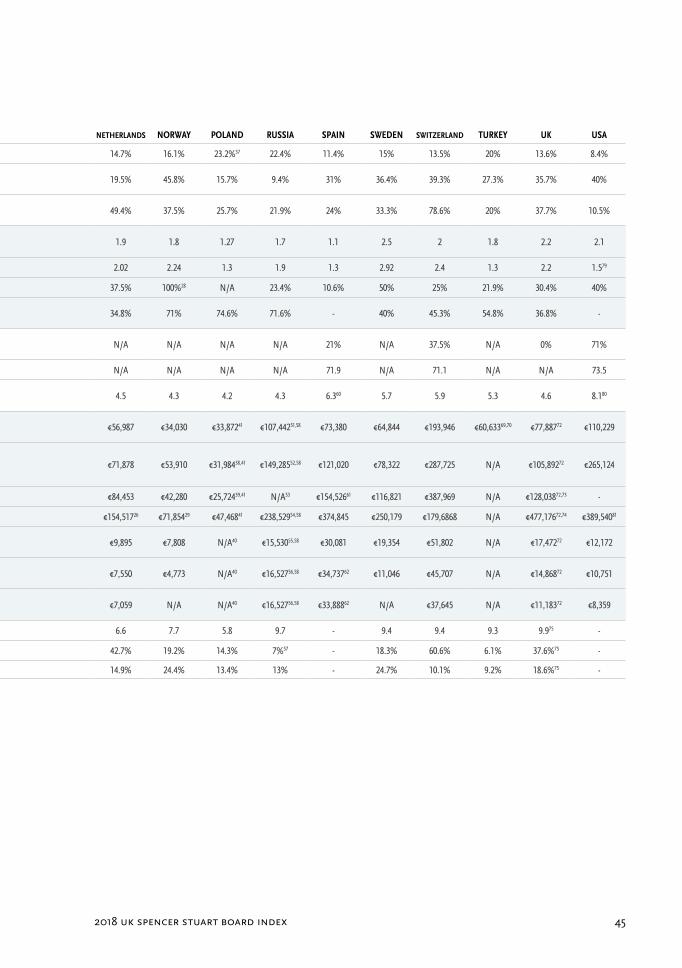
International Comparison
In the 2018 UK Spencer Stuart Board Index we provide two sets of tables. In addition to the detailed data for FTSE 150 companies (beginning on page 46), we are publishing a chart comparing aggregated data from 16 countries (pages 42–45).
All data is taken from individual country Board Indexes published by Spencer Stuart in 2018.
Visit the Spencer Stuart website and discover “Boards Around the World”, a visual tool that compares the composition, diversity, compensation and board evaluation practices of different countries.
Composition information
BELGIUM BeL20 + BelMid
DENMARK OMX Copenhagen (25 companies)
FINLAND OMX Helsinki (25 companies)
FRANCE CAC40
GERMANY DAX30
ITALY 37 (FTSE MIB) + 63 (Mid Cap, Small Cap, Other)
NETHERLANDS AEX (21 companies) + AMX (21 companies) + eight further large listed companies
NORWAY OBX (25 companies)
POLAND WIG 20
RUSSIA Russian Trading System Index
SPAIN IBEX- 35 + top companies by market cap
SWEDEN OMX Stockholm (25 companies)
SWITZERLAND SMI (20 companies)
TURKEY BIST 30
UK Top 150 FTSE companies excluding investment trusts
USA S&P 500
2018 uk spencer stuart board index 41
Belgium1 7% did not disclose2 One company did not disclose3 Based on six companies only4 Two chairs are not paid5 Nine companies do not pay audit co members6 10 companies do not pay rem co fees7 14 companies do not pay nom co fees
Denmark8 All calculations exclude employee representatives 9 One executive director in the sample10 Six companies did not disclose
Finland11 Only one CEO in sample
France12 75% of CAC 40 companies conduct an external evaluation at least every
three years; in 2017, 75% of these were conducted by Spencer Stuart13 According to Afep/Medef corporate governance code14 Non-executive chairs only15 47.5% of rem and nom cos are merged, with an average fee of €17,254
Germany16 Average minimum proportion of members that should be independent17 Shareholder representatives only18 Remuneration committees are very rare in Germany19 Except for banks, German nominations committees only deal with
non-executive director nominations and committee membership is rarely compensated
20 Supervisory Board only
Italy21 Includes some CEOs who are also chairs
Netherlands 22 Includes executive board members23 Non-executives only24 Includes executive directors on two-tier boards25 Includes directors of executive boards26 Seven companies did not disclose the information
Norway 27 Seven companies did not disclose 28 Only one executive director29 Excludes one Executive Chairman
Poland 30 Six companies have employee representatives (ER) on the board. ERs are
excluded from subsequent figures31 One board does not disclose; all directors are therefore classified as non-
independent32 Excludes 141 out of 302 directors (age not disclosed)33 Excludes 16 chairs (age not disclosed)34 Excludes 15 CEOs (age not disclosed; two are co-CEOs) and two
companies with no CEO 35 Excludes 125 out of 265 directors (age not disclosed)36 Excludes two companies: one had no chair and one chair could not be
identified37 Includes one company where all directors (8) were appointed during the
year, due to formation of a new board/company. 38 Five companies do not disclose39 Figure unavailable for 24 companies: year not served in full (9); person
not remunerated (6); no vice chair (9)40 Insufficient disclosure41 Conversion at av. 2017 annual rate: PLN/EUR = 4.257
Russia42 Excluding Unipro PAO from sample43 Average in-person board meetings. Average number of meetings
including meetings held in absentia: 20.8.44 Three companies do not disclose.45 Excludes 15 directors (age not disclosed)46 Excludes 2 chairs (age not disclosed)47 Excludes one CEO (age not disclosed)48 Excludes 9 directors (age not disclosed)49 Excludes 4 directors (age not disclosed)50 Magnit appointed a female CEO after cut-off date51 Nine companies do not disclose specified amounts52 28 companies do not disclose individual figures 53 35 companies do not disclose, or figure is not available for the year54 32 companies do not disclose, or figure is unavailable for the year55 Includes 24 companies only56 Includes 22 companies only57 All 12 exco members of one Dutch company are foreign58 Conversion at av. 2017 annual rate: RUB/EUR = 65.922
Spain 59 Top 50 companies only60 Includes both executive and non-executive directors61 The average additional fee paid to the SID was €31,64562 Only 14% of companies in Spain have separated nominations &
remunerations (N&R) committee into two. Average fee for N&R co members is €23.632
Turkey63 Excludes Koza Altin and Koza Anadolu Metal64 Three companies held over 40 meetings per year, one held 92. Seven
companies do not disclose65 Excludes 17 directors (age is not disclosed)66 Excludes one chair (age is not disclosed)67 Excludes one CEO (age is not disclosed)68 Turkish dual nationals not counted as foreign69 Four companies do not disclose, or not available 70 Conversion at av. 2017 annual rate: TRY/EUR = 4.120
UK 71 Four companies did not have a SID either due to a recent retirement
and an ongoing search for a replacement or the application of a foreign corporate governance code.
72 The exchange rate used is 1 EUR = 1.141317 GBP73 SIDs only; those who served the full year74 Includes 140 part-time chairs. Eight chairs are full-time and paid on a
different basis. Two chairs receive no fee. 75 FTSE 100 only
USA 76 Percentage of S&P 500 boards that disclose 77 All CEOs sit on the company board78 Top 200 only of S&P 500 companies79 CEOs only80 Average tenure of independent directors only81 Non-executive chairs only
international Comparison Footnotes GeneralN/A = Not applicable. A blank cell denotes that either the information is not available or we did not include it our research.
International Comparison
spencer stuart42
BELGIUM DENMARK FINLAND FRANCE GERMANY ITALY NETHERLANDS NORWAY POLAND RUSSIA SPAIN SWEDEN SWITZERLAND TURKEY UK USA
GEN
ERAL
INFO
RMAT
ION
Size of sample 59 25 25 40 70 100 50 25 40 4142 100 25 20 2863 150 485
Supervisory board/unitary board of directors
1/58 25/0 0/25 7/33 70/0 1/99 44/6 25/0 40/0 6/35 0/100 0/25 0/20 0/28 1/149 0/485
Average number of board meetings per year
8.4 8.2 10.8 9.1 6.8 11.2 7.4 8.5 8.7 6.543 11.1 10.3 8.3 19.764 7.3 8
% companies that conducted an external board evaluation
5.1%1 8.3% 17.4% 30%12 17% 38% 30% 22.2%27 N/A 17%44 34% 16.7% 12.5% N/A 44% 9%76
Combined chair and CEO 1.7% 0% 0% 52.5% 0% 17% 0% 0% 0% 0% 54% 4% 0% 10.7% .7% 49.9%
% boards with senior independent director (SID)
1.7% 0% 0% 52.5% 0% 34% 6% 0% 0% 17.1% 68% 4% 25% 0% 97.3%71 80%
% of boards with vice/deputy chairs 20.3% 100% 92% 35% 100% 49% 74% 56% 80% 34.1% 67% 48% 90% 96% 14.7% -
BOAR
D
Average board size (total) 10 9.88 8.1 13.7 13.8 11.5 9.322 8.1 8 10.5 10.9 10.6 10.4 9.8 10.1 10.8
Average board size (excl. employee representatives)
10 6.8 7.9 12 7.5 N/A 9.322 5.96 7.5530 N/A N/A 8.8 N/A N/A 10.1 N/A
Average number of independent board members
4.5 5.2 6.4 7 N/A 5.9 5.7 4.5 3.431 4 4.8 6.1 8.7 3.3 6.2 9.2
% independent board members 49.2% 77.1% 80.8% 58% 60%16 51% 87.1%23 75.8% 45%31 38% 45% 69.1% 83.2% 33.1% 61.3% 85%
Average number of non-executive directors 7.7 5.8 6.8 11 6.517 8.8 6.5 5 6.6 7.9 8.6 7.2 9.1 7.9 6.6 9.2
Average number of executive directors 1.4 0.04 0.1 1 N/A 2.3 2.824 0.04 N/A 1.6 1.8 0.6 0.4 1.1 2.5 1
AGE
Average age: all directors 57.7 58.9 58.5 58.9 58 58 60.7 57.3 55.632 54.345 60.3 58.9 60 58.765 59 -
Average age chairs 61.8 62 61.3 61.4 66 65 66.9 62.3 53.833 59.346 63.8 63.6 63.5 58.366 65.4 -
Average age CEOs who sit on the board 53.8 N/A 58.411 59 N/A 57 59 N/A N/A 52.4 54.759 54.9 55.6 55.2 55 57.6
Average age all CEOs, including those not on the board
54 55 56.7 57.9 55 N/A 56 55.5 50.435 51.947 - 54.1 54.5 54.667 55.3 57.677
Average age: non-executive directors 57.7 58.5 58.2 59 6017 61 60.7 56.3 55.935 54.148 - 58.7 59.9 59.4 60 63
Average age: executive directors 54.5 47.69 51.5 57.8 53.2 60 54.225 6628 N/A 52.249 - 53.9 55.3 54.4 54.2 -
FORE
IGN
% foreign board members (all) 30.4% 39.4% 33.8% 35% 25.3% 10.1% 39% 28.2% 26.8% 26.3% 19.8% 33.6% 58.2% 17.1%68 33.3% 8.2%78
% foreign chairs 15.3% 28% 16% 17.5% 13% 5.7% 18% 16% 18.4%36 29.3% 7% 12% 30% 10.7% 21.3% -
% foreign non-executive directors 32.7% 39.6% 36.8% 37% 26%17 8.1% 42.6% 30.6% 28% 29.9% 21.6% 38.3% 60.8% 19% 39% -
% foreign executive directors 27.2% 0% 0% 2% N/A 5.6% 30.4%25 0% N/A 4.7% 7.7% 12.5% 75% 6.3% 25.1% -
Average # nationalities represented on the board
3.1 3.4 2.92 4.3 2.517 2.2 3.1 2.28 1.95 3.2 - 3.6 6.15 2 3.7 -
GEN
DER
% female board directors (all) 32.1% 27.6% 33.3% 42.5%13 32%20 32.3% 21.3% 45.6% 15.2% 7.9% 19.5% 39.1% 24% 17.1% 27.5% 24%
% female chairs 5.1% 0% 0% 42% 4% 9% 4% 16% 15.8% 0% 7% 12% 5% 10.7% 3.9% 4.1%
% female CEOs 7.9% 0% 4.2% 2.5% 0% 6% 6% 4.2% 5.6% 0%50 2% 8% 0% 0% 5.3% 5.4%
% female non-executive directors 38.6% 27.8% 38.6% 45.3% 32%17 39% 27.3% 51.6% 15.2% 9.6% 21.3% 45% 27.1% 19.9% 38.6% -
% female executive directors 14.5% 0% 0% 0.3% 10.4% 9% 7.2%25 0% N/A 4.7% 7.2% 12.5% 0% 6.3% 8.4% -
% boards with at least one female director 100% 88% 100% 100% 99% 99% 86% 100% 67.5% 51.2% 92% 100% 95% 82.1% 100% 99.4%
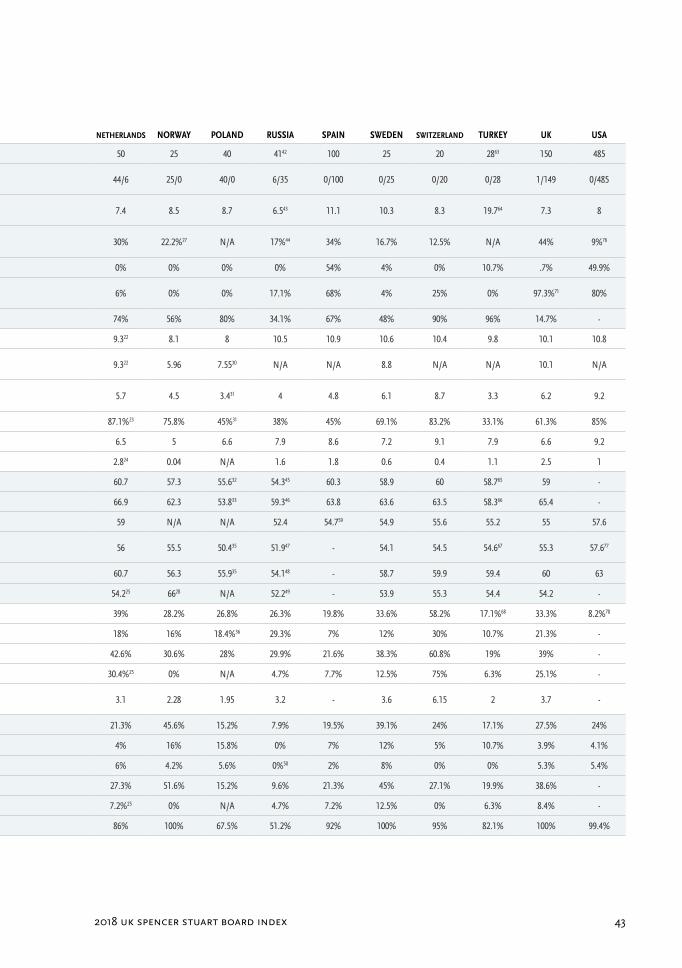
2018 uk spencer stuart board index 43
BELGIUM DENMARK FINLAND FRANCE GERMANY ITALY NETHERLANDS NORWAY POLAND RUSSIA SPAIN SWEDEN SWITZERLAND TURKEY UK USA
GEN
ERAL
INFO
RMAT
ION
Size of sample 59 25 25 40 70 100 50 25 40 4142 100 25 20 2863 150 485
Supervisory board/unitary board of directors
1/58 25/0 0/25 7/33 70/0 1/99 44/6 25/0 40/0 6/35 0/100 0/25 0/20 0/28 1/149 0/485
Average number of board meetings per year
8.4 8.2 10.8 9.1 6.8 11.2 7.4 8.5 8.7 6.543 11.1 10.3 8.3 19.764 7.3 8
% companies that conducted an external board evaluation
5.1%1 8.3% 17.4% 30%12 17% 38% 30% 22.2%27 N/A 17%44 34% 16.7% 12.5% N/A 44% 9%76
Combined chair and CEO 1.7% 0% 0% 52.5% 0% 17% 0% 0% 0% 0% 54% 4% 0% 10.7% .7% 49.9%
% boards with senior independent director (SID)
1.7% 0% 0% 52.5% 0% 34% 6% 0% 0% 17.1% 68% 4% 25% 0% 97.3%71 80%
% of boards with vice/deputy chairs 20.3% 100% 92% 35% 100% 49% 74% 56% 80% 34.1% 67% 48% 90% 96% 14.7% -
BOAR
D
Average board size (total) 10 9.88 8.1 13.7 13.8 11.5 9.322 8.1 8 10.5 10.9 10.6 10.4 9.8 10.1 10.8
Average board size (excl. employee representatives)
10 6.8 7.9 12 7.5 N/A 9.322 5.96 7.5530 N/A N/A 8.8 N/A N/A 10.1 N/A
Average number of independent board members
4.5 5.2 6.4 7 N/A 5.9 5.7 4.5 3.431 4 4.8 6.1 8.7 3.3 6.2 9.2
% independent board members 49.2% 77.1% 80.8% 58% 60%16 51% 87.1%23 75.8% 45%31 38% 45% 69.1% 83.2% 33.1% 61.3% 85%
Average number of non-executive directors 7.7 5.8 6.8 11 6.517 8.8 6.5 5 6.6 7.9 8.6 7.2 9.1 7.9 6.6 9.2
Average number of executive directors 1.4 0.04 0.1 1 N/A 2.3 2.824 0.04 N/A 1.6 1.8 0.6 0.4 1.1 2.5 1
AGE
Average age: all directors 57.7 58.9 58.5 58.9 58 58 60.7 57.3 55.632 54.345 60.3 58.9 60 58.765 59 -
Average age chairs 61.8 62 61.3 61.4 66 65 66.9 62.3 53.833 59.346 63.8 63.6 63.5 58.366 65.4 -
Average age CEOs who sit on the board 53.8 N/A 58.411 59 N/A 57 59 N/A N/A 52.4 54.759 54.9 55.6 55.2 55 57.6
Average age all CEOs, including those not on the board
54 55 56.7 57.9 55 N/A 56 55.5 50.435 51.947 - 54.1 54.5 54.667 55.3 57.677
Average age: non-executive directors 57.7 58.5 58.2 59 6017 61 60.7 56.3 55.935 54.148 - 58.7 59.9 59.4 60 63
Average age: executive directors 54.5 47.69 51.5 57.8 53.2 60 54.225 6628 N/A 52.249 - 53.9 55.3 54.4 54.2 -
FORE
IGN
% foreign board members (all) 30.4% 39.4% 33.8% 35% 25.3% 10.1% 39% 28.2% 26.8% 26.3% 19.8% 33.6% 58.2% 17.1%68 33.3% 8.2%78
% foreign chairs 15.3% 28% 16% 17.5% 13% 5.7% 18% 16% 18.4%36 29.3% 7% 12% 30% 10.7% 21.3% -
% foreign non-executive directors 32.7% 39.6% 36.8% 37% 26%17 8.1% 42.6% 30.6% 28% 29.9% 21.6% 38.3% 60.8% 19% 39% -
% foreign executive directors 27.2% 0% 0% 2% N/A 5.6% 30.4%25 0% N/A 4.7% 7.7% 12.5% 75% 6.3% 25.1% -
Average # nationalities represented on the board
3.1 3.4 2.92 4.3 2.517 2.2 3.1 2.28 1.95 3.2 - 3.6 6.15 2 3.7 -
GEN
DER
% female board directors (all) 32.1% 27.6% 33.3% 42.5%13 32%20 32.3% 21.3% 45.6% 15.2% 7.9% 19.5% 39.1% 24% 17.1% 27.5% 24%
% female chairs 5.1% 0% 0% 42% 4% 9% 4% 16% 15.8% 0% 7% 12% 5% 10.7% 3.9% 4.1%
% female CEOs 7.9% 0% 4.2% 2.5% 0% 6% 6% 4.2% 5.6% 0%50 2% 8% 0% 0% 5.3% 5.4%
% female non-executive directors 38.6% 27.8% 38.6% 45.3% 32%17 39% 27.3% 51.6% 15.2% 9.6% 21.3% 45% 27.1% 19.9% 38.6% -
% female executive directors 14.5% 0% 0% 0.3% 10.4% 9% 7.2%25 0% N/A 4.7% 7.2% 12.5% 0% 6.3% 8.4% -
% boards with at least one female director 100% 88% 100% 100% 99% 99% 86% 100% 67.5% 51.2% 92% 100% 95% 82.1% 100% 99.4%
International Comparison
spencer stuart44
BELGIUM DENMARK FINLAND FRANCE GERMANY ITALY NETHERLANDS NORWAY POLAND RUSSIA SPAIN SWEDEN SWITZERLAND TURKEY UK USA
NEW
MEM
BERS
% new board members 10.5% 12.9% 14.1% 13.5% 20%20 15.4% 14.7% 16.1% 23.2%37 22.4% 11.4% 15% 13.5% 20% 13.6% 8.4%
% women among new board members
46.8% 22.7% 32.1% 41.9% 26%20 48% 19.5% 45.8% 15.7% 9.4% 31% 36.4% 39.3% 27.3% 35.7% 40%
% non-nationals among new board members
32.3% 45.5% 32.1% 36.8% 12%20 9% 49.4% 37.5% 25.7% 21.9% 24% 33.3% 78.6% 20% 37.7% 10.5%
OTH
ER B
OAR
DS
Average # quoted boards per director (total)
1.9 1.9 1.8 1.3 N/A 3.2 1.9 1.8 1.27 1.7 1.1 2.5 2 1.8 2.2 2.1
Average # quoted boards per chair (total) 2.3 2 2.1 2.3 2.8 3.6 2.02 2.24 1.3 1.9 1.3 2.92 2.4 1.3 2.2 1.579
% executive directors with an outside board 28.4% 0% 33.3% 58% 22% 52.7% 37.5% 100%28 N/A 23.4% 10.6% 50% 25% 21.9% 30.4% 40%
% non-executives with a full-time executive role
63.2% 62.5% 48% 54% 42%17 - 34.8% 71% 74.6% 71.6% - 40% 45.3% 54.8% 36.8% -
TEN
URE/
RETI
REM
ENT % companies with a mandatory
retirement age47.5% 63.2%10 0% 45% 88% 4% N/A N/A N/A N/A 21% N/A 37.5% N/A 0% 71%
Average mandatory retirement age 70.6 70.1 N/A 71.6 72 75.5 N/A N/A N/A N/A 71.9 N/A 71.1 N/A N/A 73.5
Average tenure (chair and non-executives)
5.1 5.3 4.8 5.7 5.7 6.5 4.5 4.3 4.2 4.3 6.360 5.7 5.9 5.3 4.6 8.180
REM
UNER
ATIO
N
Average retainer for non-executive directors (excluding chair and vice chair/SID)
€29,8472 €52,263 €58,436 €24,449 €75,507 €59,000 €56,987 €34,030 €33,87241 €107,44251,58 €73,380 €64,844 €193,946 €60,63369,70 €77,88772 €110,229
Average total fees for non-executive directors (excluding chair and vice chair/SID)
€55,623 €83,573 €72,972 €85,165 N/A €90,000 €71,878 €53,910 €31,98438,41 €149,28552,58 €121,020 €78,322 €287,725 N/A €105,89272 €265,124
Average total fee for vice chair (or SID) €98,8173 €133,487 €92,022 €143,509 N/A €452,000 €84,453 €42,280 €25,72439,41 N/A53 €154,52661 €116,821 €387,969 N/A €128,03872,73 -
Average total fee for chairs €121,1004 €210,682 €141,358 €627,95414 €291,226 €903,00021 €154,51726 €71,85429 €47,46841 €238,52954,58 €374,845 €250,179 €179,6868 N/A €477,17672,74 €389,54081
Average fee for audit committee membership
€11,7625 €23,212 €5,877 €22,642 €31,552 €22,000 €9,895 €7,808 N/A40 €15,53055,58 €30,081 €19,354 €51,802 N/A €17,47272 €12,172
Average fee for remuneration committee membership
€8,1746 €20,402 €4,467 €14,54215 N/A18 €17,000 €7,550 €4,773 N/A40 €16,52756,58 €34,73762 €11,046 €45,707 N/A €14,86872 €10,751
Average compensation for nomination committee membership
€8,3657 €21,649 €4,215 €12,29415 N/A19 €17,000 €7,059 N/A N/A40 €16,52756,58 €33,88862 N/A €37,645 N/A €11,18372 €8,359
EXCO
M
Average board size of executive committee 6.3 5.2 9.6 12.5 5.1 4.9 6.6 7.7 5.8 9.7 - 9.4 9.4 9.3 9.975 -
% foreigners on the executive committee 34.1% 39.2% 27.1% 32% 25% 5.6% 42.7% 19.2% 14.3% 7%57 - 18.3% 60.6% 6.1% 37.6%75 -
% women on the executive committee 18.5% 11.5% 19.2% 16% 10% 14.6% 14.9% 24.4% 13.4% 13% - 24.7% 10.1% 9.2% 18.6%75 -
2018 uk spencer stuart board index 45
BELGIUM DENMARK FINLAND FRANCE GERMANY ITALY NETHERLANDS NORWAY POLAND RUSSIA SPAIN SWEDEN SWITZERLAND TURKEY UK USA
NEW
MEM
BERS
% new board members 10.5% 12.9% 14.1% 13.5% 20%20 15.4% 14.7% 16.1% 23.2%37 22.4% 11.4% 15% 13.5% 20% 13.6% 8.4%
% women among new board members
46.8% 22.7% 32.1% 41.9% 26%20 48% 19.5% 45.8% 15.7% 9.4% 31% 36.4% 39.3% 27.3% 35.7% 40%
% non-nationals among new board members
32.3% 45.5% 32.1% 36.8% 12%20 9% 49.4% 37.5% 25.7% 21.9% 24% 33.3% 78.6% 20% 37.7% 10.5%
OTH
ER B
OAR
DS
Average # quoted boards per director (total)
1.9 1.9 1.8 1.3 N/A 3.2 1.9 1.8 1.27 1.7 1.1 2.5 2 1.8 2.2 2.1
Average # quoted boards per chair (total) 2.3 2 2.1 2.3 2.8 3.6 2.02 2.24 1.3 1.9 1.3 2.92 2.4 1.3 2.2 1.579
% executive directors with an outside board 28.4% 0% 33.3% 58% 22% 52.7% 37.5% 100%28 N/A 23.4% 10.6% 50% 25% 21.9% 30.4% 40%
% non-executives with a full-time executive role
63.2% 62.5% 48% 54% 42%17 - 34.8% 71% 74.6% 71.6% - 40% 45.3% 54.8% 36.8% -
TEN
URE/
RETI
REM
ENT % companies with a mandatory
retirement age47.5% 63.2%10 0% 45% 88% 4% N/A N/A N/A N/A 21% N/A 37.5% N/A 0% 71%
Average mandatory retirement age 70.6 70.1 N/A 71.6 72 75.5 N/A N/A N/A N/A 71.9 N/A 71.1 N/A N/A 73.5
Average tenure (chair and non-executives)
5.1 5.3 4.8 5.7 5.7 6.5 4.5 4.3 4.2 4.3 6.360 5.7 5.9 5.3 4.6 8.180
REM
UNER
ATIO
N
Average retainer for non-executive directors (excluding chair and vice chair/SID)
€29,8472 €52,263 €58,436 €24,449 €75,507 €59,000 €56,987 €34,030 €33,87241 €107,44251,58 €73,380 €64,844 €193,946 €60,63369,70 €77,88772 €110,229
Average total fees for non-executive directors (excluding chair and vice chair/SID)
€55,623 €83,573 €72,972 €85,165 N/A €90,000 €71,878 €53,910 €31,98438,41 €149,28552,58 €121,020 €78,322 €287,725 N/A €105,89272 €265,124
Average total fee for vice chair (or SID) €98,8173 €133,487 €92,022 €143,509 N/A €452,000 €84,453 €42,280 €25,72439,41 N/A53 €154,52661 €116,821 €387,969 N/A €128,03872,73 -
Average total fee for chairs €121,1004 €210,682 €141,358 €627,95414 €291,226 €903,00021 €154,51726 €71,85429 €47,46841 €238,52954,58 €374,845 €250,179 €179,6868 N/A €477,17672,74 €389,54081
Average fee for audit committee membership
€11,7625 €23,212 €5,877 €22,642 €31,552 €22,000 €9,895 €7,808 N/A40 €15,53055,58 €30,081 €19,354 €51,802 N/A €17,47272 €12,172
Average fee for remuneration committee membership
€8,1746 €20,402 €4,467 €14,54215 N/A18 €17,000 €7,550 €4,773 N/A40 €16,52756,58 €34,73762 €11,046 €45,707 N/A €14,86872 €10,751
Average compensation for nomination committee membership
€8,3657 €21,649 €4,215 €12,29415 N/A19 €17,000 €7,059 N/A N/A40 €16,52756,58 €33,88862 N/A €37,645 N/A €11,18372 €8,359
EXCO
M
Average board size of executive committee 6.3 5.2 9.6 12.5 5.1 4.9 6.6 7.7 5.8 9.7 - 9.4 9.4 9.3 9.975 -
% foreigners on the executive committee 34.1% 39.2% 27.1% 32% 25% 5.6% 42.7% 19.2% 14.3% 7%57 - 18.3% 60.6% 6.1% 37.6%75 -
% women on the executive committee 18.5% 11.5% 19.2% 16% 10% 14.6% 14.9% 24.4% 13.4% 13% - 24.7% 10.1% 9.2% 18.6%75 -
spencer stuart46
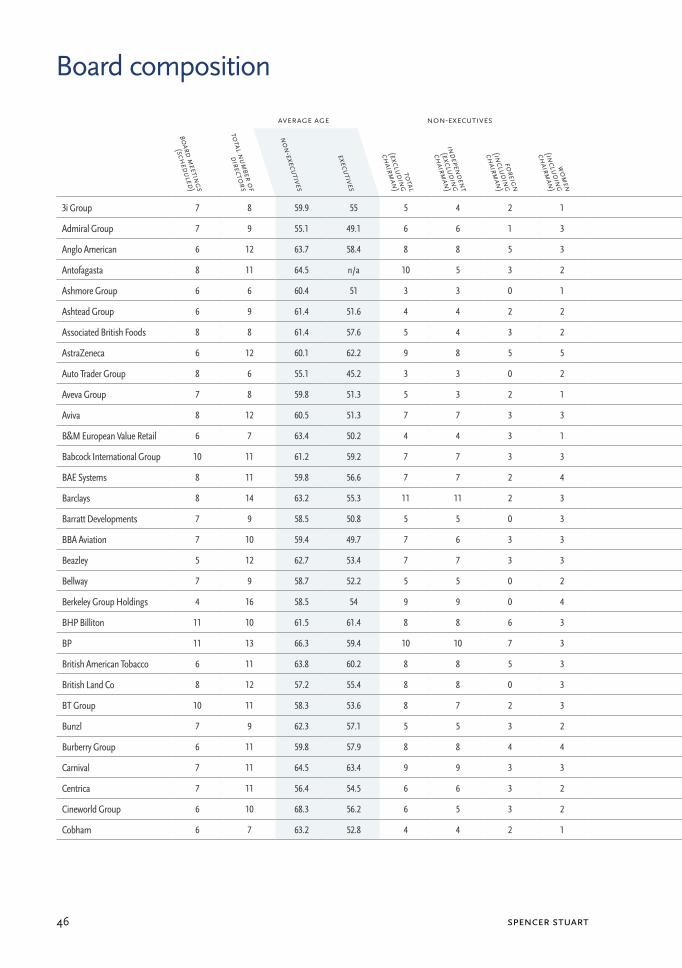
average age non-executivesexecutives
(excluding chairman) new directors tenure
Board meetings
(scheduled)
total numBer of
directors
non-executives
executives
total
(excluding
chairm
an)
independent
(excluding
chairm
an)
foreign
(including
chairm
an)
wom
en
(including
chairm
an)
total
foreign
wom
en
total
foreign
wom
en
non-executives
chairm
an
ceo
cfo
Board composition
3i Group 7 8 59.9 55 5 4 2 1 2 0 1 0 0 0 3.9 2.8 6 9.4
Admiral Group 7 9 55.1 49.1 6 6 1 3 2 0 0 1 0 0 3.2 1 2 3.7
Anglo American 6 12 63.7 58.4 8 8 5 3 3 3 0 2 1 0 4.9 0.5 5.1 1
Antofagasta 8 11 64.5 n/a 10 5 3 2 0 0 0 0 0 0 10.1 13.5 n/a n/a
Ashmore Group 6 6 60.4 51 3 3 0 1 2 0 0 0 0 0 3.7 2.5 11.5 4.4
Ashtead Group 6 9 61.4 51.6 4 4 2 2 4 1 0 1 0 0 3.9 11.2 11.3 0.1
Associated British Foods 8 8 61.4 57.6 5 4 3 2 2 0 0 1 0 0 5.4 0.1 13.1 19
AstraZeneca 6 12 60.1 62.2 9 8 5 5 2 2 0 3 2 3 5.7 5.9 5.6 4.5
Auto Trader Group 8 6 55.1 45.2 3 3 0 2 2 0 0 0 0 0 2.7 3.1 3.1 0.6
Aveva Group 7 8 59.8 51.3 5 3 2 1 2 0 0 3 1 0 1.6 5.8 0.2 0.2
Aviva 8 12 60.5 51.3 7 7 3 3 4 2 0 1 0 0 4.3 3 5.3 4
B&M European Value Retail 6 7 63.4 50.2 4 4 3 1 2 0 0 1 0 0 3.9 0.2 3.9 3.9
Babcock International Group 10 11 61.2 59.2 7 7 3 3 3 0 0 2 1 2 3.7 9.5 1.7 3.7
BAE Systems 8 11 59.8 56.6 7 7 2 4 3 1 0 1 1 1 5 4.2 0.8 7.1
Barclays 8 14 63.2 55.3 11 11 2 3 2 1 0 2 0 0 3.6 3 2.4 4.5
Barratt Developments 7 9 58.5 50.8 5 5 0 3 3 0 1 2 0 2 4.5 3.5 0.9 0.9
BBA Aviation 7 10 59.4 49.7 7 6 3 3 2 0 0 4 0 2 3.6 4 0.1 0.9
Beazley 5 12 62.7 53.4 7 7 3 3 4 0 0 1 0 0 4.5 0.1 9.7 9
Bellway 7 9 58.7 52.2 5 5 0 2 3 0 0 3 0 1 3.8 5.2 5.2 6.2
Berkeley Group Holdings 4 16 58.5 54 9 9 0 4 6 0 0 4 0 1 4.9 8.6 8.6 3
BHP Billiton 11 10 61.5 61.4 8 8 6 3 1 0 0 2 1 0 5.4 0.7 5 n/a
BP 11 13 66.3 59.4 10 10 7 3 2 0 0 1 1 1 5 8.3 7.6 6.3
British American Tobacco 6 11 63.8 60.2 8 8 5 3 2 1 0 3 3 1 2.8 8.5 7.2 10
British Land Co 8 12 57.2 55.4 8 8 0 3 3 0 0 3 0 1 2.5 5.3 9.3 n/a
BT Group 10 11 58.3 53.6 8 7 2 3 2 0 0 1 0 0 5.3 0.5 4.6 1.8
Bunzl 7 9 62.3 57.1 5 5 3 2 3 2 0 1 1 0 3.6 8.2 2 12.3
Burberry Group 6 11 59.8 57.9 8 8 4 4 2 1 1 3 3 1 5 15.8 0.8 1.3
Carnival 7 11 64.5 63.4 9 9 3 3 1 0 0 1 0 0 9.3 4.8 4.8 n/a
Centrica 7 11 56.4 54.5 6 6 3 2 4 1 0 0 0 0 3.2 4.3 3.3 2.7
Cineworld Group 6 10 68.3 56.2 6 5 3 2 3 3 0 0 0 0 3.9 11 4.2 1.3
Cobham 6 7 63.2 52.8 4 4 2 1 2 0 0 3 2 0 2.1 1.3 1.4 1.3
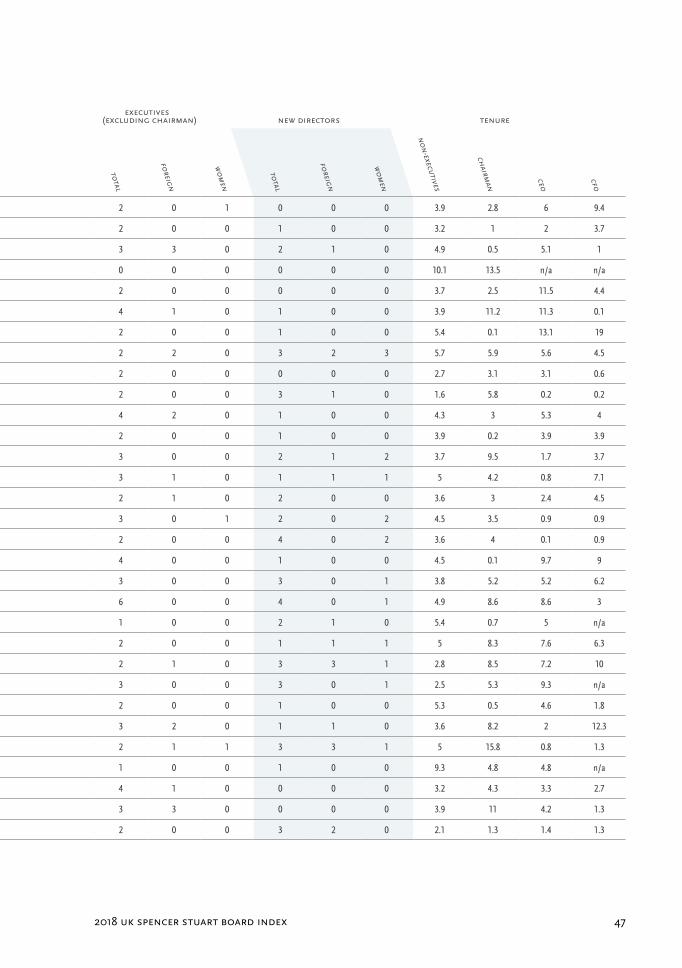
2018 uk spencer stuart board index 47
average age non-executivesexecutives
(excluding chairman) new directors tenure
Board meetings
(scheduled)
total numBer of
directors
non-executives
executives
total
(excluding
chairm
an)
independent
(excluding
chairm
an)
foreign
(including
chairm
an)
wom
en
(including
chairm
an)
total
foreign
wom
en
total
foreign
wom
en
non-executives
chairm
an
ceo
cfo
3i Group 7 8 59.9 55 5 4 2 1 2 0 1 0 0 0 3.9 2.8 6 9.4
Admiral Group 7 9 55.1 49.1 6 6 1 3 2 0 0 1 0 0 3.2 1 2 3.7
Anglo American 6 12 63.7 58.4 8 8 5 3 3 3 0 2 1 0 4.9 0.5 5.1 1
Antofagasta 8 11 64.5 n/a 10 5 3 2 0 0 0 0 0 0 10.1 13.5 n/a n/a
Ashmore Group 6 6 60.4 51 3 3 0 1 2 0 0 0 0 0 3.7 2.5 11.5 4.4
Ashtead Group 6 9 61.4 51.6 4 4 2 2 4 1 0 1 0 0 3.9 11.2 11.3 0.1
Associated British Foods 8 8 61.4 57.6 5 4 3 2 2 0 0 1 0 0 5.4 0.1 13.1 19
AstraZeneca 6 12 60.1 62.2 9 8 5 5 2 2 0 3 2 3 5.7 5.9 5.6 4.5
Auto Trader Group 8 6 55.1 45.2 3 3 0 2 2 0 0 0 0 0 2.7 3.1 3.1 0.6
Aveva Group 7 8 59.8 51.3 5 3 2 1 2 0 0 3 1 0 1.6 5.8 0.2 0.2
Aviva 8 12 60.5 51.3 7 7 3 3 4 2 0 1 0 0 4.3 3 5.3 4
B&M European Value Retail 6 7 63.4 50.2 4 4 3 1 2 0 0 1 0 0 3.9 0.2 3.9 3.9
Babcock International Group 10 11 61.2 59.2 7 7 3 3 3 0 0 2 1 2 3.7 9.5 1.7 3.7
BAE Systems 8 11 59.8 56.6 7 7 2 4 3 1 0 1 1 1 5 4.2 0.8 7.1
Barclays 8 14 63.2 55.3 11 11 2 3 2 1 0 2 0 0 3.6 3 2.4 4.5
Barratt Developments 7 9 58.5 50.8 5 5 0 3 3 0 1 2 0 2 4.5 3.5 0.9 0.9
BBA Aviation 7 10 59.4 49.7 7 6 3 3 2 0 0 4 0 2 3.6 4 0.1 0.9
Beazley 5 12 62.7 53.4 7 7 3 3 4 0 0 1 0 0 4.5 0.1 9.7 9
Bellway 7 9 58.7 52.2 5 5 0 2 3 0 0 3 0 1 3.8 5.2 5.2 6.2
Berkeley Group Holdings 4 16 58.5 54 9 9 0 4 6 0 0 4 0 1 4.9 8.6 8.6 3
BHP Billiton 11 10 61.5 61.4 8 8 6 3 1 0 0 2 1 0 5.4 0.7 5 n/a
BP 11 13 66.3 59.4 10 10 7 3 2 0 0 1 1 1 5 8.3 7.6 6.3
British American Tobacco 6 11 63.8 60.2 8 8 5 3 2 1 0 3 3 1 2.8 8.5 7.2 10
British Land Co 8 12 57.2 55.4 8 8 0 3 3 0 0 3 0 1 2.5 5.3 9.3 n/a
BT Group 10 11 58.3 53.6 8 7 2 3 2 0 0 1 0 0 5.3 0.5 4.6 1.8
Bunzl 7 9 62.3 57.1 5 5 3 2 3 2 0 1 1 0 3.6 8.2 2 12.3
Burberry Group 6 11 59.8 57.9 8 8 4 4 2 1 1 3 3 1 5 15.8 0.8 1.3
Carnival 7 11 64.5 63.4 9 9 3 3 1 0 0 1 0 0 9.3 4.8 4.8 n/a
Centrica 7 11 56.4 54.5 6 6 3 2 4 1 0 0 0 0 3.2 4.3 3.3 2.7
Cineworld Group 6 10 68.3 56.2 6 5 3 2 3 3 0 0 0 0 3.9 11 4.2 1.3
Cobham 6 7 63.2 52.8 4 4 2 1 2 0 0 3 2 0 2.1 1.3 1.4 1.3
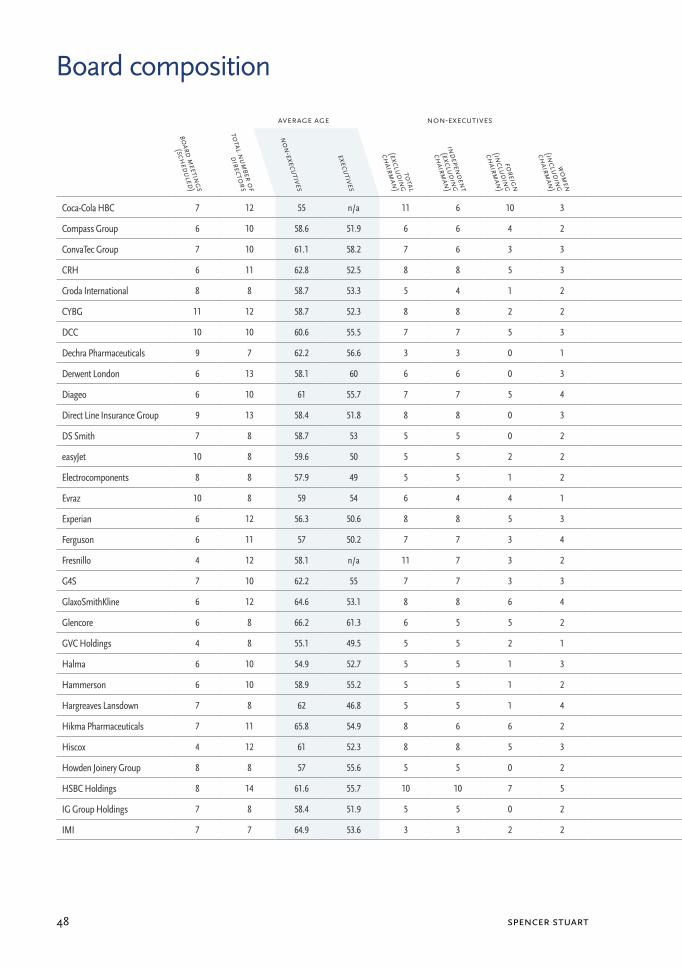
spencer stuart48
average age non-executivesexecutives
(excluding chairman) new directors tenure
Board meetings
(scheduled)
total numBer of
directors
non-executives
executives
total
(excluding
chairm
an)
independent
(excluding
chairm
an)
foreign
(including
chairm
an)
wom
en
(including
chairm
an)
total
foreign
wom
en
total
foreign
wom
en
non-executives
chairm
an
ceo
cfo
Board composition
Coca-Cola HBC 7 12 55 n/a 11 6 10 3 0 0 0 1 1 1 3 2.3 n/a n/a
Compass Group 6 10 58.6 51.9 6 6 4 2 3 0 0 0 0 0 4.6 4.2 0.3 2.4
ConvaTec Group 7 10 61.1 58.2 7 6 3 3 2 1 0 4 2 3 1.1 1.5 1.5 0.5
CRH 6 11 62.8 52.5 8 8 5 3 2 0 0 1 0 0 3.2 6 4.3 2.3
Croda International 8 8 58.7 53.3 5 4 1 2 2 0 0 1 1 0 3.8 2.6 6.3 3.3
CYBG 11 12 58.7 52.3 8 8 2 2 3 1 1 0 0 0 2 2.2 2.2 2.2
DCC 10 10 60.6 55.5 7 7 5 3 2 0 0 1 0 0 3.5 3.6 0.8 18.2
Dechra Pharmaceuticals 9 7 62.2 56.6 3 3 0 1 3 1 0 0 0 0 4 1.5 16.5 1.3
Derwent London 6 13 58.1 60 6 6 0 3 6 0 0 1 0 1 4 11.2 33.7 8.2
Diageo 6 10 61 55.7 7 7 5 4 2 1 1 1 1 1 5.5 1.3 4.8 2.5
Direct Line Insurance Group 9 13 58.4 51.8 8 8 0 3 4 0 1 3 0 1 3 6 5.5 0.2
DS Smith 7 8 58.7 53 5 5 0 2 2 0 0 0 0 0 4.8 6.3 8 4.6
easyJet 10 8 59.6 50 5 5 2 2 2 1 0 2 2 1 4.9 5 0.4 2.6
Electrocomponents 8 8 57.9 49 5 5 1 2 2 1 0 0 0 0 3.3 7.6 3.1 2.2
Evraz 10 8 59 54 6 4 4 1 1 1 0 0 0 0 5.9 6.5 6.5 n/a
Experian 6 12 56.3 50.6 8 8 5 3 3 2 0 2 1 1 4.7 3.8 3.8 3.6
Ferguson 6 11 57 50.2 7 7 3 4 3 1 0 3 2 1 4.4 7.3 1.7 0.9
Fresnillo 4 12 58.1 n/a 11 7 3 2 0 0 0 1 1 1 6.4 10 n/a n/a
G4S 7 10 62.2 55 7 7 3 3 2 1 0 1 0 0 4 5.9 5 1.5
GlaxoSmithKline 6 12 64.6 53.1 8 8 6 4 3 1 1 2 2 1 4.3 3 1.1 7.1
Glencore 6 8 66.2 61.3 6 5 5 2 1 1 0 2 1 1 4 4 6.9 n/a
GVC Holdings 4 8 55.1 49.5 5 5 2 1 2 0 0 2 0 1 2.9 7.9 7.9 0.1
Halma 6 10 54.9 52.7 5 5 1 3 4 2 1 0 0 0 3.6 4.8 13.2 20
Hammerson 6 10 58.9 55.2 5 5 1 2 4 1 0 0 0 0 5.4 5 8.6 6.8
Hargreaves Lansdown 7 8 62 46.8 5 5 1 4 2 0 0 3 1 2 3 0.2 1 1.1
Hikma Pharmaceuticals 7 11 65.8 54.9 8 6 6 2 2 3 0 1 1 0 4.3 4 0.2 n/a
Hiscox 4 12 61 52.3 8 8 5 3 3 1 0 3 2 0 2.8 5.2 11.4 1.6
Howden Joinery Group 8 8 57 55.6 5 5 0 2 2 0 0 1 0 0 4.3 2 0.1 13.1
HSBC Holdings 8 14 61.6 55.7 10 10 7 5 3 0 0 2 0 0 3.5 0.6 0.2 7.4
IG Group Holdings 7 8 58.4 51.9 5 5 0 2 2 0 0 0 0 0 4.4 3.5 2.4 1.8
IMI 7 7 64.9 53.6 3 3 2 2 3 1 0 0 0 0 4.6 3 4.3 3.2
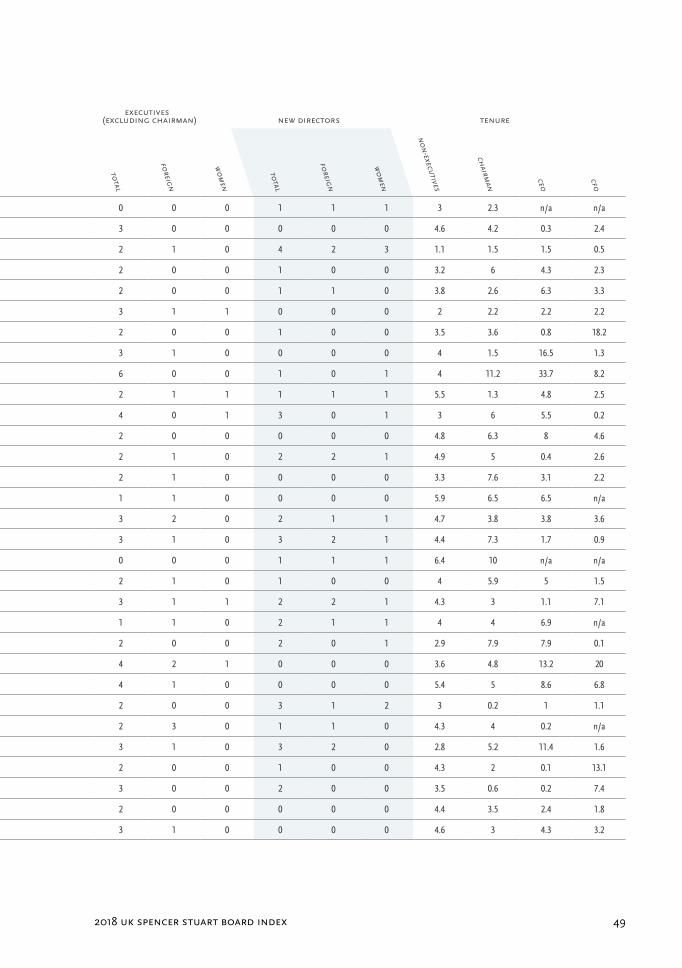
2018 uk spencer stuart board index 49
average age non-executivesexecutives
(excluding chairman) new directors tenure
Board meetings
(scheduled)
total numBer of
directors
non-executives
executives
total
(excluding
chairm
an)
independent
(excluding
chairm
an)
foreign
(including
chairm
an)
wom
en
(including
chairm
an)
total
foreign
wom
en
total
foreign
wom
en
non-executives
chairm
an
ceo
cfo
Coca-Cola HBC 7 12 55 n/a 11 6 10 3 0 0 0 1 1 1 3 2.3 n/a n/a
Compass Group 6 10 58.6 51.9 6 6 4 2 3 0 0 0 0 0 4.6 4.2 0.3 2.4
ConvaTec Group 7 10 61.1 58.2 7 6 3 3 2 1 0 4 2 3 1.1 1.5 1.5 0.5
CRH 6 11 62.8 52.5 8 8 5 3 2 0 0 1 0 0 3.2 6 4.3 2.3
Croda International 8 8 58.7 53.3 5 4 1 2 2 0 0 1 1 0 3.8 2.6 6.3 3.3
CYBG 11 12 58.7 52.3 8 8 2 2 3 1 1 0 0 0 2 2.2 2.2 2.2
DCC 10 10 60.6 55.5 7 7 5 3 2 0 0 1 0 0 3.5 3.6 0.8 18.2
Dechra Pharmaceuticals 9 7 62.2 56.6 3 3 0 1 3 1 0 0 0 0 4 1.5 16.5 1.3
Derwent London 6 13 58.1 60 6 6 0 3 6 0 0 1 0 1 4 11.2 33.7 8.2
Diageo 6 10 61 55.7 7 7 5 4 2 1 1 1 1 1 5.5 1.3 4.8 2.5
Direct Line Insurance Group 9 13 58.4 51.8 8 8 0 3 4 0 1 3 0 1 3 6 5.5 0.2
DS Smith 7 8 58.7 53 5 5 0 2 2 0 0 0 0 0 4.8 6.3 8 4.6
easyJet 10 8 59.6 50 5 5 2 2 2 1 0 2 2 1 4.9 5 0.4 2.6
Electrocomponents 8 8 57.9 49 5 5 1 2 2 1 0 0 0 0 3.3 7.6 3.1 2.2
Evraz 10 8 59 54 6 4 4 1 1 1 0 0 0 0 5.9 6.5 6.5 n/a
Experian 6 12 56.3 50.6 8 8 5 3 3 2 0 2 1 1 4.7 3.8 3.8 3.6
Ferguson 6 11 57 50.2 7 7 3 4 3 1 0 3 2 1 4.4 7.3 1.7 0.9
Fresnillo 4 12 58.1 n/a 11 7 3 2 0 0 0 1 1 1 6.4 10 n/a n/a
G4S 7 10 62.2 55 7 7 3 3 2 1 0 1 0 0 4 5.9 5 1.5
GlaxoSmithKline 6 12 64.6 53.1 8 8 6 4 3 1 1 2 2 1 4.3 3 1.1 7.1
Glencore 6 8 66.2 61.3 6 5 5 2 1 1 0 2 1 1 4 4 6.9 n/a
GVC Holdings 4 8 55.1 49.5 5 5 2 1 2 0 0 2 0 1 2.9 7.9 7.9 0.1
Halma 6 10 54.9 52.7 5 5 1 3 4 2 1 0 0 0 3.6 4.8 13.2 20
Hammerson 6 10 58.9 55.2 5 5 1 2 4 1 0 0 0 0 5.4 5 8.6 6.8
Hargreaves Lansdown 7 8 62 46.8 5 5 1 4 2 0 0 3 1 2 3 0.2 1 1.1
Hikma Pharmaceuticals 7 11 65.8 54.9 8 6 6 2 2 3 0 1 1 0 4.3 4 0.2 n/a
Hiscox 4 12 61 52.3 8 8 5 3 3 1 0 3 2 0 2.8 5.2 11.4 1.6
Howden Joinery Group 8 8 57 55.6 5 5 0 2 2 0 0 1 0 0 4.3 2 0.1 13.1
HSBC Holdings 8 14 61.6 55.7 10 10 7 5 3 0 0 2 0 0 3.5 0.6 0.2 7.4
IG Group Holdings 7 8 58.4 51.9 5 5 0 2 2 0 0 0 0 0 4.4 3.5 2.4 1.8
IMI 7 7 64.9 53.6 3 3 2 2 3 1 0 0 0 0 4.6 3 4.3 3.2
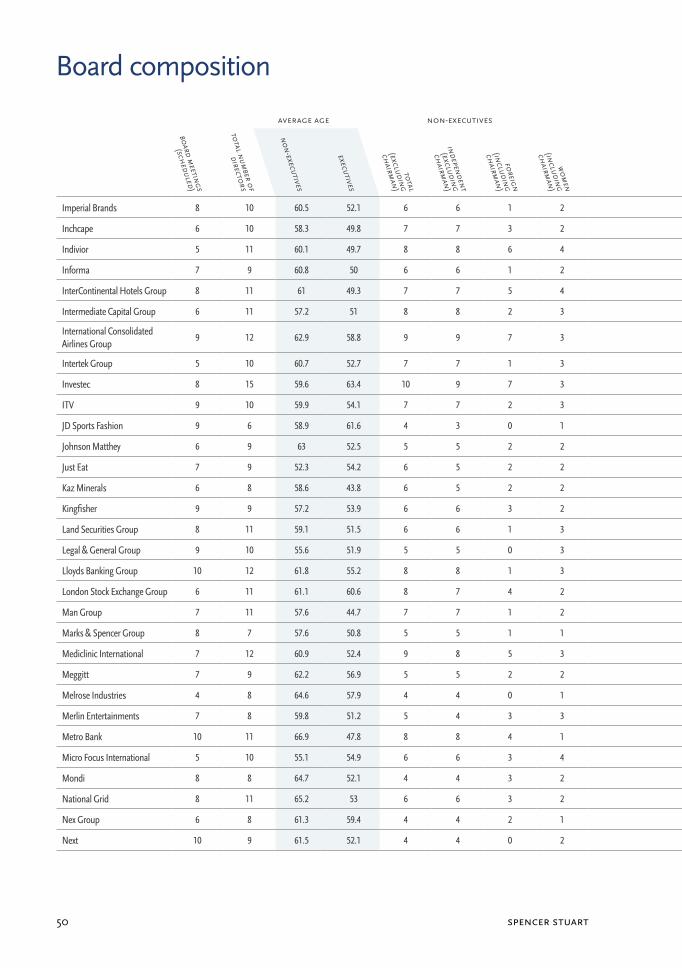
spencer stuart50
average age non-executivesexecutives
(excluding chairman) new directors tenure
Board meetings
(scheduled)
total numBer of
directors
non-executives
executives
total
(excluding
chairm
an)
independent
(excluding
chairm
an)
foreign
(including
chairm
an)
wom
en
(including
chairm
an)
total
foreign
wom
en
total
foreign
wom
en
non-executives
chairm
an
ceo
cfo
Board composition
Imperial Brands 8 10 60.5 52.1 6 6 1 2 3 0 1 1 0 0 3.7 4.2 8 4.3
Inchcape 6 10 58.3 49.8 7 7 3 2 2 1 0 0 0 0 4.3 9 3.1 2.1
Indivior 5 11 60.1 49.7 8 8 6 4 2 1 0 0 0 0 2.9 3.4 3.4 1.2
Informa 7 9 60.8 50 6 6 1 2 2 0 0 0 0 0 3.5 10.1 4.3 3.8
InterContinental Hotels Group 8 11 61 49.3 7 7 5 4 3 2 0 2 2 0 4.5 5.3 0.8 4.3
Intermediate Capital Group 6 11 57.2 51 8 8 2 3 2 1 0 3 1 1 2.6 1.8 0.8 11.4
International Consolidated Airlines Group
9 12 62.9 58.8 9 9 7 3 2 1 0 1 1 1 4.4 7.3 7.3 4.6
Intertek Group 5 10 60.7 52.7 7 7 1 3 2 1 0 3 1 0 2.7 6.3 3 3.6
Investec 8 15 59.6 63.4 10 9 7 3 4 4 0 1 0 0 6.1 3.7 15.8 15.8
ITV 9 10 59.9 54.1 7 7 2 3 2 0 1 2 0 2 4.8 2 0.3 1
JD Sports Fashion 9 6 58.9 61.6 4 3 0 1 1 0 0 0 0 0 4.7 14.1 n/a 8.2
Johnson Matthey 6 9 63 52.5 5 5 2 2 3 1 1 1 1 0 3.4 6.8 3.9 1.5
Just Eat 7 9 52.3 54.2 6 5 2 2 2 0 0 3 0 0 2.9 0 0.6 0.6
Kaz Minerals 6 8 58.6 43.8 6 5 2 2 1 0 0 1 0 1 4.7 0.3 0.3 n/a
Kingfisher 9 9 57.2 53.9 6 6 3 2 2 1 2 0 0 0 6.7 0.9 3.4 5.6
Land Securities Group 8 11 59.1 51.5 6 6 1 3 4 0 1 2 0 1 5.5 9.5 6.1 12.7
Legal & General Group 9 10 55.6 51.9 5 5 0 3 4 1 0 0 0 0 3 1.5 5.8 1.1
Lloyds Banking Group 10 12 61.8 55.2 8 8 1 3 3 2 0 1 0 0 3.8 4.1 7.2 6
London Stock Exchange Group 6 11 61.1 60.6 8 7 4 2 2 2 0 1 0 1 3.4 2.8 0.4 n/a
Man Group 7 11 57.6 44.7 7 7 1 2 3 0 0 0 0 0 4.2 2 1.7 1.3
Marks & Spencer Group 8 7 57.6 50.8 5 5 1 1 1 0 0 1 0 0 4.3 0.7 2.1 n/a
Mediclinic International 7 12 60.9 52.4 9 8 5 3 2 0 0 2 2 2 1.8 2.2 2.2 1.7
Meggitt 7 9 62.2 56.9 5 5 2 2 3 0 0 0 0 0 4.1 3 0.3 4.9
Melrose Industries 4 8 64.6 57.9 4 4 0 1 3 0 0 1 0 0 3.5 14.9 6 12.8
Merlin Entertainments 7 8 59.8 51.2 5 4 3 3 2 1 1 0 0 0 3.6 4.5 4.5 1.7
Metro Bank 10 11 66.9 47.8 8 8 4 1 2 0 0 2 1 1 2 2.1 2.1 0.1
Micro Focus International 5 10 55.1 54.9 6 6 3 4 3 1 0 5 3 2 2.7 7 0.1 0.3
Mondi 8 8 64.7 52.1 4 4 3 2 2 2 0 0 0 0 4.9 6.8 1 9.5
National Grid 8 11 65.2 53 6 6 3 2 4 1 1 0 0 0 4.7 6.3 2.1 7.5
Nex Group 6 8 61.3 59.4 4 4 2 1 3 1 1 3 2 2 1.3 2.2 2.2 0.9
Next 10 9 61.5 52.1 4 4 0 2 4 0 2 1 0 0 4.5 0.7 16.7 3.1
2018 uk spencer stuart board index 51
average age non-executivesexecutives
(excluding chairman) new directors tenure
Board meetings
(scheduled)
total numBer of
directors
non-executives
executives
total
(excluding
chairm
an)
independent
(excluding
chairm
an)
foreign
(including
chairm
an)
wom
en
(including
chairm
an)
total
foreign
wom
en
total
foreign
wom
en
non-executives
chairm
an
ceo
cfo
Imperial Brands 8 10 60.5 52.1 6 6 1 2 3 0 1 1 0 0 3.7 4.2 8 4.3
Inchcape 6 10 58.3 49.8 7 7 3 2 2 1 0 0 0 0 4.3 9 3.1 2.1
Indivior 5 11 60.1 49.7 8 8 6 4 2 1 0 0 0 0 2.9 3.4 3.4 1.2
Informa 7 9 60.8 50 6 6 1 2 2 0 0 0 0 0 3.5 10.1 4.3 3.8
InterContinental Hotels Group 8 11 61 49.3 7 7 5 4 3 2 0 2 2 0 4.5 5.3 0.8 4.3
Intermediate Capital Group 6 11 57.2 51 8 8 2 3 2 1 0 3 1 1 2.6 1.8 0.8 11.4
International Consolidated Airlines Group
9 12 62.9 58.8 9 9 7 3 2 1 0 1 1 1 4.4 7.3 7.3 4.6
Intertek Group 5 10 60.7 52.7 7 7 1 3 2 1 0 3 1 0 2.7 6.3 3 3.6
Investec 8 15 59.6 63.4 10 9 7 3 4 4 0 1 0 0 6.1 3.7 15.8 15.8
ITV 9 10 59.9 54.1 7 7 2 3 2 0 1 2 0 2 4.8 2 0.3 1
JD Sports Fashion 9 6 58.9 61.6 4 3 0 1 1 0 0 0 0 0 4.7 14.1 n/a 8.2
Johnson Matthey 6 9 63 52.5 5 5 2 2 3 1 1 1 1 0 3.4 6.8 3.9 1.5
Just Eat 7 9 52.3 54.2 6 5 2 2 2 0 0 3 0 0 2.9 0 0.6 0.6
Kaz Minerals 6 8 58.6 43.8 6 5 2 2 1 0 0 1 0 1 4.7 0.3 0.3 n/a
Kingfisher 9 9 57.2 53.9 6 6 3 2 2 1 2 0 0 0 6.7 0.9 3.4 5.6
Land Securities Group 8 11 59.1 51.5 6 6 1 3 4 0 1 2 0 1 5.5 9.5 6.1 12.7
Legal & General Group 9 10 55.6 51.9 5 5 0 3 4 1 0 0 0 0 3 1.5 5.8 1.1
Lloyds Banking Group 10 12 61.8 55.2 8 8 1 3 3 2 0 1 0 0 3.8 4.1 7.2 6
London Stock Exchange Group 6 11 61.1 60.6 8 7 4 2 2 2 0 1 0 1 3.4 2.8 0.4 n/a
Man Group 7 11 57.6 44.7 7 7 1 2 3 0 0 0 0 0 4.2 2 1.7 1.3
Marks & Spencer Group 8 7 57.6 50.8 5 5 1 1 1 0 0 1 0 0 4.3 0.7 2.1 n/a
Mediclinic International 7 12 60.9 52.4 9 8 5 3 2 0 0 2 2 2 1.8 2.2 2.2 1.7
Meggitt 7 9 62.2 56.9 5 5 2 2 3 0 0 0 0 0 4.1 3 0.3 4.9
Melrose Industries 4 8 64.6 57.9 4 4 0 1 3 0 0 1 0 0 3.5 14.9 6 12.8
Merlin Entertainments 7 8 59.8 51.2 5 4 3 3 2 1 1 0 0 0 3.6 4.5 4.5 1.7
Metro Bank 10 11 66.9 47.8 8 8 4 1 2 0 0 2 1 1 2 2.1 2.1 0.1
Micro Focus International 5 10 55.1 54.9 6 6 3 4 3 1 0 5 3 2 2.7 7 0.1 0.3
Mondi 8 8 64.7 52.1 4 4 3 2 2 2 0 0 0 0 4.9 6.8 1 9.5
National Grid 8 11 65.2 53 6 6 3 2 4 1 1 0 0 0 4.7 6.3 2.1 7.5
Nex Group 6 8 61.3 59.4 4 4 2 1 3 1 1 3 2 2 1.3 2.2 2.2 0.9
Next 10 9 61.5 52.1 4 4 0 2 4 0 2 1 0 0 4.5 0.7 16.7 3.1
spencer stuart52
average age non-executivesexecutives
(excluding chairman) new directors tenure
Board meetings
(scheduled)
total numBer of
directors
non-executives
executives
total
(excluding
chairm
an)
independent
(excluding
chairm
an)
foreign
(including
chairm
an)
wom
en
(including
chairm
an)
total
foreign
wom
en
total
foreign
wom
en
non-executives
chairm
an
ceo
cfo
Board composition
NMC Health 5 11 63.7 38.8 6 5 5 3 3 2 0 2 1 0 4.4 1.1 1.1 n/a
Ocado Group 11 11 56.7 52.1 5 5 1 2 5 0 0 1 0 0 5.1 5 7.8 5.7
Old Mutual 8 11 64.4 53.4 8 6 3 3 2 2 1 0 0 0 5.4 8.3 2.5 3.8
Paddy Power Betfair 10 9 57.3 48.4 6 6 4 2 2 0 0 2 2 1 2.2 2.8 0.3 2.2
Pearson 7 11 61.2 50 8 8 5 3 2 0 0 1 1 0 4.1 2.3 5.3 2.7
Pennon Group 9 6 64.6 57.3 3 3 0 1 2 0 1 0 0 0 6.2 2.7 2.3 2.1
Persimmon 7 7 55.5 53.2 3 3 0 2 3 0 0 0 0 0 3.1 1.2 5 19.1
Phoenix Group Holdings 7 11 61.4 60.6 8 8 0 4 2 0 0 2 0 2 2.9 2.7 7.1 5.8
Polymetal International 7 10 55 55.4 8 5 7 3 1 0 0 3 3 1 3.8 6.5 3.3 n/a
Prudential 10 16 64.6 56.5 8 8 3 1 7 3 1 3 2 0 4.4 5.8 2.9 0.8
Randgold Resources 4 8 61.7 54.3 5 5 4 3 2 2 0 0 0 0 4.1 4 20.8 10.8
Reckitt Benckiser Group 5 11 63.8 60.1 8 8 4 3 2 0 0 0 0 0 7 15 6.7 5.2
RELX 7 11 63.2 53 8 8 6 4 2 1 0 1 1 1 4.2 8.9 8.5 3.7
Renishaw 9 9 61.3 60.6 4 4 1 2 4 1 0 0 0 0 5 33.5 0.2 0.7
Rentokil Initial 10 9 59.7 54.6 6 6 1 3 2 0 0 3 0 1 3.6 10 4.6 7.7
Rightmove 7 9 56.3 45.1 6 6 1 3 2 0 1 2 0 1 3.2 10.8 1 3.8
Rio Tinto 9 9 60.4 55.6 6 6 3 2 2 1 0 0 0 0 3.1 0.2 1.8 5
RIT Capital Partners 5 9 62.6 n/a 8 7 1 2 0 0 0 3 1 0 4.3 22.3 n/a n/a
Rolls-Royce Holdings 11 12 61.7 55.2 9 8 4 4 2 0 0 1 1 1 4 5 2.8 1.1
Rotork 9 7 58.2 51.2 4 4 0 2 2 1 0 2 1 0 4.6 3 0.1 8.1
Royal Bank of Scotland Group 9 13 61.7 56.4 10 10 2 4 2 1 0 1 0 1 4.4 2.7 4.6 3.9
Royal Dutch Shell 8 11 65.1 55.2 8 8 8 3 2 2 1 2 2 1 5 2.9 4.3 1.1
Royal Mail 8 9 60.4 57.3 6 6 2 2 2 1 1 3 0 0 2.6 2.7 4.5 0.8
RPC Group 7 8 62.8 48.8 5 4 1 2 2 1 0 1 0 0 3.7 9.8 5 5
RSA Insurance Group 9 11 60.7 52.2 8 8 3 3 2 0 0 1 0 1 3.8 5.3 4.2 2.6
Sage Group 6 9 60.8 56.8 5 4 2 2 3 1 0 2 1 1 3.2 5.7 3.5 4.3
Sainsbury (J) 8 10 60.2 53.7 6 6 2 3 3 1 0 1 1 1 3.9 8.5 3.8 1.3
Schroders 5 11 60.6 53.4 8 6 1 3 2 0 0 1 0 0 10.5 2.1 2.1 5
SEGRO 7 10 59.6 51 5 5 0 1 4 0 0 1 0 1 5.1 2 7 1.3
Severn Trent 7 8 61.1 46 5 5 1 2 2 0 1 0 0 0 3.2 7.8 4.1 3.1
Shaftesbury 6 10 61.8 57.8 5 5 0 3 4 0 0 1 0 0 5.6 1.6 6.6 6.3
2018 uk spencer stuart board index 53
average age non-executivesexecutives
(excluding chairman) new directors tenure
Board meetings
(scheduled)
total numBer of
directors
non-executives
executives
total
(excluding
chairm
an)
independent
(excluding
chairm
an)
foreign
(including
chairm
an)
wom
en
(including
chairm
an)
total
foreign
wom
en
total
foreign
wom
en
non-executives
chairm
an
ceo
cfo
NMC Health 5 11 63.7 38.8 6 5 5 3 3 2 0 2 1 0 4.4 1.1 1.1 n/a
Ocado Group 11 11 56.7 52.1 5 5 1 2 5 0 0 1 0 0 5.1 5 7.8 5.7
Old Mutual 8 11 64.4 53.4 8 6 3 3 2 2 1 0 0 0 5.4 8.3 2.5 3.8
Paddy Power Betfair 10 9 57.3 48.4 6 6 4 2 2 0 0 2 2 1 2.2 2.8 0.3 2.2
Pearson 7 11 61.2 50 8 8 5 3 2 0 0 1 1 0 4.1 2.3 5.3 2.7
Pennon Group 9 6 64.6 57.3 3 3 0 1 2 0 1 0 0 0 6.2 2.7 2.3 2.1
Persimmon 7 7 55.5 53.2 3 3 0 2 3 0 0 0 0 0 3.1 1.2 5 19.1
Phoenix Group Holdings 7 11 61.4 60.6 8 8 0 4 2 0 0 2 0 2 2.9 2.7 7.1 5.8
Polymetal International 7 10 55 55.4 8 5 7 3 1 0 0 3 3 1 3.8 6.5 3.3 n/a
Prudential 10 16 64.6 56.5 8 8 3 1 7 3 1 3 2 0 4.4 5.8 2.9 0.8
Randgold Resources 4 8 61.7 54.3 5 5 4 3 2 2 0 0 0 0 4.1 4 20.8 10.8
Reckitt Benckiser Group 5 11 63.8 60.1 8 8 4 3 2 0 0 0 0 0 7 15 6.7 5.2
RELX 7 11 63.2 53 8 8 6 4 2 1 0 1 1 1 4.2 8.9 8.5 3.7
Renishaw 9 9 61.3 60.6 4 4 1 2 4 1 0 0 0 0 5 33.5 0.2 0.7
Rentokil Initial 10 9 59.7 54.6 6 6 1 3 2 0 0 3 0 1 3.6 10 4.6 7.7
Rightmove 7 9 56.3 45.1 6 6 1 3 2 0 1 2 0 1 3.2 10.8 1 3.8
Rio Tinto 9 9 60.4 55.6 6 6 3 2 2 1 0 0 0 0 3.1 0.2 1.8 5
RIT Capital Partners 5 9 62.6 n/a 8 7 1 2 0 0 0 3 1 0 4.3 22.3 n/a n/a
Rolls-Royce Holdings 11 12 61.7 55.2 9 8 4 4 2 0 0 1 1 1 4 5 2.8 1.1
Rotork 9 7 58.2 51.2 4 4 0 2 2 1 0 2 1 0 4.6 3 0.1 8.1
Royal Bank of Scotland Group 9 13 61.7 56.4 10 10 2 4 2 1 0 1 0 1 4.4 2.7 4.6 3.9
Royal Dutch Shell 8 11 65.1 55.2 8 8 8 3 2 2 1 2 2 1 5 2.9 4.3 1.1
Royal Mail 8 9 60.4 57.3 6 6 2 2 2 1 1 3 0 0 2.6 2.7 4.5 0.8
RPC Group 7 8 62.8 48.8 5 4 1 2 2 1 0 1 0 0 3.7 9.8 5 5
RSA Insurance Group 9 11 60.7 52.2 8 8 3 3 2 0 0 1 0 1 3.8 5.3 4.2 2.6
Sage Group 6 9 60.8 56.8 5 4 2 2 3 1 0 2 1 1 3.2 5.7 3.5 4.3
Sainsbury (J) 8 10 60.2 53.7 6 6 2 3 3 1 0 1 1 1 3.9 8.5 3.8 1.3
Schroders 5 11 60.6 53.4 8 6 1 3 2 0 0 1 0 0 10.5 2.1 2.1 5
SEGRO 7 10 59.6 51 5 5 0 1 4 0 0 1 0 1 5.1 2 7 1.3
Severn Trent 7 8 61.1 46 5 5 1 2 2 0 1 0 0 0 3.2 7.8 4.1 3.1
Shaftesbury 6 10 61.8 57.8 5 5 0 3 4 0 0 1 0 0 5.6 1.6 6.6 6.3
spencer stuart54
average age non-executivesexecutives
(excluding chairman) new directors tenure
Board meetings
(scheduled)
total numBer of
directors
non-executives
executives
total
(excluding
chairm
an)
independent
(excluding
chairm
an)
foreign
(including
chairm
an)
wom
en
(including
chairm
an)
total
foreign
wom
en
total
foreign
wom
en
non-executives
chairm
an
ceo
cfo
Board composition
Shire 5 10 63.9 57.3 7 7 8 3 2 2 0 1 1 0 3.4 4 5 0.1
Sky 6 11 55.9 51.5 8 6 7 3 2 0 0 0 0 0 4.7 2 10.4 2.1
Smith & Nephew 9 12 62.7 54.5 9 9 5 3 2 1 0 3 1 1 3.3 4.1 7 1.2
Smiths Group 7 10 66.1 52.9 7 7 5 2 2 0 0 1 0 0 5.9 4.4 2.6 0.3
Smurfit Kappa Group 5 13 64.7 50.8 10 9 8 3 2 0 0 1 1 1 5.2 9.4 2.7 1.4
Spectris 9 9 58.5 57.2 6 6 5 2 2 1 0 2 1 0 3.7 0.9 12.3 11.6
Spirax-Sarco Engineering 7 10 60.5 57.2 5 5 1 2 4 1 0 1 0 0 4.1 8.8 4.3 2
SSE 7 10 60 50.1 6 6 0 3 3 0 0 1 0 0 4.5 2.8 4.8 15.6
SSP Group 7 7 61.3 54.7 4 4 3 0 2 0 1 0 0 0 3.6 3.8 3.8 3.8
St James's Place 6 9 62 56.7 4 4 0 2 4 0 0 1 0 0 5.3 4.3 0.3 0.3
Standard Chartered 8 13 63.3 57.9 10 10 5 4 2 1 0 1 1 1 4.1 1.4 2.9 3.8
Standard Life Aberdeen 9 16 58.8 60.6 11 10 3 4 4 0 0 8 3 2 2.8 10.9 0.7 0.7
Taylor Wimpey 8 10 57.3 49 5 5 0 3 4 0 1 3 0 2 3.6 7.8 10.8 0
Tesco 6 13 60.6 54.6 9 9 1 3 3 0 0 2 0 0 2.8 3.2 3.7 3.6
Travis Perkins 9 9 55.9 50.6 5 5 1 2 3 0 0 1 0 0 4.3 0.7 4.3 1.3
TUI 8 101 57.8 n/a 9 6 6 5 0 0 0 1 0 0 2.8 7.2 n/a n/a
Tullow Oil 7 9 60 56 5 5 0 1 3 0 0 2 0 1 4.5 1 1 0.9
UBM 6 9 58.1 54.9 6 6 4 2 2 0 1 1 0 0 3.5 0.2 4 2.7
Unilever 6 13 59.7 56.6 10 10 10 5 2 1 0 0 0 0 4 2 9.3 2
United Utilities Group 8 10 57.3 54.5 6 6 0 3 3 0 0 2 0 1 3.8 9.8 7.1 7.6
Vodafone Group 7 12 62 55.1 9 9 6 4 2 1 0 2 2 1 3.8 6.8 9.8 4.1
Weir Group 8 9 63.4 47.6 6 6 2 3 2 0 0 3 1 2 3.1 4.3 1.6 1.6
Whitbread 11 8 55 52 4 4 0 2 3 0 2 0 0 0 2.8 0.2 2.4 5.5
Wm Morrison Supermarkets 8 9 60.3 51.8 6 6 1 2 2 0 0 2 1 0 1.8 3.3 3.1 5.1
Wood Group (John) 6 10 59.1 49.7 7 7 3 4 2 0 0 2 1 1 3.5 4 2.3 3
WPP 6 11 59.7 64.7 9 9 9 3 1 1 0 0 0 0 5 2.9 2.9 9.4
1 Supervisory board only, exmployee representatives excluded
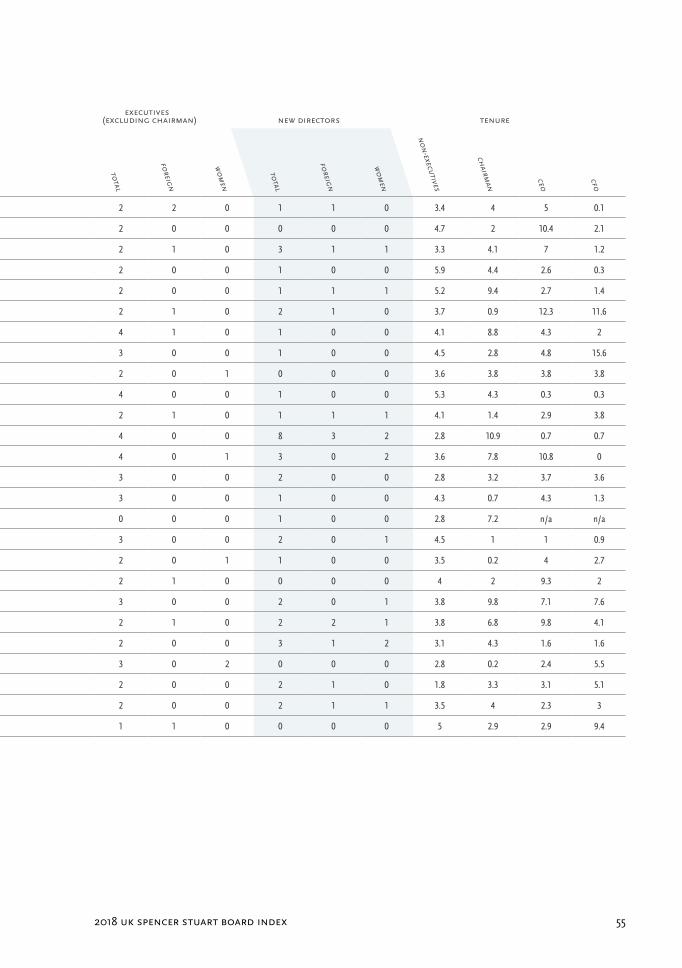
2018 uk spencer stuart board index 55
average age non-executivesexecutives
(excluding chairman) new directors tenure
Board meetings
(scheduled)
total numBer of
directors
non-executives
executives
total
(excluding
chairm
an)
independent
(excluding
chairm
an)
foreign
(including
chairm
an)
wom
en
(including
chairm
an)
total
foreign
wom
en
total
foreign
wom
en
non-executives
chairm
an
ceo
cfo
Shire 5 10 63.9 57.3 7 7 8 3 2 2 0 1 1 0 3.4 4 5 0.1
Sky 6 11 55.9 51.5 8 6 7 3 2 0 0 0 0 0 4.7 2 10.4 2.1
Smith & Nephew 9 12 62.7 54.5 9 9 5 3 2 1 0 3 1 1 3.3 4.1 7 1.2
Smiths Group 7 10 66.1 52.9 7 7 5 2 2 0 0 1 0 0 5.9 4.4 2.6 0.3
Smurfit Kappa Group 5 13 64.7 50.8 10 9 8 3 2 0 0 1 1 1 5.2 9.4 2.7 1.4
Spectris 9 9 58.5 57.2 6 6 5 2 2 1 0 2 1 0 3.7 0.9 12.3 11.6
Spirax-Sarco Engineering 7 10 60.5 57.2 5 5 1 2 4 1 0 1 0 0 4.1 8.8 4.3 2
SSE 7 10 60 50.1 6 6 0 3 3 0 0 1 0 0 4.5 2.8 4.8 15.6
SSP Group 7 7 61.3 54.7 4 4 3 0 2 0 1 0 0 0 3.6 3.8 3.8 3.8
St James's Place 6 9 62 56.7 4 4 0 2 4 0 0 1 0 0 5.3 4.3 0.3 0.3
Standard Chartered 8 13 63.3 57.9 10 10 5 4 2 1 0 1 1 1 4.1 1.4 2.9 3.8
Standard Life Aberdeen 9 16 58.8 60.6 11 10 3 4 4 0 0 8 3 2 2.8 10.9 0.7 0.7
Taylor Wimpey 8 10 57.3 49 5 5 0 3 4 0 1 3 0 2 3.6 7.8 10.8 0
Tesco 6 13 60.6 54.6 9 9 1 3 3 0 0 2 0 0 2.8 3.2 3.7 3.6
Travis Perkins 9 9 55.9 50.6 5 5 1 2 3 0 0 1 0 0 4.3 0.7 4.3 1.3
TUI 8 101 57.8 n/a 9 6 6 5 0 0 0 1 0 0 2.8 7.2 n/a n/a
Tullow Oil 7 9 60 56 5 5 0 1 3 0 0 2 0 1 4.5 1 1 0.9
UBM 6 9 58.1 54.9 6 6 4 2 2 0 1 1 0 0 3.5 0.2 4 2.7
Unilever 6 13 59.7 56.6 10 10 10 5 2 1 0 0 0 0 4 2 9.3 2
United Utilities Group 8 10 57.3 54.5 6 6 0 3 3 0 0 2 0 1 3.8 9.8 7.1 7.6
Vodafone Group 7 12 62 55.1 9 9 6 4 2 1 0 2 2 1 3.8 6.8 9.8 4.1
Weir Group 8 9 63.4 47.6 6 6 2 3 2 0 0 3 1 2 3.1 4.3 1.6 1.6
Whitbread 11 8 55 52 4 4 0 2 3 0 2 0 0 0 2.8 0.2 2.4 5.5
Wm Morrison Supermarkets 8 9 60.3 51.8 6 6 1 2 2 0 0 2 1 0 1.8 3.3 3.1 5.1
Wood Group (John) 6 10 59.1 49.7 7 7 3 4 2 0 0 2 1 1 3.5 4 2.3 3
WPP 6 11 59.7 64.7 9 9 9 3 1 1 0 0 0 0 5 2.9 2.9 9.4
1 Supervisory board only, exmployee representatives excluded
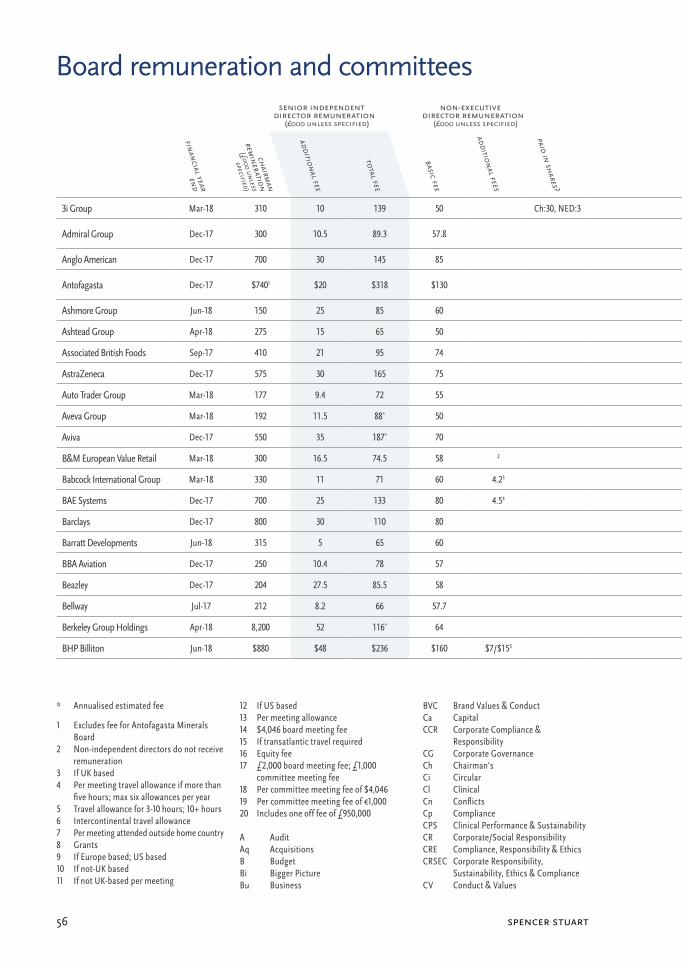
spencer stuart56
senior independent director remuneration
(£000 unless specified)
non-executive director remuneration
(£000 unless specified) committeescommittee fees
(£000 unless specified)outside quoted
boards
financial year end
chairm
an
remineration
(£000 unless
specified)
additional fee
total fee
basic fee
additional fees
paid in shares?
count
type
meetings
comm
ittee
chairm
en
mem
bers
board
evaluation
chairm
an
ceo
cfo
Board remuneration and committees
* Annualised estimated fee
1 Excludes fee for Antofagasta Minerals Board
2 Non-independent directors do not receive remuneration
3 If UK based4 Per meeting travel allowance if more than
five hours; max six allowances per year5 Travel allowance for 3-10 hours; 10+ hours6 Intercontinental travel allowance7 Per meeting attended outside home country8 Grants9 If Europe based; US based10 If not-UK based11 If not UK-based per meeting
12 If US based13 Per meeting allowance14 $4,046 board meeting fee15 If transatlantic travel required16 Equity fee17 £2,000 board meeting fee; £1,000
committee meeting fee18 Per committee meeting fee of $4,04619 Per committee meeting fee of €1,00020 Includes one off fee of £950,000
A AuditAq AcquisitionsB BudgetBi Bigger PictureBu Business
BVC Brand Values & ConductCa CapitalCCR Corporate Compliance &
ResponsibilityCG Corporate GovernanceCh Chairman'sCi CircularCl ClinicalCn ConflictsCp ComplianceCPS Clinical Performance & SustainabilityCR Corporate/Social ResponsibilityCRE Compliance, Responsibility & EthicsCRSEC Corporate Responsibility,
Sustainability, Ethics & ComplianceCV Conduct & Values
3i Group Mar-18 310 10 139 50 Ch:30, NED:3 4 ACp R N V ACp6 R7 N3 V4 ACp R V 20 ACp R V 8 Internal 2 0 1
Admiral Group Dec-17 300 10.5 89.3 57.8 4 A R N Ri A7 R5 N7 Ri5A 21; R 10.5; N 5.3;
Ri 41A Ri 12.6 Internal 1 0 0
Anglo American Dec-17 700 30 145 85 4 A R N Su A4 R3 N5 Su4 A R N Su 30 None Internal 1 1 0
Antofagasta Dec-17 $7401 $20 $318 $130 5 ARi RT NG SSk PjARi4 RT6 NG4 SSk8
Pj8A $20; R $16; N SSk
Pj $10A R SSk Pj $10; N $4 Internal 3 n/a n/a
Ashmore Group Jun-18 150 25 85 60 3 ARi R N ARi4 R6 N2 None None Internal 1 0 0
Ashtead Group Apr-18 275 15 65 50 4 A R N FA A5 R6 N3 FA0 ARi R 10 None Internal 4 1 0
Associated British Foods Sep-17 410 21 95 74 3 A R N A4 R4 N3 A21 None External 0 0 1
AstraZeneca Dec-17 575 30 165 75 4 A R NG Si A5 R5 NG5 Si3 A 45; R 40; Si 22 A 20; R 15; Si 12 External 1 0 0
Auto Trader Group Mar-18 177 9.4 72 55 3 A R N A3 R4 N1 A R 9.4 None Internal 0 0 0
Aveva Group Mar-18 192 11.5 88* 50 3 A R N A5 R6 N3 A R 11.5 None External 2 0 0
Aviva Dec-17 550 35 187* 70 5 A R N G Ri A7 R8 N4 G6 Ri6 A Ri 45; R G35 A Ri 15; R 12.5; N 7.5 External 0 1 0
B&M European Value Retail Mar-18 300 16.5 74.5 58 2 3 ARi R N ARi4 R4 N3 A R 12 None Internal 2 0 0
Babcock International Group Mar-18 330 11 71 60 4.23 3 ARi R N ARi4 R7 N4 A R 15 None Internal 1 0 0
BAE Systems Dec-17 700 25 133 80 4.54 4 A R N CR A6 R6 N4 CR4 A R CR 25 None External 0 0 1
Barclays Dec-17 800 30 110 80 5 A R N Ri RR A10 R7 N3 RR4 Ri9 A R Ri 70; RR 50 A R 30; N 15; Ri RR 25 External 1 0 0
Barratt Developments Jun-18 315 5 65 60 4 A R N SHE A4 R5 N3 SHE2 A R 10; SHE 5 None Internal 1 0 0
BBA Aviation Dec-17 250 10.4 78 57 3 ARi R N ARi5 R9 N10 ARi 16; R 10.6 None Internal 3 0 0
Beazley Dec-17 204 27.5 85.5 58 3 ARi R N ARi6 R5 N5 A 34.5; R 16 None Internal 0 1 0
Bellway Jul-17 212 8.2 66 57.7 4 A R R N A3 R4 N3 R1 A R 8 None External 0 0 0
Berkeley Group Holdings Apr-18 8,200 52 116* 64 3 A R N A3 R2 N3 A R 13 None Internal 0 0 0
BHP Billiton Jun-18 $880 $48 $236 $160 $7/$155 4 ARi R NG Su ARi12 R5 NG10 Su4 ARi $60; R Su $45 A $32.5; R Su $27.5 Internal 0 0 n/a
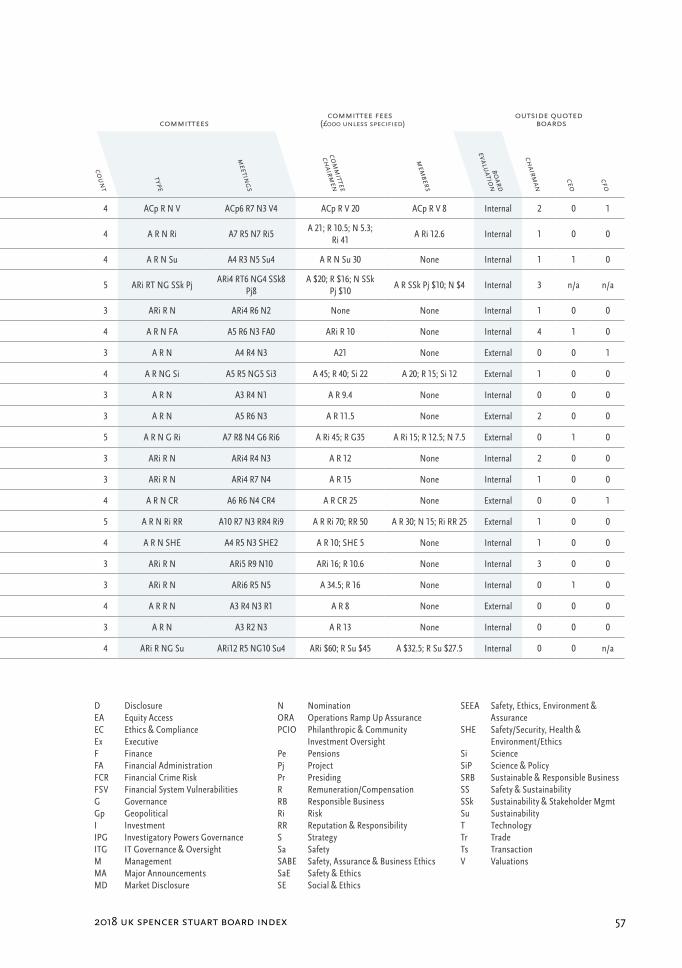
2018 uk spencer stuart board index 57
senior independent director remuneration
(£000 unless specified)
non-executive director remuneration
(£000 unless specified) committeescommittee fees
(£000 unless specified)outside quoted
boards
financial year end
chairm
an
remineration
(£000 unless
specified)
additional fee
total fee
basic fee
additional fees
paid in shares?
count
type
meetings
comm
ittee
chairm
en
mem
bers
board
evaluation
chairm
an
ceo
cfo
D DisclosureEA Equity AccessEC Ethics & ComplianceEx ExecutiveF FinanceFA Financial AdministrationFCR Financial Crime RiskFSV Financial System VulnerabilitiesG GovernanceGp GeopoliticalI InvestmentIPG Investigatory Powers GovernanceITG IT Governance & OversightM ManagementMA Major AnnouncementsMD Market Disclosure
N NominationORA Operations Ramp Up AssurancePCIO Philanthropic & Community
Investment OversightPe PensionsPj ProjectPr PresidingR Remuneration/CompensationRB Responsible BusinessRi RiskRR Reputation & ResponsibilityS StrategySa SafetySABE Safety, Assurance & Business EthicsSaE Safety & EthicsSE Social & Ethics
SEEA Safety, Ethics, Environment & Assurance
SHE Safety/Security, Health & Environment/Ethics
Si Science SiP Science & Policy SRB Sustainable & Responsible Business SS Safety & Sustainability SSk Sustainability & Stakeholder Mgmt Su Sustainability T Technology Tr Trade Ts Transaction V Valuations
3i Group Mar-18 310 10 139 50 Ch:30, NED:3 4 ACp R N V ACp6 R7 N3 V4 ACp R V 20 ACp R V 8 Internal 2 0 1
Admiral Group Dec-17 300 10.5 89.3 57.8 4 A R N Ri A7 R5 N7 Ri5A 21; R 10.5; N 5.3;
Ri 41A Ri 12.6 Internal 1 0 0
Anglo American Dec-17 700 30 145 85 4 A R N Su A4 R3 N5 Su4 A R N Su 30 None Internal 1 1 0
Antofagasta Dec-17 $7401 $20 $318 $130 5 ARi RT NG SSk PjARi4 RT6 NG4 SSk8
Pj8A $20; R $16; N SSk
Pj $10A R SSk Pj $10; N $4 Internal 3 n/a n/a
Ashmore Group Jun-18 150 25 85 60 3 ARi R N ARi4 R6 N2 None None Internal 1 0 0
Ashtead Group Apr-18 275 15 65 50 4 A R N FA A5 R6 N3 FA0 ARi R 10 None Internal 4 1 0
Associated British Foods Sep-17 410 21 95 74 3 A R N A4 R4 N3 A21 None External 0 0 1
AstraZeneca Dec-17 575 30 165 75 4 A R NG Si A5 R5 NG5 Si3 A 45; R 40; Si 22 A 20; R 15; Si 12 External 1 0 0
Auto Trader Group Mar-18 177 9.4 72 55 3 A R N A3 R4 N1 A R 9.4 None Internal 0 0 0
Aveva Group Mar-18 192 11.5 88* 50 3 A R N A5 R6 N3 A R 11.5 None External 2 0 0
Aviva Dec-17 550 35 187* 70 5 A R N G Ri A7 R8 N4 G6 Ri6 A Ri 45; R G35 A Ri 15; R 12.5; N 7.5 External 0 1 0
B&M European Value Retail Mar-18 300 16.5 74.5 58 2 3 ARi R N ARi4 R4 N3 A R 12 None Internal 2 0 0
Babcock International Group Mar-18 330 11 71 60 4.23 3 ARi R N ARi4 R7 N4 A R 15 None Internal 1 0 0
BAE Systems Dec-17 700 25 133 80 4.54 4 A R N CR A6 R6 N4 CR4 A R CR 25 None External 0 0 1
Barclays Dec-17 800 30 110 80 5 A R N Ri RR A10 R7 N3 RR4 Ri9 A R Ri 70; RR 50 A R 30; N 15; Ri RR 25 External 1 0 0
Barratt Developments Jun-18 315 5 65 60 4 A R N SHE A4 R5 N3 SHE2 A R 10; SHE 5 None Internal 1 0 0
BBA Aviation Dec-17 250 10.4 78 57 3 ARi R N ARi5 R9 N10 ARi 16; R 10.6 None Internal 3 0 0
Beazley Dec-17 204 27.5 85.5 58 3 ARi R N ARi6 R5 N5 A 34.5; R 16 None Internal 0 1 0
Bellway Jul-17 212 8.2 66 57.7 4 A R R N A3 R4 N3 R1 A R 8 None External 0 0 0
Berkeley Group Holdings Apr-18 8,200 52 116* 64 3 A R N A3 R2 N3 A R 13 None Internal 0 0 0
BHP Billiton Jun-18 $880 $48 $236 $160 $7/$155 4 ARi R NG Su ARi12 R5 NG10 Su4 ARi $60; R Su $45 A $32.5; R Su $27.5 Internal 0 0 n/a
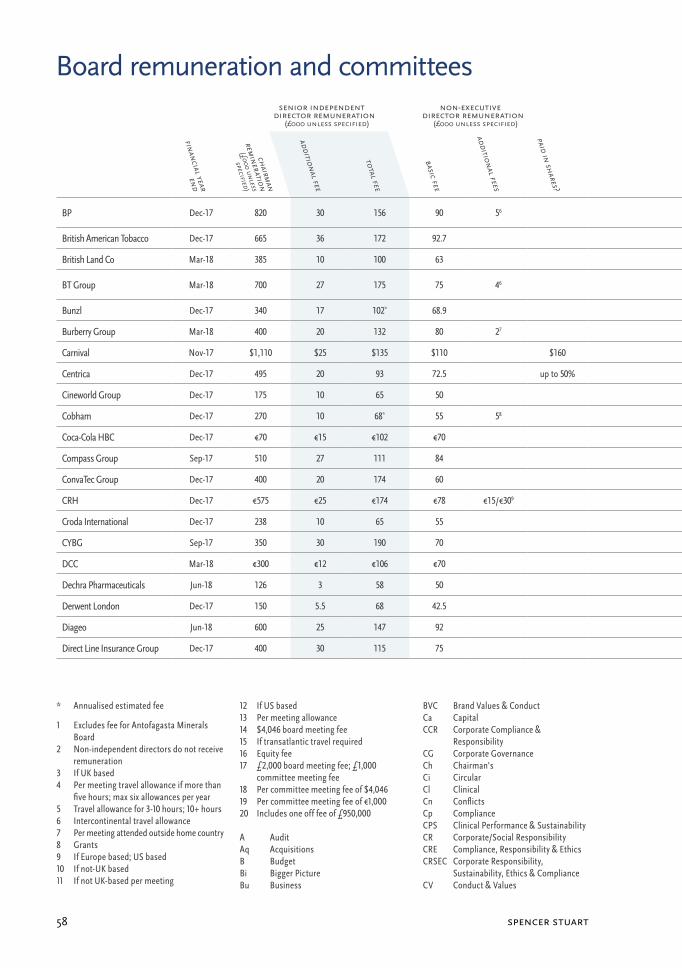
spencer stuart58
senior independent director remuneration
(£000 unless specified)
non-executive director remuneration
(£000 unless specified) committeescommittee fees
(£000 unless specified)outside quoted
boards
financial year end
chairm
an
remineration
(£000 unless
specified)
additional fee
total fee
basic fee
additional fees
paid in shares?
count
type
meetings
comm
ittee
chairm
en
mem
bers
board
evaluation
chairm
an
ceo
cfo
Board remuneration and committees
* Annualised estimated fee
1 Excludes fee for Antofagasta Minerals Board
2 Non-independent directors do not receive remuneration
3 If UK based4 Per meeting travel allowance if more than
five hours; max six allowances per year5 Travel allowance for 3-10 hours; 10+ hours6 Intercontinental travel allowance7 Per meeting attended outside home country8 Grants9 If Europe based; US based10 If not-UK based11 If not UK-based per meeting
12 If US based13 Per meeting allowance14 $4,046 board meeting fee15 If transatlantic travel required16 Equity fee17 £2,000 board meeting fee; £1,000
committee meeting fee18 Per committee meeting fee of $4,04619 Per committee meeting fee of €1,00020 Includes one off fee of £950,000
A AuditAq AcquisitionsB BudgetBi Bigger PictureBu Business
BVC Brand Values & ConductCa CapitalCCR Corporate Compliance &
ResponsibilityCG Corporate GovernanceCh Chairman'sCi CircularCl ClinicalCn ConflictsCp ComplianceCPS Clinical Performance & SustainabilityCR Corporate/Social ResponsibilityCRE Compliance, Responsibility & EthicsCRSEC Corporate Responsibility,
Sustainability, Ethics & ComplianceCV Conduct & Values
BP Dec-17 820 30 156 90 56 6 A R N Ch SEEA GpA13 R8 N3 Ch7
SEEA6 Gp3A R SEEA GP 30 A R SEEA 20 External 1 1 1
British American Tobacco Dec-17 665 36 172 92.7 3 A R N A7 R6 N7 A R 36 A 36; R N 11 Internal 3 1 1
British Land Co Mar-18 385 10 100 63 3 A R N A3 R6 N4 A R 20 A R 8; N 4 External 1 1 n/a
BT Group Mar-18 700 27 175 75 46 8ARi R NG Pe EA SRB
IPG TARi9 R8 NG3 BTPe8 EA? SRB2 IPG4 T3
A35; R28; Pe25; SRB 12.5; EA 72.5
A 25; R 15; N Pe 10; SRB 5
External 0 0 0
Bunzl Dec-17 340 17 102* 68.9 3 A R N A4 R4 N4 A R 17 None External 2 1 1
Burberry Group Mar-18 400 20 132 80 27 3 A R N A3 R5 N3 A R 35 None External 0 0 1
Carnival Nov-17 $1,110 $25 $135 $110 $160 5 A R NG Ex SHE A14 R4 NG5 Ex0 SHE4 A R Ex SHE $30; N $15 None Internal 1 3 n/a
Centrica Dec-17 495 20 93 72.5 up to 50% 5 A R N D SHE A7 R7 N3 D13 SHE6 A 25; R SHE 20 None External 1 1 0
Cineworld Group Dec-17 175 10 65 50 3 A R N A4 R4 N2 A 20; R 10; N 5 None Internal 0 0 0
Cobham Dec-17 270 10 68* 55 58 4 A R N Ri A6 R6 N2 Ri0 A 10; R 10 A R N 2.5 Internal 0 0 0
Coca-Cola HBC Dec-17 €70 €15 €102 €70 4 ARi R N CR ARi8 R3 N3 CR4 A €27.5; R N CR €11 A €13.8; R N CR €5.5 External 1 n/a n/a
Compass Group Sep-17 510 27 111 84 4 A R N CR A3 R6 N2 CR2 A 27; R25; CR 15 None Internal 4 0 0
ConvaTec Group Dec-17 400 20 174 60 5 ARi R N CR MD ARi7 R4 N5 CR1 MD? A 22; R 20 A R N 12 Internal 0 0 0
CRH Dec-17 €575 €25 €174 €78 €15/€309 5 A R NCG Aq F A7 R9 NCG5 Aq5 F5 A €39; R €15; N €27 All 27 Internal 1 0 0
Croda International Dec-17 238 10 65 55 3 A R N A6 R4 N3 A R 10 None External 2 0 1
CYBG Sep-17 350 30 190 70 4 A R NG Ri A6 R5 NG4 Ri6 A R Ri 30; N 5 A R Ri 10; NG 5 External 2 0 0
DCC Mar-18 €300 €12 €106 €70 3 A R NG A4 R6 NG6 A €12; R €7.5 A €8; R €5; NG €3 External 2 0 0
Dechra Pharmaceuticals Jun-18 126 3 58 50 3 A R N A5 R8 N5 A R 5 None Internal 1 0 0
Derwent London Dec-17 150 5.5 68 42.5 4 A R N Ri A4 R2 N4 Ri4 All 11.5 All 4 External 2 0 0
Diageo Jun-18 600 25 147 92 3 A R N A4 R5 N3 A R 30 None External 2 0 1
Direct Line Insurance Group Dec-17 400 30 115 75 6 A R N Ri CR I A5 R5 N4 Ri6 CR3 I4 A R Ri 30; CR I 10 A R Ri 10; N CR 5 Internal 1 0 0
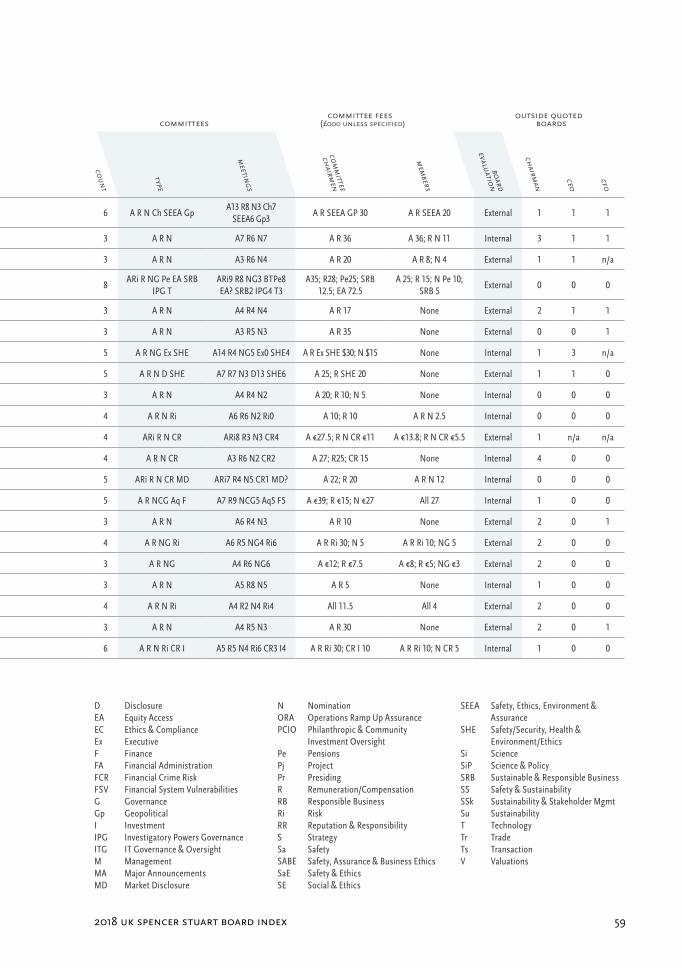
2018 uk spencer stuart board index 59
senior independent director remuneration
(£000 unless specified)
non-executive director remuneration
(£000 unless specified) committeescommittee fees
(£000 unless specified)outside quoted
boards
financial year end
chairm
an
remineration
(£000 unless
specified)
additional fee
total fee
basic fee
additional fees
paid in shares?
count
type
meetings
comm
ittee
chairm
en
mem
bers
board
evaluation
chairm
an
ceo
cfo
D DisclosureEA Equity AccessEC Ethics & ComplianceEx ExecutiveF FinanceFA Financial AdministrationFCR Financial Crime RiskFSV Financial System VulnerabilitiesG GovernanceGp GeopoliticalI InvestmentIPG Investigatory Powers GovernanceITG IT Governance & OversightM ManagementMA Major AnnouncementsMD Market Disclosure
N NominationORA Operations Ramp Up AssurancePCIO Philanthropic & Community
Investment OversightPe PensionsPj ProjectPr PresidingR Remuneration/CompensationRB Responsible BusinessRi RiskRR Reputation & ResponsibilityS StrategySa SafetySABE Safety, Assurance & Business EthicsSaE Safety & EthicsSE Social & Ethics
SEEA Safety, Ethics, Environment & Assurance
SHE Safety/Security, Health & Environment/Ethics
Si Science SiP Science & Policy SRB Sustainable & Responsible Business SS Safety & Sustainability SSk Sustainability & Stakeholder Mgmt Su Sustainability T Technology Tr Trade Ts Transaction V Valuations
BP Dec-17 820 30 156 90 56 6 A R N Ch SEEA GpA13 R8 N3 Ch7
SEEA6 Gp3A R SEEA GP 30 A R SEEA 20 External 1 1 1
British American Tobacco Dec-17 665 36 172 92.7 3 A R N A7 R6 N7 A R 36 A 36; R N 11 Internal 3 1 1
British Land Co Mar-18 385 10 100 63 3 A R N A3 R6 N4 A R 20 A R 8; N 4 External 1 1 n/a
BT Group Mar-18 700 27 175 75 46 8ARi R NG Pe EA SRB
IPG TARi9 R8 NG3 BTPe8 EA? SRB2 IPG4 T3
A35; R28; Pe25; SRB 12.5; EA 72.5
A 25; R 15; N Pe 10; SRB 5
External 0 0 0
Bunzl Dec-17 340 17 102* 68.9 3 A R N A4 R4 N4 A R 17 None External 2 1 1
Burberry Group Mar-18 400 20 132 80 27 3 A R N A3 R5 N3 A R 35 None External 0 0 1
Carnival Nov-17 $1,110 $25 $135 $110 $160 5 A R NG Ex SHE A14 R4 NG5 Ex0 SHE4 A R Ex SHE $30; N $15 None Internal 1 3 n/a
Centrica Dec-17 495 20 93 72.5 up to 50% 5 A R N D SHE A7 R7 N3 D13 SHE6 A 25; R SHE 20 None External 1 1 0
Cineworld Group Dec-17 175 10 65 50 3 A R N A4 R4 N2 A 20; R 10; N 5 None Internal 0 0 0
Cobham Dec-17 270 10 68* 55 58 4 A R N Ri A6 R6 N2 Ri0 A 10; R 10 A R N 2.5 Internal 0 0 0
Coca-Cola HBC Dec-17 €70 €15 €102 €70 4 ARi R N CR ARi8 R3 N3 CR4 A €27.5; R N CR €11 A €13.8; R N CR €5.5 External 1 n/a n/a
Compass Group Sep-17 510 27 111 84 4 A R N CR A3 R6 N2 CR2 A 27; R25; CR 15 None Internal 4 0 0
ConvaTec Group Dec-17 400 20 174 60 5 ARi R N CR MD ARi7 R4 N5 CR1 MD? A 22; R 20 A R N 12 Internal 0 0 0
CRH Dec-17 €575 €25 €174 €78 €15/€309 5 A R NCG Aq F A7 R9 NCG5 Aq5 F5 A €39; R €15; N €27 All 27 Internal 1 0 0
Croda International Dec-17 238 10 65 55 3 A R N A6 R4 N3 A R 10 None External 2 0 1
CYBG Sep-17 350 30 190 70 4 A R NG Ri A6 R5 NG4 Ri6 A R Ri 30; N 5 A R Ri 10; NG 5 External 2 0 0
DCC Mar-18 €300 €12 €106 €70 3 A R NG A4 R6 NG6 A €12; R €7.5 A €8; R €5; NG €3 External 2 0 0
Dechra Pharmaceuticals Jun-18 126 3 58 50 3 A R N A5 R8 N5 A R 5 None Internal 1 0 0
Derwent London Dec-17 150 5.5 68 42.5 4 A R N Ri A4 R2 N4 Ri4 All 11.5 All 4 External 2 0 0
Diageo Jun-18 600 25 147 92 3 A R N A4 R5 N3 A R 30 None External 2 0 1
Direct Line Insurance Group Dec-17 400 30 115 75 6 A R N Ri CR I A5 R5 N4 Ri6 CR3 I4 A R Ri 30; CR I 10 A R Ri 10; N CR 5 Internal 1 0 0
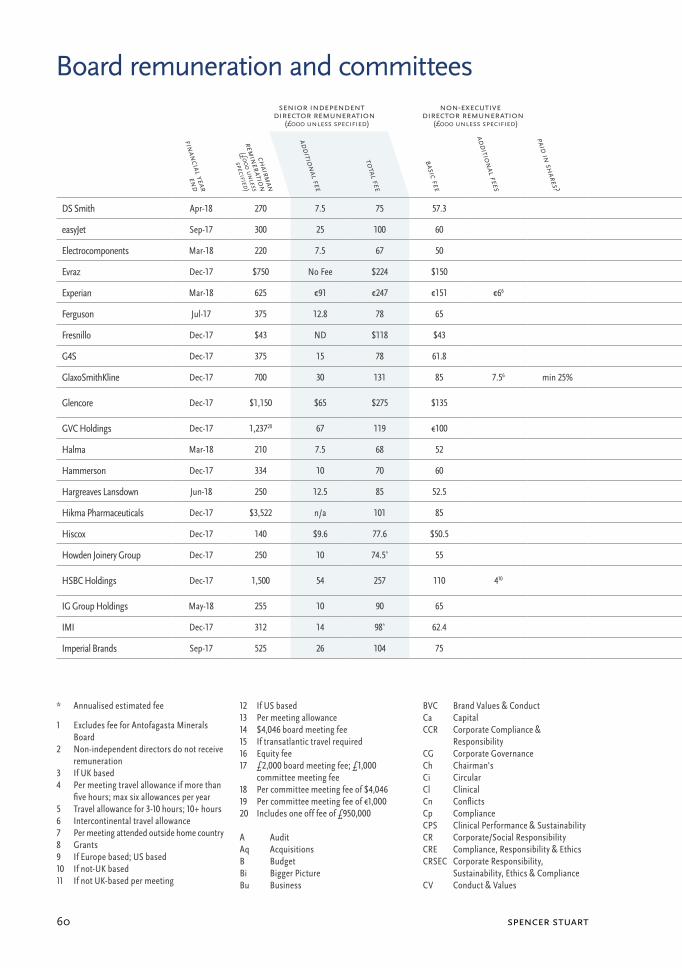
spencer stuart60
senior independent director remuneration
(£000 unless specified)
non-executive director remuneration
(£000 unless specified) committeescommittee fees
(£000 unless specified)outside quoted
boards
financial year end
chairm
an
remineration
(£000 unless
specified)
additional fee
total fee
basic fee
additional fees
paid in shares?
count
type
meetings
comm
ittee
chairm
en
mem
bers
board
evaluation
chairm
an
ceo
cfo
Board remuneration and committees
* Annualised estimated fee
1 Excludes fee for Antofagasta Minerals Board
2 Non-independent directors do not receive remuneration
3 If UK based4 Per meeting travel allowance if more than
five hours; max six allowances per year5 Travel allowance for 3-10 hours; 10+ hours6 Intercontinental travel allowance7 Per meeting attended outside home country8 Grants9 If Europe based; US based10 If not-UK based11 If not UK-based per meeting
12 If US based13 Per meeting allowance14 $4,046 board meeting fee15 If transatlantic travel required16 Equity fee17 £2,000 board meeting fee; £1,000
committee meeting fee18 Per committee meeting fee of $4,04619 Per committee meeting fee of €1,00020 Includes one off fee of £950,000
A AuditAq AcquisitionsB BudgetBi Bigger PictureBu Business
BVC Brand Values & ConductCa CapitalCCR Corporate Compliance &
ResponsibilityCG Corporate GovernanceCh Chairman'sCi CircularCl ClinicalCn ConflictsCp ComplianceCPS Clinical Performance & SustainabilityCR Corporate/Social ResponsibilityCRE Compliance, Responsibility & EthicsCRSEC Corporate Responsibility,
Sustainability, Ethics & ComplianceCV Conduct & Values
DS Smith Apr-18 270 7.5 75 57.3 3 A R N A4 R5 N4 A R 11 None External 1 1 0
easyJet Sep-17 300 25 100 60 6 A R N F ITG Sa A4 R5 N4 F5 ITG4 Sa4 A R Sa 15; F 10 None Internal 2 0 1
Electrocomponents Mar-18 220 7.5 67 50 3 A R N A4 R5 N5 A R 10 None Internal 1 0 0
Evraz Dec-17 $750 No Fee $224 $150 4 A R N SHE A9 R4 N3 SHE2 A $100; R SHE $50 All $24 External 0 1 n/a
Experian Mar-18 625 €91 €247 €151 €66 3 A R NCG A4 R4 NCG6 A €45.5; R €36.5 None Internal 1 1 1
Ferguson Jul-17 375 12.8 78 65 4 A R N MA A4 R6 N4 MA0 A 18.9; R 15.9 None Internal 1 0 1
Fresnillo Dec-17 $43 ND $118 $43 3 A R N A5 R3 N2 Not Disclosed None External 5 n/a n/a
G4S Dec-17 375 15 78 61.8 5 A R N CR Ri A4 R4 N4 CR4 Ri4 A 20; R CR Ri 18.5 None External 0 1 0
GlaxoSmithKline Dec-17 700 30 131 85 7.56 min 25% 5 ARi R N Si CR ARi10 R12 N7 CR4 Si4 ARi 80; R CR Si 30 None External 1 0 0
Glencore Dec-17 $1,150 $65 $275 $135 4 A R N SHE A4 R2 N4 SHE5A $60; R $45; N $40;
SHE $125A $35; R $25; N $20;
SHE $40Internal 0 1 n/a
GVC Holdings Dec-17 1,23720 67 119 €100 3 A R N A2 R3 N2 A €25 None External 0 0 0
Halma Mar-18 210 7.5 68 52 3 A R N A3 R3 N3 A 10; R 8 None External 2 1 1
Hammerson Dec-17 334 10 70 60 3 A R N A3 R6 N2 A R 15 A R 5 Internal 1 1 1
Hargreaves Lansdown Jun-18 250 12.5 85 52.5 5 A R N I Ri A5 R6 N5 Ri6 I4 A 25; R 12.5; N Ri I 10 A R Ri I 2.5 Internal 3 0 0
Hikma Pharmaceuticals Dec-17 $3,522 n/a 101 85 4 A R NG CRE A6 R6 NG4 CRE5 A 16; R NG CRE8 All 8 External 0 1 n/a
Hiscox Dec-17 140 $9.6 77.6 $50.5 6 A R N Cn I Ri A4 R4 N4 I? Cn? Ri? A Ri $22.5; R $17 A ? R $8.5; Ri $10 External 0 0 0
Howden Joinery Group Dec-17 250 10 74.5* 55 3 A R N A3 R6 N4 All 10 None Internal 0 1 0
HSBC Holdings Dec-17 1,500 54 257 110 410 7 A R N CV FSV PCIO RiA8 R7 N7 CV6 FSV7
Ri7 PCIO3A R Ri 60; N 40;
PCIO25A R Ri 30; N 25;
PCIO 15Internal 0 0 0
IG Group Holdings May-18 255 10 90 65 4 A R N Ri A4 R5 N4 Ri4 A R Ri 15 None Internal 2 0 0
IMI Dec-17 312 14 98* 62.4 3 A R N A4 R2 N3 A R N 15.6 None External 1 0 0
Imperial Brands Sep-17 525 26 104 75 3 A R ScN A4 R5 ScN4 A R 26 All 5 Internal 2 0 0
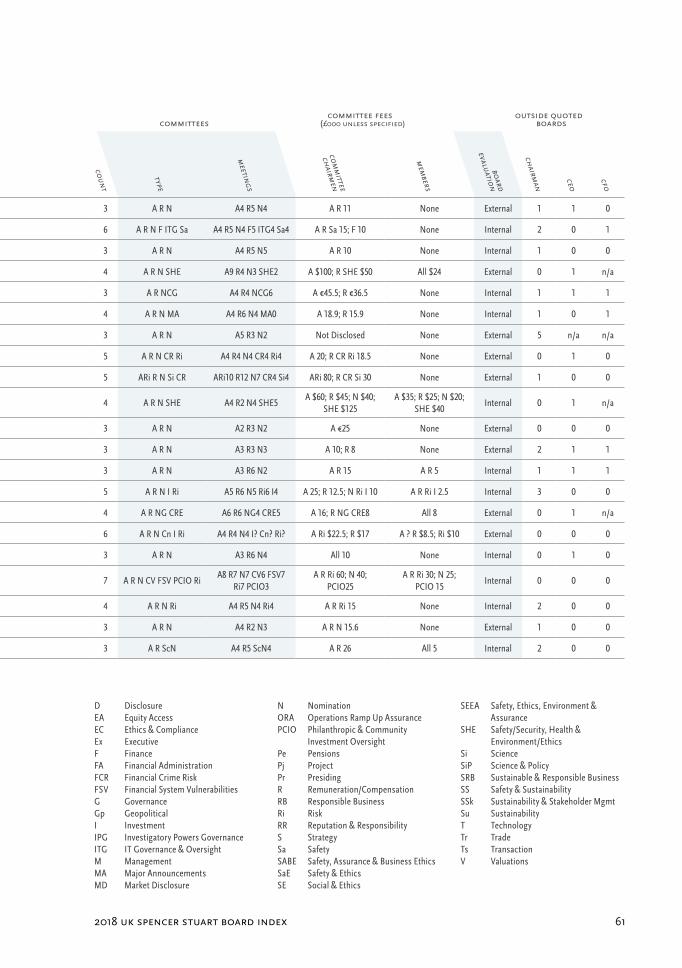
2018 uk spencer stuart board index 61
senior independent director remuneration
(£000 unless specified)
non-executive director remuneration
(£000 unless specified) committeescommittee fees
(£000 unless specified)outside quoted
boards
financial year end
chairm
an
remineration
(£000 unless
specified)
additional fee
total fee
basic fee
additional fees
paid in shares?
count
type
meetings
comm
ittee
chairm
en
mem
bers
board
evaluation
chairm
an
ceo
cfo
D DisclosureEA Equity AccessEC Ethics & ComplianceEx ExecutiveF FinanceFA Financial AdministrationFCR Financial Crime RiskFSV Financial System VulnerabilitiesG GovernanceGp GeopoliticalI InvestmentIPG Investigatory Powers GovernanceITG IT Governance & OversightM ManagementMA Major AnnouncementsMD Market Disclosure
N NominationORA Operations Ramp Up AssurancePCIO Philanthropic & Community
Investment OversightPe PensionsPj ProjectPr PresidingR Remuneration/CompensationRB Responsible BusinessRi RiskRR Reputation & ResponsibilityS StrategySa SafetySABE Safety, Assurance & Business EthicsSaE Safety & EthicsSE Social & Ethics
SEEA Safety, Ethics, Environment & Assurance
SHE Safety/Security, Health & Environment/Ethics
Si Science SiP Science & Policy SRB Sustainable & Responsible Business SS Safety & Sustainability SSk Sustainability & Stakeholder Mgmt Su Sustainability T Technology Tr Trade Ts Transaction V Valuations
DS Smith Apr-18 270 7.5 75 57.3 3 A R N A4 R5 N4 A R 11 None External 1 1 0
easyJet Sep-17 300 25 100 60 6 A R N F ITG Sa A4 R5 N4 F5 ITG4 Sa4 A R Sa 15; F 10 None Internal 2 0 1
Electrocomponents Mar-18 220 7.5 67 50 3 A R N A4 R5 N5 A R 10 None Internal 1 0 0
Evraz Dec-17 $750 No Fee $224 $150 4 A R N SHE A9 R4 N3 SHE2 A $100; R SHE $50 All $24 External 0 1 n/a
Experian Mar-18 625 €91 €247 €151 €66 3 A R NCG A4 R4 NCG6 A €45.5; R €36.5 None Internal 1 1 1
Ferguson Jul-17 375 12.8 78 65 4 A R N MA A4 R6 N4 MA0 A 18.9; R 15.9 None Internal 1 0 1
Fresnillo Dec-17 $43 ND $118 $43 3 A R N A5 R3 N2 Not Disclosed None External 5 n/a n/a
G4S Dec-17 375 15 78 61.8 5 A R N CR Ri A4 R4 N4 CR4 Ri4 A 20; R CR Ri 18.5 None External 0 1 0
GlaxoSmithKline Dec-17 700 30 131 85 7.56 min 25% 5 ARi R N Si CR ARi10 R12 N7 CR4 Si4 ARi 80; R CR Si 30 None External 1 0 0
Glencore Dec-17 $1,150 $65 $275 $135 4 A R N SHE A4 R2 N4 SHE5A $60; R $45; N $40;
SHE $125A $35; R $25; N $20;
SHE $40Internal 0 1 n/a
GVC Holdings Dec-17 1,23720 67 119 €100 3 A R N A2 R3 N2 A €25 None External 0 0 0
Halma Mar-18 210 7.5 68 52 3 A R N A3 R3 N3 A 10; R 8 None External 2 1 1
Hammerson Dec-17 334 10 70 60 3 A R N A3 R6 N2 A R 15 A R 5 Internal 1 1 1
Hargreaves Lansdown Jun-18 250 12.5 85 52.5 5 A R N I Ri A5 R6 N5 Ri6 I4 A 25; R 12.5; N Ri I 10 A R Ri I 2.5 Internal 3 0 0
Hikma Pharmaceuticals Dec-17 $3,522 n/a 101 85 4 A R NG CRE A6 R6 NG4 CRE5 A 16; R NG CRE8 All 8 External 0 1 n/a
Hiscox Dec-17 140 $9.6 77.6 $50.5 6 A R N Cn I Ri A4 R4 N4 I? Cn? Ri? A Ri $22.5; R $17 A ? R $8.5; Ri $10 External 0 0 0
Howden Joinery Group Dec-17 250 10 74.5* 55 3 A R N A3 R6 N4 All 10 None Internal 0 1 0
HSBC Holdings Dec-17 1,500 54 257 110 410 7 A R N CV FSV PCIO RiA8 R7 N7 CV6 FSV7
Ri7 PCIO3A R Ri 60; N 40;
PCIO25A R Ri 30; N 25;
PCIO 15Internal 0 0 0
IG Group Holdings May-18 255 10 90 65 4 A R N Ri A4 R5 N4 Ri4 A R Ri 15 None Internal 2 0 0
IMI Dec-17 312 14 98* 62.4 3 A R N A4 R2 N3 A R N 15.6 None External 1 0 0
Imperial Brands Sep-17 525 26 104 75 3 A R ScN A4 R5 ScN4 A R 26 All 5 Internal 2 0 0
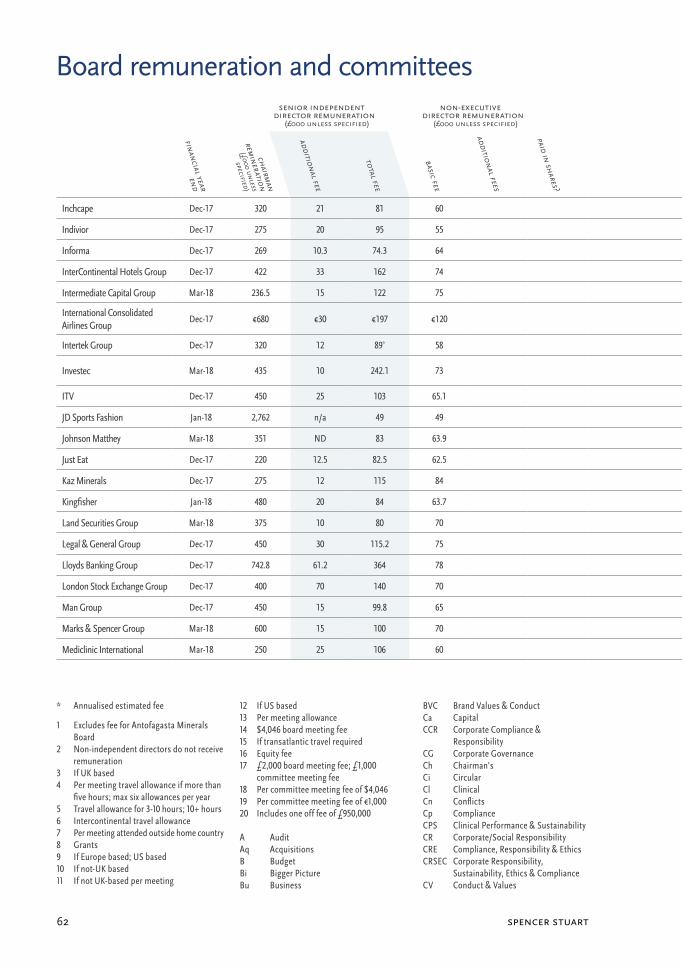
spencer stuart62
senior independent director remuneration
(£000 unless specified)
non-executive director remuneration
(£000 unless specified) committeescommittee fees
(£000 unless specified)outside quoted
boards
financial year end
chairm
an
remineration
(£000 unless
specified)
additional fee
total fee
basic fee
additional fees
paid in shares?
count
type
meetings
comm
ittee
chairm
en
mem
bers
board
evaluation
chairm
an
ceo
cfo
Board remuneration and committees
* Annualised estimated fee
1 Excludes fee for Antofagasta Minerals Board
2 Non-independent directors do not receive remuneration
3 If UK based4 Per meeting travel allowance if more than
five hours; max six allowances per year5 Travel allowance for 3-10 hours; 10+ hours6 Intercontinental travel allowance7 Per meeting attended outside home country8 Grants9 If Europe based; US based10 If not-UK based11 If not UK-based per meeting
12 If US based13 Per meeting allowance14 $4,046 board meeting fee15 If transatlantic travel required16 Equity fee17 £2,000 board meeting fee; £1,000
committee meeting fee18 Per committee meeting fee of $4,04619 Per committee meeting fee of €1,00020 Includes one off fee of £950,000
A AuditAq AcquisitionsB BudgetBi Bigger PictureBu Business
BVC Brand Values & ConductCa CapitalCCR Corporate Compliance &
ResponsibilityCG Corporate GovernanceCh Chairman'sCi CircularCl ClinicalCn ConflictsCp ComplianceCPS Clinical Performance & SustainabilityCR Corporate/Social ResponsibilityCRE Compliance, Responsibility & EthicsCRSEC Corporate Responsibility,
Sustainability, Ethics & ComplianceCV Conduct & Values
Inchcape Dec-17 320 21 81 60 4 A R N CR A4 R2 N2 CR2 A R 15; CR 10 None External 2 1 0
Indivior Dec-17 275 20 95 55 4 A R NG SiP A9 R6 NG5 SiP5 All 20 All 10 External 0 0 0
Informa Dec-17 269 10.3 74.3 64 3 A R N A4 R8 N2 A 13.7; R 10.3 None External 2 1 0
InterContinental Hotels Group Dec-17 422 33 162 74 4 A R N CR A5 R6 N3 CR3 A R 25; CR 13 None External 1 0 1
Intermediate Capital Group Mar-18 236.5 15 122 75 4 A R NG Ri A4 R4 NG6 Ri4 A R Ri 20 A R Ri 12 Internal 2 0 0
International Consolidated Airlines Group
Dec-17 €680 €30 €197 €120 4 ACp R N Sa ACp8 R5 N6 Sa2 All €20 None Internal 0 0 0
Intertek Group Dec-17 320 12 89* 58 3 A R N A4 R3 N4 A 20; R15 A R 10 Internal 0 1 0
Investec Mar-18 435 10 242.1 73 5 A R N RiCa SE A4 R11 N5 RiCa6 SE4 A 65; R 46; RiCa 45A 19; R 17; N SE 12.5;
RiCa 15Internal 1 2 2
ITV Dec-17 450 25 103 65.1 3 ARi R N ARi6 R6 N1 A R 20 A R 5.4 Internal 0 1 1
JD Sports Fashion Jan-18 2,762 n/a 49 49 3 A R N A2 R2 N1 None None Internal 2 n/a 0
Johnson Matthey Mar-18 351 ND 83 63.9 3 A R N A6 R5 N7 A Not Disclosed R16 None External 0 2 1
Just Eat Dec-17 220 12.5 82.5 62.5 3 A R N A3 R6 N7 A R 15 None Internal 2 0 1
Kaz Minerals Dec-17 275 12 115 84 5 A R N SHE ORA A6 R2 N2 SHE3 ORA4 A SHE 15; R8; ORA12 A 7.5; R4; SHE 9; ORA 6 Internal 0 0 n/a
Kingfisher Jan-18 480 20 84 63.7 3 A R N A4 R4 N4 A R 20 None Internal 0 0 1
Land Securities Group Mar-18 375 10 80 70 3 A R N A4 R4 N5 A 20; R15 None Internal 3 0 0
Legal & General Group Dec-17 450 30 115.2 75 5 A R N CG Ri A7 R6 N1 Ri6 A R Ri 30 All 10 External 0 0 0
Lloyds Banking Group Dec-17 742.8 61.2 364 78 5 A R NG RB Ri A8 R7 NG8 RB5 Ri8 A R Ri 71.4; RB 40.8 A R Ri 32.6; N RB 15.3 Internal 0 1 0
London Stock Exchange Group Dec-17 400 70 140 70 4 A R N Ri A5 R6 N4 Ri4 A R Ri 30 None External 1 0 n/a
Man Group Dec-17 450 15 99.8 65 3 ARi R N ARi6 R7 N1 ARi 30; R 25 ARi15; N 10 Internal 2 0 0
Marks & Spencer Group Mar-18 600 15 100 70 3 A R N A5 R3 N5 A R 15 None Internal 0 0 n/a
Mediclinic International Mar-18 250 25 106 60 5 ARi R N CPS I ARi4 R3 N2 CPS4 I2 A R 15; CPS I 10 A R 10; CCPcSu I 6.6 External 1 1 0
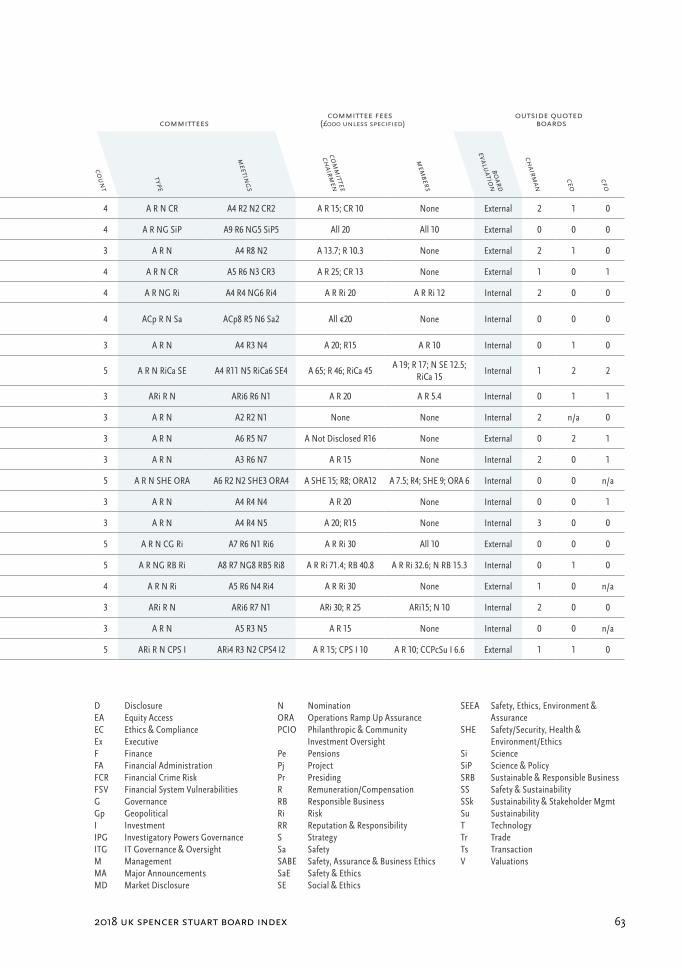
2018 uk spencer stuart board index 63
senior independent director remuneration
(£000 unless specified)
non-executive director remuneration
(£000 unless specified) committeescommittee fees
(£000 unless specified)outside quoted
boards
financial year end
chairm
an
remineration
(£000 unless
specified)
additional fee
total fee
basic fee
additional fees
paid in shares?
count
type
meetings
comm
ittee
chairm
en
mem
bers
board
evaluation
chairm
an
ceo
cfo
D DisclosureEA Equity AccessEC Ethics & ComplianceEx ExecutiveF FinanceFA Financial AdministrationFCR Financial Crime RiskFSV Financial System VulnerabilitiesG GovernanceGp GeopoliticalI InvestmentIPG Investigatory Powers GovernanceITG IT Governance & OversightM ManagementMA Major AnnouncementsMD Market Disclosure
N NominationORA Operations Ramp Up AssurancePCIO Philanthropic & Community
Investment OversightPe PensionsPj ProjectPr PresidingR Remuneration/CompensationRB Responsible BusinessRi RiskRR Reputation & ResponsibilityS StrategySa SafetySABE Safety, Assurance & Business EthicsSaE Safety & EthicsSE Social & Ethics
SEEA Safety, Ethics, Environment & Assurance
SHE Safety/Security, Health & Environment/Ethics
Si Science SiP Science & Policy SRB Sustainable & Responsible Business SS Safety & Sustainability SSk Sustainability & Stakeholder Mgmt Su Sustainability T Technology Tr Trade Ts Transaction V Valuations
Inchcape Dec-17 320 21 81 60 4 A R N CR A4 R2 N2 CR2 A R 15; CR 10 None External 2 1 0
Indivior Dec-17 275 20 95 55 4 A R NG SiP A9 R6 NG5 SiP5 All 20 All 10 External 0 0 0
Informa Dec-17 269 10.3 74.3 64 3 A R N A4 R8 N2 A 13.7; R 10.3 None External 2 1 0
InterContinental Hotels Group Dec-17 422 33 162 74 4 A R N CR A5 R6 N3 CR3 A R 25; CR 13 None External 1 0 1
Intermediate Capital Group Mar-18 236.5 15 122 75 4 A R NG Ri A4 R4 NG6 Ri4 A R Ri 20 A R Ri 12 Internal 2 0 0
International Consolidated Airlines Group
Dec-17 €680 €30 €197 €120 4 ACp R N Sa ACp8 R5 N6 Sa2 All €20 None Internal 0 0 0
Intertek Group Dec-17 320 12 89* 58 3 A R N A4 R3 N4 A 20; R15 A R 10 Internal 0 1 0
Investec Mar-18 435 10 242.1 73 5 A R N RiCa SE A4 R11 N5 RiCa6 SE4 A 65; R 46; RiCa 45A 19; R 17; N SE 12.5;
RiCa 15Internal 1 2 2
ITV Dec-17 450 25 103 65.1 3 ARi R N ARi6 R6 N1 A R 20 A R 5.4 Internal 0 1 1
JD Sports Fashion Jan-18 2,762 n/a 49 49 3 A R N A2 R2 N1 None None Internal 2 n/a 0
Johnson Matthey Mar-18 351 ND 83 63.9 3 A R N A6 R5 N7 A Not Disclosed R16 None External 0 2 1
Just Eat Dec-17 220 12.5 82.5 62.5 3 A R N A3 R6 N7 A R 15 None Internal 2 0 1
Kaz Minerals Dec-17 275 12 115 84 5 A R N SHE ORA A6 R2 N2 SHE3 ORA4 A SHE 15; R8; ORA12 A 7.5; R4; SHE 9; ORA 6 Internal 0 0 n/a
Kingfisher Jan-18 480 20 84 63.7 3 A R N A4 R4 N4 A R 20 None Internal 0 0 1
Land Securities Group Mar-18 375 10 80 70 3 A R N A4 R4 N5 A 20; R15 None Internal 3 0 0
Legal & General Group Dec-17 450 30 115.2 75 5 A R N CG Ri A7 R6 N1 Ri6 A R Ri 30 All 10 External 0 0 0
Lloyds Banking Group Dec-17 742.8 61.2 364 78 5 A R NG RB Ri A8 R7 NG8 RB5 Ri8 A R Ri 71.4; RB 40.8 A R Ri 32.6; N RB 15.3 Internal 0 1 0
London Stock Exchange Group Dec-17 400 70 140 70 4 A R N Ri A5 R6 N4 Ri4 A R Ri 30 None External 1 0 n/a
Man Group Dec-17 450 15 99.8 65 3 ARi R N ARi6 R7 N1 ARi 30; R 25 ARi15; N 10 Internal 2 0 0
Marks & Spencer Group Mar-18 600 15 100 70 3 A R N A5 R3 N5 A R 15 None Internal 0 0 n/a
Mediclinic International Mar-18 250 25 106 60 5 ARi R N CPS I ARi4 R3 N2 CPS4 I2 A R 15; CPS I 10 A R 10; CCPcSu I 6.6 External 1 1 0
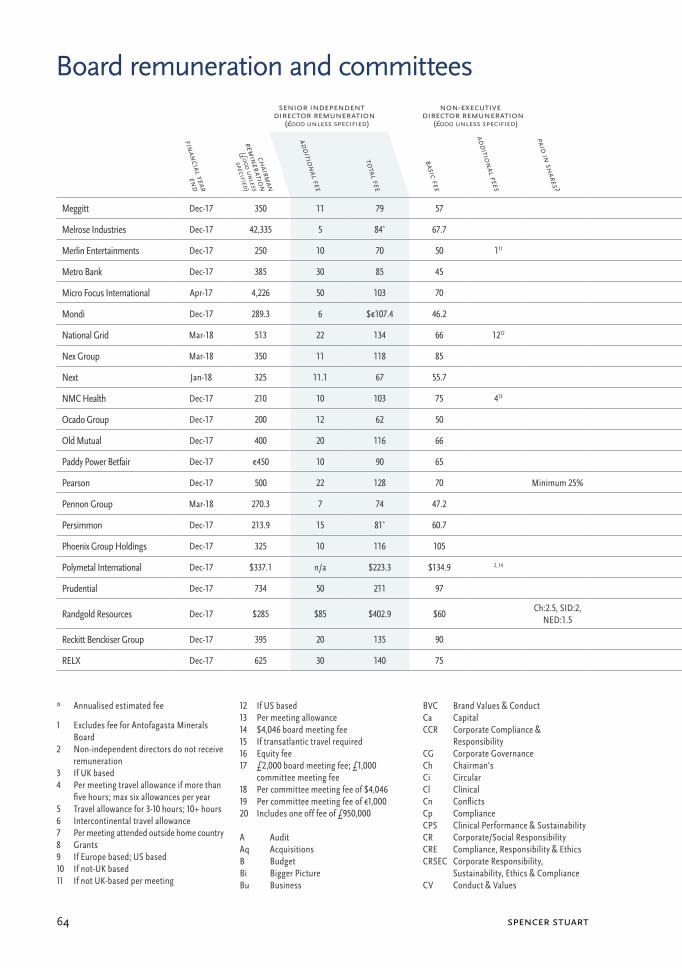
spencer stuart64
senior independent director remuneration
(£000 unless specified)
non-executive director remuneration
(£000 unless specified) committeescommittee fees
(£000 unless specified)outside quoted
boards
financial year end
chairm
an
remineration
(£000 unless
specified)
additional fee
total fee
basic fee
additional fees
paid in shares?
count
type
meetings
comm
ittee
chairm
en
mem
bers
board
evaluation
chairm
an
ceo
cfo
Board remuneration and committees
* Annualised estimated fee
1 Excludes fee for Antofagasta Minerals Board
2 Non-independent directors do not receive remuneration
3 If UK based4 Per meeting travel allowance if more than
five hours; max six allowances per year5 Travel allowance for 3-10 hours; 10+ hours6 Intercontinental travel allowance7 Per meeting attended outside home country8 Grants9 If Europe based; US based10 If not-UK based11 If not UK-based per meeting
12 If US based13 Per meeting allowance14 $4,046 board meeting fee15 If transatlantic travel required16 Equity fee17 £2,000 board meeting fee; £1,000
committee meeting fee18 Per committee meeting fee of $4,04619 Per committee meeting fee of €1,00020 Includes one off fee of £950,000
A AuditAq AcquisitionsB BudgetBi Bigger PictureBu Business
BVC Brand Values & ConductCa CapitalCCR Corporate Compliance &
ResponsibilityCG Corporate GovernanceCh Chairman'sCi CircularCl ClinicalCn ConflictsCp ComplianceCPS Clinical Performance & SustainabilityCR Corporate/Social ResponsibilityCRE Compliance, Responsibility & EthicsCRSEC Corporate Responsibility,
Sustainability, Ethics & ComplianceCV Conduct & Values
Meggitt Dec-17 350 11 79 57 4 A R N EC A4 R5 N5 EC? A R 11 None Internal 3 0 1
Melrose Industries Dec-17 42,335 5 84* 67.7 3 A R N A3 R2 N2 A R 10; N 2.5 None External 1 0 0
Merlin Entertainments Dec-17 250 10 70 50 111 4 A R N SHE A5 R3 N2 SHE4 A R 10 None External 0 0 0
Metro Bank Dec-17 385 30 85 45 4 A R N Ri A8 R5 N4 Ri8 A R Ri 20; N 10 A R Ri 10; N 5 External 1 0 0
Micro Focus International Apr-17 4,226 50 103 70 3 A R N A8, R8 N12 All 20 None Internal 0 0 1
Mondi Dec-17 289.3 6 $€107.4 46.2 4 A R N S A4 R5 N7 S6 A 11.6; R 11; S 9.2 None Internal 0.5 0 0
National Grid Mar-18 513 22 134 66 1212 5 A R N F SHE A6 R6 N7 F4 SHE5 A R 19.4; N SHE 12.5 All 10.3 Internal 0 1 1
Nex Group Mar-18 350 11 118 85 5 A R N G Ri A4 R7 N1 G6 Ri6 A R Ri 11; N 5 None External 2 0 1
Next Jan-18 325 11.1 67 55.7 3 A R N A4 R5 N1 A R 11.1 None Internal 2 0 0
NMC Health Dec-17 210 10 103 75 413 4 A R N CG A4 R4 N1 CG2 All 10 None No 0 0 n/a
Ocado Group Dec-17 200 12 62 50 3 A R N A5 R4 N2 A R 12 None Internal 3 0 1
Old Mutual Dec-17 400 20 116 66 4 A R NG Ri A7 R9 NG7 Ri6 A R Ri 40 A R Ri 15; N 8.5 Internal 0 1 0
Paddy Power Betfair Dec-17 €450 10 90 65 4 A R N Ri A7 R6 N4 Ri5 A €25; R N Ri €20 None Internal 2 0 1
Pearson Dec-17 500 22 128 70 Minimum 25% 4 A R NG RR A4 R5 NG3 RR4 A 27.5; R 22; N 15; RR13 A 15; R 10; N 8; RR 6 External 1 0 0
Pennon Group Mar-18 270.3 7 74 47.2 4 A R N Su A4 R4 N3 Su4 A 14.2; R Su 10.1 All 5.1 Internal 2 0 0
Persimmon Dec-17 213.9 15 81* 60.7 3 A R N A5 R4 N5 All 15 None Internal 0 0 0
Phoenix Group Holdings Dec-17 325 10 116 105 4 A R N Ri A7 R6 N6 Ri6 A R Ri 20 None External 2 0 0
Polymetal International Dec-17 $337.1 n/a $223.3 $134.9 2, 14 4 ARi R N SS ARi6 R4 N3 SS6 A 440.5; R N SS 20.2 All $13.518 Internal 0 0 n/a
Prudential Dec-17 734 50 211 97 4 A R NG Ri A9 R6 NG4 Ri6 A Ri 75; R 60 A R Ri 27.5; N 10 External 1 0 0
Randgold Resources Dec-17 $285 $85 $402.9 $60 Ch:2.5, SID:2,
NED:1.53 A R GN A6 R4 GN4 A $55; R $45; N $30 A $35; R $25; N $10 External 1 1 0
Reckitt Benckiser Group Dec-17 395 20 135 90 4 A R N CRSEC A6 R4 N3 CRSEC4 A R N CRSEC 30 All 15 Internal 1 0 2
RELX Dec-17 625 30 140 75 4 A R N CG A4 R3 N3 CG5 A €35; R 25 A R 15; N 10 External 1 2 2
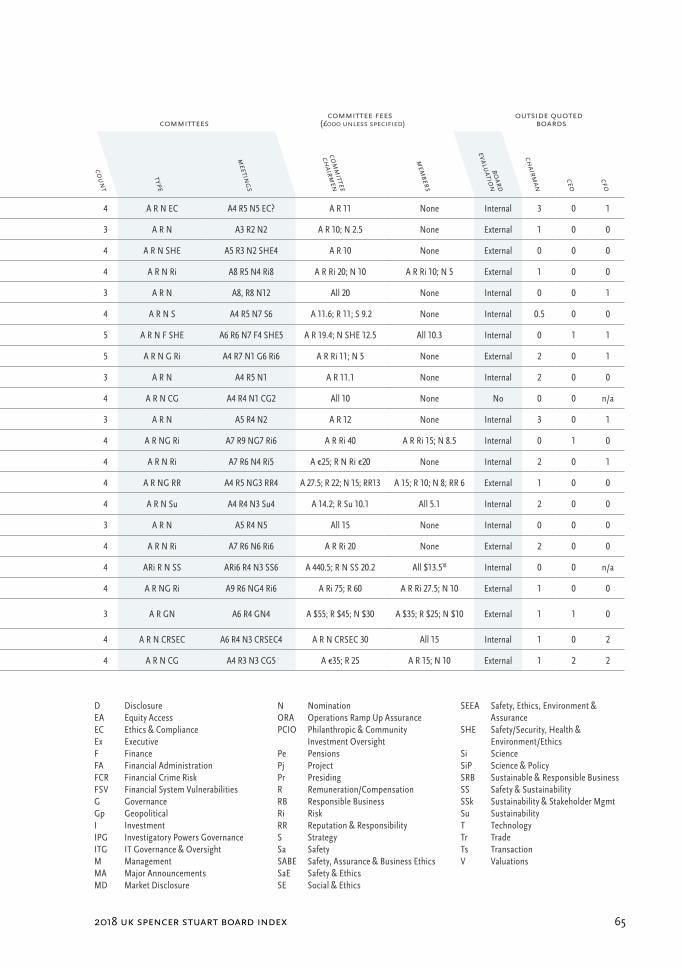
2018 uk spencer stuart board index 65
senior independent director remuneration
(£000 unless specified)
non-executive director remuneration
(£000 unless specified) committeescommittee fees
(£000 unless specified)outside quoted
boards
financial year end
chairm
an
remineration
(£000 unless
specified)
additional fee
total fee
basic fee
additional fees
paid in shares?
count
type
meetings
comm
ittee
chairm
en
mem
bers
board
evaluation
chairm
an
ceo
cfo
D DisclosureEA Equity AccessEC Ethics & ComplianceEx ExecutiveF FinanceFA Financial AdministrationFCR Financial Crime RiskFSV Financial System VulnerabilitiesG GovernanceGp GeopoliticalI InvestmentIPG Investigatory Powers GovernanceITG IT Governance & OversightM ManagementMA Major AnnouncementsMD Market Disclosure
N NominationORA Operations Ramp Up AssurancePCIO Philanthropic & Community
Investment OversightPe PensionsPj ProjectPr PresidingR Remuneration/CompensationRB Responsible BusinessRi RiskRR Reputation & ResponsibilityS StrategySa SafetySABE Safety, Assurance & Business EthicsSaE Safety & EthicsSE Social & Ethics
SEEA Safety, Ethics, Environment & Assurance
SHE Safety/Security, Health & Environment/Ethics
Si Science SiP Science & Policy SRB Sustainable & Responsible Business SS Safety & Sustainability SSk Sustainability & Stakeholder Mgmt Su Sustainability T Technology Tr Trade Ts Transaction V Valuations
Meggitt Dec-17 350 11 79 57 4 A R N EC A4 R5 N5 EC? A R 11 None Internal 3 0 1
Melrose Industries Dec-17 42,335 5 84* 67.7 3 A R N A3 R2 N2 A R 10; N 2.5 None External 1 0 0
Merlin Entertainments Dec-17 250 10 70 50 111 4 A R N SHE A5 R3 N2 SHE4 A R 10 None External 0 0 0
Metro Bank Dec-17 385 30 85 45 4 A R N Ri A8 R5 N4 Ri8 A R Ri 20; N 10 A R Ri 10; N 5 External 1 0 0
Micro Focus International Apr-17 4,226 50 103 70 3 A R N A8, R8 N12 All 20 None Internal 0 0 1
Mondi Dec-17 289.3 6 $€107.4 46.2 4 A R N S A4 R5 N7 S6 A 11.6; R 11; S 9.2 None Internal 0.5 0 0
National Grid Mar-18 513 22 134 66 1212 5 A R N F SHE A6 R6 N7 F4 SHE5 A R 19.4; N SHE 12.5 All 10.3 Internal 0 1 1
Nex Group Mar-18 350 11 118 85 5 A R N G Ri A4 R7 N1 G6 Ri6 A R Ri 11; N 5 None External 2 0 1
Next Jan-18 325 11.1 67 55.7 3 A R N A4 R5 N1 A R 11.1 None Internal 2 0 0
NMC Health Dec-17 210 10 103 75 413 4 A R N CG A4 R4 N1 CG2 All 10 None No 0 0 n/a
Ocado Group Dec-17 200 12 62 50 3 A R N A5 R4 N2 A R 12 None Internal 3 0 1
Old Mutual Dec-17 400 20 116 66 4 A R NG Ri A7 R9 NG7 Ri6 A R Ri 40 A R Ri 15; N 8.5 Internal 0 1 0
Paddy Power Betfair Dec-17 €450 10 90 65 4 A R N Ri A7 R6 N4 Ri5 A €25; R N Ri €20 None Internal 2 0 1
Pearson Dec-17 500 22 128 70 Minimum 25% 4 A R NG RR A4 R5 NG3 RR4 A 27.5; R 22; N 15; RR13 A 15; R 10; N 8; RR 6 External 1 0 0
Pennon Group Mar-18 270.3 7 74 47.2 4 A R N Su A4 R4 N3 Su4 A 14.2; R Su 10.1 All 5.1 Internal 2 0 0
Persimmon Dec-17 213.9 15 81* 60.7 3 A R N A5 R4 N5 All 15 None Internal 0 0 0
Phoenix Group Holdings Dec-17 325 10 116 105 4 A R N Ri A7 R6 N6 Ri6 A R Ri 20 None External 2 0 0
Polymetal International Dec-17 $337.1 n/a $223.3 $134.9 2, 14 4 ARi R N SS ARi6 R4 N3 SS6 A 440.5; R N SS 20.2 All $13.518 Internal 0 0 n/a
Prudential Dec-17 734 50 211 97 4 A R NG Ri A9 R6 NG4 Ri6 A Ri 75; R 60 A R Ri 27.5; N 10 External 1 0 0
Randgold Resources Dec-17 $285 $85 $402.9 $60 Ch:2.5, SID:2,
NED:1.53 A R GN A6 R4 GN4 A $55; R $45; N $30 A $35; R $25; N $10 External 1 1 0
Reckitt Benckiser Group Dec-17 395 20 135 90 4 A R N CRSEC A6 R4 N3 CRSEC4 A R N CRSEC 30 All 15 Internal 1 0 2
RELX Dec-17 625 30 140 75 4 A R N CG A4 R3 N3 CG5 A €35; R 25 A R 15; N 10 External 1 2 2

spencer stuart66
senior independent director remuneration
(£000 unless specified)
non-executive director remuneration
(£000 unless specified) committeescommittee fees
(£000 unless specified)outside quoted
boards
financial year end
chairm
an
remineration
(£000 unless
specified)
additional fee
total fee
basic fee
additional fees
paid in shares?
count
type
meetings
comm
ittee
chairm
en
mem
bers
board
evaluation
chairm
an
ceo
cfo
Board remuneration and committees
* Annualised estimated fee
1 Excludes fee for Antofagasta Minerals Board
2 Non-independent directors do not receive remuneration
3 If UK based4 Per meeting travel allowance if more than
five hours; max six allowances per year5 Travel allowance for 3-10 hours; 10+ hours6 Intercontinental travel allowance7 Per meeting attended outside home country8 Grants9 If Europe based; US based10 If not-UK based11 If not UK-based per meeting
12 If US based13 Per meeting allowance14 $4,046 board meeting fee15 If transatlantic travel required16 Equity fee17 £2,000 board meeting fee; £1,000
committee meeting fee18 Per committee meeting fee of $4,04619 Per committee meeting fee of €1,00020 Includes one off fee of £950,000
A AuditAq AcquisitionsB BudgetBi Bigger PictureBu Business
BVC Brand Values & ConductCa CapitalCCR Corporate Compliance &
ResponsibilityCG Corporate GovernanceCh Chairman'sCi CircularCl ClinicalCn ConflictsCp ComplianceCPS Clinical Performance & SustainabilityCR Corporate/Social ResponsibilityCRE Compliance, Responsibility & EthicsCRSEC Corporate Responsibility,
Sustainability, Ethics & ComplianceCV Conduct & Values
Renishaw Jun-18 1,402 n/a 52 51.6 3 A R N A3 R7 N4 Not Disclosed None Internal 0 0 0
Rentokil Initial Dec-17 350 10 70 60 3 A R N A4 R6 N7 A R 15 None External 2 0 1
Rightmove Dec-17 170 5 65 50 3 A R N A5 R6 N3 A 10 None Internal 3 0 0
Rio Tinto Dec-17 940 40 135 95 5 A R N Ch Su A6 R9 N7 Ch16 Su5 A 40; R Su 35 A 20; R Su 15; N 7.5 External 2 1 1
RIT Capital Partners Dec-17 1,365.3 7.5 48.5 30 5 ARi R N Cn V ARi7 R2 N2 Cn1 V2 A 10; R N Cn V 7.5 A 6; R N 4; Cn3; V 6 Internal 0 n/a n/a
Rolls-Royce Holdings Dec-17 425 15 110 70 5 A R NG SaE SiT A5 R7 NG7 SaE6 SiT6 A 25; R SaE SiT 20 None External 2 0 1
Rotork Dec-17 462 10 65 47 3 A R N A6 R5 N5 A 10; R 8 None External 1 0 0
Royal Bank of Scotland Group Dec-17 750 30 231 80 5 A R NG Ri Su A7 R7 NG7 Ri9 Su6 TIv0 A R Ri Su 60 A R Ri Su 30; N 15 Internal 1 0 0
Royal Dutch Shell Dec-17 €850 €55 €237 €135 4 A R N CR A6 R5 N6 CR6A €60; R €40; N €25;
CR €35A €25; R CR €17.3;
N €12Internal 2 0 0
Royal Mail Mar-18 300 10 81 50 4 ARi R N Pe ARi5 R5 N4 Pe5 ARi R 15; Pe10 None External 3 1 0
RPC Group Mar-18 200 10 70 50 3 A R N A3 R5 N1 A R 10 None Internal 2 1 0
RSA Insurance Group Dec-17 420 20 90 62.5 5 A R NG I Ri A6 R5 NG4 Ri4 I2 A R Ri 20; I 12.5 All 5 Internal 1 1 0
Sage Group Sep-17 360 10 83 60 3 ARi R N A4 R7 N5 A R 17 None Internal 1 0 0
Sainsbury (J) Mar-18 510 19.5 108 67.5 4 A R N CRS A4 R4 N3 CRS2 A R 19.5; CRS 13.5 None Internal 1 1 0
Schroders Dec-17 625 20 150 80 3 ARi R N ARi5 R5 N4 A 45; R 40 A 25; R 20 External 0 0 0
SEGRO Dec-17 250 12 71 55 3 A R N A3 R2 N2 A R 10 None External 0 0 0
Severn Trent Mar-18 280.5 10 63.5 53.5 5 A R N CR Te A4 R6 N4 CRy3 Te6 A R Te 15; CR 13 None External 1 0 0
Shaftesbury Sep-17 225 10 65 57 3 A R N A3 R4 N3 All 10 None External 2 0 0
Shire Dec-17 475 5 150.3 93 515, 17 25% 4 ARi R NG SiT ARi5 R10 NG6 SiT5 ARi R 25; N 17.5; SiT 20 A R 12.5; N 8.8; SiT 10 Internal 3 1 0
Sky Jun-18 410 40 140.1 66.2 4 A R CGN Bi A6 R6 CGN3 Bi1 All 25 All 10 External 3 1 1
Smith & Nephew Dec-17 412 20 95 68.1 3.56 CH:103, NED:5 4 A R NG EC A7 R7 NG8 EC4 All 20 None Internal 1 2 0
Smiths Group Jul-17 336.6 20 89 66.2 36 3 A R N A4 R4 N3 All 20 None Internal 3 0 0

2018 uk spencer stuart board index 67
senior independent director remuneration
(£000 unless specified)
non-executive director remuneration
(£000 unless specified) committeescommittee fees
(£000 unless specified)outside quoted
boards
financial year end
chairm
an
remineration
(£000 unless
specified)
additional fee
total fee
basic fee
additional fees
paid in shares?
count
type
meetings
comm
ittee
chairm
en
mem
bers
board
evaluation
chairm
an
ceo
cfo
D DisclosureEA Equity AccessEC Ethics & ComplianceEx ExecutiveF FinanceFA Financial AdministrationFCR Financial Crime RiskFSV Financial System VulnerabilitiesG GovernanceGp GeopoliticalI InvestmentIPG Investigatory Powers GovernanceITG IT Governance & OversightM ManagementMA Major AnnouncementsMD Market Disclosure
N NominationORA Operations Ramp Up AssurancePCIO Philanthropic & Community
Investment OversightPe PensionsPj ProjectPr PresidingR Remuneration/CompensationRB Responsible BusinessRi RiskRR Reputation & ResponsibilityS StrategySa SafetySABE Safety, Assurance & Business EthicsSaE Safety & EthicsSE Social & Ethics
SEEA Safety, Ethics, Environment & Assurance
SHE Safety/Security, Health & Environment/Ethics
Si Science SiP Science & Policy SRB Sustainable & Responsible Business SS Safety & Sustainability SSk Sustainability & Stakeholder Mgmt Su Sustainability T Technology Tr Trade Ts Transaction V Valuations
Renishaw Jun-18 1,402 n/a 52 51.6 3 A R N A3 R7 N4 Not Disclosed None Internal 0 0 0
Rentokil Initial Dec-17 350 10 70 60 3 A R N A4 R6 N7 A R 15 None External 2 0 1
Rightmove Dec-17 170 5 65 50 3 A R N A5 R6 N3 A 10 None Internal 3 0 0
Rio Tinto Dec-17 940 40 135 95 5 A R N Ch Su A6 R9 N7 Ch16 Su5 A 40; R Su 35 A 20; R Su 15; N 7.5 External 2 1 1
RIT Capital Partners Dec-17 1,365.3 7.5 48.5 30 5 ARi R N Cn V ARi7 R2 N2 Cn1 V2 A 10; R N Cn V 7.5 A 6; R N 4; Cn3; V 6 Internal 0 n/a n/a
Rolls-Royce Holdings Dec-17 425 15 110 70 5 A R NG SaE SiT A5 R7 NG7 SaE6 SiT6 A 25; R SaE SiT 20 None External 2 0 1
Rotork Dec-17 462 10 65 47 3 A R N A6 R5 N5 A 10; R 8 None External 1 0 0
Royal Bank of Scotland Group Dec-17 750 30 231 80 5 A R NG Ri Su A7 R7 NG7 Ri9 Su6 TIv0 A R Ri Su 60 A R Ri Su 30; N 15 Internal 1 0 0
Royal Dutch Shell Dec-17 €850 €55 €237 €135 4 A R N CR A6 R5 N6 CR6A €60; R €40; N €25;
CR €35A €25; R CR €17.3;
N €12Internal 2 0 0
Royal Mail Mar-18 300 10 81 50 4 ARi R N Pe ARi5 R5 N4 Pe5 ARi R 15; Pe10 None External 3 1 0
RPC Group Mar-18 200 10 70 50 3 A R N A3 R5 N1 A R 10 None Internal 2 1 0
RSA Insurance Group Dec-17 420 20 90 62.5 5 A R NG I Ri A6 R5 NG4 Ri4 I2 A R Ri 20; I 12.5 All 5 Internal 1 1 0
Sage Group Sep-17 360 10 83 60 3 ARi R N A4 R7 N5 A R 17 None Internal 1 0 0
Sainsbury (J) Mar-18 510 19.5 108 67.5 4 A R N CRS A4 R4 N3 CRS2 A R 19.5; CRS 13.5 None Internal 1 1 0
Schroders Dec-17 625 20 150 80 3 ARi R N ARi5 R5 N4 A 45; R 40 A 25; R 20 External 0 0 0
SEGRO Dec-17 250 12 71 55 3 A R N A3 R2 N2 A R 10 None External 0 0 0
Severn Trent Mar-18 280.5 10 63.5 53.5 5 A R N CR Te A4 R6 N4 CRy3 Te6 A R Te 15; CR 13 None External 1 0 0
Shaftesbury Sep-17 225 10 65 57 3 A R N A3 R4 N3 All 10 None External 2 0 0
Shire Dec-17 475 5 150.3 93 515, 17 25% 4 ARi R NG SiT ARi5 R10 NG6 SiT5 ARi R 25; N 17.5; SiT 20 A R 12.5; N 8.8; SiT 10 Internal 3 1 0
Sky Jun-18 410 40 140.1 66.2 4 A R CGN Bi A6 R6 CGN3 Bi1 All 25 All 10 External 3 1 1
Smith & Nephew Dec-17 412 20 95 68.1 3.56 CH:103, NED:5 4 A R NG EC A7 R7 NG8 EC4 All 20 None Internal 1 2 0
Smiths Group Jul-17 336.6 20 89 66.2 36 3 A R N A4 R4 N3 All 20 None Internal 3 0 0
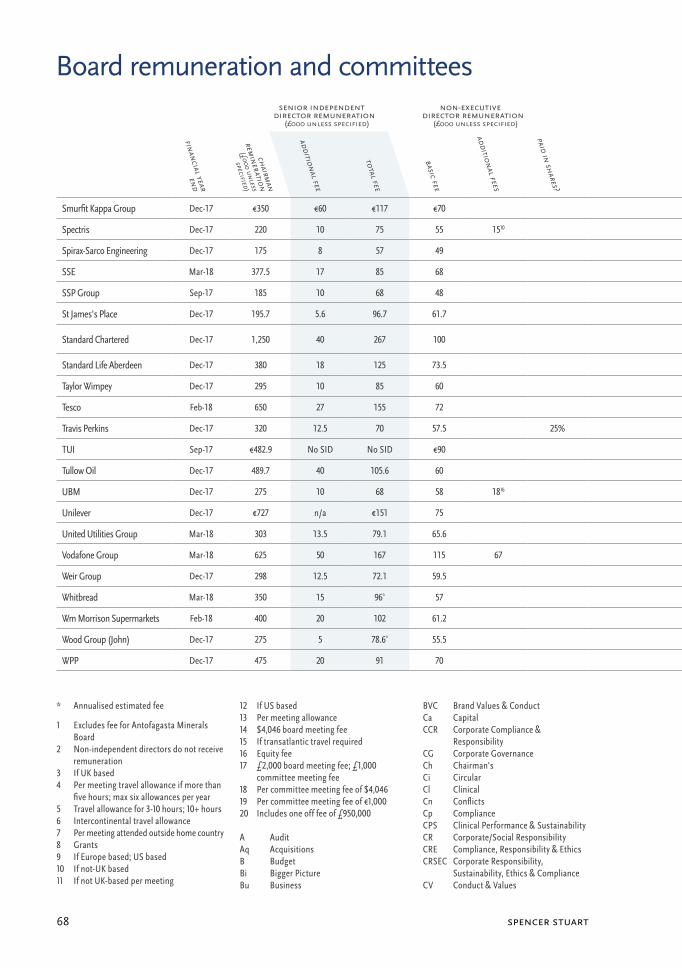
spencer stuart68
senior independent director remuneration
(£000 unless specified)
non-executive director remuneration
(£000 unless specified) committeescommittee fees
(£000 unless specified)outside quoted
boards
financial year end
chairm
an
remineration
(£000 unless
specified)
additional fee
total fee
basic fee
additional fees
paid in shares?
count
type
meetings
comm
ittee
chairm
en
mem
bers
board
evaluation
chairm
an
ceo
cfo
Board remuneration and committees
* Annualised estimated fee
1 Excludes fee for Antofagasta Minerals Board
2 Non-independent directors do not receive remuneration
3 If UK based4 Per meeting travel allowance if more than
five hours; max six allowances per year5 Travel allowance for 3-10 hours; 10+ hours6 Intercontinental travel allowance7 Per meeting attended outside home country8 Grants9 If Europe based; US based10 If not-UK based11 If not UK-based per meeting
12 If US based13 Per meeting allowance14 $4,046 board meeting fee15 If transatlantic travel required16 Equity fee17 £2,000 board meeting fee; £1,000
committee meeting fee18 Per committee meeting fee of $4,04619 Per committee meeting fee of €1,00020 Includes one off fee of £950,000
A AuditAq AcquisitionsB BudgetBi Bigger PictureBu Business
BVC Brand Values & ConductCa CapitalCCR Corporate Compliance &
ResponsibilityCG Corporate GovernanceCh Chairman'sCi CircularCl ClinicalCn ConflictsCp ComplianceCPS Clinical Performance & SustainabilityCR Corporate/Social ResponsibilityCRE Compliance, Responsibility & EthicsCRSEC Corporate Responsibility,
Sustainability, Ethics & ComplianceCV Conduct & Values
Smurfit Kappa Group Dec-17 €350 €60 €117 €70 3 A R N A5 R5 N2 A R €60 All €20 Internal 0 0 0
Spectris Dec-17 220 10 75 55 1510 3 ARi R N ARi4 N5 R6 ARi R 10 None Internal 2 1 1
Spirax-Sarco Engineering Dec-17 175 8 57 49 4 A R N Ri A3 R3 N2 Ri3 A R 10 None Internal 0 0 1
SSE Mar-18 377.5 17 85 68 4 A R N SHE A4 R3 N2 SHE3 A R 17; SHE12 None Internal 2 0 1
SSP Group Sep-17 185 10 68 48 3 A R N A3 R4 N2 A R 10 None External 3 0 1
St James's Place Dec-17 195.7 5.6 96.7 61.7 4 A R N Ri A6 R4 N3 Ri5 A R N Ri 20.6 None Internal 2 0 0
Standard Chartered Dec-17 1,250 40 267 100 6 A R GN Ri BVC FCRA7 R6 GN4 BVC4
FCR4 Ri8A Ri 70; R 60; BVC
FCR 60A R Ri BVC FCR 30;
N 15External 0 1 1
Standard Life Aberdeen Dec-17 380 18 125 73.5 4 A R NG RiCa A2 R3 NG8 RiCa9 A R RiCa 30 All 10 Internal 2 5.5 1
Taylor Wimpey Dec-17 295 10 85 60 3 A R N A3 R4 N2 A R 15 None External 1 1 0
Tesco Feb-18 650 27 155 72 4 A R N CR A6 R4 N3 CR3 A R CR 31 All 12.5 Internal 1 0 1
Travis Perkins Dec-17 320 12.5 70 57.5 25% 4 A R N Sa A5 R4 N5 Sa3 A R 17; Sa10 None Internal 1 1 0
TUI Sep-17 €482.9 No SID No SID €90 4 A N Pr S A8 N2 Pr8 S6 A €126; S €84 A Pr S €4219 No 2 n/a n/a
Tullow Oil Dec-17 489.7 40 105.6 60 4 A R N SHE A4 R5 N4 SHE3 A R 20; SHE 15 None External 0 0 0
UBM Dec-17 275 10 68 58 1816 3 A R N A4 R6 N7 A R 12 None Internal 1 1 2
Unilever Dec-17 €727 n/a €151 75 4 A R NCG CR A7 R6 NCG5 CR4 A 30; R N CR 20 A15; R N CR 10 External 1 1 0
United Utilities Group Mar-18 303 13.5 79.1 65.6 5 A R N CR Te A4 R4 N3 CR3 Te3 A 16; R 13.5; CR 12 None External 2 1 1
Vodafone Group Mar-18 625 50 167 115 67 3 ARi R NG ARi5 R5 NG5 A 25; R 50 None Internal 2 1 0
Weir Group Dec-17 298 12.5 72.1 59.5 3 A R N A4 R6 N5 A R N 15.5 None External 0 0 0
Whitbread Mar-18 350 15 96* 57 3 A R N A4 R6 N5 A R 20 A R 5 Internal 0 1 1
Wm Morrison Supermarkets Feb-18 400 20 102 61.2 4 A R N CCR A6 R6 N4 CCR5 A R N CCR 20 All 7 External 2 0 0
Wood Group (John) Dec-17 275 5 78.6* 55.5 4 A R N SABE A5 R4 N3 SABE4 A R SABE 5 None Internal 1 0 0
WPP Dec-17 475 20 91 70 3 A R NG A7 R7 NG4 A R 40; N 15 A R 20; N 10 Internal 1 1 1
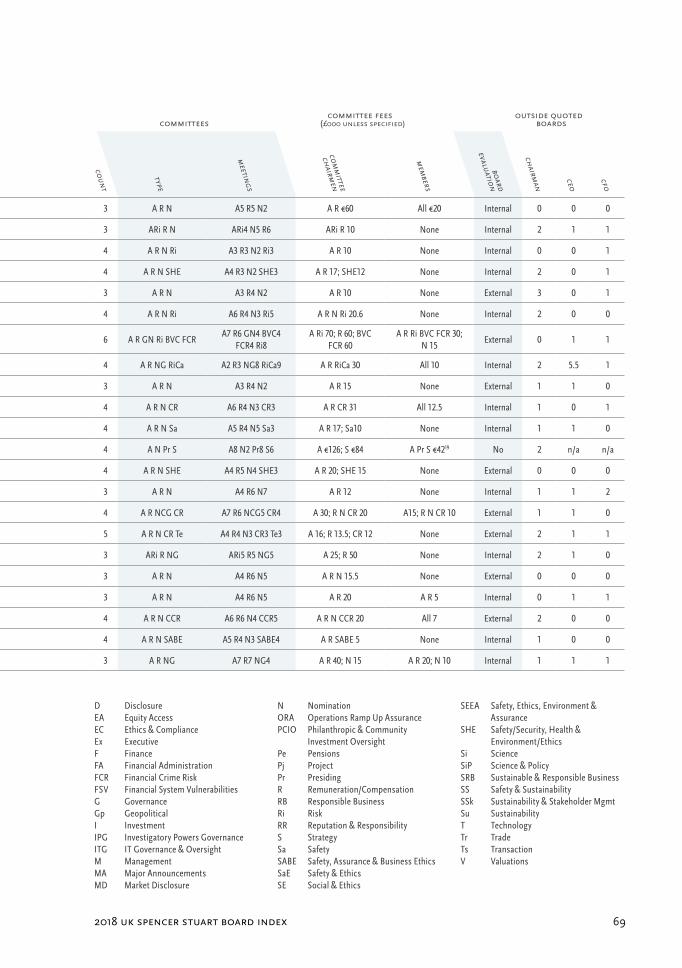
2018 uk spencer stuart board index 69
senior independent director remuneration
(£000 unless specified)
non-executive director remuneration
(£000 unless specified) committeescommittee fees
(£000 unless specified)outside quoted
boards
financial year end
chairm
an
remineration
(£000 unless
specified)
additional fee
total fee
basic fee
additional fees
paid in shares?
count
type
meetings
comm
ittee
chairm
en
mem
bers
board
evaluation
chairm
an
ceo
cfo
D DisclosureEA Equity AccessEC Ethics & ComplianceEx ExecutiveF FinanceFA Financial AdministrationFCR Financial Crime RiskFSV Financial System VulnerabilitiesG GovernanceGp GeopoliticalI InvestmentIPG Investigatory Powers GovernanceITG IT Governance & OversightM ManagementMA Major AnnouncementsMD Market Disclosure
N NominationORA Operations Ramp Up AssurancePCIO Philanthropic & Community
Investment OversightPe PensionsPj ProjectPr PresidingR Remuneration/CompensationRB Responsible BusinessRi RiskRR Reputation & ResponsibilityS StrategySa SafetySABE Safety, Assurance & Business EthicsSaE Safety & EthicsSE Social & Ethics
SEEA Safety, Ethics, Environment & Assurance
SHE Safety/Security, Health & Environment/Ethics
Si Science SiP Science & Policy SRB Sustainable & Responsible Business SS Safety & Sustainability SSk Sustainability & Stakeholder Mgmt Su Sustainability T Technology Tr Trade Ts Transaction V Valuations
Smurfit Kappa Group Dec-17 €350 €60 €117 €70 3 A R N A5 R5 N2 A R €60 All €20 Internal 0 0 0
Spectris Dec-17 220 10 75 55 1510 3 ARi R N ARi4 N5 R6 ARi R 10 None Internal 2 1 1
Spirax-Sarco Engineering Dec-17 175 8 57 49 4 A R N Ri A3 R3 N2 Ri3 A R 10 None Internal 0 0 1
SSE Mar-18 377.5 17 85 68 4 A R N SHE A4 R3 N2 SHE3 A R 17; SHE12 None Internal 2 0 1
SSP Group Sep-17 185 10 68 48 3 A R N A3 R4 N2 A R 10 None External 3 0 1
St James's Place Dec-17 195.7 5.6 96.7 61.7 4 A R N Ri A6 R4 N3 Ri5 A R N Ri 20.6 None Internal 2 0 0
Standard Chartered Dec-17 1,250 40 267 100 6 A R GN Ri BVC FCRA7 R6 GN4 BVC4
FCR4 Ri8A Ri 70; R 60; BVC
FCR 60A R Ri BVC FCR 30;
N 15External 0 1 1
Standard Life Aberdeen Dec-17 380 18 125 73.5 4 A R NG RiCa A2 R3 NG8 RiCa9 A R RiCa 30 All 10 Internal 2 5.5 1
Taylor Wimpey Dec-17 295 10 85 60 3 A R N A3 R4 N2 A R 15 None External 1 1 0
Tesco Feb-18 650 27 155 72 4 A R N CR A6 R4 N3 CR3 A R CR 31 All 12.5 Internal 1 0 1
Travis Perkins Dec-17 320 12.5 70 57.5 25% 4 A R N Sa A5 R4 N5 Sa3 A R 17; Sa10 None Internal 1 1 0
TUI Sep-17 €482.9 No SID No SID €90 4 A N Pr S A8 N2 Pr8 S6 A €126; S €84 A Pr S €4219 No 2 n/a n/a
Tullow Oil Dec-17 489.7 40 105.6 60 4 A R N SHE A4 R5 N4 SHE3 A R 20; SHE 15 None External 0 0 0
UBM Dec-17 275 10 68 58 1816 3 A R N A4 R6 N7 A R 12 None Internal 1 1 2
Unilever Dec-17 €727 n/a €151 75 4 A R NCG CR A7 R6 NCG5 CR4 A 30; R N CR 20 A15; R N CR 10 External 1 1 0
United Utilities Group Mar-18 303 13.5 79.1 65.6 5 A R N CR Te A4 R4 N3 CR3 Te3 A 16; R 13.5; CR 12 None External 2 1 1
Vodafone Group Mar-18 625 50 167 115 67 3 ARi R NG ARi5 R5 NG5 A 25; R 50 None Internal 2 1 0
Weir Group Dec-17 298 12.5 72.1 59.5 3 A R N A4 R6 N5 A R N 15.5 None External 0 0 0
Whitbread Mar-18 350 15 96* 57 3 A R N A4 R6 N5 A R 20 A R 5 Internal 0 1 1
Wm Morrison Supermarkets Feb-18 400 20 102 61.2 4 A R N CCR A6 R6 N4 CCR5 A R N CCR 20 All 7 External 2 0 0
Wood Group (John) Dec-17 275 5 78.6* 55.5 4 A R N SABE A5 R4 N3 SABE4 A R SABE 5 None Internal 1 0 0
WPP Dec-17 475 20 91 70 3 A R NG A7 R7 NG4 A R 40; N 15 A R 20; N 10 Internal 1 1 1

spencer stuart70
2018 uk spencer stuart board index 72
Spencer Stuart Board Governance Trends is an exclusive source of insight into board governance best practices. Here you will find all of our latest country-specific Board Indexes; numerous articles of value to any board of directors; the latest edition of “Boardroom Best Practice”; as well as “Boards Around the World”, a uniquely visual comparison of global board data and practices. Visit our one-stop online resource for the latest data in board composition, governance practices and director compensation among leading public companies in more than 20 countries.
www.spencerstuart.com/research- and- insight/board- indexes
Visit spencerstuart.com for more information.
Board Governance Trends: A Global View
Amsterdam AtlantaBangaloreBarcelona BeijingBogotaBostonBrussels Buenos AiresCalgaryChicagoCopenhagenDallasDubaiDüsseldorfFrankfurt Geneva Hong KongHoustonIstanbulJohannesburgLimaLondon Los AngelesMadrid Melbourne Mexico CityMiamiMilan Minneapolis/St. PaulMontrealMoscowMumbai Munich New DelhiNew YorkOrange CountyParis PhiladelphiaPrague RomeSan FranciscoSantiagoSao PauloSeattleShanghai Silicon ValleySingaporeStamfordStockholmSydneyTokyoTorontoVienna WarsawWashington, D.C.Zurich