Embed Size (px)
Citation preview
SpeedCast International Limited
ACN 600 699 241
Preliminary Financial Report and Appendix 4E for the
Year Ended 31 December 2017
For
per
sona
l use
onl
y
SpeedCast International Limited
Preliminary Financial Report and Appendix 4E for the Year Ended 31 December 2017
Contents
Results for Announcement to the Market 1 Consolidated Statement of Profit or Loss and Other Comprehensive Income 5 Consolidated Statement of Financial Position 6 Consolidated Statement of Changes in Equity 7 Consolidated Statement of Cash Flows 8 Notes to the Preliminary Financial Report 9 Corporate Information 19
For
per
sona
l use
onl
y
SpeedCast International Limited
Preliminary Financial Report and Appendix 4E for the Year Ended 31 December 2017
1
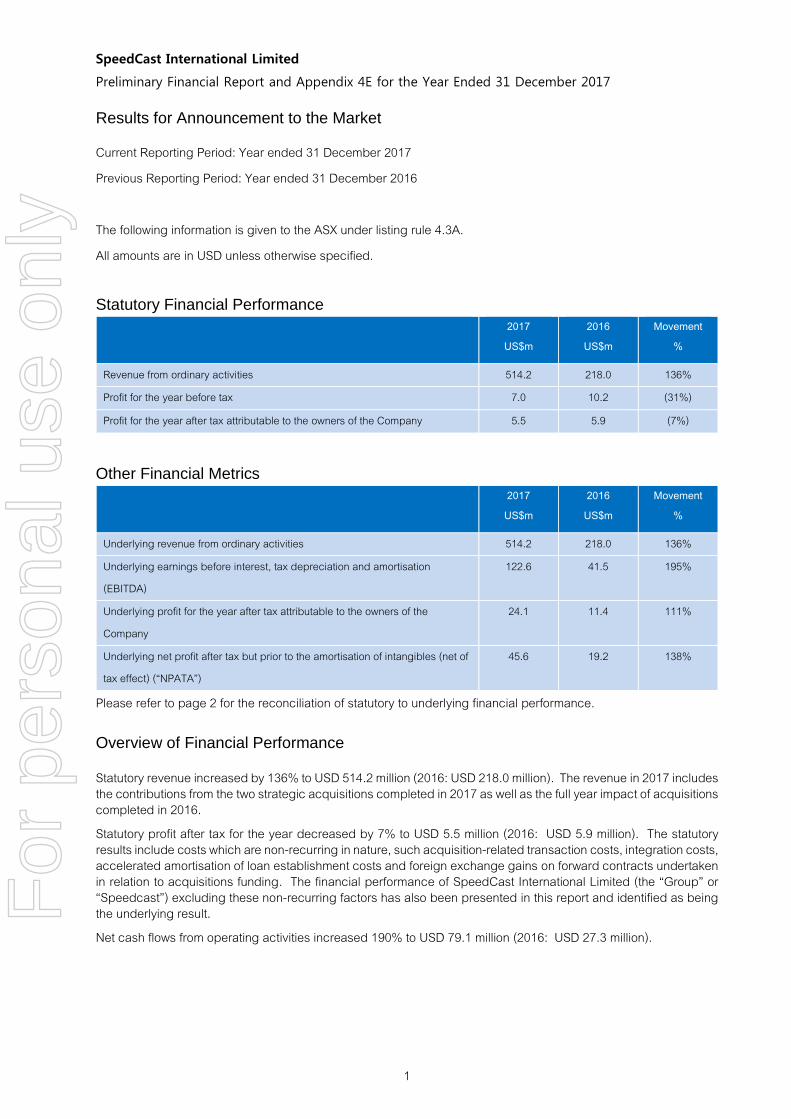
Results for Announcement to the Market
Current Reporting Period: Year ended 31 December 2017 Previous Reporting Period: Year ended 31 December 2016 The following information is given to the ASX under listing rule 4.3A. All amounts are in USD unless otherwise specified. Statutory Financial Performance
2017 US$m
2016 US$m
Movement %
Revenue from ordinary activities 514.2 218.0 136% Profit for the year before tax 7.0 10.2 (31%)
Profit for the year after tax attributable to the owners of the Company 5.5 5.9 (7%)
Other Financial Metrics
2017 US$m
2016 US$m
Movement %
Underlying revenue from ordinary activities 514.2 218.0 136% Underlying earnings before interest, tax depreciation and amortisation (EBITDA)
122.6 41.5 195%
Underlying profit for the year after tax attributable to the owners of the Company
24.1 11.4 111%
Underlying net profit after tax but prior to the amortisation of intangibles (net of tax effect) (“NPATA”)
45.6 19.2 138%
Please refer to page 2 for the reconciliation of statutory to underlying financial performance.
Overview of Financial Performance Statutory revenue increased by 136% to USD 514.2 million (2016: USD 218.0 million). The revenue in 2017 includes the contributions from the two strategic acquisitions completed in 2017 as well as the full year impact of acquisitions completed in 2016. Statutory profit after tax for the year decreased by 7% to USD 5.5 million (2016: USD 5.9 million). The statutory results include costs which are non-recurring in nature, such acquisition-related transaction costs, integration costs, accelerated amortisation of loan establishment costs and foreign exchange gains on forward contracts undertaken in relation to acquisitions funding. The financial performance of SpeedCast International Limited (the “Group” or “Speedcast”) excluding these non-recurring factors has also been presented in this report and identified as being the underlying result. Net cash flows from operating activities increased 190% to USD 79.1 million (2016: USD 27.3 million).
For
per
sona
l use
onl
y
SpeedCast International Limited
Preliminary Financial Report and Appendix 4E for the Year Ended 31 December 2017
2
Results for Announcement to the Market (Continued)
Statutory to Underlying Reconciliation
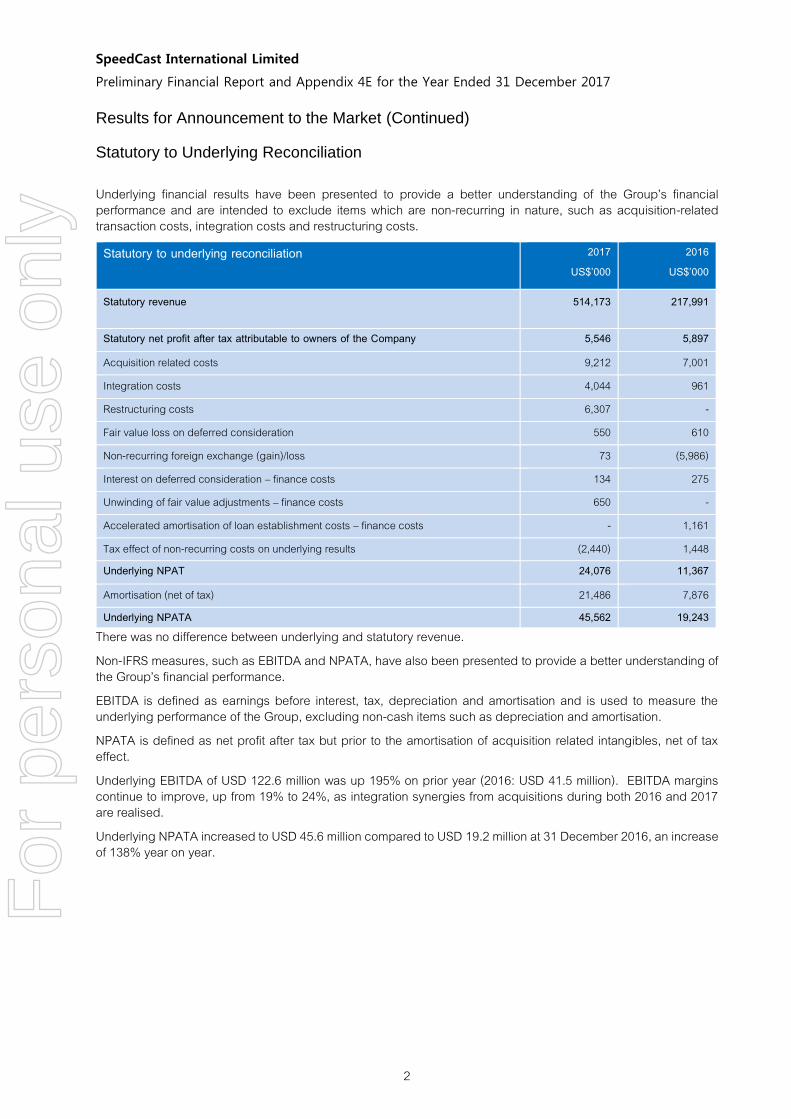
Underlying financial results have been presented to provide a better understanding of the Group’s financial performance and are intended to exclude items which are non-recurring in nature, such as acquisition-related transaction costs, integration costs and restructuring costs.
Statutory to underlying reconciliation 2017 US$’000
2016 US$’000
Statutory revenue 514,173 217,991
Statutory net profit after tax attributable to owners of the Company 5,546 5,897
Acquisition related costs 9,212 7,001
Integration costs 4,044 961
Restructuring costs 6,307 -
Fair value loss on deferred consideration 550 610
Non-recurring foreign exchange (gain)/loss 73 (5,986)
Interest on deferred consideration – finance costs 134 275
Unwinding of fair value adjustments – finance costs 650 -
Accelerated amortisation of loan establishment costs – finance costs - 1,161
Tax effect of non-recurring costs on underlying results (2,440) 1,448 Underlying NPAT 24,076 11,367
Amortisation (net of tax) 21,486 7,876 Underlying NPATA 45,562 19,243
There was no difference between underlying and statutory revenue. Non-IFRS measures, such as EBITDA and NPATA, have also been presented to provide a better understanding of the Group’s financial performance. EBITDA is defined as earnings before interest, tax, depreciation and amortisation and is used to measure the underlying performance of the Group, excluding non-cash items such as depreciation and amortisation. NPATA is defined as net profit after tax but prior to the amortisation of acquisition related intangibles, net of tax effect. Underlying EBITDA of USD 122.6 million was up 195% on prior year (2016: USD 41.5 million). EBITDA margins continue to improve, up from 19% to 24%, as integration synergies from acquisitions during both 2016 and 2017 are realised. Underlying NPATA increased to USD 45.6 million compared to USD 19.2 million at 31 December 2016, an increase of 138% year on year. F
or p
erso
nal u
se o
nly
SpeedCast International Limited
Preliminary Financial Report and Appendix 4E for the Year Ended 31 December 2017
3
Results for Announcement to the Market (continued)
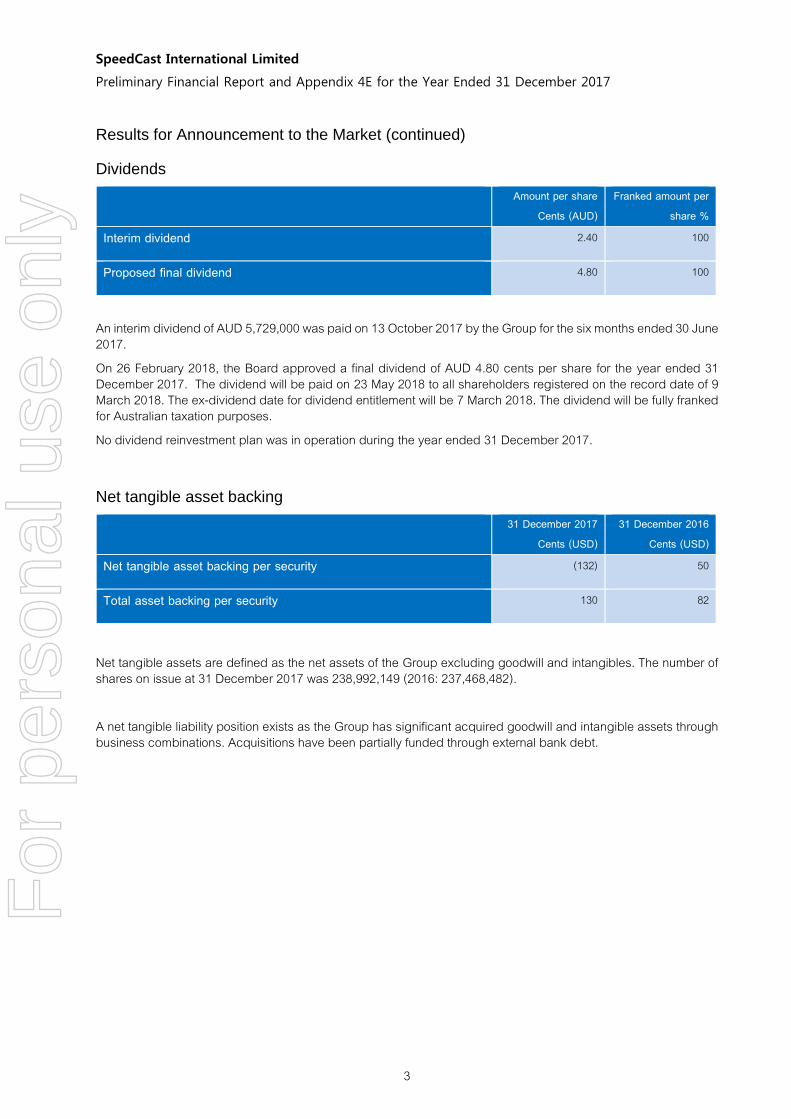
Dividends
Amount per share Cents (AUD)
Franked amount per share %
Interim dividend 2.40 100
Proposed final dividend 4.80 100
An interim dividend of AUD 5,729,000 was paid on 13 October 2017 by the Group for the six months ended 30 June 2017. On 26 February 2018, the Board approved a final dividend of AUD 4.80 cents per share for the year ended 31 December 2017. The dividend will be paid on 23 May 2018 to all shareholders registered on the record date of 9 March 2018. The ex-dividend date for dividend entitlement will be 7 March 2018. The dividend will be fully franked for Australian taxation purposes. No dividend reinvestment plan was in operation during the year ended 31 December 2017.
Net tangible asset backing
31 December 2017 Cents (USD)
31 December 2016 Cents (USD)
Net tangible asset backing per security (132) 50
Total asset backing per security 130 82
Net tangible assets are defined as the net assets of the Group excluding goodwill and intangibles. The number of shares on issue at 31 December 2017 was 238,992,149 (2016: 237,468,482). A net tangible liability position exists as the Group has significant acquired goodwill and intangible assets through business combinations. Acquisitions have been partially funded through external bank debt.
For
per
sona
l use
onl
y
SpeedCast International Limited
Preliminary Financial Report and Appendix 4E for the Year Ended 31 December 2017
4
Results for Announcement to the Market (continued)
Details of entities where control has been gained or lost during the year
The Group completed two significant acquisitions in 2017: - The acquisition of Harris CapRock, a leading provider of communications networks for remote and harsh
environments, primarily in the maritime and energy markets, was completed on 1 January 2017. The acquisition funds were in escrow as at 31 December 2016.
- The acquisition of 100% of the share capital of UltiSat Inc., a provider of satellite communication predominantly to the government sector, was completed on 1 November 2017.
This information should be read in conjunction with the Annual Financial Report of SpeedCast International Limited and its controlled entities and any public announcements made in the period by SpeedCast International Limited in accordance with the continuous disclosure requirements of the Corporations Act 2001 and Listing Rules.
Audit Report
This preliminary financial report is based on the financial statements which are in the process of being audited.
For
per
sona
l use
onl
y
SpeedCast International Limited
Preliminary Financial Report and Appendix 4E for the Year Ended 31 December 2017
5
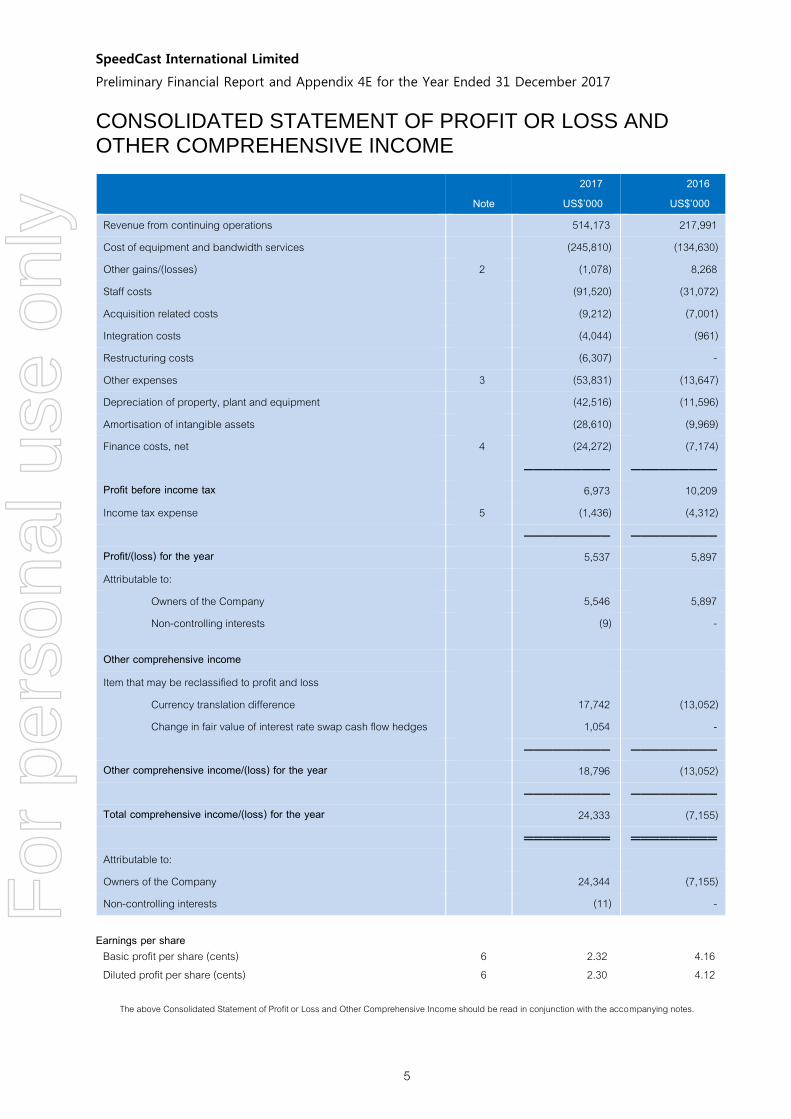
CONSOLIDATED STATEMENT OF PROFIT OR LOSS AND OTHER COMPREHENSIVE INCOME
Note 2017
US$’000 2016
US$’000 Revenue from continuing operations 514,173 217,991 Cost of equipment and bandwidth services (245,810) (134,630) Other gains/(losses) 2 (1,078) 8,268 Staff costs (91,520) (31,072) Acquisition related costs (9,212) (7,001) Integration costs (4,044) (961) Restructuring costs (6,307) - Other expenses 3 (53,831) (13,647) Depreciation of property, plant and equipment (42,516) (11,596) Amortisation of intangible assets (28,610) (9,969) Finance costs, net 4 (24,272) (7,174) ───────── ───────── Profit before income tax 6,973 10,209 Income tax expense 5 (1,436) (4,312) ───────── ───────── Profit/(loss) for the year 5,537 5,897 Attributable to:
Owners of the Company 5,546 5,897 Non-controlling interests (9) -
Other comprehensive income Item that may be reclassified to profit and loss
Currency translation difference 17,742 (13,052) Change in fair value of interest rate swap cash flow hedges 1,054 -
───────── ───────── Other comprehensive income/(loss) for the year 18,796 (13,052) ───────── ───────── Total comprehensive income/(loss) for the year 24,333 (7,155) ═════════ ═════════ Attributable to: Owners of the Company 24,344 (7,155) Non-controlling interests (11) -
Earnings per share Basic profit per share (cents) 6 2.32 4.16 Diluted profit per share (cents) 6 2.30 4.12
The above Consolidated Statement of Profit or Loss and Other Comprehensive Income should be read in conjunction with the accompanying notes.
For
per
sona
l use
onl
y
SpeedCast International Limited
Preliminary Financial Report and Appendix 4E for the Year Ended 31 December 2017
6
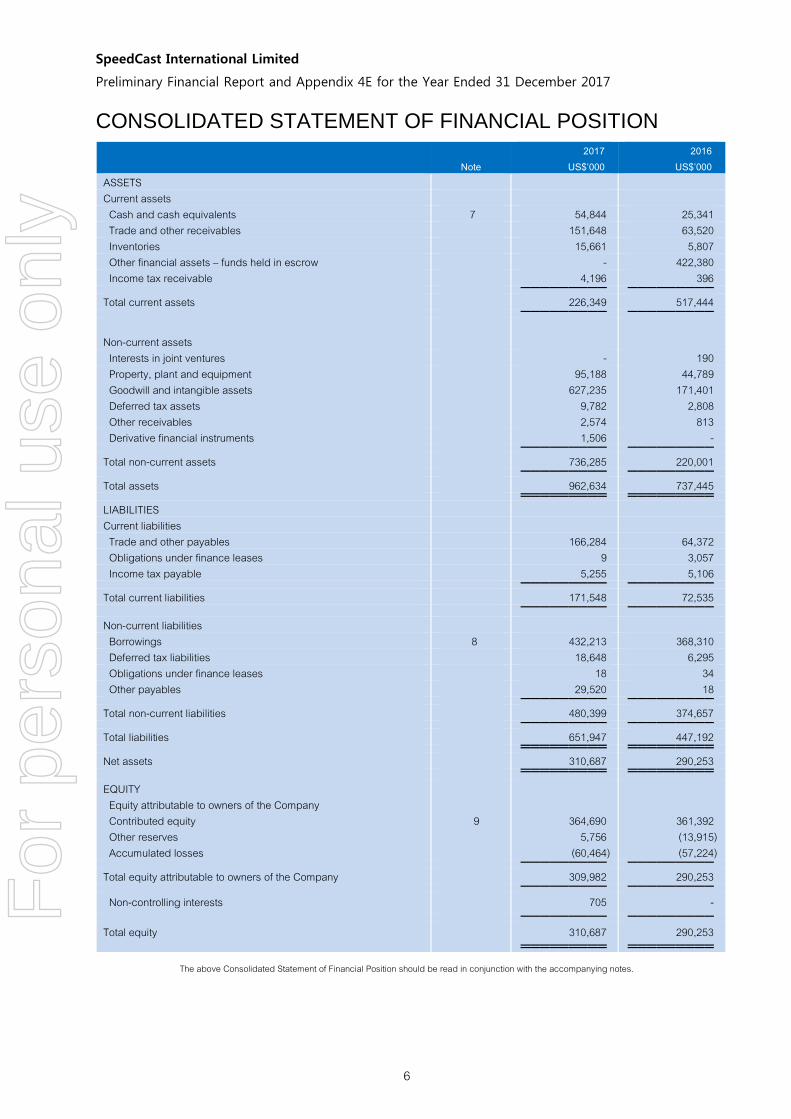
CONSOLIDATED STATEMENT OF FINANCIAL POSITION
Note 2017
US$’000 2016
US$’000 ASSETS Current assets Cash and cash equivalents 7 54,844 25,341 Trade and other receivables 151,648 63,520 Inventories 15,661 5,807 Other financial assets – funds held in escrow - 422,380 Income tax receivable 4,196 396 ───────── ───────── Total current assets 226,349 517,444 ───────── ───────── Non-current assets
Interests in joint ventures - 190 Property, plant and equipment 95,188 44,789 Goodwill and intangible assets 627,235 171,401 Deferred tax assets 9,782 2,808 Other receivables 2,574 813 Derivative financial instruments 1,506 - ───────── ───────── Total non-current assets 736,285 220,001 ───────── ───────── Total assets 962,634 737,445 ═════════ ═════════ LIABILITIES Current liabilities Trade and other payables 166,284 64,372 Obligations under finance leases 9 3,057 Income tax payable 5,255 5,106 ───────── ───────── Total current liabilities 171,548 72,535 ───────── ───────── Non-current liabilities Borrowings 8 432,213 368,310 Deferred tax liabilities 18,648 6,295 Obligations under finance leases 18 34 Other payables 29,520 18 ───────── ───────── Total non-current liabilities 480,399 374,657 ───────── ───────── Total liabilities 651,947 447,192 ═════════ ═════════ Net assets 310,687 290,253 ═════════ ═════════ EQUITY Equity attributable to owners of the Company Contributed equity 9 364,690 361,392 Other reserves 5,756 (13,915) Accumulated losses (60,464) (57,224) ───────── ───────── Total equity attributable to owners of the Company 309,982 290,253 ───────── ───────── Non-controlling interests 705 - ───────── ───────── Total equity 310,687 290,253 ═════════ ═════════
The above Consolidated Statement of Financial Position should be read in conjunction with the accompanying notes.
For
per
sona
l use
onl
y
SpeedCast International Limited
Preliminary Financial Report and Appendix 4E for the Year Ended 31 December 2017
7
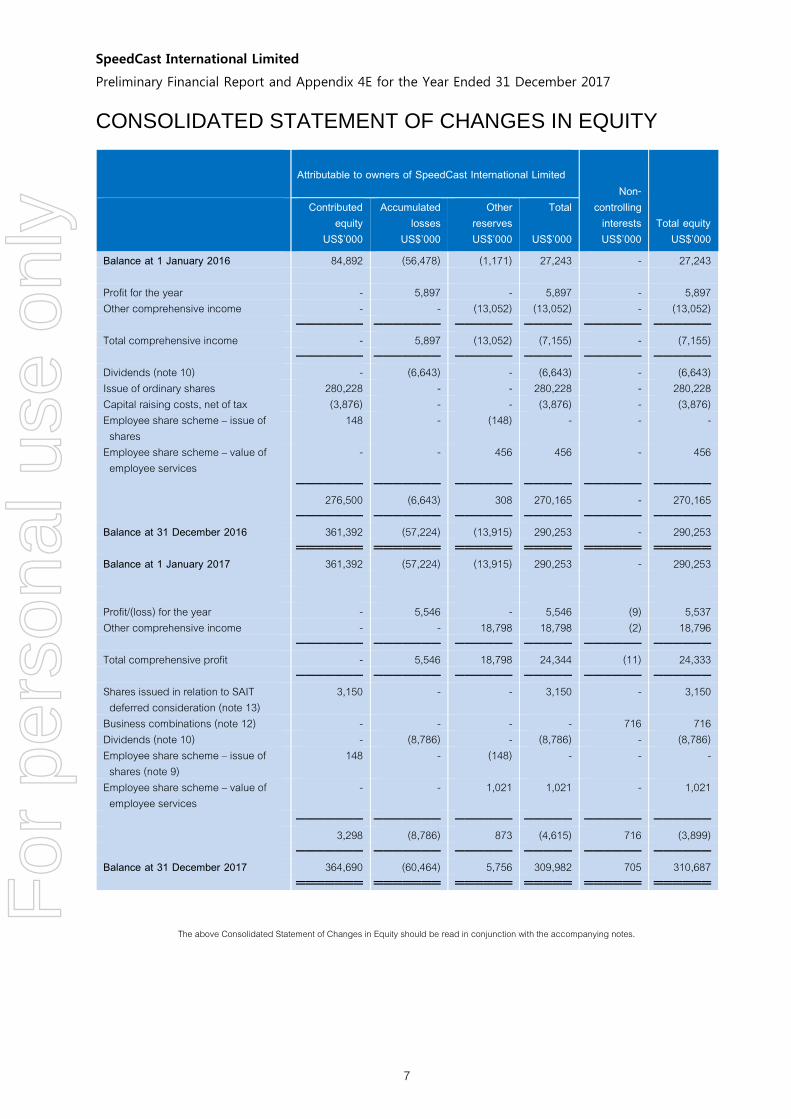
CONSOLIDATED STATEMENT OF CHANGES IN EQUITY
Attributable to owners of SpeedCast International Limited
Non-controlling
interests Total equity Contributed
equity Accumulated
losses Other
reserves Total
US$’000 US$’000 US$’000 US$’000 US$’000 US$’000 Balance at 1 January 2016 84,892 (56,478) (1,171) 27,243 - 27,243 Profit for the year - 5,897 - 5,897 - 5,897 Other comprehensive income - - (13,052) (13,052) - (13,052) ─────── ─────── ────── ───── ────── ────── Total comprehensive income - 5,897 (13,052) (7,155) - (7,155) ─────── ─────── ────── ───── ────── ────── Dividends (note 10) - (6,643) - (6,643) - (6,643) Issue of ordinary shares 280,228 - - 280,228 - 280,228 Capital raising costs, net of tax (3,876) - - (3,876) - (3,876) Employee share scheme – issue of
shares 148 - (148) - - -
Employee share scheme – value of employee services
- - 456 456 - 456
─────── ─────── ────── ───── ────── ────── 276,500 (6,643) 308 270,165 - 270,165 ─────── ─────── ────── ───── ────── ────── Balance at 31 December 2016 361,392 (57,224) (13,915) 290,253 - 290,253 ═══════ ═══════ ══════ ═════ ══════ ══════ Balance at 1 January 2017 361,392 (57,224) (13,915) 290,253 - 290,253 Profit/(loss) for the year - 5,546 - 5,546 (9) 5,537 Other comprehensive income - - 18,798 18,798 (2) 18,796 ─────── ─────── ────── ───── ────── ────── Total comprehensive profit - 5,546 18,798 24,344 (11) 24,333 ─────── ─────── ────── ───── ────── ────── Shares issued in relation to SAIT
deferred consideration (note 13) 3,150 - - 3,150 - 3,150
Business combinations (note 12) - - - - 716 716 Dividends (note 10) - (8,786) - (8,786) - (8,786) Employee share scheme – issue of
shares (note 9) 148 - (148) - - -
Employee share scheme – value of employee services
- - 1,021 1,021 - 1,021
─────── ─────── ────── ───── ────── ────── 3,298 (8,786) 873 (4,615) 716 (3,899) ─────── ─────── ────── ───── ────── ────── Balance at 31 December 2017 364,690 (60,464) 5,756 309,982 705 310,687 ═══════ ═══════ ══════ ═════ ══════ ══════
The above Consolidated Statement of Changes in Equity should be read in conjunction with the accompanying notes.
For
per
sona
l use
onl
y
SpeedCast International Limited
Preliminary Financial Report and Appendix 4E for the Year Ended 31 December 2017
8
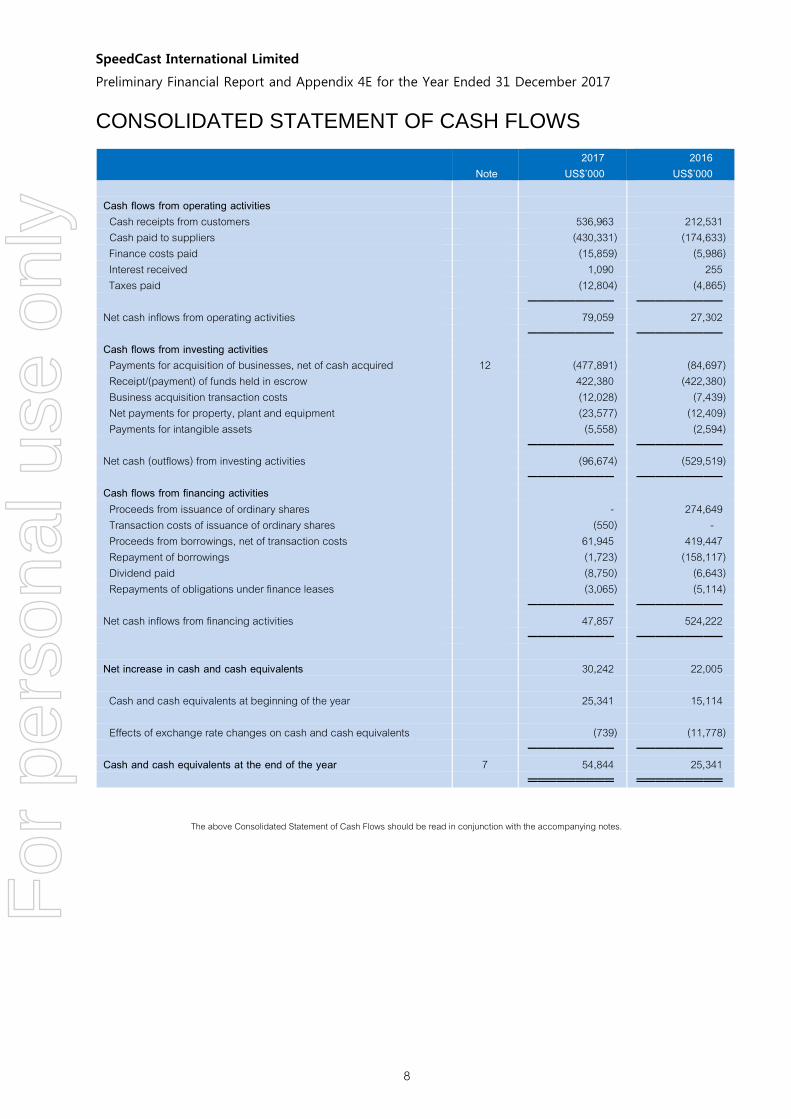
CONSOLIDATED STATEMENT OF CASH FLOWS
Note 2017
US$’000 2016
US$’000 Cash flows from operating activities
Cash receipts from customers 536,963 212,531 Cash paid to suppliers (430,331) (174,633)
Finance costs paid (15,859) (5,986) Interest received 1,090 255 Taxes paid (12,804) (4,865) ───────── ───────── Net cash inflows from operating activities 79,059 27,302 ───────── ───────── Cash flows from investing activities
Payments for acquisition of businesses, net of cash acquired 12 (477,891) (84,697) Receipt/(payment) of funds held in escrow 422,380 (422,380) Business acquisition transaction costs (12,028) (7,439) Net payments for property, plant and equipment (23,577) (12,409) Payments for intangible assets (5,558) (2,594)
───────── ───────── Net cash (outflows) from investing activities (96,674) (529,519) ───────── ───────── Cash flows from financing activities
Proceeds from issuance of ordinary shares - 274,649 Transaction costs of issuance of ordinary shares (550) - Proceeds from borrowings, net of transaction costs 61,945 419,447 Repayment of borrowings (1,723) (158,117) Dividend paid (8,750) (6,643) Repayments of obligations under finance leases (3,065) (5,114) ───────── ─────────
Net cash inflows from financing activities 47,857 524,222 ───────── ───────── Net increase in cash and cash equivalents 30,242 22,005 Cash and cash equivalents at beginning of the year 25,341 15,114
Effects of exchange rate changes on cash and cash equivalents (739) (11,778) ───────── ───────── Cash and cash equivalents at the end of the year 7 54,844 25,341
═════════ ═════════
The above Consolidated Statement of Cash Flows should be read in conjunction with the accompanying notes.
For
per
sona
l use
onl
y
SpeedCast International Limited
Preliminary Financial Report and Appendix 4E for the Year Ended 31 December 2017
9
Notes to the Preliminary Financial Report
1. Accounting policies
This report has been prepared in accordance with Australian Accounting Standards and Interpretations issued by the Australian Accounting Standards Board and the Corporations Act 2001. It has been prepared under the historical cost convention. The accounting policies adopted are consistent with those of the previous financial year.
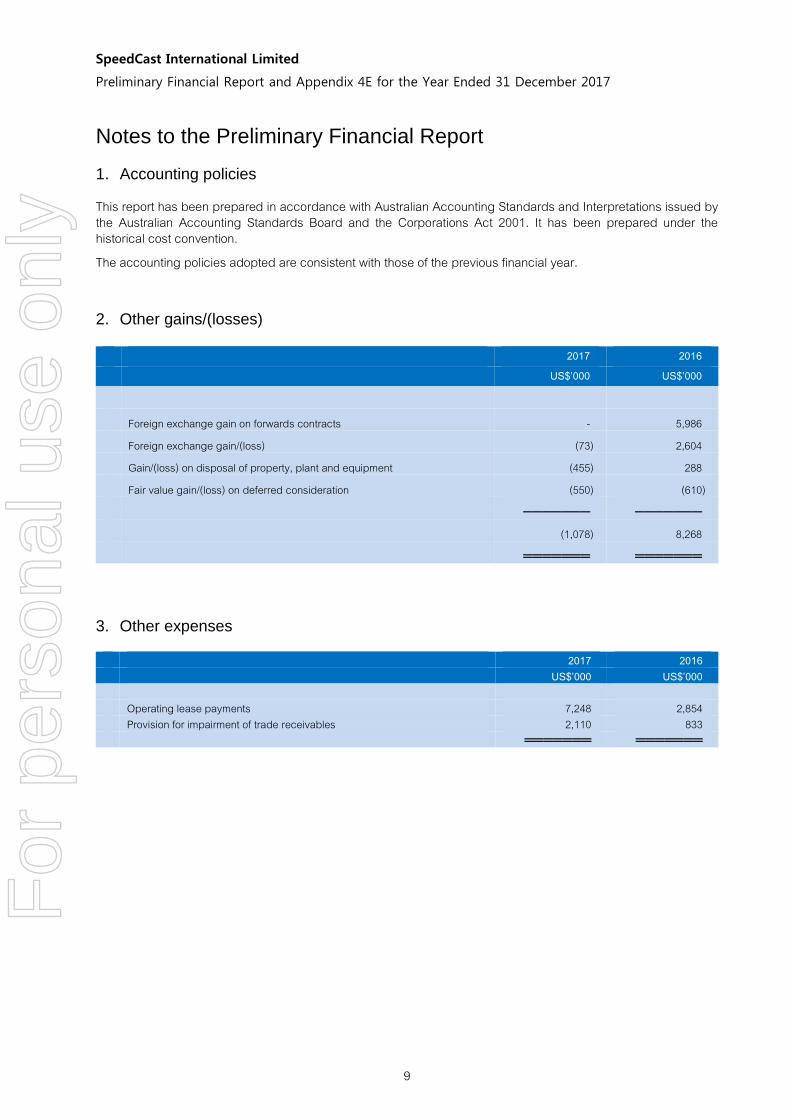
2. Other gains/(losses)
2017 2016 US$’000 US$’000 Foreign exchange gain on forwards contracts - 5,986 Foreign exchange gain/(loss) (73) 2,604 Gain/(loss) on disposal of property, plant and equipment (455) 288 Fair value gain/(loss) on deferred consideration (550) (610) ─────── ─────── (1,078) 8,268 ═══════ ═══════
3. Other expenses
2017 2016 US$’000 US$’000 Operating lease payments 7,248 2,854 Provision for impairment of trade receivables 2,110 833 ═══════ ═══════
For
per
sona
l use
onl
y
SpeedCast International Limited
Preliminary Financial Report and Appendix 4E for the Year Ended 31 December 2017
10
Notes to the Preliminary Financial Report (continued)
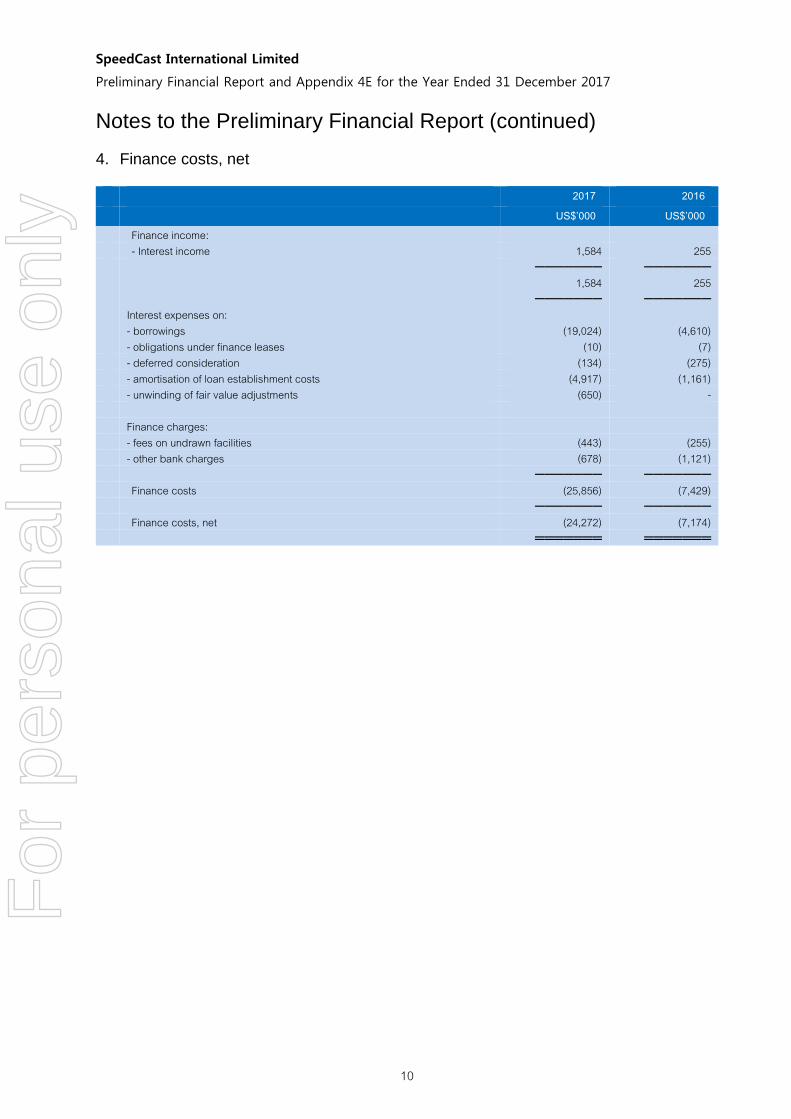
4. Finance costs, net
2017 2016 US$’000 US$’000 Finance income: - Interest income 1,584 255 ─────── ─────── 1,584 255 ─────── ─────── Interest expenses on: - borrowings (19,024) (4,610) - obligations under finance leases (10) (7) - deferred consideration (134) (275) - amortisation of loan establishment costs (4,917) (1,161) - unwinding of fair value adjustments (650) - Finance charges: - fees on undrawn facilities (443) (255) - other bank charges (678) (1,121) ─────── ─────── Finance costs (25,856) (7,429) ─────── ─────── Finance costs, net (24,272) (7,174) ═══════ ═══════
For
per
sona
l use
onl
y
SpeedCast International Limited
Preliminary Financial Report and Appendix 4E for the Year Ended 31 December 2017
11
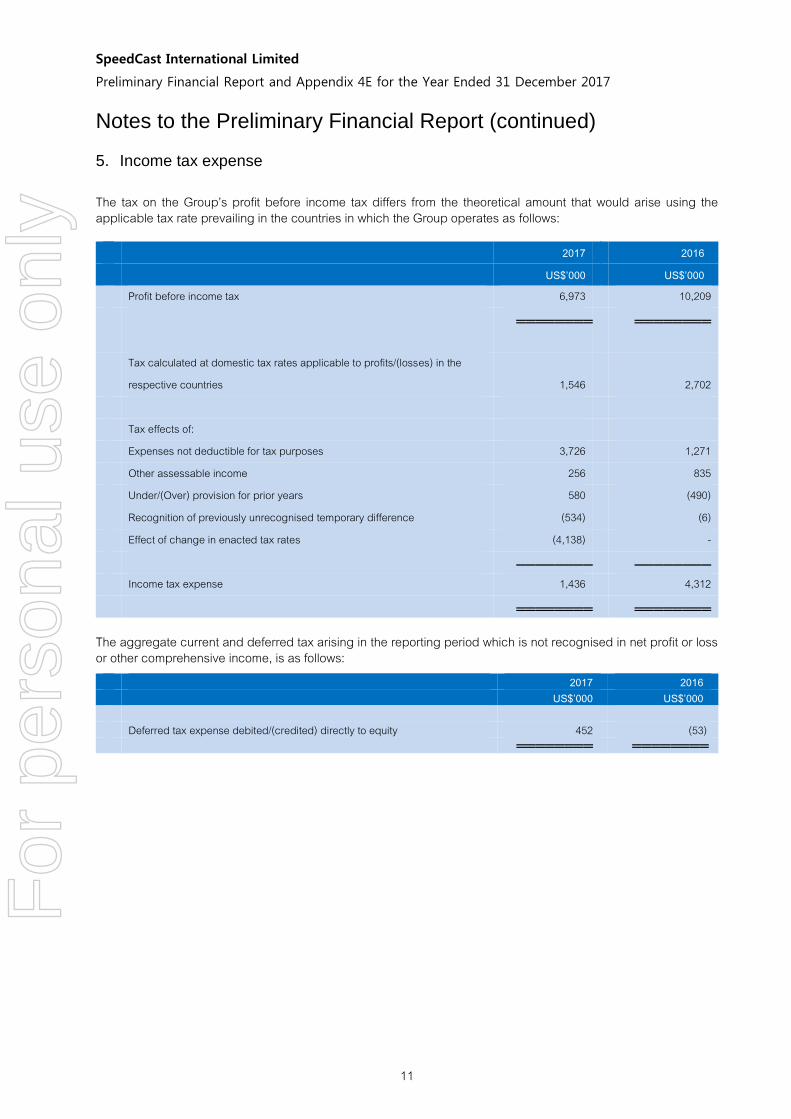
Notes to the Preliminary Financial Report (continued) 5. Income tax expense
The tax on the Group’s profit before income tax differs from the theoretical amount that would arise using the applicable tax rate prevailing in the countries in which the Group operates as follows:
2017 2016 US$’000 US$’000 Profit before income tax 6,973 10,209 ════════ ════════
Tax calculated at domestic tax rates applicable to profits/(losses) in the respective countries 1,546
2,702
Tax effects of: Expenses not deductible for tax purposes 3,726 1,271 Other assessable income 256 835 Under/(Over) provision for prior years 580 (490) Recognition of previously unrecognised temporary difference (534) (6) Effect of change in enacted tax rates (4,138) - ──────── ──────── Income tax expense 1,436 4,312 ════════ ════════
The aggregate current and deferred tax arising in the reporting period which is not recognised in net profit or loss or other comprehensive income, is as follows:
2017 2016 US$’000 US$’000 Deferred tax expense debited/(credited) directly to equity 452 (53) ════════ ════════
For
per
sona
l use
onl
y
SpeedCast International Limited
Preliminary Financial Report and Appendix 4E for the Year Ended 31 December 2017
12
Notes to the Preliminary Financial Report (continued)
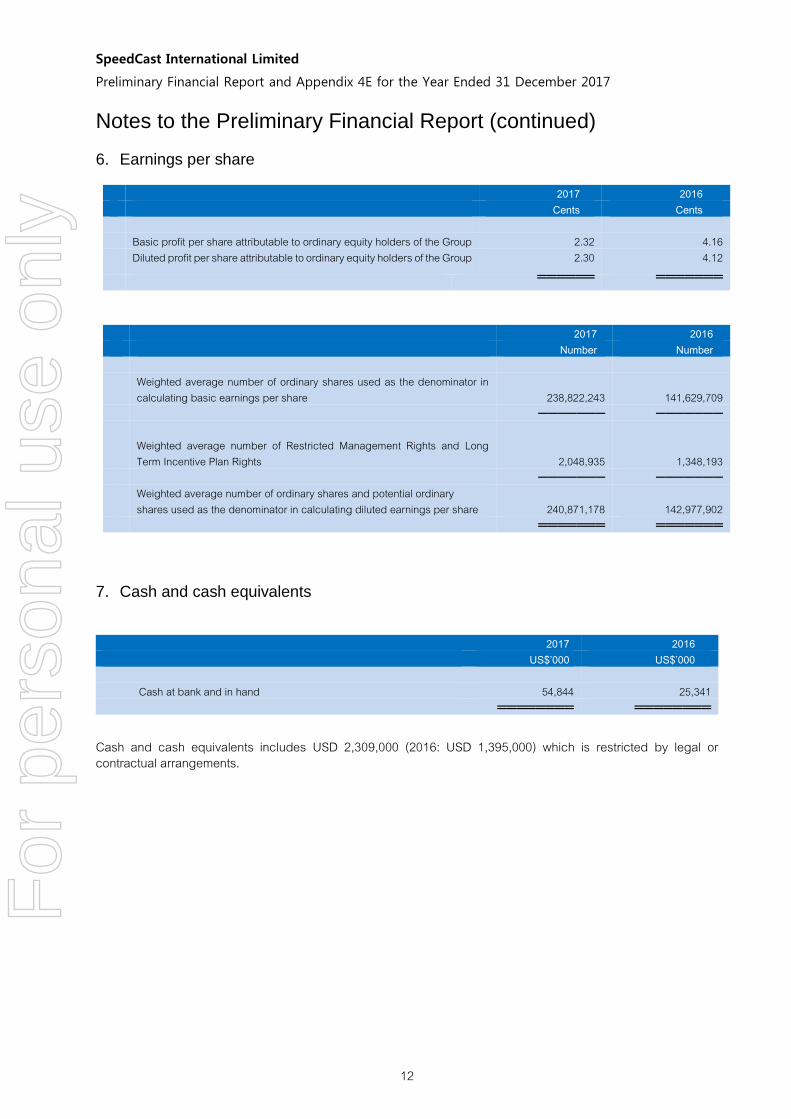
6. Earnings per share
2017 2016 Cents Cents
Basic profit per share attributable to ordinary equity holders of the Group 2.32 4.16 Diluted profit per share attributable to ordinary equity holders of the Group 2.30 4.12
══════ ═══════
2017 2016 Number Number
Weighted average number of ordinary shares used as the denominator in
calculating basic earnings per share 238,822,243 141,629,709 ─────── ───────
Weighted average number of Restricted Management Rights and Long Term Incentive Plan Rights 2,048,935 1,348,193
─────── ─────── Weighted average number of ordinary shares and potential ordinary
shares used as the denominator in calculating diluted earnings per share 240,871,178 142,977,902 ═══════ ═══════
7. Cash and cash equivalents
2017 2016 US$’000 US$’000
Cash at bank and in hand 54,844 25,341 ════════ ════════
Cash and cash equivalents includes USD 2,309,000 (2016: USD 1,395,000) which is restricted by legal or contractual arrangements.
For
per
sona
l use
onl
y
SpeedCast International Limited
Preliminary Financial Report and Appendix 4E for the Year Ended 31 December 2017
13
Notes to the Preliminary Financial Report (continued)
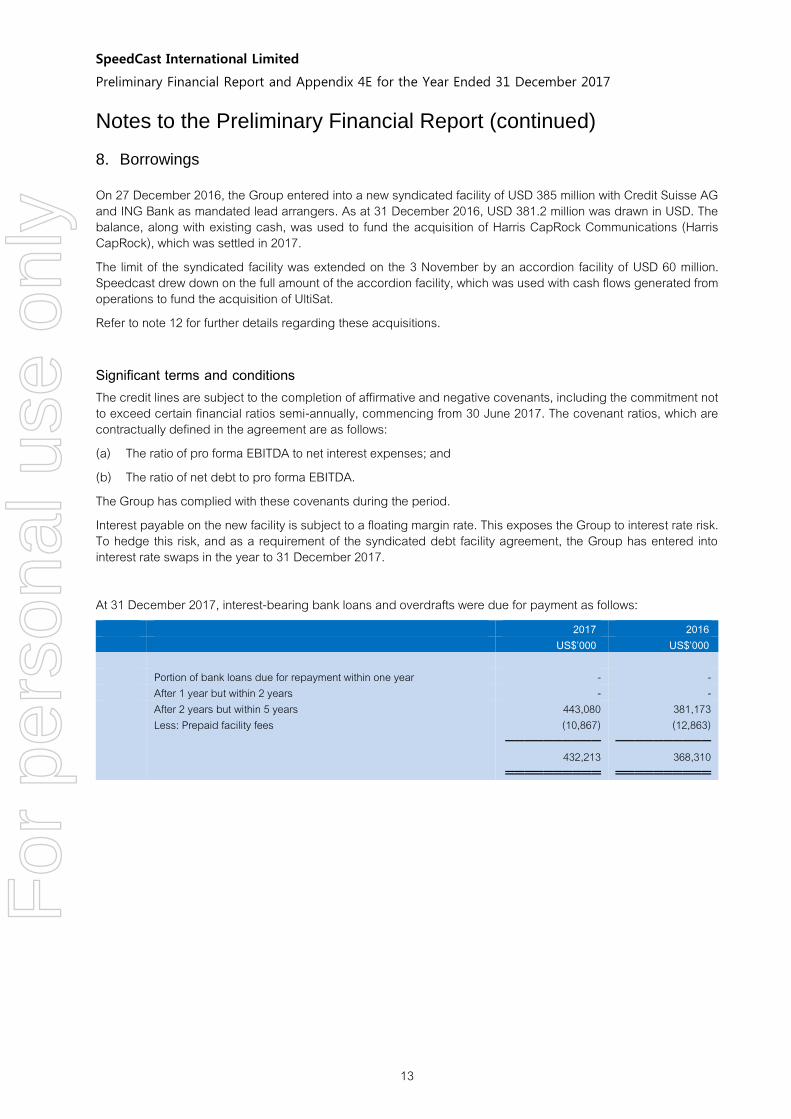
8. Borrowings
On 27 December 2016, the Group entered into a new syndicated facility of USD 385 million with Credit Suisse AG and ING Bank as mandated lead arrangers. As at 31 December 2016, USD 381.2 million was drawn in USD. The balance, along with existing cash, was used to fund the acquisition of Harris CapRock Communications (Harris CapRock), which was settled in 2017. The limit of the syndicated facility was extended on the 3 November by an accordion facility of USD 60 million. Speedcast drew down on the full amount of the accordion facility, which was used with cash flows generated from operations to fund the acquisition of UltiSat. Refer to note 12 for further details regarding these acquisitions.
Significant terms and conditions The credit lines are subject to the completion of affirmative and negative covenants, including the commitment not to exceed certain financial ratios semi-annually, commencing from 30 June 2017. The covenant ratios, which are contractually defined in the agreement are as follows: (a) The ratio of pro forma EBITDA to net interest expenses; and (b) The ratio of net debt to pro forma EBITDA. The Group has complied with these covenants during the period. Interest payable on the new facility is subject to a floating margin rate. This exposes the Group to interest rate risk. To hedge this risk, and as a requirement of the syndicated debt facility agreement, the Group has entered into interest rate swaps in the year to 31 December 2017. At 31 December 2017, interest-bearing bank loans and overdrafts were due for payment as follows:
2017 2016 US$’000 US$’000 Portion of bank loans due for repayment within one year - - After 1 year but within 2 years - - After 2 years but within 5 years 443,080 381,173 Less: Prepaid facility fees (10,867) (12,863) ────────── ────────── 432,213 368,310 ══════════ ══════════
For
per
sona
l use
onl
y
SpeedCast International Limited
Preliminary Financial Report and Appendix 4E for the Year Ended 31 December 2017
14
Notes to the Preliminary Financial Report (continued)
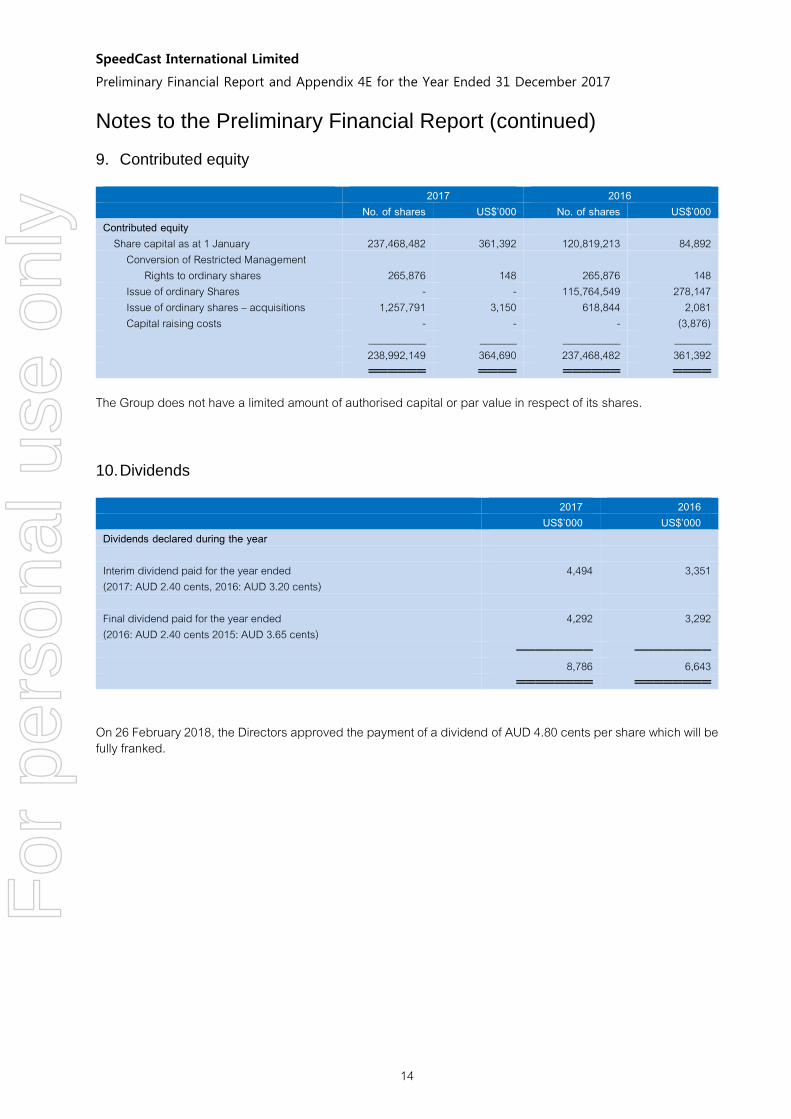
9. Contributed equity
2017 2016 No. of shares US$’000 No. of shares US$’000 Contributed equity
Share capital as at 1 January 237,468,482 361,392 120,819,213 84,892 Conversion of Restricted Management
Rights to ordinary shares 265,876 148 265,876 148 Issue of ordinary Shares - - 115,764,549 278,147 Issue of ordinary shares – acquisitions 1,257,791 3,150 618,844 2,081 Capital raising costs - - - (3,876) ___________ _______ ___________ _______ 238,992,149 364,690 237,468,482 361,392
══════ ════ ══════ ════
The Group does not have a limited amount of authorised capital or par value in respect of its shares.
10. Dividends
2017 2016 US$’000 US$’000 Dividends declared during the year Interim dividend paid for the year ended (2017: AUD 2.40 cents, 2016: AUD 3.20 cents)
4,494 3,351
Final dividend paid for the year ended (2016: AUD 2.40 cents 2015: AUD 3.65 cents)
4,292 3,292
──────── ──────── 8,786 6,643 ════════ ════════
On 26 February 2018, the Directors approved the payment of a dividend of AUD 4.80 cents per share which will be fully franked.
For
per
sona
l use
onl
y
SpeedCast International Limited
Preliminary Financial Report and Appendix 4E for the Year Ended 31 December 2017
15
Notes to the Preliminary Financial Report (continued)
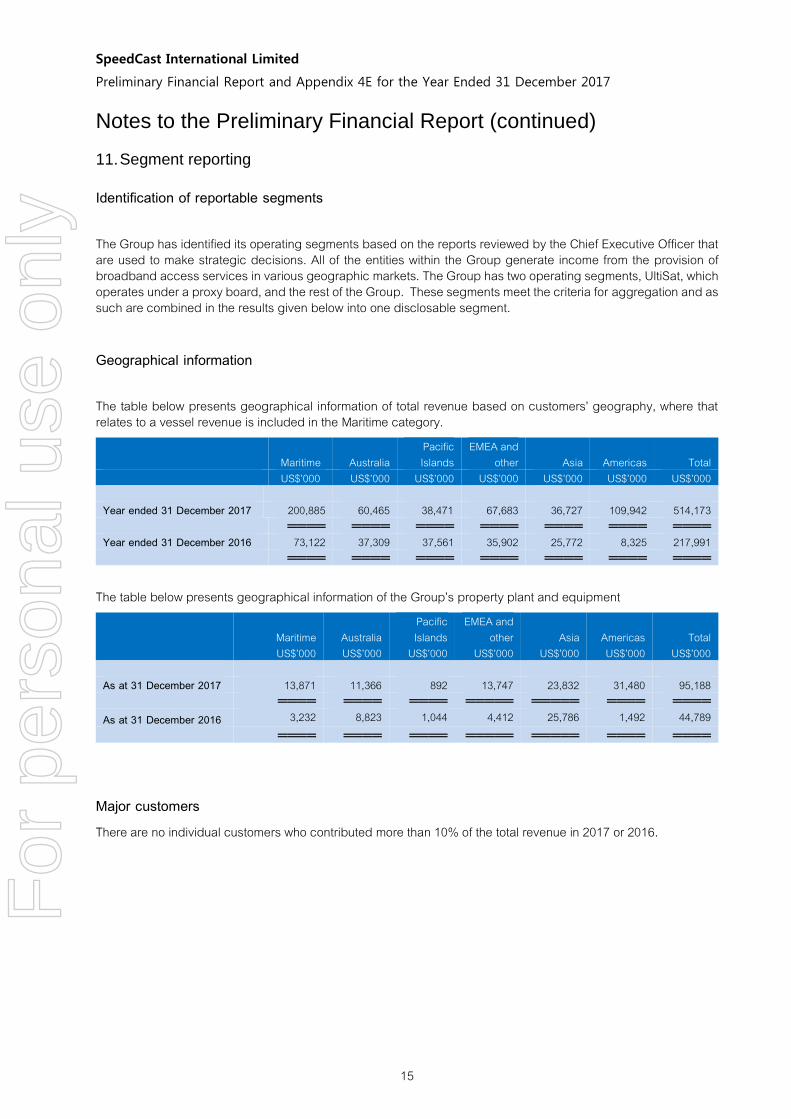
11. Segment reporting
Identification of reportable segments
The Group has identified its operating segments based on the reports reviewed by the Chief Executive Officer that are used to make strategic decisions. All of the entities within the Group generate income from the provision of broadband access services in various geographic markets. The Group has two operating segments, UltiSat, which operates under a proxy board, and the rest of the Group. These segments meet the criteria for aggregation and as such are combined in the results given below into one disclosable segment.
Geographical information
The table below presents geographical information of total revenue based on customers’ geography, where that relates to a vessel revenue is included in the Maritime category.
Maritime Australia Pacific Islands
EMEA and other Asia Americas Total
US$’000 US$’000 US$’000 US$’000 US$’000 US$’000 US$’000 Year ended 31 December 2017 200,885 60,465 38,471 67,683 36,727 109,942 514,173 ════ ════ ════ ════ ════ ════ ════ Year ended 31 December 2016 73,122 37,309 37,561 35,902 25,772 8,325 217,991 ════ ════ ════ ════ ════ ════ ════
The table below presents geographical information of the Group’s property plant and equipment
Maritime US$’000
Australia US$’000
Pacific Islands
US$’000
EMEA and other
US$’000 Asia
US$’000 Americas US$’000
Total US$’000
As at 31 December 2017 13,871 11,366 892 13,747 23,832 31,480 95,188 ════ ════ ════ ═════ ═════ ════ ════ As at 31 December 2016 3,232 8,823 1,044 4,412 25,786 1,492 44,789 ════ ════ ════ ═════ ═════ ════ ════
Major customers There are no individual customers who contributed more than 10% of the total revenue in 2017 or 2016.
For
per
sona
l use
onl
y
SpeedCast International Limited
Preliminary Financial Report and Appendix 4E for the Year Ended 31 December 2017
16
Notes to the Preliminary Financial Report (continued)
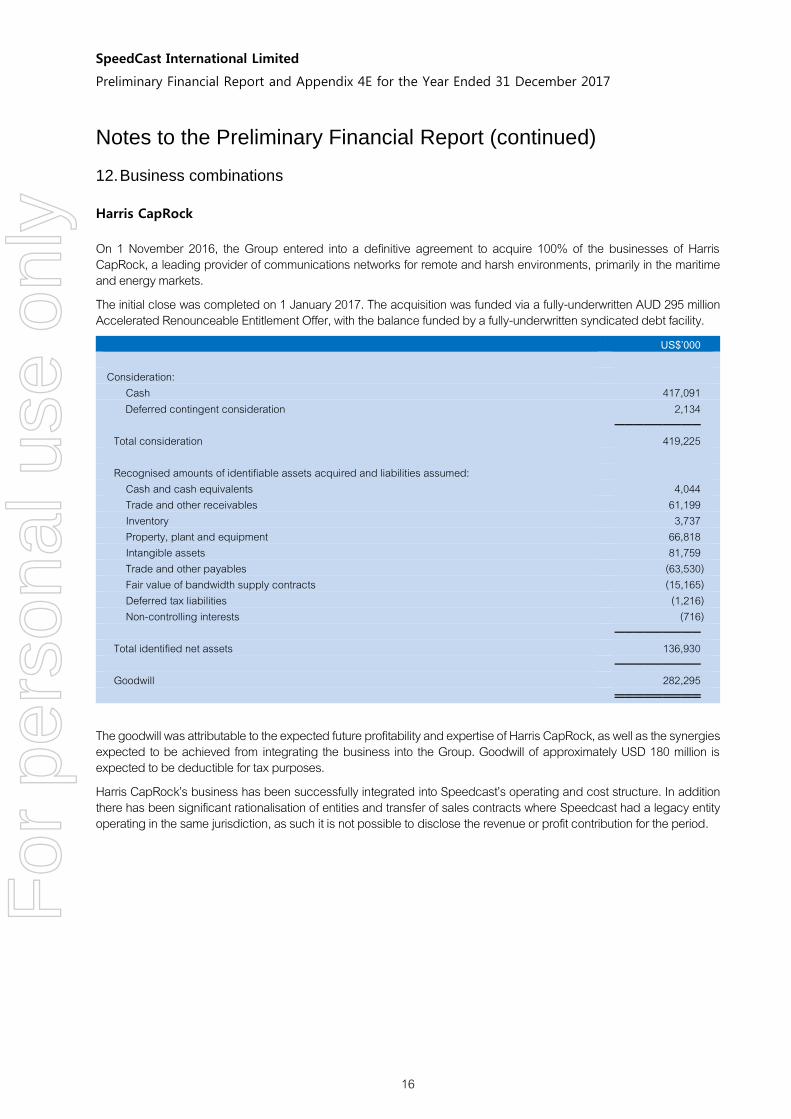
12. Business combinations
Harris CapRock
On 1 November 2016, the Group entered into a definitive agreement to acquire 100% of the businesses of Harris CapRock, a leading provider of communications networks for remote and harsh environments, primarily in the maritime and energy markets. The initial close was completed on 1 January 2017. The acquisition was funded via a fully-underwritten AUD 295 million Accelerated Renounceable Entitlement Offer, with the balance funded by a fully-underwritten syndicated debt facility.
US$’000 Consideration:
Cash 417,091 Deferred contingent consideration 2,134
───────── Total consideration 419,225 Recognised amounts of identifiable assets acquired and liabilities assumed:
Cash and cash equivalents 4,044 Trade and other receivables 61,199 Inventory 3,737 Property, plant and equipment 66,818 Intangible assets 81,759 Trade and other payables (63,530) Fair value of bandwidth supply contracts (15,165) Deferred tax liabilities (1,216) Non-controlling interests (716)
───────── Total identified net assets 136,930 ───────── Goodwill 282,295 ═════════
The goodwill was attributable to the expected future profitability and expertise of Harris CapRock, as well as the synergies expected to be achieved from integrating the business into the Group. Goodwill of approximately USD 180 million is expected to be deductible for tax purposes. Harris CapRock’s business has been successfully integrated into Speedcast’s operating and cost structure. In addition there has been significant rationalisation of entities and transfer of sales contracts where Speedcast had a legacy entity operating in the same jurisdiction, as such it is not possible to disclose the revenue or profit contribution for the period.
For
per
sona
l use
onl
y
SpeedCast International Limited
Preliminary Financial Report and Appendix 4E for the Year Ended 31 December 2017
17
Notes to the Preliminary Financial Report (continued)
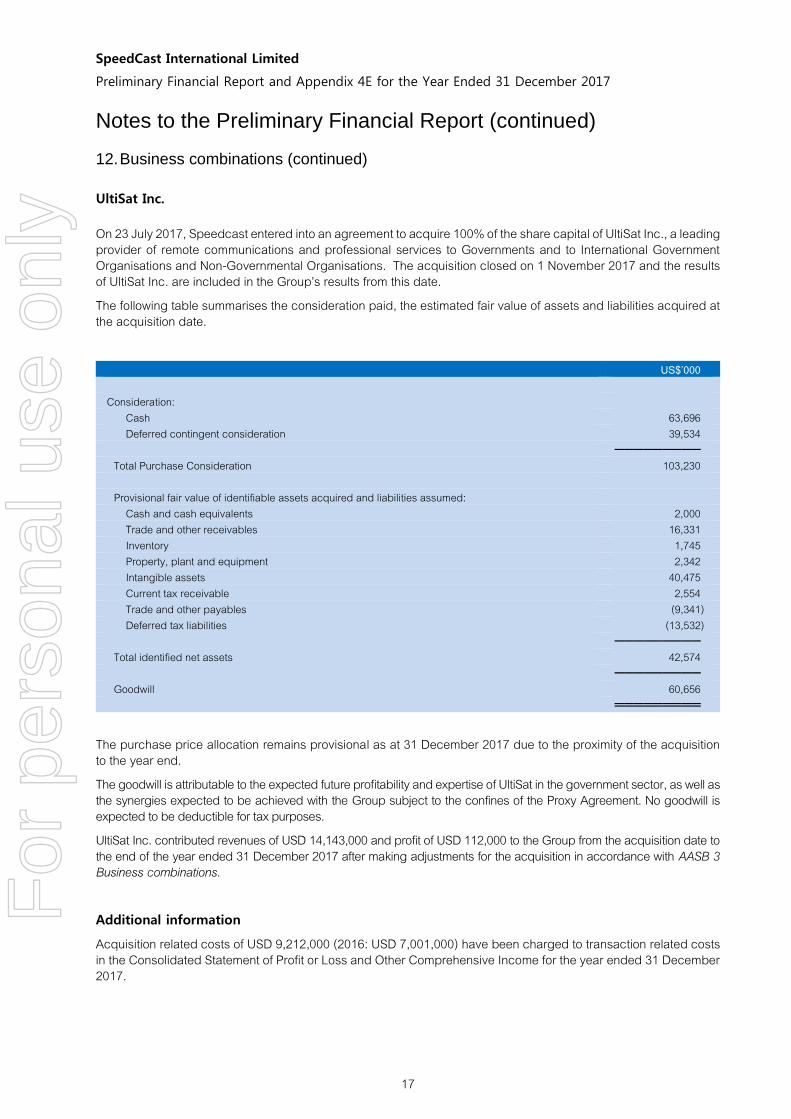
12. Business combinations (continued)
UltiSat Inc.
On 23 July 2017, Speedcast entered into an agreement to acquire 100% of the share capital of UltiSat Inc., a leading provider of remote communications and professional services to Governments and to International Government Organisations and Non-Governmental Organisations. The acquisition closed on 1 November 2017 and the results of UltiSat Inc. are included in the Group’s results from this date. The following table summarises the consideration paid, the estimated fair value of assets and liabilities acquired at the acquisition date.
US$’000 Consideration:
Cash 63,696 Deferred contingent consideration 39,534
───────── Total Purchase Consideration 103,230 Provisional fair value of identifiable assets acquired and liabilities assumed:
Cash and cash equivalents 2,000 Trade and other receivables 16,331 Inventory 1,745 Property, plant and equipment 2,342 Intangible assets 40,475 Current tax receivable 2,554 Trade and other payables (9,341) Deferred tax liabilities (13,532)
───────── Total identified net assets 42,574 ───────── Goodwill 60,656 ═════════
The purchase price allocation remains provisional as at 31 December 2017 due to the proximity of the acquisition to the year end. The goodwill is attributable to the expected future profitability and expertise of UltiSat in the government sector, as well as the synergies expected to be achieved with the Group subject to the confines of the Proxy Agreement. No goodwill is expected to be deductible for tax purposes. UltiSat Inc. contributed revenues of USD 14,143,000 and profit of USD 112,000 to the Group from the acquisition date to the end of the year ended 31 December 2017 after making adjustments for the acquisition in accordance with AASB 3 Business combinations. Additional information
Acquisition related costs of USD 9,212,000 (2016: USD 7,001,000) have been charged to transaction related costs in the Consolidated Statement of Profit or Loss and Other Comprehensive Income for the year ended 31 December 2017.
For
per
sona
l use
onl
y
SpeedCast International Limited
Preliminary Financial Report and Appendix 4E for the Year Ended 31 December 2017
18
Notes to the Preliminary Financial Report (continued)
13. Contingencies
SAIT Communications earn-out On 28 July 2015, the Group acquired 100% of the share capital of SAIT Communications Limited (“SAIT”), a leading supplier of L-band satellite service in the Southern European maritime market. Part of the total consideration was deferred and contingent on the achievement of certain revenue targets in 2016. The final contingent consideration due became payable on 1 January 2017 and 1,257,791 shares to be issued with a market value of USD 3,150,000 on that date were reclassified from a financial liability to equity. The shares have subsequently been issued. Cash of USD 1,500,000 was also payable on achieving the targets of which, USD 1,014,000 has been paid and the balance of USD 486,000 is held as a financial liability.
UltiSat earn-out A short term liability of USD 4,486,000 is held representing working capital adjustments that are expected to be paid subject to the successful recoverability of assets held on the opening balance sheet. Additional potential consideration of up to USD 35,000,000 is payable dependent on the underlying performance of the business. USD 20,000,000 has become payable on the achievement of underlying EBITDA targets for the year to 31 December 2017. These balances are disclosed as current liabilities – other payables A maximum of USD 7,500,000 is payable on achieving revenue targets and a further maximum of USD 7,500,000 is payable on achieving certain gross margin targets in the year to 31 December 2018. An amount of USD 13,879,000 representing the FV of this deferred contingent consideration, is included as non-current liabilities – other payables. Outstanding legal cases arising from acquisition of Harris CapRock The entities acquired as part of the Harris CapRock acquisition were subject to certain legal cases most significantly in relation to employment law in Brazil and Angola. Adequate provision has been included in the financial statements to cover any exposure to the Group that is not subject to indemnity by Harris Corporation. Other than as noted above the Group did not have any other material contingent assets or liabilities as at 31 December 2017.
14. Post balance date events
There have been no material post balance sheet events since 31 December 2017.
For
per
sona
l use
onl
y
SpeedCast International Limited
Preliminary Financial Report and Appendix 4E for the Year Ended 31 December 2017
19
Corporate Information
Directors
Mr. John Angus Mackay (Chairman) Mr. Pierre-Jean Joseph Andre Beylier Mr. Michael Stuart Berk Mr. Grant Scott Ferguson Mr. Peter Edward Jackson Mr. Michael Malone Mr. Edward Francis Sippel
Company Secretary
Mr. Andrew Metcalfe
Registered Office
Suite 4F, 12 Lord Street Botany, NSW, Australia, 2019
Internet : http://www.speedcast.com/
Share Registry
Link Market Services Limited Tower 4, 727 Collins Street Docklands, VIC 3008 Internet : www.linkmarketservices.com.au Email : [email protected] Telephone : +61 1300 554 474 SpeedCast International Limited shares are listed on the Australian Securities Exchange (ASX) under the ASX code SDA.
For
per
sona
l use
onl
y