Embed Size (px)
Citation preview
SPEED AS A RISK FACTOR IN FATAL RUN-OFF ROAD
CRASHES
Gary A. DavisMinnesota Traffic Observatory
Dept. of Civil EngineeringUniversity of Minnesota

Acknowledgements
Graduate AssistantsSujay DavuluriJianping Pei
Data ProvisionDon Schmaltzbauer, Minnesota State PatrolDan Brannon, Minnesota DOT
Financial SupportBureau of Transportation StatisticsITS Institute, Univ. of Minnesota
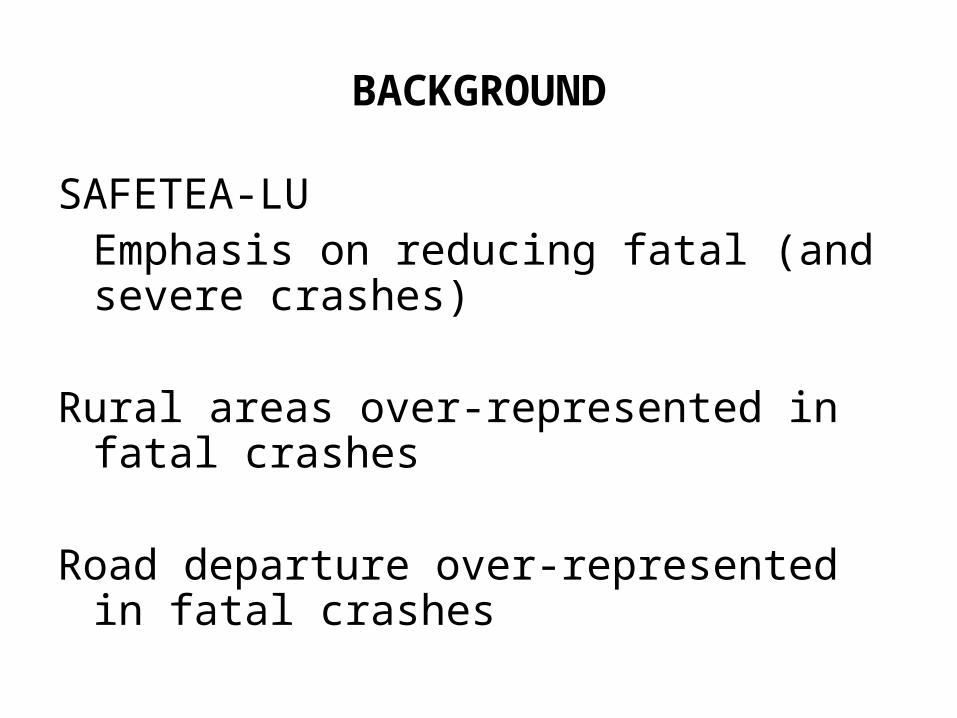
BACKGROUND
SAFETEA-LUEmphasis on reducing fatal (and severe crashes)
Rural areas over-represented in fatal crashes
Road departure over-represented in fatal crashes
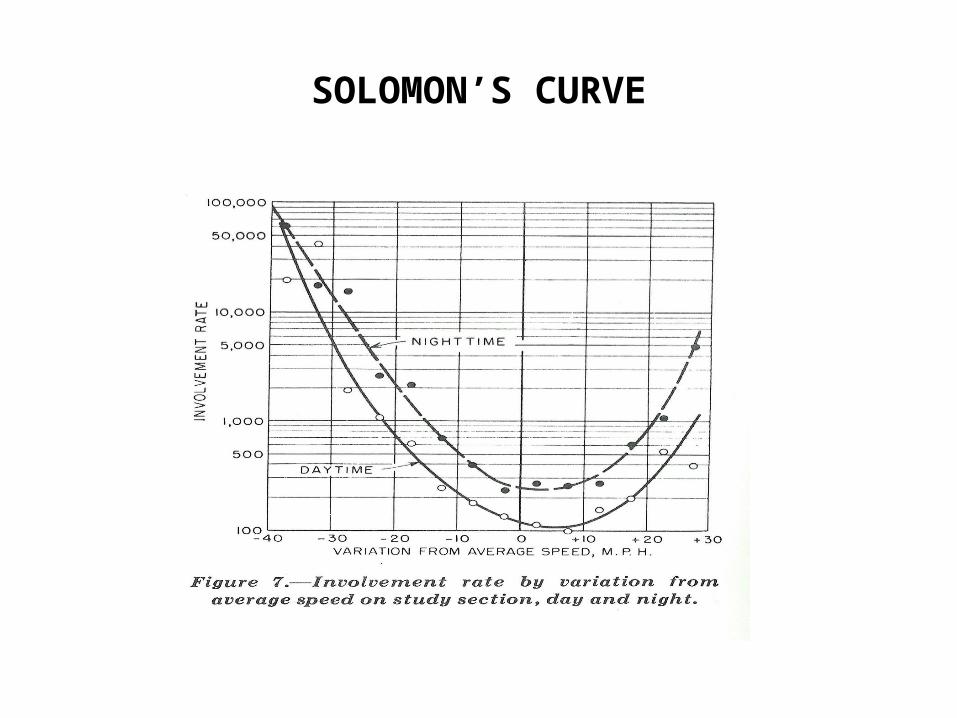
SOLOMON’S CURVE
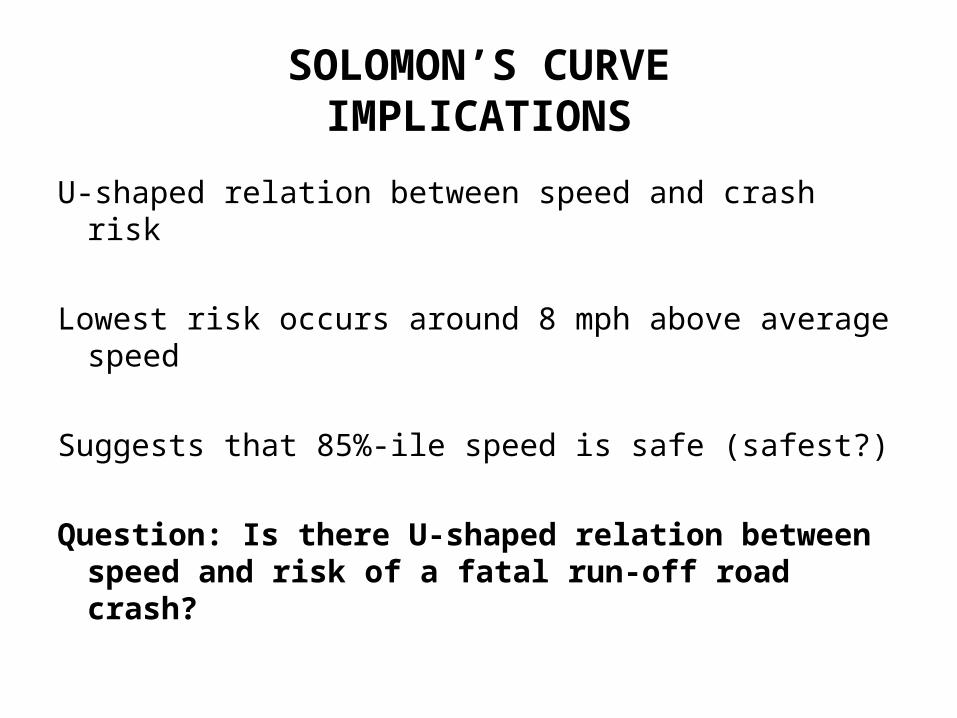
SOLOMON’S CURVEIMPLICATIONS
U-shaped relation between speed and crash risk
Lowest risk occurs around 8 mph above average speed
Suggests that 85%-ile speed is safe (safest?)
Question: Is there U-shaped relation between speed and risk of a fatal run-off road crash?
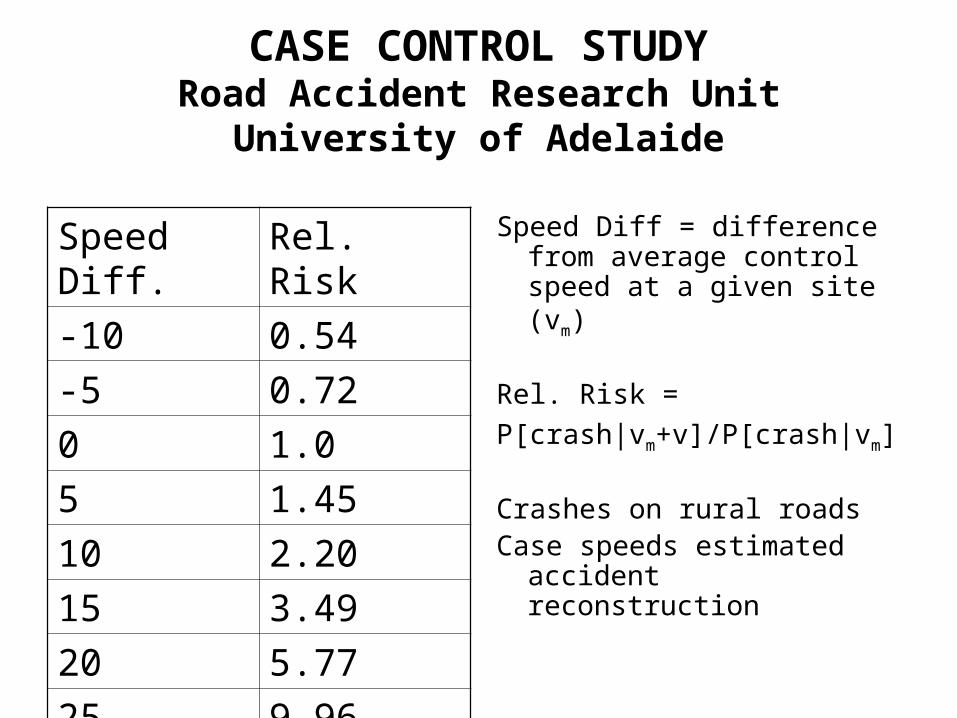
CASE CONTROL STUDYRoad Accident Research Unit
University of Adelaide
Speed Diff = difference from average control speed at a given site (vm)
Rel. Risk =
P[crash|vm+v]/P[crash|vm]
Crashes on rural roadsCase speeds estimated
accident reconstruction
Speed Diff. Rel. Risk
-10 0.54
-5 0.72
0 1.0
5 1.45
10 2.20
15 3.49
20 5.77
25 9.96
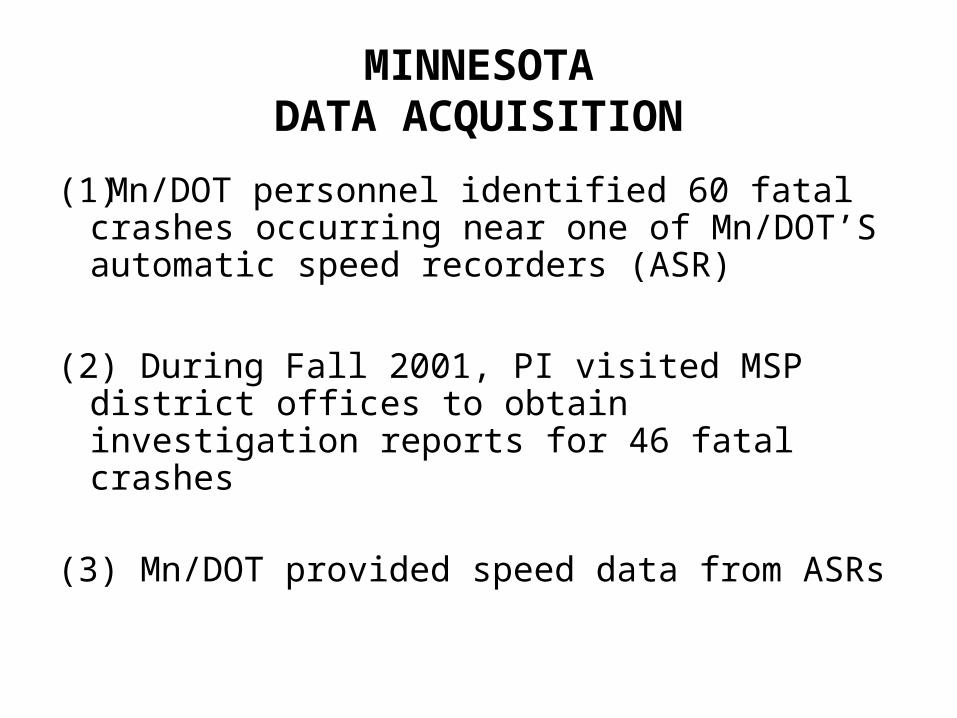
MINNESOTADATA ACQUISITION
(1)Mn/DOT personnel identified 60 fatal crashes occurring near one of Mn/DOT’S automatic speed recorders (ASR)
(2) During Fall 2001, PI visited MSP district offices to obtain investigation reports for 46 fatal crashes
(3) Mn/DOT provided speed data from ASRs
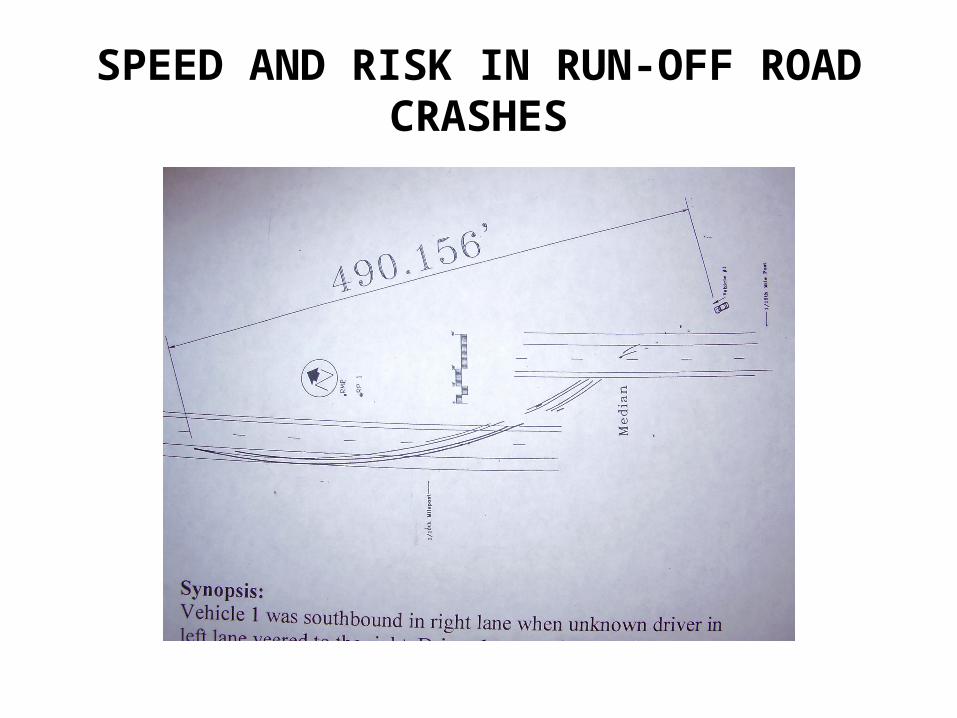
SPEED AND RISK IN RUN-OFF ROAD CRASHES
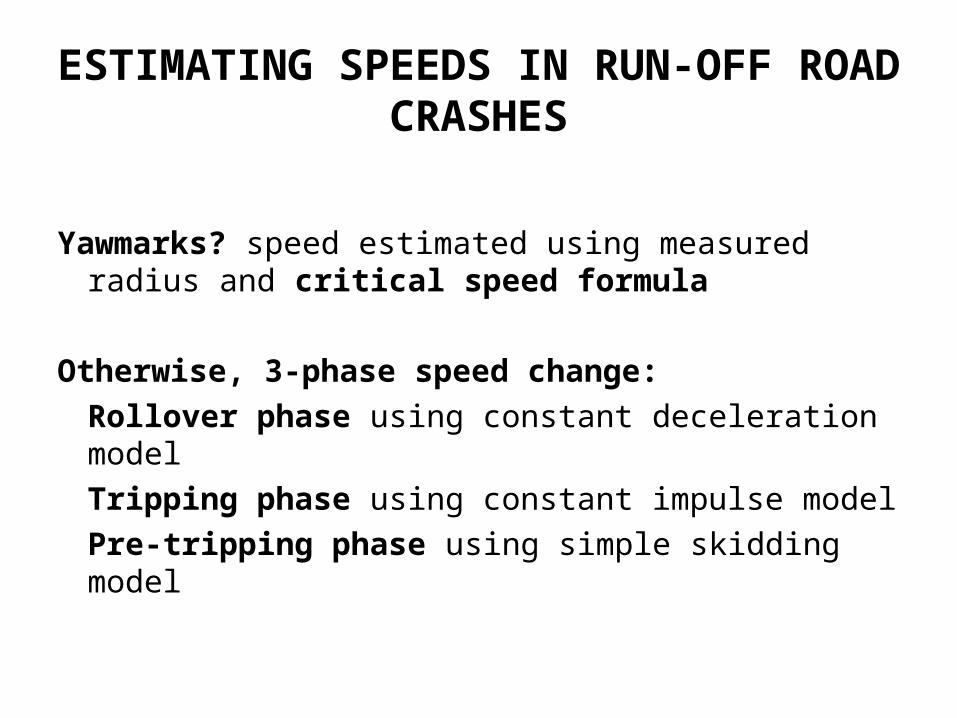
ESTIMATING SPEEDS IN RUN-OFF ROAD CRASHES
Yawmarks? speed estimated using measured radius and critical speed formula
Otherwise, 3-phase speed change:
Rollover phase using constant deceleration model
Tripping phase using constant impulse model
Pre-tripping phase using simple skidding model
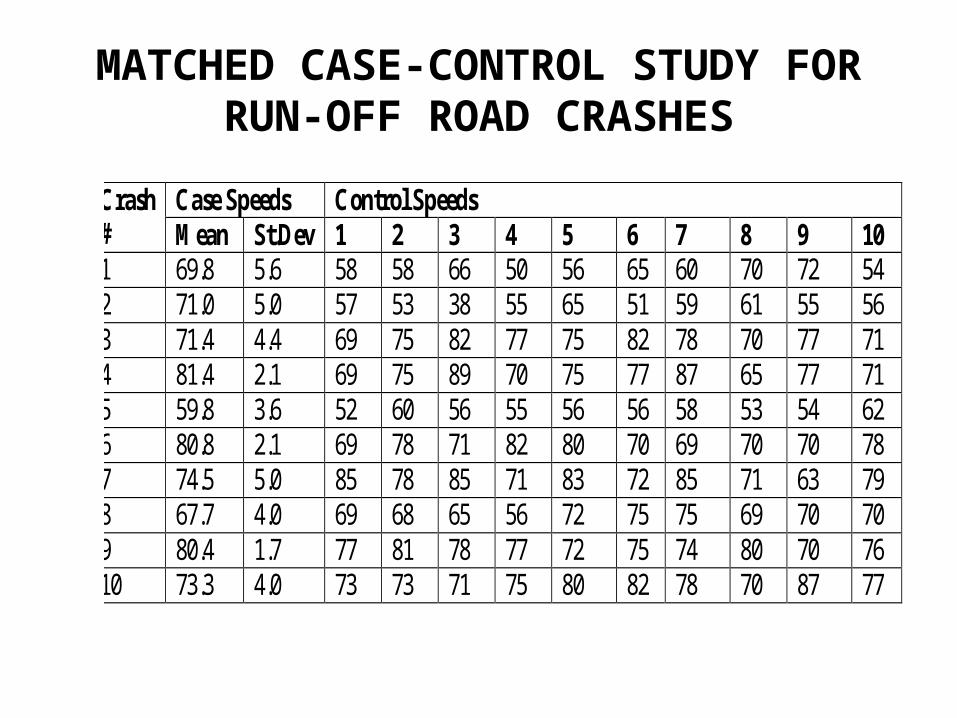
MATCHED CASE-CONTROL STUDY FOR RUN-OFF ROAD CRASHES
Case Speeds Control Speeds Crash # Mean St.Dev 1 2 3 4 5 6 7 8 9 10 1 69.8 5.6 58 58 66 50 56 65 60 70 72 54 2 71.0 5.0 57 53 38 55 65 51 59 61 55 56 3 71.4 4.4 69 75 82 77 75 82 78 70 77 71 4 81.4 2.1 69 75 89 70 75 77 87 65 77 71 5 59.8 3.6 52 60 56 55 56 56 58 53 54 62 6 80.8 2.1 69 78 71 82 80 70 69 70 70 78 7 74.5 5.0 85 78 85 71 83 72 85 71 63 79 8 67.7 4.0 69 68 65 56 72 75 75 69 70 70 9 80.4 1.7 77 81 78 77 72 75 74 80 70 76 10 73.3 4.0 73 73 71 75 80 82 78 70 87 77
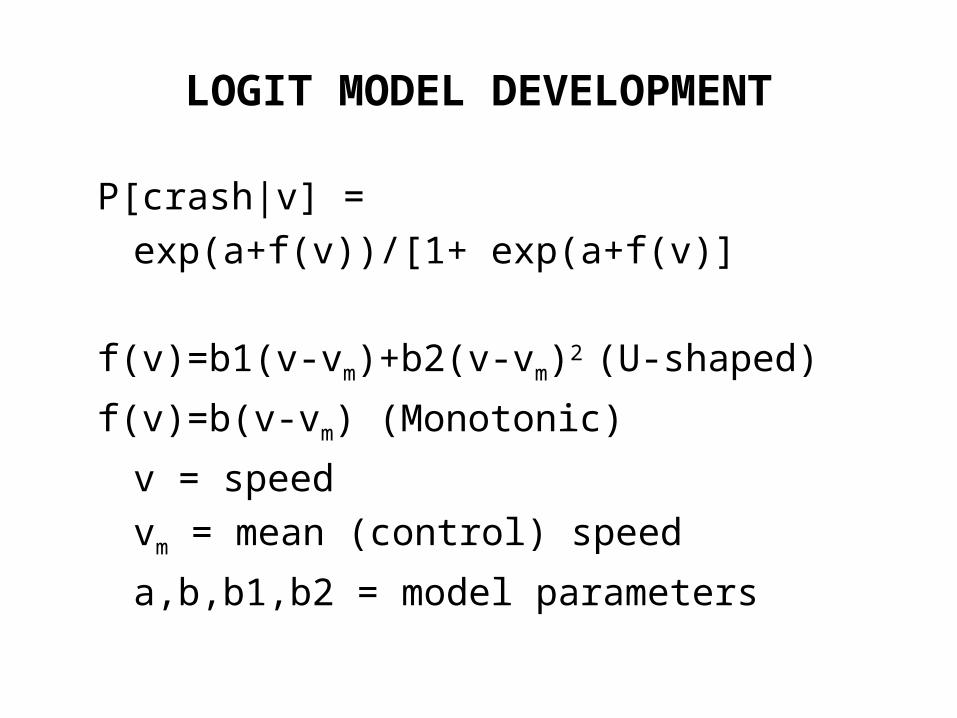
LOGIT MODEL DEVELOPMENT
P[crash|v] =
exp(a+f(v))/[1+ exp(a+f(v)]
f(v)=b1(v-vm)+b2(v-vm)2 (U-shaped)
f(v)=b(v-vm) (Monotonic)
v = speed
vm = mean (control) speed
a,b,b1,b2 = model parameters
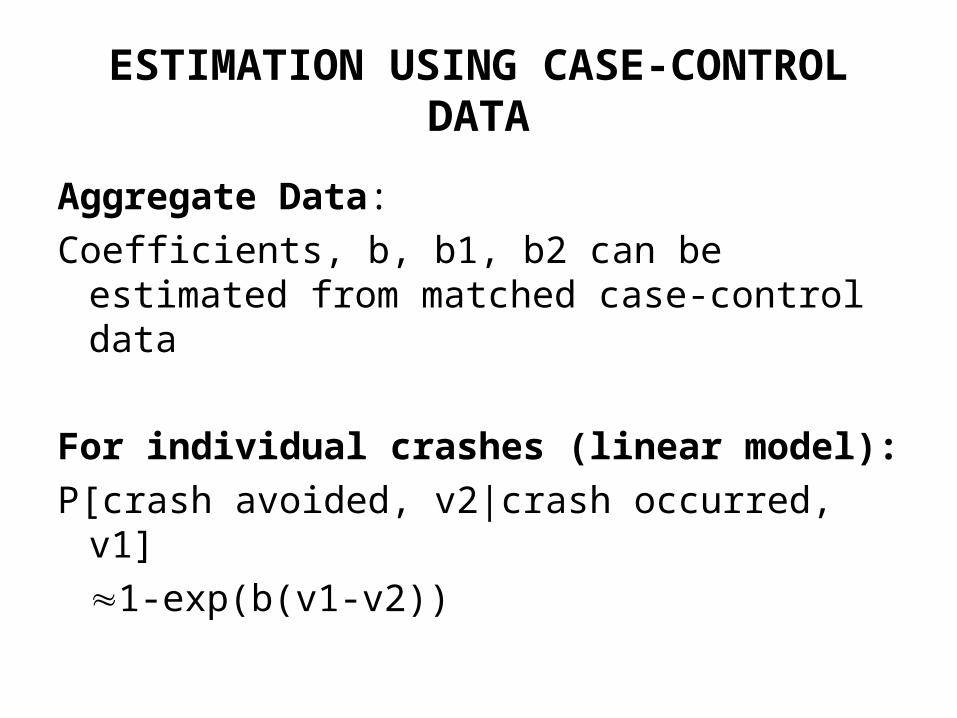
ESTIMATION USING CASE-CONTROL DATA
Aggregate Data:
Coefficients, b, b1, b2 can be estimated from matched case-control data
For individual crashes (linear model):
P[crash avoided, v2|crash occurred, v1]
1-exp(b(v1-v2))
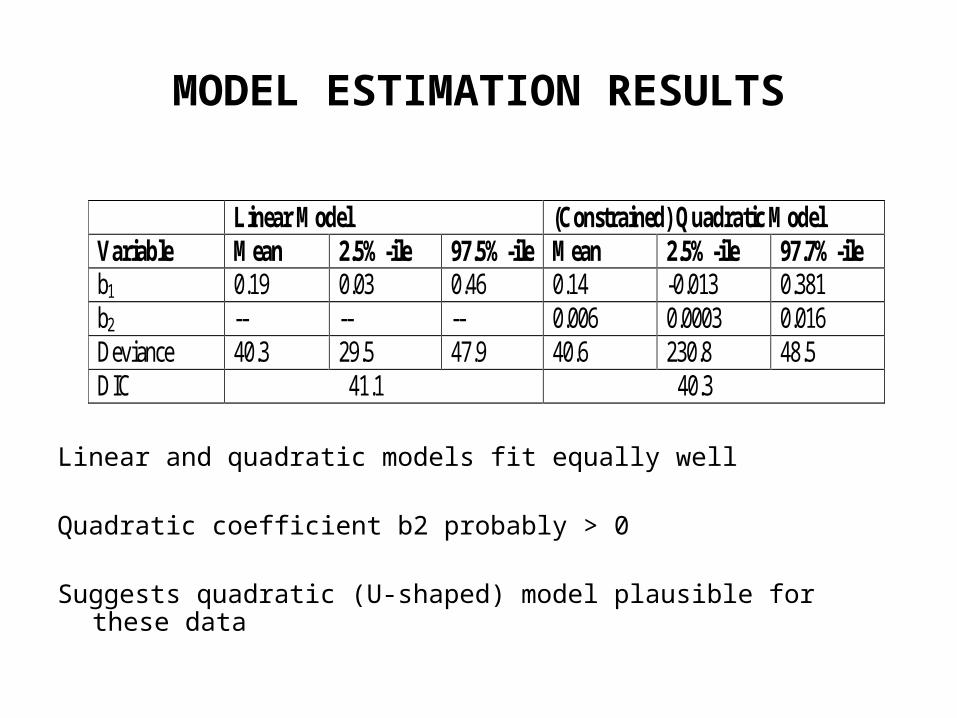
MODEL ESTIMATION RESULTS
Linear and quadratic models fit equally well
Quadratic coefficient b2 probably > 0
Suggests quadratic (U-shaped) model plausible for these data
Linear Model (Constrained) Quadratic Model Variable Mean 2.5%-ile 97.5%-ile Mean 2.5%-ile 97.7%-ile b1 0.19 0.03 0.46 0.14 -0.013 0.381 b2 -- -- -- 0.006 0.0003 0.016 Deviance 40.3 29.5 47.9 40.6 230.8 48.5 DIC 41.1 40.3
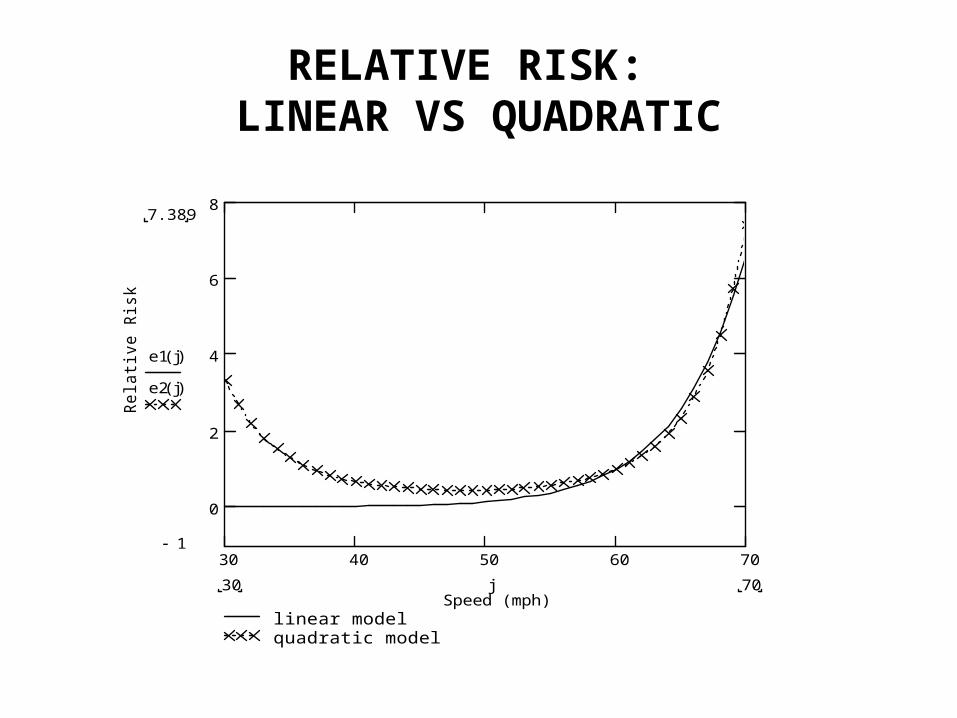
RELATIVE RISK: LINEAR VS QUADRATIC
30 40 50 60 70
0
2
4
6
8
linear modelquadratic model
Speed (mph)
Rel
ativ
e R
isk
7.389
1
e1 j( )
e2 j( )
7030 j
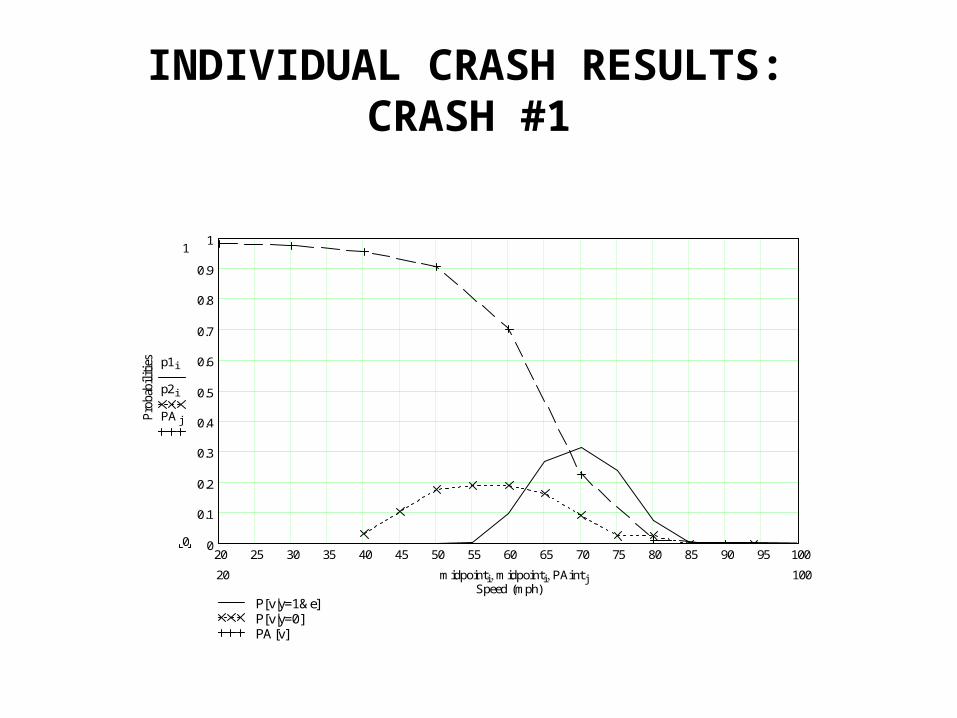
INDIVIDUAL CRASH RESULTS: CRASH #1
20 25 30 35 40 45 50 55 60 65 70 75 80 85 90 95 1000
0.1
0.2
0.3
0.4
0.5
0.6
0.7
0.8
0.9
1
P[v|y=1&e]P[v|y=0]PA[v]
Speed (mph)
Pro
babi
liti
es
1
0
p1 i
p2 i
PA j
10020 midpointi midpointi PAint j
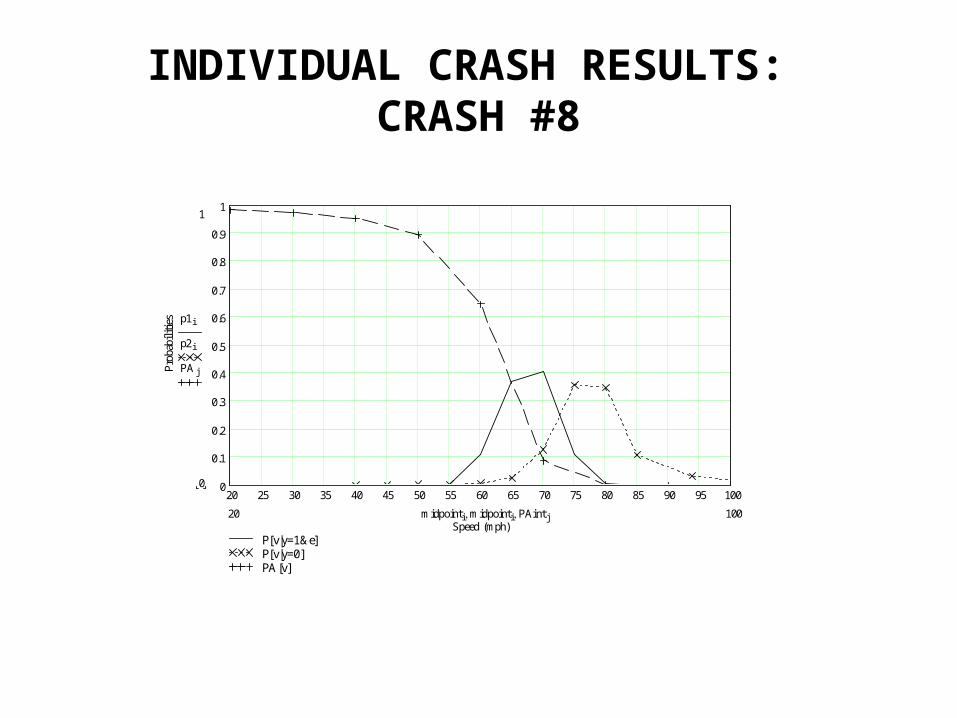
INDIVIDUAL CRASH RESULTS: CRASH #8
20 25 30 35 40 45 50 55 60 65 70 75 80 85 90 95 1000
0.1
0.2
0.3
0.4
0.5
0.6
0.7
0.8
0.9
1
P[v|y=1&e]P[v|y=0]PA[v]
Speed (mph)
Pro
babi
liti
es
1
0
p1 i
p2 i
PA j
10020 midpointi midpointi PAint j
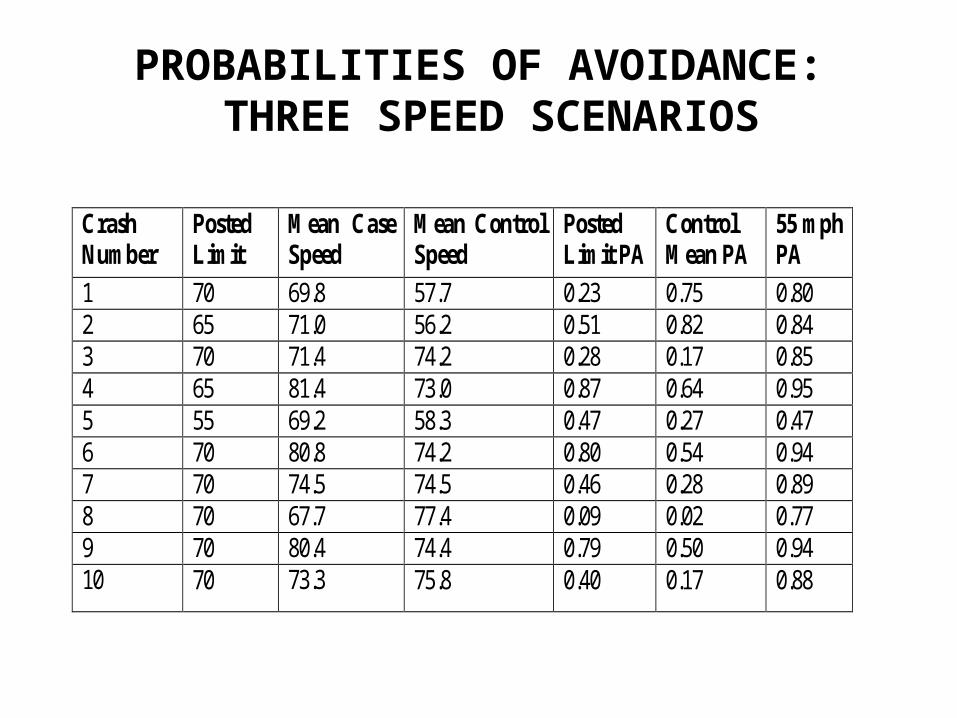
PROBABILITIES OF AVOIDANCE: THREE SPEED SCENARIOS
Crash Number
Posted Limit
Mean Case Speed
Mean Control Speed
Posted Limit PA
Control Mean PA
55 mph PA
1 70 69.8 57.7 0.23 0.75 0.80 2 65 71.0 56.2 0.51 0.82 0.84 3 70 71.4 74.2 0.28 0.17 0.85 4 65 81.4 73.0 0.87 0.64 0.95 5 55 69.2 58.3 0.47 0.27 0.47 6 70 80.8 74.2 0.80 0.54 0.94 7 70 74.5 74.5 0.46 0.28 0.89 8 70 67.7 77.4 0.09 0.02 0.77 9 70 80.4 74.4 0.79 0.50 0.94 10 70 73.3 75.8 0.40 0.17 0.88
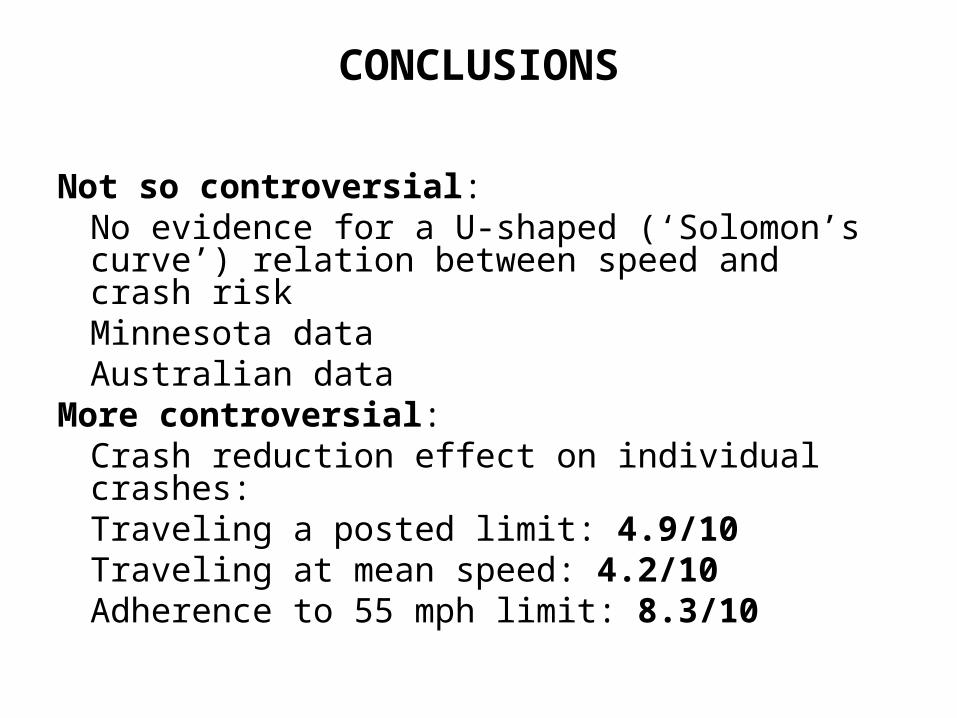
CONCLUSIONS
Not so controversial:No evidence for a U-shaped (‘Solomon’s curve’) relation between speed and crash risk
Minnesota dataAustralian data
More controversial:Crash reduction effect on individual crashes:
Traveling a posted limit: 4.9/10Traveling at mean speed: 4.2/10Adherence to 55 mph limit: 8.3/10

THANK YOU
Questions?