Embed Size (px)
Citation preview

SURFACE A N D INTERFACE ANALYSIS, VOL. 24, 163-172 (1996)
Spectrum Synthesis Based on Non-linear Addition?
T. A. El Bakush and M. M. El Gomati* Department of Electronics, University of York, Heslington, York YO1 5DD, UK
One of the proposed approaches in the literature for quantitative analysis in AES is the linear addition of elemental spectra acquired in the direct energy mode (N(E) vs. E and E - N(E) vs. E). Quantification is then achieved by matching the shape of the added spectra to that of an unknown that was also collected under identical experimental conditions. However, it is shown here that the linear combination of elemental spectra employed in this approach has no real justification in theory. Any agreement with experiment found using this approach can therefore be of doubtful value. To avoid uncertainty, non-linear addition formulae that take the matrix effects (of the substrate) into consideration are developed. Results obtained with these formulae on AuCu alloys are described. The observed success of the linear addition is explained in terms of more rigorous non-linear addition.
INTRODUCTION
Auger electron spectroscopy (AES) has been widely used in many contexts since the introduction of elec- tronic differentiation by Harris in the late 1960s. The success of AES as a quantitative tool for surface analysis lies primarily in the accuracy of the measure- ment of the Auger current. This has traditionally been carried out by collecting spectra in the differential mode and measuring the peak-to-peak height of the peaks of interest. However, it emerged that the use of this mode can lead to misleading or inaccurate results in some cir- cumstances, due to changes in peak strengths and shapes for the same elements in a different chemical environment.’,’ Although the availability of computers to record and process data, together with dispersive analysers, has moved attention towards the use of the direct mode, the differentiated spectra are still more popular and widely used, simply because of the ease by which the Auger intensity is measured from these spectra. The difficulty that an analyst faces in using the direct mode is the extraction of Auger current by the measurement of the areas under the Auger peaks, since this requires subtraction of the background upon which the Auger peaks are superimposed. A number of models have been developed for the background subtrac- t i o q P 7 and the process is by no means considered an easy task for a number of reasons: Auger peaks in the low kinetic energy region can be superimposed on the strong peak in the spectrum due to low-energy second- ary electrons; Auger peaks of one element can be super- imposed on a background that includes loss tails of Auger peaks of other components; peaks due to differ- ent elements can themselves overlap. All of these prob- lems can lead to a reduction in accuracy of the evaluations of Auger intensities.
To avoid these difficulties an alternative method for obtaining quantitative information was proposed by
* Author to whom correspondence should be addressed t This paper is dedicated to Professor Martin Pruttan (University
of York, Department of Physics) on the occasion of his 60th birthday.
CCC 0142-242 1 /96/030 163- 10 0 1996 by John Wiley & Sons, Ltd
Strausser et ~ l . , ~ namely spectrum synthesis. This involves collection of a spectrum, N(E), from the sample of interest as well as spectra from samples of pure ele- ments present in the sample, all under identical experi- mental conditions. The elemental spectra are then rescaled and subtracted in turn from N ( E ) of the sample of unknown composition, starting with the Auger peak highest in energy. Each scaling factor is determined by matching the height of the elemental spectrum to the height of the corresponding peak in N(E) of the sample of the unknown composition. A knowledge of the ele- mental scaling factors gives an estimate of the surface composition of the elements present in the surface of the sample. This approach has recently attracted more attention and been applied to the E . N(E) spectra of AuCu alloys by Ichimura et al.’ These authors con- sidered the linear addition of elemental standard spectra and compared these with the spectrum of the sample of the unknown surface composition. However, neither Strausser et al.’ nor Ichimura et al.’ have included allowance for the influence of the matrix effects that are known to affect the Auger spectra. Factor and target factor analysis are also methods which use entire sec- tions of a spectrum. By linear transformations of the given data (unknowns and standards), estimates are made of the surface composition. Again, matrix effects are neglected in this approach.
In this paper an analysis of spectrum synthesis is pre- sented, including the derivation of some algebraic expressions which take into account the effect of the matrix corrections. The expressions are tested on AuCu alloys of different compositions and compared with the linear approach.
THE SPECTRAL BACKGROUND
The distribution of the emitted electrons which give rise to the spectral background in an Auger spectrum has conventionally been divided into two main com- ponents: one due to secondary electrons; the other due to the primary electrons that have suffered inelastic
Receiued 19 July 1995 Accepted 3 November 1995

164 T. A. EL BAKUSH AND M. M. EL GOMATI
1
0 Energy Eo
Figure 1. Schematic of the background in AES, showing the two main components: the secondary electron cascade and that due to rediffused primaries.
losses as they travel through the material, termed back- scattered electron^^.^ (see Fig. 1). The secondary elec- tron component dominates the background at low kinetic energy and, according to S i ~ k a f u s , ~ . ~ its shape is independent of beam energy E , and angle of incidence 8,. However, the magnitude of the secondary electron yield does increase as E , decreases or 8 , increases. This is because the escape depth of the secondary electrons is only a few nanometres in comparison to the range of the incident electrons, which can be of the order of microns (for primary beam energies > 10 keV), and so a decrease in 8, or an increase in E , tends to generate secondaries at greater depths than a few n a n o m e t r e ~ . ~ . ~ In contrast, as the beam energy is reduced or 8, increases, more of these secondaries are produced within the escape depth of secondary electron^.^-^.'^
On the other hand, the backscattered component dominates the background at high energies and its shape does change with E , and O 0 , i.e. it becomes flatter as E , or 8, is increased. Bishop’ has carried out an extensive study by considering the fraction of incident electrons that are backscattered, q, as a function of the atomic number and beam energy. He found that q increases with the atomic number of the target material, but observed very little dependence on the beam energy. The increase in q with atomic number has been explained in terms of elastic scattering cross-section, which increases with atomic number. This causes q to rise with atomic number, with the net effect that the primary electrons travel shorter distances in heavy ele- ments and hence the probability of being backscattered is higher than in lighter elements.’ Similar results were also reported by Darlington.”
Methods of modelling the background have been discussed in the literature. Briefly, for a 2.0 keV primary electron beam and electron kinetic energy < 1000 eV, S i c k a f ~ s ~ . ~ showed that the background (further away from the signal peaks) can be represented by the func- tion AE-”, where E is the electron energy and A and m are constants. In his study of secondary electron emis- sion, he demonstrated that the direct N ( E ) spectrum, when plotted on a log-log scale, exhibits linear regions between characteristic peaks up to 1000 eV-the range below which the secondary electron component was
expected to dominate. Moreover, Peacock and Durandi3 showed that, for a primary energy of more than 15 keV, the Sickafus function can be fully extended up to 2000 eV. These authors have also interpreted the deviation from the Sickafus function above 2000 eV to be due to the contribution of the backscattered to the spectral background, which becomes more significant than that of the secondary electron component. Fur- thermore, Matthew et al.14 (1991) investigated Sick- afus’s equation using Monte Carlo simulations to model the background of Cu and Au, and obtained a reason- able agreement with standard spectra.I6 The applicabil- ity of this power law form has been examined experimentally by Greenwood et al. for 32 elements (see Ref. 24).
In summary, a great deal is known about the back- ground of pure solids. The question of whether the ele- mental spectra can be used to represent the spectral background of multi-component materials is the subject of the following sections.
ANALYSIS
To avoid the difficulty of separating the peaks from the background, Strausser et aL8 and Ichimura et aL9 used linear addition of elemental spectra as a method to obtain the spectrum of an unknown sample and hence to estimate the surface composition. Ichimura et aL9 applied this approach to AuCu alloy E . N ( E ) spectra collected with a 10 keV primary beam energy and con- sidered only that part of the background between 100 and 1000 eV. Strausser et aL8 were the first to propose linear addition of elemental spectra for the interpreta- tion of N ( E ) spectra of alloys in which peaks of the con- stituent elements overlap.
However, from the point of view of the matrix effects” in AES, linear addition has no physical justifi- cation in theory due to the influence of the material dependence of the backscattering, the atomic density and the inelastic mean free path, a fact which has not been addressed or justified by either Strausser et a/.* or Ichimura et aL9 The influence of these factors is investi- gated as described below.
If an electron beam interacts with the surface of an alloy which consists of elements 1 and 2, then the col- lected signal of interest (i.e. the Auger electron current), S , , from the alloy is related to the physical parameter by
S , = k l , A, N , R, (1) and A , and N , , respectively, for an alloy can be deter- mined by”
N , = ( N , - N2)x + N2 (34
N , = (iooop, ~ ~ ~ ~ ) ~ ( I q - 3 (3b)
where N i is given by
A number of formulae have been reported for calcu- lating the inelastic mean free path (IMFP)’8*’9. The expression due to Tanuma et al.” is used here since this

SPECTRUM SYNTHESIS BASED ON NON-LINEAR ADDITION 165
is known to give a good account of the atomic number Z and energy dependence for many materials. These authors used experimental optical data and a theoreti- cal dielectric function to calculate IMFPs for 31 materials in the energy range 50-2000 eV. The calcu- lated IMFPs were then fitted to the Bethe" equation for inelastic scattering. The resulting expression has the form
where B = -2.25 x lop2 + 0.944(Ei + E i ) + 7.39 x p i , y = 0.191 P - O . ~ , C = 1.97 - 0.91,
D = 53.4 - 20.8 U , U = (Nav ,p i W - ' ) and E , =
The backscattering factor, R , , can be determined by one of the two approaches:22 by calculating elemental factors R , and R , by one of the equations available in the literature, e.g. the expression due to Shimi~u, '~ which has the form
Ri = 1 + (0.462 - 0.777 Z0.30)U-0 .32
2 8 . 8 ~ ~ ~ ~ ~ p i w; 110.50.
+ (1.15 Z0.,O - 1.05) (4) for a primary electron beam incident at 30" to the surface normal of the specimen. The backscattering factor of an alloy is then found by adding R , and R , linearly according to
R , = ( R , - R2)x + R2 ( 5 )
Alternatively, R , can be calculated via the mean atomic number of the alloy, Z , , which in turn can be deter- mined by
2, = ( Z , - Z,)X + z, (6) Z , is then used in Eqn. (4) to yield the backscattering factor of the alloy. A comparison of the approaches for calculating R , is given in Fig. 2, which shows a discrep- ancy of - 2% between the two procedures.
First, derivation of an expression for S, , with R , being given by Eqn. (9, is considered. Substitute Eqns.
3.0
2.5 -
2.0-
21.5-
0 500 1000 1500 2000 Energy (eV)
Figure 2. Comparison of the backscattering equations
(2), (3) and (5) into Eqn. (1) and simplify to obtain
s, =
klo 1 2 11N2 R2{1 + C(R1 - R,/R, ) + ( N , - N,/N2) lx
{ ( A 2 - A1)X + A,} + Wl - R,/R,XN, - N , / N , ) l x 2 }
(7) Equation 7 indicates that the signal, S , , is related to the atomic fraction x in a non-linear fashion and hence there is a requirement for an expression which can non- linearly add elemental spectra. Multiplying out the brackets in Eqn. (7) gives
(8) a + bx + cx2
[(A, - A& + A l l s = -
where
a = k l , N , R , 1, A, (84 b = klo A2 N2 AIR, - k l , A,A,N, R ,
+ klo 22 AIR2 N , - k l , 1, 11 R , N , (6b) and
c = kIoA2A1R1N1 - k I ~ A ~ 1 ~ N ~ R1
- klo 1, I11NlR2 + k l , A, N2 R2 1, ( 8 ~ ) Similarly, the signals from the standards are given by
(9) Sl
kIOR1 S , = kloA, .NIRl AINl = -
Substituting relations (9) and (10) into Eqns @a), (8b) and (8c), and then substituting these for a, b and c in relation (8) and rearranging gives the form
s, =
S , A , + CS, ~AR, lR2) -2Sz 11 + SlA2(R,/RI)l x + CSlA2 - s, ~ , ~ ~ 1 / ~ 2 ~ - ~ 1 ~ 2 ~ ~ 2 / ~ 1 ~ + S2 M x 2
(1 1
C ( A 2 - A 1 ) X + A l l
Now consider the case in which the backscattering factor, R , , of the alloy is determined via the atomic number, Z, . This simplifies Eqn. (7) to the form
( k l , A,N1A2 R , .- k l , 1 2 N , AIR& + k l , 12 N , 1, s, = ( A 2 - A,)x + 11
(12) Substitution of relations (9) and (10) into Eqn. (12) yields
(s, 3, - s, -1, x + s, - 1 , Rx R2 R x ) R2
(13) s, = ( A 2 - A,)x + A,
Since the overall measured spectrum, SP, is the sum of the Auger signal and the background, then SP is
166 T. A. EL BAKUSH AND M. M. EL GOMATI
i 7000
6000-
5000-
w^ q4000- w
3000-
2000-
500 1000 1500 2000 Energy (eV)
500 lo00 1500 2000 Energy (eV)
l m m 500 1000 1500 2000 0
Energy (eV)
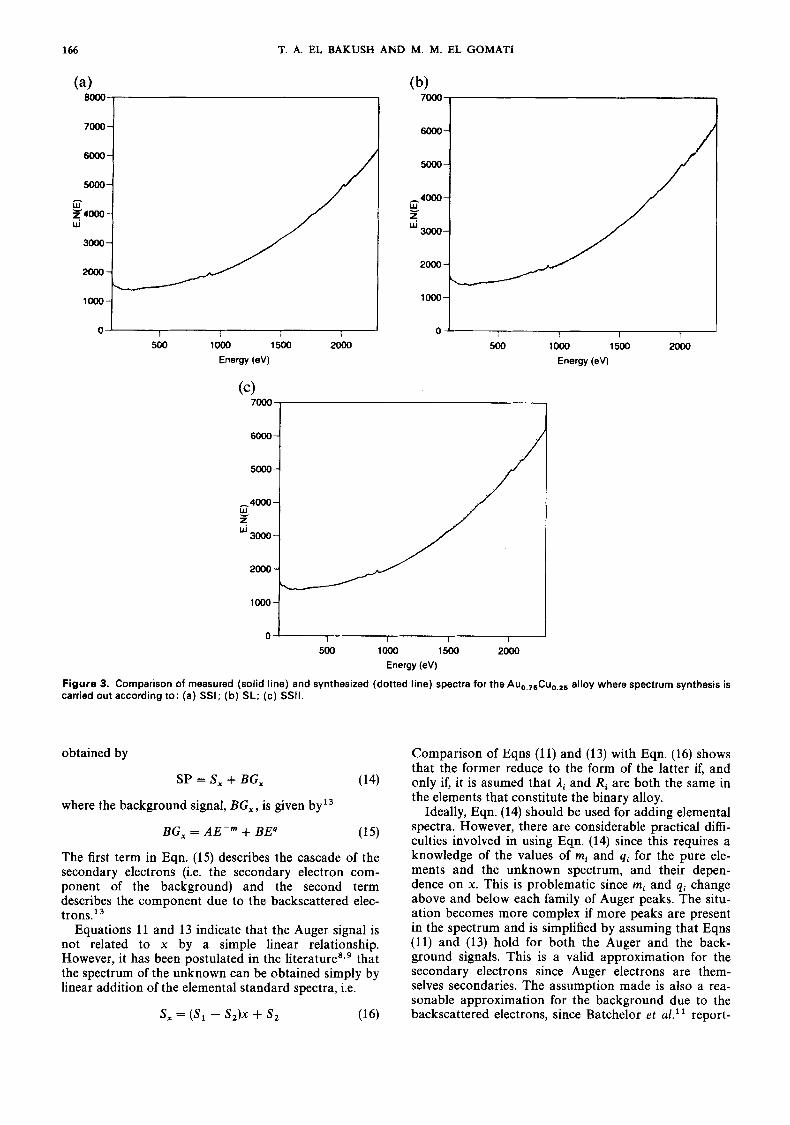
Figure 3. Comparison of measured (solid line) and synthesized (dotted line) spectra for the Au,,,,Cu,,,, alloy where spectrum synthesis is carried out according to: (a ) SSI; (b) SL; (c) SSII.
obtained by
SP = S , + BG, (14)
where the background signal, BG, , is given by13
BG, = AE-" + BE4 (15)
The first term in Eqn. (15) describes the cascade of the secondary electrons (i.e. the secondary electron com- ponent of the background) and the second term describes the component due to the backscattered elec- trons.I3
Equations 11 and 13 indicate that the Auger signal is not related to x by a simple linear relationship. However, it has been postulated in the literature'.' that the spectrum of the unknown can be obtained simply by linear addition of the elemental standard spectra, i.e.
s, = ( S , - S,)x + s, (16)
Comparison of Eqns (11) and (13) with Eqn. (16) shows that the former reduce to the form of the latter if, and only if, it is asumed that Li and Ri are both the same in the elements that constitute the binary alloy.
Ideally, Eqn. (14) should be used for adding elemental spectra. However, there are considerable practical difi- culties involved in using Eqn. (14) since this requires a knowledge of the values of mi and q i for the pure ele- ments and the unknown spectrum, and their depen- dence on x. This is problematic since mi and q i change above and below each family of Auger peaks. The situ- ation becomes more complex if more peaks are present in the spectrum and is simplified by assuming that Eqns (11) and (13) hold for both the Auger and the back- ground signals. This is a valid approximation for the secondary electrons since Auger electrons are them- selves secondaries. The assumption made is also a rea- sonable approximation for the background due to the backscattered electrons, since Batchelor et al.' report-

161 SPECTRUM SYNTHESIS BASED ON NON-LINEAR ADDITION
8000
7000-
6Ooo-
5000-
w^ r4000- W
3ooo-
2000-
1000-
0 I I 1 1
7000-
6Ooo-
5000-
w^ r4000- W
3ooo-
2000-
1000-
0 I I 1 1
500 1000 1500 2000
3000 w :-i '"1
500 lo00 1500 2000 Energy (eV)
5000 -1 i "30001 /
" I 1 I \
500 loo0 1500 2Ooo Energy (eV)
Figure 4. Comparison of measured (solid line) and synthesized (dotted line) spectra for the Auo.soCuo.so alloy where spectrum synthesis is carried out according to: (a) SSI; (b) SL; (c) SSII.
ed that the backscattered electrons have a similar cosine angular distribution to that of the Auger electrons. They showed that the ratio of the Auger yield to that of the background (due to the backscattered electrons) for different angles of incidence of the primary beam is con-
stant up to 60". This was found to be true for a number of pure elements in the Periodic Table: copper, silicon and tungsten. These conclusions were further substan- tiated by the results of Crone et aL41 These authors show that for Au, Ag and C the energy and angle
Table 1. Estimated average surface composition using the three Eqns (ll), (13) and (16) (SSI, SSII and SL)
Alloy
Average estimated surface compositions
SSI SL SSll
Au,,,,Cu,,,, 26.1 % Au (60.7%) 26.1 % Au (*0.6%) 25.3% Au (*5.0%)
Auo,,Cuo,, 52.3% Au (*1.7%) 52.3% AU (*1.4%) 53.2% Au (*4.8%)
Au,,,,Cu,,, 78.2% Au (*0.66%) 78.2% Au (*0.6%) 77.5% Au (*3.4%)
73.9% CU 73.9% CU 74.7% cu
47.7% CU 47.7% AU 46.8% CU
21.8% CU 21.8% CU 22.5Yo CU

168 T. A. EL BAKUSH AND M. M. EL GOMATI
1000-
500 1000 1500 2000
500 lo00 1500 2000 Energy (eV)
Figure 5. Comparison of measured (solid line) and synthesized (dotted line) spectra for the Au,,,,Cu, 7 6 alloy where spectrum synthesis is carried out according to: (a) SSI; (b) SL; (c) SSII.
dependencies of the peak heights and backgrounds are very similar. Furthermore, Greenwood et aLZ4 demon- strated that the secondary electron component of the background can be expressed by the form
SEX = k N , I , E - " (1 7)
Using this relation in an analogous manner to the deri- vation given above for S, (for homogeneous alloy), one may derive a relationship for SEX of an alloy in terms of the elemental background signals. In this way one obtains
(18) [(E"-"'Iz - E " - m z I l ) ~ + E m - m z I 1 ]
SEX = ( 2 , - I J X + 4
which is similar to Eqn. (13) and suggests also that the background signals of the pure elements can only be added linearly if I , = 1 , .
Equations ( l l ) , (13) and (16) will be referred to as SSI, SSII and SL, respectively.
EXPERIMENTAL
To test the applicability of the different expressions (i.e. SSI and SSII), a family of AuCu alloys has been chosen for the following reasons. Firstly, Cu and Au are known to form solid solutions, i.e. they are completely miscible in each other at all compositions. Secondly, as far as AES is concerned, the surface compositions of these alloys are found to be the same as the bulk, i.e. no pref- erential sputtering effects have been o b ~ e r v e d . ~ ~ - ~ * Ion scattering spectroscopy (ISS), however, has revealed that ion bombardment induces surface enrichment of Au at the outermost atomic layer^.'^-^' The difference between the results of AES and the ISS has been attrib- uted to the following two mechanisms. The first is the ion beam-induced enhanced surface segregation which causes the Au atoms to segregate to the outermost atom layer due to their low surface energy in comparison to those of the Cu, which in turn leaves a depletion region

SPECTRUM SYNTHESIS BASED O N NON-LINEAR ADDITION 169
:::I , I , , -300
500 lo00 1500 2000 Energy (eV)
-400 1 L___r__ I I I I
500 lo00 1500 2000 Enery (eV)
500 1000 1500 2000 Enery (eV)
Figure 6. Plots of the residual, i.e. the difference between measured and synthesized, spectra using SSll and SL; (a) for the Au,,,,Cuo,,, alloy; (b) for the Au,,,,Cu,,, alloy; (c) for the Au,,,,Cu,,,, alloy.
of Au atoms just beneath the enriched 0ne.30p31 The second is the difference in sampling depths of the signals in AES and ISS. In the case of AES, the high-energy Auger signals of Au and Cu are often used due to the overlap of low-energy Auger signals. The average AES information depth is -5-6 nm at least. On the other hand, the signal in ISS reflects a concentration of atoms in the topmost atomic layer of a specimen surface31 of no more than 1 nm. However, in the present work it is the spectral background and Auger electron signals which are of concern and both of these eminate from depths of more than those in ISS. It is therefore safe to use these alloys to test a non-linear combination of spectra.
Spectra from three Au,Cul - x alloys of different com- positions (Au75%-Cu25Y0, AuSO%-Cu50% and Au25%-Cu75%) and from pure Cu and Au samples have been collected using the acylindrical mirror analyzer (CMA).28 The samples were obtained from the
Japanese VAMAS working group who reported that the purity of the specimens was better than 99.7%.32
A primary energy of 5.0 keV and a beam current of -0.95 pA were used in collecting spectra from the Au and Cu standards as well as the alloys. Prior to collec- tion, the surfaces of all specimens were bombarded with a 3.0 keV beam and 0.5 pA mmP2 of Ar' ions for 60 min each to remove any contamination present on the surface. In spite of this, some spectra still showed traces of carbon, possibly due to the cracking of hydrocar- bons, residual in the system, by the electron beam. The spectra were then recorded in the energy range 100- 2300 eV with a 100 ms dwell time per energy channel and with -10 V applied to a grid placed between the exit slit aperture of the CMA and the electron detector. The purpose of using a negatively biased grid is to mini- mize the internal scattering contribution to Auger
The spectra were all corrected for the response function3' of the CMA.

170 T. A. EL BAKUSH AND M. M. EL GOMATI
I (a' I
0 ' I I I I I
500 1 000 1500 2000 Energy (eV)
30
25
f0
E 815.
z m 9
10
5-
0 - I I 1 1 500 1000 1500 2000
Energy (eV)
Figure 7. (a) A plot of the R,A,/R, and R,A,/R, terms in SSII. (b) A plot of theR,A,/R, andR,A,/R, terms in SSI.
The surface composition was estimated by comparing the spectrum of the unknown (M) with the synthesized spectrum (SI) (Table 1) via an iteration process which involved changing the value of x in SSI, SSII and SL until the closest fit between the two spectra was found. The criterion used for such a comparison was the chi- square test, which has the
where M i and SIi are the contents of the ith channel of the unknown and the synthesized spectra, respectively. The chi-squared test requires that the square of the sum of the unknown ( M i ) and synthesized (SZi) spectra becomes a minimum over the energy interval of interest. The value of x (the surface concentration) that will cause the spectrum calculated from the pure elements to match the measured spectrum as closely as possible is found by performing a non-linear least-squares
RESULTS AND DISCUSSION
The surface compositions of the AuCu alloys estimated via SSI, SL and SSII are shown in Table 1. In compar- ing the measured and the synthesized spectra, the chi- squared criterion was used over different energy intervals and the surface composition was determined as the average of the evaluated best-fit values. Gener- ally, the estimated surface compositions show satisfac- tory agreement with the nominal composition. Moreover, it was found that the linear (SL) and non- linear addition (SSI) of spectra yielded similar results in all cases. The similarity is also reflected in the shape of the spectra, shown in Figs 3(a,b), 4(a,b) and 5(a,b), where it is evident that the synthesized spectrum matches rea- sonably the corresponding measured spectrum for all alloys. However, there is a noticeable discrepancy of -2% or less in the lower energy part of the spectra, i.e. below 1000 eV, which is the same in the case of SSI and SL. This agreement between the linear and non-linear combinations indicates that the matrix effects are not critical in the AuCu alloys, despite the large atomic number difference ( Z = 29 for Cu and 79 for Au).
On the other hand, if the spectra synthesized using SSII are compared with the corresponding measured spectra from the alloys, some discrepancies can be seen (Table 1). These discrepancies appear to be systematic in terms of the Cu concentration in the alloys. Figures 3(c)-5(c) show a comparison of the synthesized and measured spectra. From these, it is clear that the syn- thesized spectrum, obtained using SSII, is always higher than the corresponding measured spectrum above - 1100 eV. The trend is visible in all of the alloys and is largest in the case of the Au,.,,Cu,,,, alloy. This was not the case when the elemental Au and Cu spectra were added according to SSI or SL. Furthermore, at low energies (<lo00 eV) SSII gives more satisfactory agreement between the synthesized and the measured spectra than that obtained by either SSI or SL, as can be seen from the residual plots shown in Fig. 6. However, it should be noted that although the shapes of the spectra generated via SSI and SSII do differ at low and high energies, the surface compositions obtained from the average of the best-fit values agree to within the random errors of these spectra. For example, the surface compositions of the Au,,,Cu,,, alloy obtained using SSI and SSII are Au 52.3Yo-C~ 47.7% and Au 53.2Yo-C~ 46.8% respectively. The same trend is also found for other alloys, as shown in Table 1.
The reason for the observed discrepancy between the synthesized spectra using SSII and measured spectra may be envisaged from plots of the R,A2/R, and R,A,/R2 terms in SSII [Fig. 7(a)]. These terms are respectively referred to as Beta and Gamma in the figure, which shows that the difference between the two terms increases with energy and reaches - 8.0% at high energies. A plot of similar terms R,A1/R2 and R2A2/R1 in SSI, referred to as Beta2 and Gamma2 respectively, is also given in Fig. 7(b). In this case, although the behav- iour of the corresponding terms in SSII is the same, their influence in SSI appear to be less effective due to the presence of other terms in the equation which seem to compensate for them.

171 SPECTRUM SYNTHESIS BASED ON NON-LINEAR ADDIT ION
CONCLUSIONS
The AES spectral background upon which the Auger peaks are superimposed is usually considered a hin- drance to quantitative analysis. However, as no exact method exists for the removal of the background, its elimination can introduce a significant element of uncer- tainty in the results. To alleviate this problem, a method of estimating the alloy composition corresponding to an unknown spectrum is described, which in fact utilizes the spectral background, as opposed to peak height or area, and so avoids the need for background removal with its consequent loss of accuracy. The spectrum syn- thesis suggested here goes beyond the linear addition of elemental spectra, which has no physical justification in theory, and is based on two non-linear expressions derived by the authors. The method has been applied to AuCu alloys and yielded encouraging results which agree well with the nominal composition. The good agreement suggests that the technique could be a useful tool for quantitative analysis in AES. The linear addi- tion formula is not expected to hold generally for other systems and the use of the non-linear addition might give better agreement with experiment in such cases.
At this stage, it is dificult to draw any general con- clusion about the applicability of the two derived expressions, and the final assessment should be made by further application to different systems, especially those in which the elemental system constituents exhibit a large difference in matrix effects (e.g. W,-,C, and W, -,Six alloys). Also, some pure elements (which include gases such as oxygen) cannot be studied using AES except as chemical compounds. The use of spec- trum synthesis might be useful in obtaining elemental Auger spectra for such inaccessible materials. Further- more, since AES analysis is usually carried out on a sputtered surface, it would be interesting to test the
model on systems in which preferential sputtering effects do exist. This may require the inclusion of the sputter- ing yield factors in the model, which could be cumber- some.
In summary, more work is needed to establish the limitations of this technique, but it promises to be a useful tool, at least for alloy systems in which no prefer- ential sputtering effects are observed.
Acknowledgement
The authors would like to thank Professor M. Prutton of the Physics Department for his valuable comments on the paper.
LIST OF SYMBOLS
k = analysing constant, which includes the ioniza- tion cross-section, escaping probability and the response function and is assumed to be com- position independent
I , = electron beam current 1, = inelastic mean free path of the alloy li = elemental inelastic mean free path N , = atomic density of the alloy R, = backscattering factor of the alloy Zi = atomic number Ri = elemental backscattering factor FT( = atomic weight pi = bulk density Navg = Avogadro's number mi =constant qi =constant E , E, = bandgap energy A =constant B =constant
= free electron plasmon energy
REFERENCES
1 . H. E. Bishop, Electron Beam Interactions with Solids for Microscopy, Microanalysis and Micro-lithography p. 259. SEM Inc., AMF O'Hare, IL (1982).
2. M . P. Seah, Surf. lnterface Anal. 9,85 (1 986). 3. M . P. Seah, Surf. Sci. 17, 132 (1 969). 4. E. N. Sickafus, Phys. Rev. B16, 14436 (19771). 5. E. N. Sickafus, Phys. Rev. B16, 14448 (197711). 6. D. A. Shirley, Phys. Rev. B5(12), 85 (1972). 7. S.Tougaard,Surf.lnterfaceAnal. 11, 510 (1988). 8. Y. E. Strausser, D. Franklin and P. Courtney, Thin Solid Films
84,145 (1981). 9. S. Ichimura, H. Koshikawa, 1. Sekine, K. Goto and R . Shirnizu,
Surf. lnterface Anal. 11, 94 (1 988). 10. J. I . Goldstein, D. E, Newbury, P. Echlin, D. C. Joy, C. Fiori
and E. Lifshin, in Scanning Electron Microscopy and X-ray Microanalysis, 2nd Edn, Chapt. 3, p. 11 0. Plenum Press, New York (1992).
11. D. R . Batchelor, H. E. Bishop and J. A. Venables, Surf. lnter- face Anal. 14, 709 (1 989).
12. E. H. Dar1ington.J. Phys. D 8, 85 (1972). 13. D. Peacock and J. P. Duraud, Surf. lnterface Anal. 8, 1
14. J. A. D. Matthew, W. C. Ross and M. M. El Gornati, lnsf. Phys.
15. J. A. D. Matthew, M. Prutton, M. M . El Gornati and D.
(1 986).
Conf. Ser. 130, 383 (1 992).
Peacock, Surf. lnterface Anal. 11, 173 (1 988).
16. M . Seah and G. C. Smith, Surf. lnterface Anal. 15, 751
17. T. Sekine, K. Hirata and A. Mogami, Surf. Sci. 125, 565
18. C. J. Powell, J . Electron Spectrosc. Relat. Phenom. 47, 197
19. C. J. Powell, Surf. Sci. 299/300, 34 (1994). 20. S. Tanuma, C. J. Powell and D. Penn, Surf. lnferface Anal. 15,
21. H. Bethe. Ann. Phys. 5,325 (1 930). 22. H. E. Bishop, J. Appl. Phys. (J. Phys. D ) 1 (2), 673 (1 968). 23. R . Shirnizu, Japanese J . Appl. Phys. 22, 1631 (1 983). 24. J. C. Greenwood, M. Prutton and R . Roberts, Phys. Rev.
649(18), 2485 (1994). 25. W. Farber, G. Betz and P. Braun, Nucl. Instrum. Methods 132,
778 (1 976). 26. H. Tornpkins, J . Vac. Sci. Techno/. 16, 778 (1 979). 27. S. lchimura and R. Shirnizu, Surf. Sci. 112, 386 (1982). 28. H. J. Kang, R. Shimizu and T. Okutani, Surf. Sci. 116, L173
29. R. Shimizu, Surf. lnferface Anal. 11, 510 (1988). 30. C. Jansson and P. Morgen, Surf. lnterface Anal. 15, 1 (1 990). 31. H. J. Kang, E. Kawatoh and R . Shirnizu, Surf. Sci. 144, 541
(1984). 32. 1. Tanurna, 1. Sekine, K. Yoshihara. R. Shimizu. T. Hornrna, H.
Tokutaka, K. Goto, M. Uernrnura, D. Fuhita, A. Kurokawa, S.
(1990).
(1 983).
(1988).
285 (1 990).
(1982).

172 T. A. EL BAKUSH AND M. M. EL GOMATI
Ichirnura, M. Oshima, M. Kudo, Y. Hashiguchi, T. Suzuki, T. Ohrnura, F. Soeda, K. Tanaka, Y. Shiokawa and T. Hayashi, Surf. lnterface Anal. 15,466 (1 990).
33. T. A. El Bakush and M. M. El Gornati, J. Electron Specfrosc. Relaf. Phenom.. 74, 1096 (1995).
34. M. M. El Gornati and T. A. El Bakush, Surf. lnferface Anal., 24, 152 (1996).
35. T. A. El Bakush, DPhil Thesis, University of York. (1 994). 36. R. Bevington, Data Reduction and Error Analysis for Physical
Sciences, McGraw-Hill (1 969).
37. H. W. Press, B. P. Flannery, S. A. Teukolsky and W. T. Vetter- ling, Numerical Recipies Cambridge University Press, Carn- bridge (1 992).
38. S. W. Gaarenstroorn, Appl. Surf. Sci. 7, 7 (1 981 ). 39. S. W. Gaarenstroorn, J. Vac. Sci. Techno/. 20,458 (1 982). 40. J. N. Fiedor, A. Proctr, M. Houalla and D. M. Hercules, Surf.
lnferface Anal. 20, 1 (1 993). 41. M. Crone, I. Barkshire and M. Prutton, Surf. lnferface Anal.
21,805 (1 994).