Embed Size (px)
Citation preview
Spectroscopy of Saturn
By Nick King

Purpose
Spectroscopic analysis of: Saturn Saturn’s Rings Titan
This process will determine the composition of these three objects

Saturn
6th planet from the Sun
Gas giant planet
9.4 times the diameter of Earth
9.5 AU from the Sun

Saturn’s Rings
First observed by Galileo
Extend as far as 81000 miles from Saturn’s center
Formed by thousands of “ringlets” of rock and debris orbiting the planet

Titan
Largest of Saturn’s collection of Moons
Nearly half the size of Earth
Holds an atmosphere even thicker than Earth’s

Gathering Data - Preparation
Starry Night Before going out to observe coordinates are
need to locate objects Saturn (observing)- RA: 7h 28m Dec: 22° 0’
Titan is essentially at the same coordinates
Procyon (reference)- RA: 7h 40m Dec: 5° 13’ The moon can be found without coordinates
Starry Night also confirms that these objects will be visible during the observing time

Gathering Data - Observing
Location: Rice Campus Observatory Near Entrance 13 on the North side of campus
Gathering Data - Observing
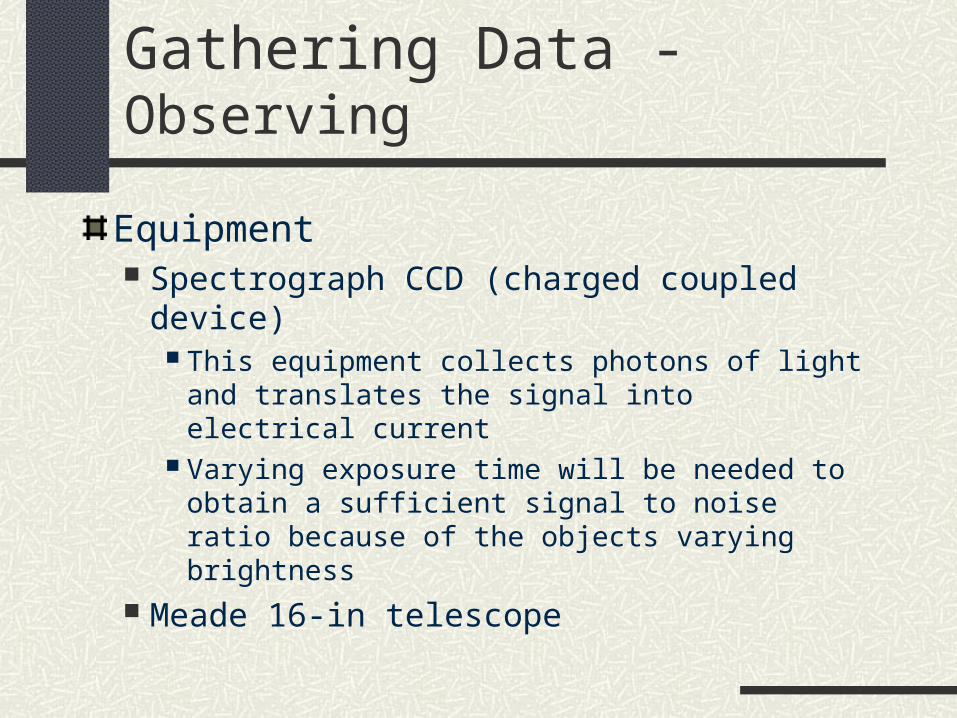
Equipment Spectrograph CCD (charged coupled device)
This equipment collects photons of light and translates the signal into electrical current
Varying exposure time will be needed to obtain a sufficient signal to noise ratio because of the objects varying brightness
Meade 16-in telescope

Gathering Data - Observing (cont.)
March 23, 2005
Conditions Clear Skies Slight Haze Near-full Moon Fairly windy
Constant breeze Occasional gusting
7:45 PM Measurements 22° C 29.85 mmHg 47% Humidity
10:00PM Measurements 18.5° C 29.91 mmHg 61% Humidity Less wind

Gathering Data – Observing (cont.)
Object Exposure Times in sec (#)
Saturn (rings included) 75 (4x)
Titan 300 (removed), 1500
Procyon 1 (2x)
Moon 3 (3x)
Dark Field 1 (3x), 3 (3x), 75 (3x), 1500 (3x)
Flat Field 50 (3x)
Neon Lamp 30

Gathering Data – Observing (cont.)
Problems Encountered Auto-guidance – problems initiating procedure for
moderate length exposure time Dome obstruction – needed to rotate the dome over long
exposure times to not obstruct view File format – saved first file under the incorrect format for
future use Truncated File Names – in transferring files from the
telescope to the Unix computers, all file names where truncated after 6 characters
Missing exposures – dark field exposures of 30 and 50 second length forgotten (neon and flat)

Data Preparation
1. Convert file format from .fits to .pixUse “imhead” to find information lost in truncated file name
2. Combine Dark field and Flat field exposures of the same exposure time
3. Scale a copy of the 75 sec Dark field into the missing 50 sec & 30 sec exposures
4. Object Image – Dark Image = ScienceThis procedure removes both the bias and dark current counts in the CCDSame exposure time required

Data Preparation (cont.)
5. Normalize the Flat field image by dividing by the mean pixel value
6. Flat-field all object images by dividing each by the normalized Flat field image
This procedure counters the variation that occurs over the surface of the CCD
7. Combining the Moon images (“imcombine” sum) creates an image that contains all the absorption information of the Earth’s atmosphere and the light reflected from the Sun
Referred to as the Solar image for this point on

Data Analysis - Extraction
1. Run interactive “apall” extraction of reference star Procyon
Background subtraction on
Set aperture size to fit width of star in image
2. Shift each Saturn image so the area where the spectrum will be taken falls over the same pixel locations as Procyon (“imshift”)
Saturn, Rings of Saturn
Data Analysis – Extraction (cont.)
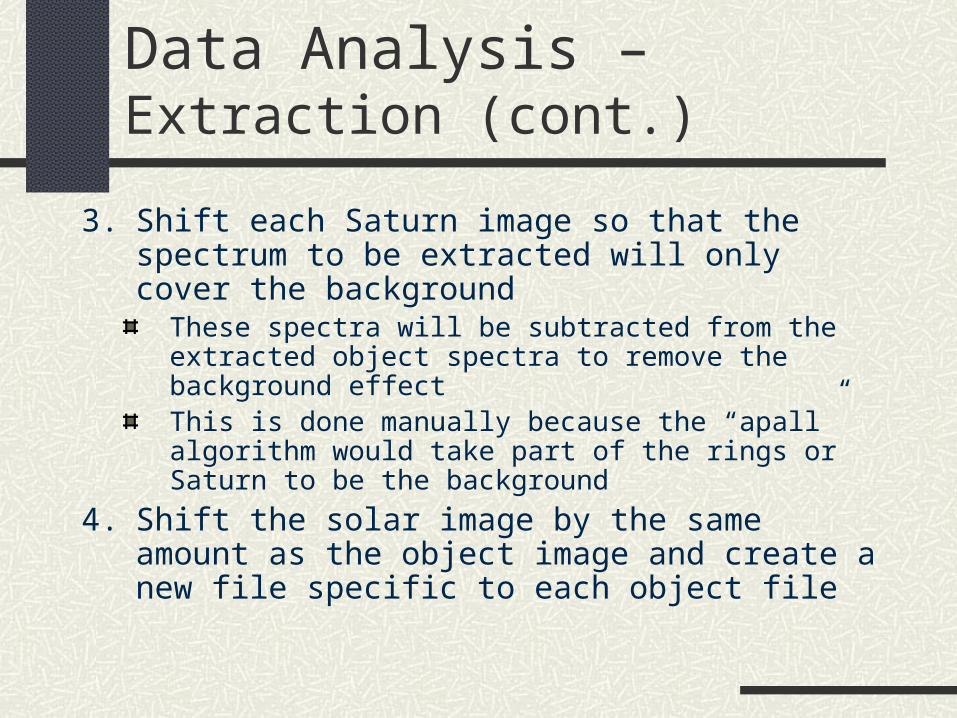
3. Shift each Saturn image so that the spectrum to be extracted will only cover the background
These spectra will be subtracted from the extracted object spectra to remove the background effectThis is done manually because the “apall” algorithm would take part of the rings or Saturn to be the background
4. Shift the solar image by the same amount as the object image and create a new file specific to each object file

Data Analysis – Extraction (cont.)
5. Shift the neon image by the same amount as the object image and create a new file specific to each object file
6. Use “apall” to extract a spectrum from each shifted image and its corresponding shifted solar and shifted neon images
Background subtraction is off because it will be done manually
Interactive controls are off
7. Subtract background spectrum from object spectra for each image
Data Analysis - Calibration
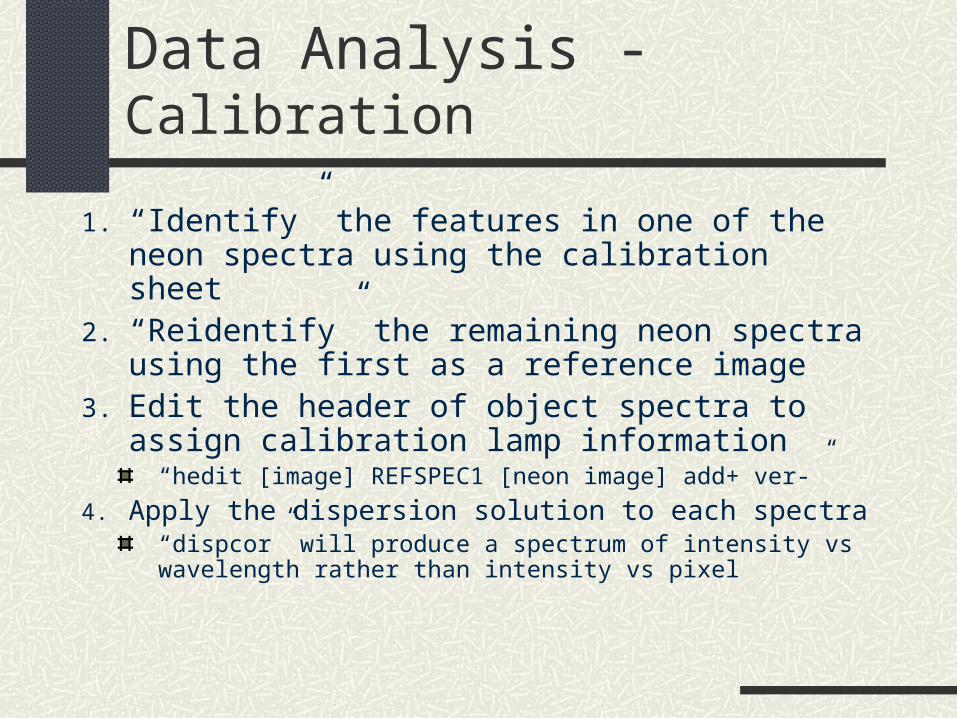
1. “Identify” the features in one of the neon spectra using the calibration sheet
2. “Reidentify” the remaining neon spectra using the first as a reference image
3. Edit the header of object spectra to assign calibration lamp information
“hedit [image] REFSPEC1 [neon image] add+ ver-”
4. Apply the dispersion solution to each spectra“dispcor” will produce a spectrum of intensity vs wavelength rather than intensity vs pixel

Data Analysis - Elimination
Spectral features are clearly visible in the object spectra, but some are due to atmospheric and solar effects
These can be removed using the solar spectra extracted earlier
The object spectrum and the solar spectrum must first be scaled
Data Analysis – Elimination (cont.)
1. Fit a continuum to each spectrum by using “splot” and selecting sections that don’t have features
2. Divide each spectrum by it respective continuum fit to obtain a spectrum scaled around the value of 1
3. Using the amplitude of one of the common spectral features in the object spectrum and the solar spectrum find the proper power to raise the solar spectrum to

Data Analysis – Elimination (cont.)
Multiplication can be performed using the “imarith” IRAF operationLogarithmic and exponential functions can be performed using the “imfunction” IRAF operationDivide the continuum scaled object spectrum by the continuum scaled and power adjusted solar spectrum Atmospheric and solar features should be almost if not completely
removed This process may need to be repeated if the spectra are not laterally aligned Lateral adjustments can be made using “imshift”

Data Analysis - Measurements
Once the atmospheric and solar effects are removed, absorption patterns from only the object will remain
Use known absorption wavelengths to identify these features
Using the functions in “splot”, find the equivalent widths of the remaining features to measure the relative strengths