Embed Size (px)
Citation preview

SPECTROSCOPY GROUP
Photonics WestFebruary 3, 2013
Brian C. Smith, Ph.D. ,Princeton Instruments Jason McClure, Ph.D. Princeton Instruments
Dan Heller, Ph.D. Memorial Sloan-Kettering Cancer CenterEd Gooding, Ph.D. Princeton Instruments
An Aberration Free Spectrograph for Improved Imaging and Spectra of Biological Samples
SPECTROSCOPY GROUP
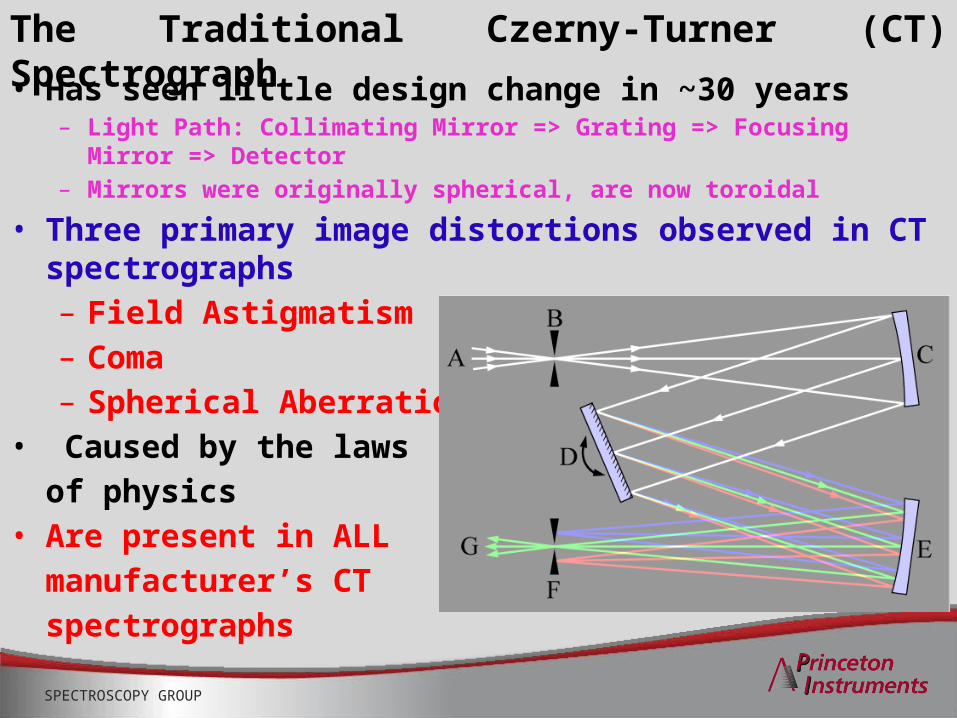
The Traditional Czerny-Turner (CT) Spectrograph
• Has seen little design change in ~30 years– Light Path: Collimating Mirror => Grating => Focusing Mirror
=> Detector– Mirrors were originally spherical, are now toroidal
• Three primary image distortions observed in CT spectrographs – Field Astigmatism– Coma– Spherical Aberration
• Caused by the laws of physics
• Are present in ALLmanufacturer’s CTspectrographs

SPECTROSCOPY GROUP
Traditional CT Spectrographs = Blurred Images
• The optical aberrations inherent in Czerny-Turner designs cause distorted images• Note decent imaging in the center. Blurring gets progressively worse towards sensor edges
- Vertical stack of fourteen 200 micron optical fibers stepped across the focal plane of a traditional CT spectrograph. 435 nm light, 1200 groove/mm grating, 300 mm focal length
SPECTROSCOPY GROUP
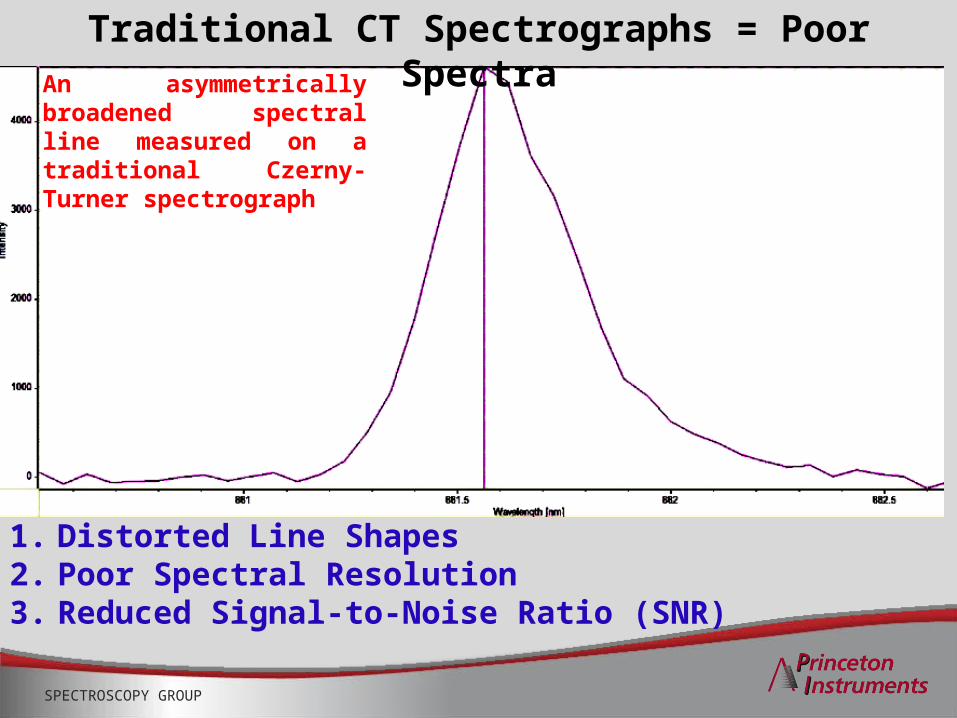
1. Distorted Line Shapes2. Poor Spectral Resolution3. Reduced Signal-to-Noise Ratio (SNR)
Traditional CT Spectrographs = Poor SpectraAn asymmetrically broadened spectral line measured on a traditional Czerny-Turner spectrograph
SPECTROSCOPY GROUP
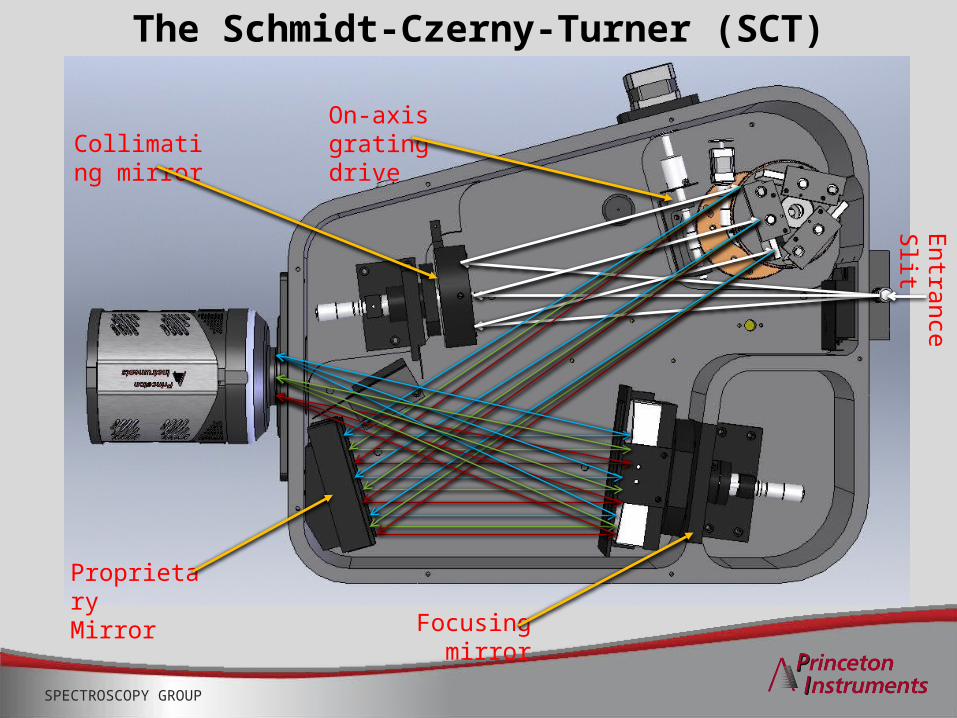
The Schmidt-Czerny-Turner (SCT) Spectrograph
Focusing mirror
Entrance S
lit
On-axis gratingdrive
Collimating mirror
ProprietaryMirror
SPECTROSCOPY GROUP
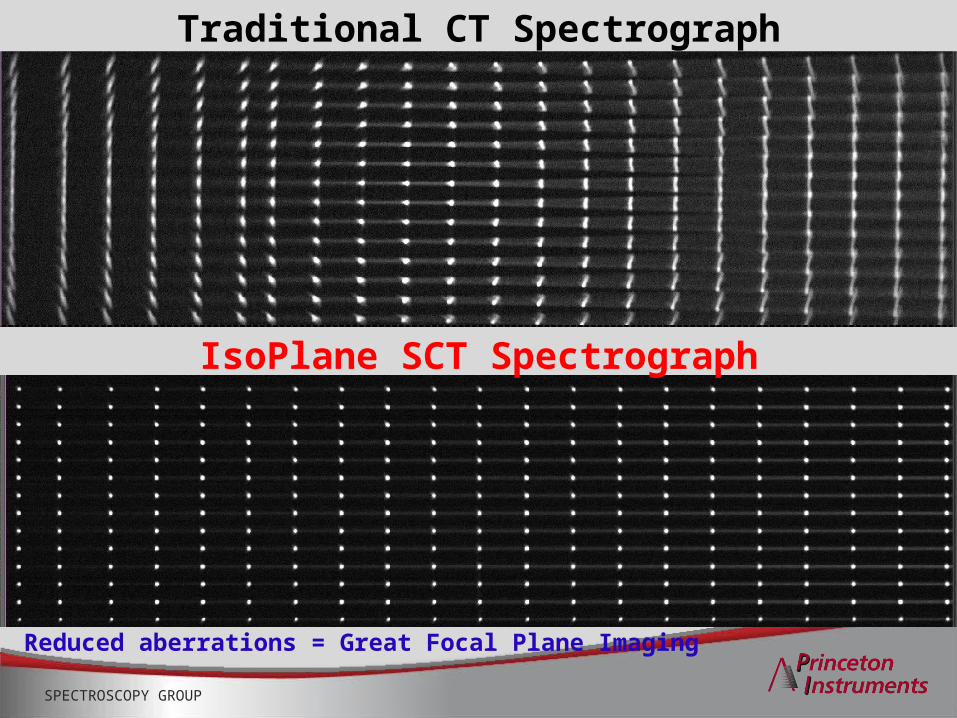
Reduced aberrations = Great Focal Plane Imaging
Traditional CT Spectrograph
IsoPlane SCT Spectrograph

SPECTROSCOPY GROUP
IsoPlane = Great Spectroscopy
IsoPlane vs. CTPixis 400BR
1200 gr/mm HVIS grating
CT 1 Row
SPECTROSCOPY GROUP
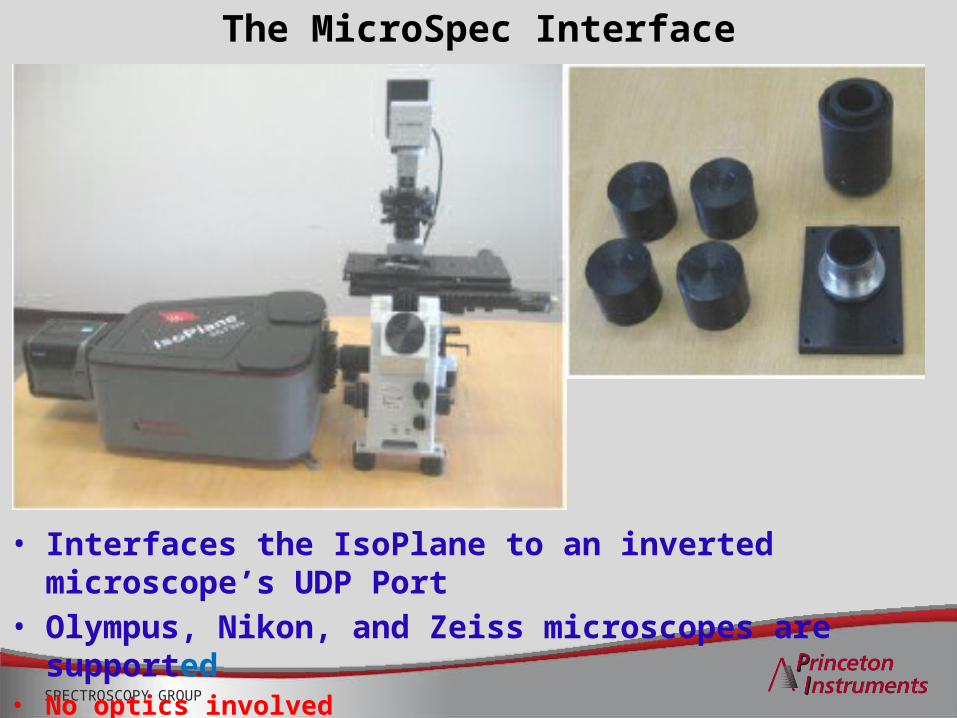
• Interfaces the IsoPlane to an inverted microscope’s UDP Port
• Olympus, Nikon, and Zeiss microscopes are supported
• No optics involved
The MicroSpec Interface

SPECTROSCOPY GROUP
NIR Fluorescence of Carbon Nanotubes
• Single-walled nanotubes 0.6-1.3 nm in diameter• ~100-2000 nm long, averaging ~500nm• Nanotubes are wrapped in a polymer
- Can vary polymer functionality- Proteins and nucleic acids can bind to the polymer
SPECTROSCOPY GROUP
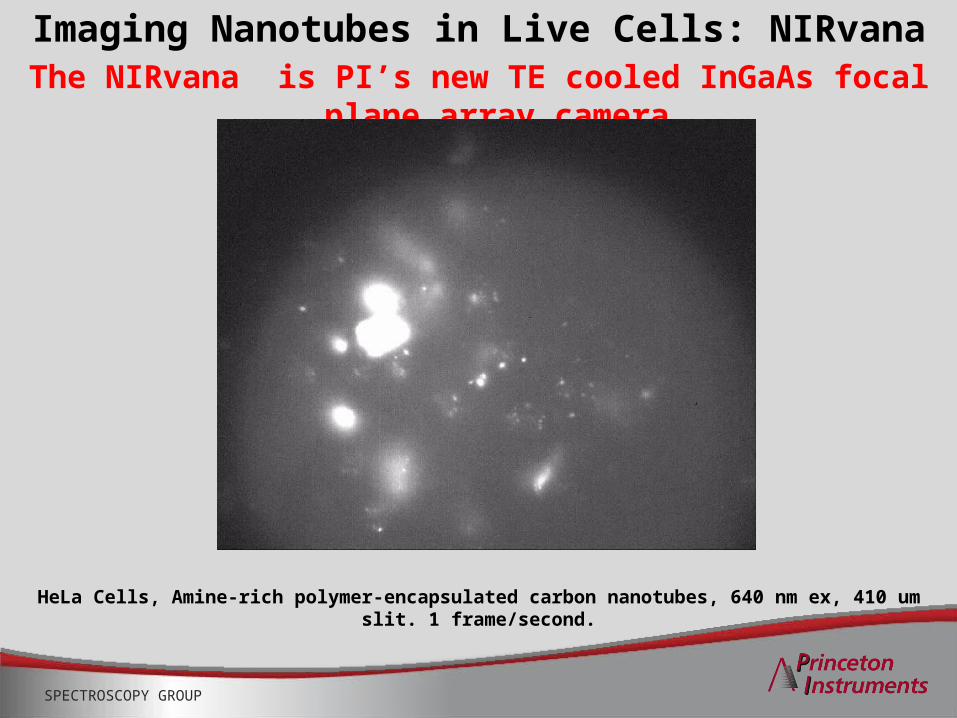
The NIRvana is PI’s new TE cooled InGaAs focal plane array cameraImaging Nanotubes in Live Cells: NIRvana
HeLa Cells, Amine-rich polymer-encapsulated carbon nanotubes, 640 nm ex, 410 um slit. 1 frame/second.

SPECTROSCOPY GROUP
Nanotubes are Transported Within Living Cells

SPECTROSCOPY GROUP
NIR Fluorescence Spectrum of a Nanotube
640 nm excitation,20 sec exposure time, 410 micron slits
Image of carbon nanotube centered on the IsoPlane slit
SPECTROSCOPY GROUP
Acknowledgements
• Trenton Engineering– Bill Asher– Harry Grannis– Bob Bolkus– Bill Hartman
• Acton Engineering• Ed Gooding
– Lloyd Wentzell– Bob Fancy– Mike Case– Paulo Goulart– Bob Jarratt
• Memorial Sloan Kettering Cancer Center– Januka Budhathoki-Uprety

SPECTROSCOPY GROUP
Outline• The Traditional Czerny-Turner (CT) imaging
spectrograph and its limitations
• The Schmidt-Czerny-Turner (SCT) spectrograph: The IsoPlane– Instrumentation– Data showing Reduction or Elimination of image aberrations– Improved imaging– Improved spectroscopy
• Near Infrared Fluorescence of Carbon Nanotubes in Live Cells

SPECTROSCOPY GROUP
Field Astigmatism• Cause: Using lenses or mirrors to image a source off axis • Affects on Imaging: Vertical or horizontal elongation of an
image e.g. The dreaded “Bow-Tie” effect
• Affects on spectroscopy: Limits both spectral and spatial resolution of a spectrograph. Is completely corrected only at the center of the focal plane.
Fourteen 200 micron diameter optical fibers, 1200 g/mm grating, 300 mm focal length.

SPECTROSCOPY GROUP
Coma• Cause: Using mirrors to image a source off axis • Affects on Imaging: Comet shaped tail on focused images or
spectral lines• Affects on spectroscopy: spectral lines are asymmetrically
broadened Limits spectral resolution of a spectrograph• Can only be completely corrected at one grating angle or
wavelength
An asymmetrically broadened spectral line
These are images of optical fibers, not Halley’s Comet!

SPECTROSCOPY GROUP
Spherical Aberration• Cause: Using spherical mirrors to focus light to form an image• Affects on Imaging: Diffuse symmetric blur about an image• Affects on spectroscopy: Limits both spatial and spectral
resolution of a spectrograph
Symmetric blur around the imageof a 150 micron diameter optical -fiber

SPECTROSCOPY GROUP
Traditional CT Spectrograph
IsoPlane SCT Spectrograph
Minus astigmatism, the Dreaded Bow Tie Effect is Gone
SPECTROSCOPY GROUP
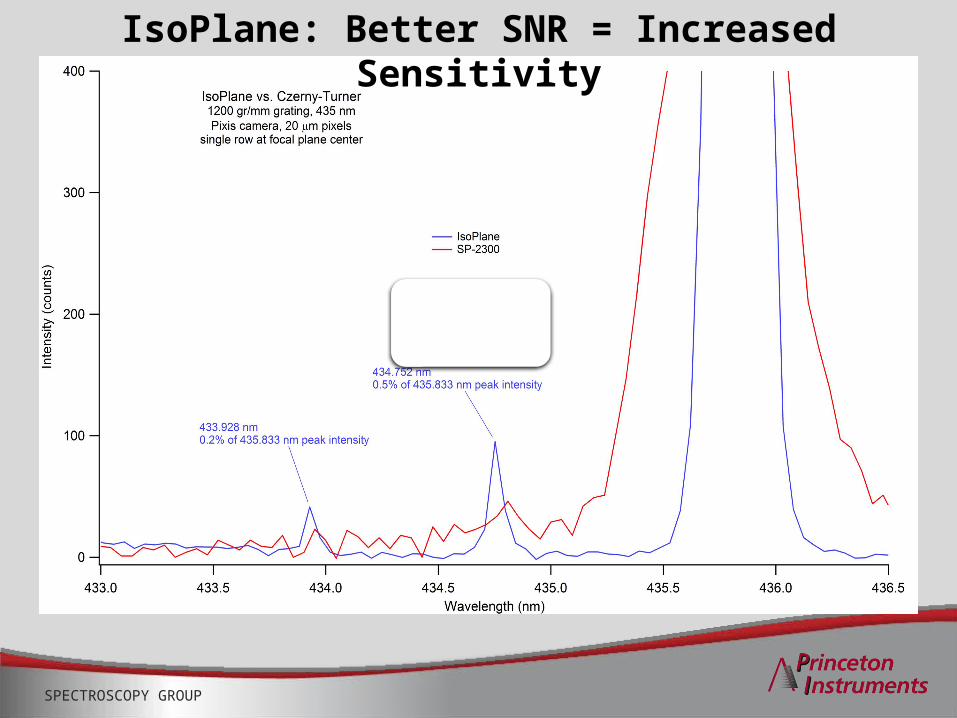
IsoPlane: Better SNR = Increased Sensitivity