Embed Size (px)
Citation preview
ISRN UTH-INGUTB-EX- KKI-2011/01-SE
Examensarbete 15 hpJuni 2011
Spectroscopic ellipsometry study on the oxide films formed on nickel-base alloys
in simulated boiling water reactor environments
Determination of oxide film thickness
Katja Göller
Teknisk- naturvetenskaplig fakultet UTH-enheten Besöksadress: Ångströmlaboratoriet Lägerhyddsvägen 1 Hus 4, Plan 0 Postadress: Box 536 751 21 Uppsala Telefon: 018 – 471 30 03 Telefax: 018 – 471 30 00 Hemsida: http://www.teknat.uu.se/student
Abstract
Spectroscopic ellipsometry study on the oxide filmsformed on nickel-base alloys in simulated boiling waterreactor environments. Determination of oxide filmthicknessKatja Göller
Corrosion-induced material degradation is one of the most serious issues formaterials used in light water nuclear reactors. In particular, oxide film thicknessmeasurement is crucial for deriving corrosion kinetics and therefore understandinggeneral corrosion mechanisms. Methods currently applied for corrosion studies aredestructive and require preparation of cross-section samples (TEM, FIB, and SEM). Inthis paper a trial study of applying spectroscopic ellipsometry, a non-destructivemethod, to measure oxide film thickness formed on some nickel-base alloys ispresented. Nickel-base welding materials Alloy 82, Alloy 182, Alloy 52M, and Alloy 152, werecorroded in simulated BWR conditions. Optical properties of some oxide species(NiFe2O4, NiO, Fe0.7Cr1.3O3) as found in the corrosion products do not exist inellipsometry database and need to be synthesized and measured with spectroscopicellipsometry. A simple model with only a few modeling parameters is applied todetermine the oxide film thickness. The good fit of periodicity of the measured datawith the model is achieved in first hand and then the MSE is decreased by fine-tuningthe model for the best fit.
The present work has demonstrated that the ellipsometry methods are promising inobtaining oxide thickness data. To increase the measuring accuracy one may need tohave samples with smaller surface roughness prior to corrosion study and useimproved reference ellipsometric data.
KKI-2011/01-SEExaminator: Michael ÖsterlundÄmnesgranskare: Dr. Mattias Klintenberg Handledare: Dr. Jiaxin Chen (Studsvik Nuclear AB)
1
Table of Contents Abstract ................................................................................................................................. 2
Acknowledgments ................................................................................................................. 3
1. Introduction ....................................................................................................................... 4
1.1 Objective of this work ................................................................................................... 4
1.2 General applications of nickel-base alloys in light water reactors ................................. 4
1.2.1 Alloy 82 and Alloy 182 ........................................................................................... 5
1.2.2 Alloy 52M and Alloy 152 ........................................................................................ 5
1.3 Corrosion studies of nickel-base alloys ........................................................................ 6
1.3.1 TEM, FIB, SEM ..................................................................................................... 6
1.3.2 Need for new method for oxide film characterization ............................................. 6
2. Spectroscopic Ellipsometry (SE) ........................................................................................ 7
2.1 Principles of Spectroscopic Ellipsometry ...................................................................... 7
2.2 Modeling ...................................................................................................................... 9
2.3 Instrumentation ...........................................................................................................11
3. Experimental ....................................................................................................................13
3.1 Materials .....................................................................................................................13
2.1.1 NiO ......................................................................................................................13
2.1.2 Fe0.7Cr1.3O3 ..........................................................................................................13
2.1.3 NiFe2O4 ...............................................................................................................14
3.2 X-ray powder diffraction (XRD) ...................................................................................14
4. Results and discussion .....................................................................................................16
4.1 Evaluation ...................................................................................................................24
4.2 Sources of error ..........................................................................................................26
6. Conclusion .......................................................................................................................27
7. Future work ......................................................................................................................27
References ...........................................................................................................................28
Figure list ..............................................................................................................................30
Table list ...............................................................................................................................30
Equation list ..........................................................................................................................30
Appendix ..............................................................................................................................31
Chemical composition of A82, A182, A52M, A152 ............................................................31
X-ray diffraction intensities ................................................................................................32
Index spectra oxide references .........................................................................................33
2
Abstract
Spectroscopic ellipsometry study on the oxide films formed on nickel-base alloys in simulated boiling water reactor environments - Determination of oxide film thickness
Katja Göller
Corrosion-induced material degradation is one of the most serious issues for materials used in light water nuclear reactors. In particular, oxide film thickness measurement is crucial for deriving corrosion kinetics and therefore understanding general corrosion mechanisms. Methods currently applied for corrosion studies are destructive and require preparation of cross-section samples (TEM, FIB, and SEM). In this paper a trial study of applying spectroscopic ellipsometry, a non-destructive method, to measure oxide film thickness formed on some nickel-base alloys is presented.
Nickel-base welding materials Alloy 82, Alloy 182, Alloy 52M, and Alloy 152, were corroded in simulated BWR conditions. Optical properties of some oxide species (NiFe2O4, NiO, Fe0.7Cr1.3O3) as found in the corrosion products do not exist in ellipsometry database and need to be synthesized and measured with spectroscopic ellipsometry. A simple model with only a few modeling parameters is applied to determine the oxide film thickness. The good fit of periodicity of the measured data with the model is achieved in first hand and then the MSE is decreased by fine-tuning the model for the best fit.
The present work has demonstrated that the ellipsometry methods are promising in obtaining oxide thickness data. To increase the measuring accuracy one may need to have samples with smaller surface roughness prior to corrosion study and use improved reference ellipsometric data.
Keywords: nickel-base, alloys, Inconel, corrosion, spectroscopic ellipsometry, IR-ellipsometry, ellipsometry, oxide films, BWR, Alloy 52M, Alloy 152, Alloy 182, Alloy 82
Handledare: Dr. Jiaxin Chen (Studsvik Nuclear AB) Examinator: Michael Österlund Ämnesgranskare: Dr. Mattias Klintenberg ISRN-nummer: KKI-2011/01-SE

3
Acknowledgments
I would like to express my sincere thanks to Dr. Jiaxin Chen (Studsvik Nuclear AB) and Prof. Hans Arwin (Linköping University) who have supervised this work. Thanks as also due to Dr. Mattias Klintenberg, Mr. Wei Xia and Mr. Anders Lund at Uppsala University who provided assistance in oxide synthesis work. I am also grateful for Maria Hövling and Fariborz Kananizadeh who helped with X-ray powder diffraction study at Studsvik Nuclear AB. Roger Magnusson at Linköping University is acknowledged for assistance with measurements.
4
1. Introduction
1.1 Objective of this work
Corrosion-induced material degradation is one of the most serious issues for materials used in light water nuclear reactors. A large effort has been devoted to understand the mechanism of corrosion-induced material cracking and radioactivity buildup in nuclear power plants. To characterize oxide film properties, such as elemental and phase composition, microstructures, oxide thickness and its change with time, oxide release into the coolant, is an essential step in such an effort. In particular, oxide film thickness measurement is crucial for deriving corrosion kinetics and therefore understanding general corrosion mechanisms.
Oxide films formed on various reactor materials are usually very thin. In the past, electron microscopy method, such as Transmission Electron Microscopy (TEM), and Scanning Electron Microscopy (SEM) were applied to study the oxide films and measure oxide film thickness. These methods are destructive, requiring preparation of cross-section samples. In case of TEM sample preparation by Focused Ion Beam (FIB), the selection of sampling location and its representativeness is critical. It is often not practical to make many cross-section TEM samples for oxide film thickness measurement. There are also cases that oxide film is too thin to be prepared for thickness measurement by electron microscopy technique. To facilitate non-destructive oxide film thickness measurement for corrosion study, an alternative method must be sought for.
Spectroscopic ellipsometry is a well established non-destructive method for studying thin film properties including thickness determination. Under some ideal conditions very high precision can be achieved. To my knowledge, this technique has not previously been applied to study oxide films formed on reactor materials. In this paper a trial study of applying spectroscopic ellipsometry to measure oxide film thickness formed on some nickel-base alloys are presented. These materials, Alloy 82, Alloy 182, Alloy 52M, and Alloy 152, were corroded in simulated BWR conditions. The objective has been to evaluate this method for oxide thickness measurement.
1.2 General applications of nickel-base alloys in light water reactors
Alloys 600, Alloy 690, Alloy 82, Alloy 182, Alloy 52M and Alloy 152 are important nickel-base alloys. Alloys 600 and 690 are construction materials in BWR and also often used as steam generator tubing materials in pressurized water reactors (PWR). Alloys 82 and 182 are commonly used as welding materials for BWR reactor components and Alloys 52M and 152 are used as welding materials for PWR´ reactor components. Today Alloys 52M and 152 are not used in Swedish BWRs but their corrosion behavior is being examined in such environment [9].
5
1.2.1 Alloy 82 and Alloy 182
Nickel-base Alloy 600 is used as construction material in BWRs and its welding materials are Alloy 82 and Alloy 182. They are used to join dissimilar metal weld like carbon steel – stainless steel, carbon steel – nickel-base, and stainless steel – nickel-base. [15]
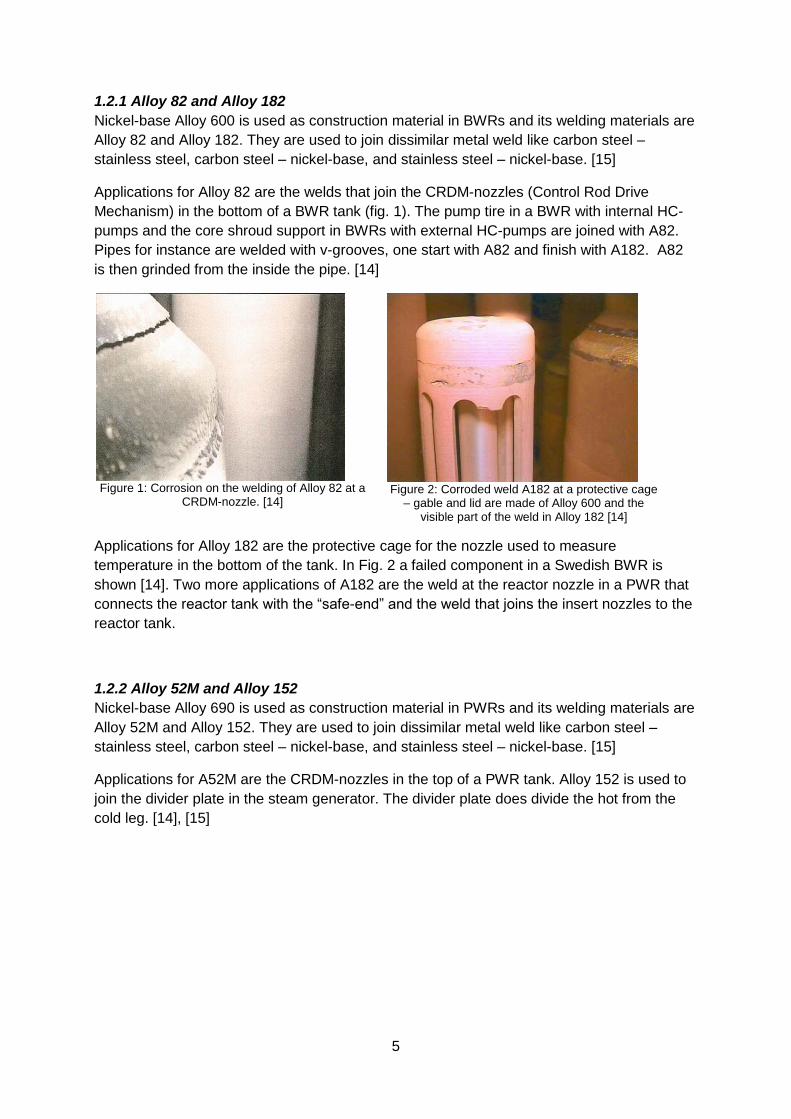
Applications for Alloy 82 are the welds that join the CRDM-nozzles (Control Rod Drive Mechanism) in the bottom of a BWR tank (fig. 1). The pump tire in a BWR with internal HC-pumps and the core shroud support in BWRs with external HC-pumps are joined with A82. Pipes for instance are welded with v-grooves, one start with A82 and finish with A182. A82 is then grinded from the inside the pipe. [14]
Figure 1: Corrosion on the welding of Alloy 82 at a
CRDM-nozzle. [14]
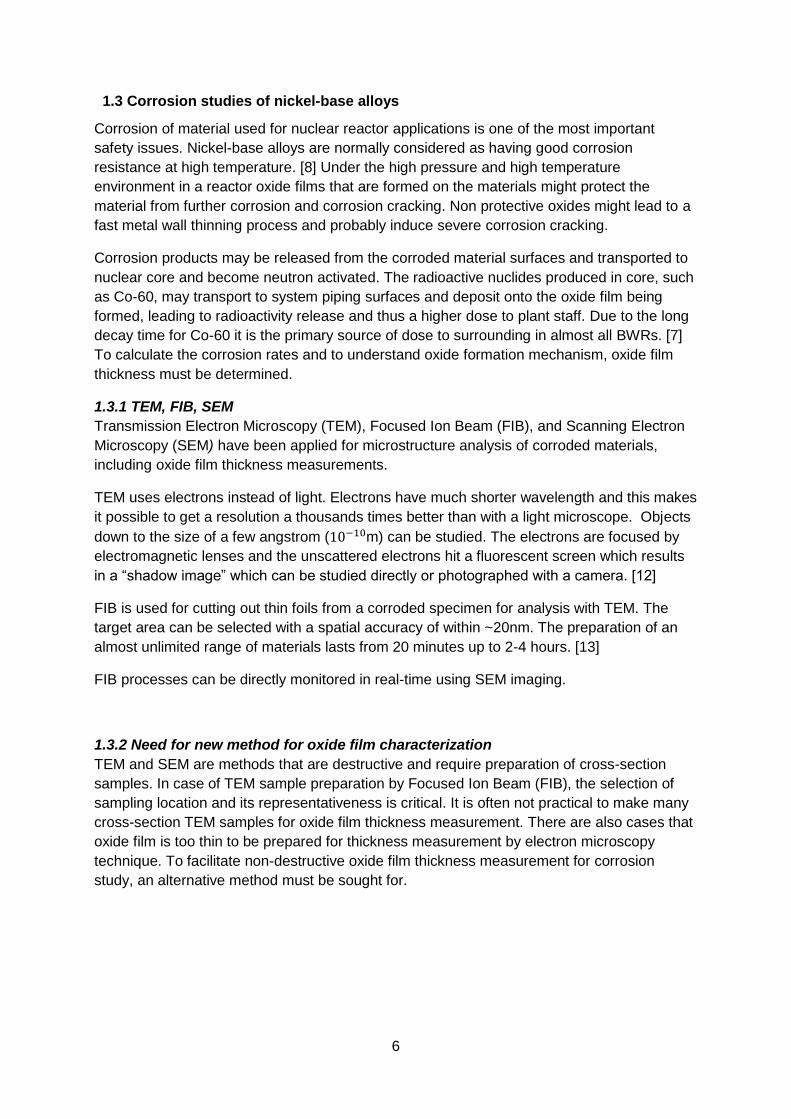
Figure 2: Corroded weld A182 at a protective cage
– gable and lid are made of Alloy 600 and the visible part of the weld in Alloy 182 [14]
Applications for Alloy 182 are the protective cage for the nozzle used to measure temperature in the bottom of the tank. In Fig. 2 a failed component in a Swedish BWR is shown [14]. Two more applications of A182 are the weld at the reactor nozzle in a PWR that connects the reactor tank with the “safe-end” and the weld that joins the insert nozzles to the reactor tank.
1.2.2 Alloy 52M and Alloy 152
Nickel-base Alloy 690 is used as construction material in PWRs and its welding materials are Alloy 52M and Alloy 152. They are used to join dissimilar metal weld like carbon steel – stainless steel, carbon steel – nickel-base, and stainless steel – nickel-base. [15]
Applications for A52M are the CRDM-nozzles in the top of a PWR tank. Alloy 152 is used to join the divider plate in the steam generator. The divider plate does divide the hot from the cold leg. [14], [15]
6
1.3 Corrosion studies of nickel-base alloys
Corrosion of material used for nuclear reactor applications is one of the most important safety issues. Nickel-base alloys are normally considered as having good corrosion resistance at high temperature. [8] Under the high pressure and high temperature environment in a reactor oxide films that are formed on the materials might protect the material from further corrosion and corrosion cracking. Non protective oxides might lead to a fast metal wall thinning process and probably induce severe corrosion cracking.
Corrosion products may be released from the corroded material surfaces and transported to nuclear core and become neutron activated. The radioactive nuclides produced in core, such as Co-60, may transport to system piping surfaces and deposit onto the oxide film being formed, leading to radioactivity release and thus a higher dose to plant staff. Due to the long decay time for Co-60 it is the primary source of dose to surrounding in almost all BWRs. [7] To calculate the corrosion rates and to understand oxide formation mechanism, oxide film thickness must be determined.
1.3.1 TEM, FIB, SEM
Transmission Electron Microscopy (TEM), Focused Ion Beam (FIB), and Scanning Electron Microscopy (SEM) have been applied for microstructure analysis of corroded materials, including oxide film thickness measurements.
TEM uses electrons instead of light. Electrons have much shorter wavelength and this makes it possible to get a resolution a thousands times better than with a light microscope. Objects down to the size of a few angstrom ( m) can be studied. The electrons are focused by electromagnetic lenses and the unscattered electrons hit a fluorescent screen which results in a “shadow image” which can be studied directly or photographed with a camera. [12]
FIB is used for cutting out thin foils from a corroded specimen for analysis with TEM. The target area can be selected with a spatial accuracy of within ~20nm. The preparation of an almost unlimited range of materials lasts from 20 minutes up to 2-4 hours. [13]
FIB processes can be directly monitored in real-time using SEM imaging.
1.3.2 Need for new method for oxide film characterization
TEM and SEM are methods that are destructive and require preparation of cross-section samples. In case of TEM sample preparation by Focused Ion Beam (FIB), the selection of sampling location and its representativeness is critical. It is often not practical to make many cross-section TEM samples for oxide film thickness measurement. There are also cases that oxide film is too thin to be prepared for thickness measurement by electron microscopy technique. To facilitate non-destructive oxide film thickness measurement for corrosion study, an alternative method must be sought for.
7
2. Spectroscopic Ellipsometry (SE)
Ellipsometry is a technique developed a long time ago. Paul Drude, a German physicist, provided the theoretical basis for ellipsometry in the late 1800s and performed experiments to determine optical properties of metals [17-18]. Since a large quantity of data processing is required to evaluate the received data, the technique has found a real application in modern era dates from the mid-1970s due to availability of computers. [4]
Today ellipsometry is one of the best techniques for characterization of the optical properties of materials. [1] Ellipsometry has found applications in many different fields, from semiconductor physics to microelectronics and biology, from basic research to industrial applications. [19]
With SE the optical properties of solids and single surface films or multilayers can be determined. It can measure film thickness from a monolayer of atoms to several micrometers [1]. More recent real-time spectroscopic ellipsometry as an in situ diagnostic tool for on-line monitoring of thin film growth processes has found wide-spread implementations in industry [4, p. 201]. There are also applications such as compositional analysis, in situ control of growth processes, and various types of dynamical processes. Other properties of interest such as refractive index, surface roughness, cristallinity, anisotropy, and uniformity can also be determined with SE. [2]
2.1 Principles of Spectroscopic Ellipsometry
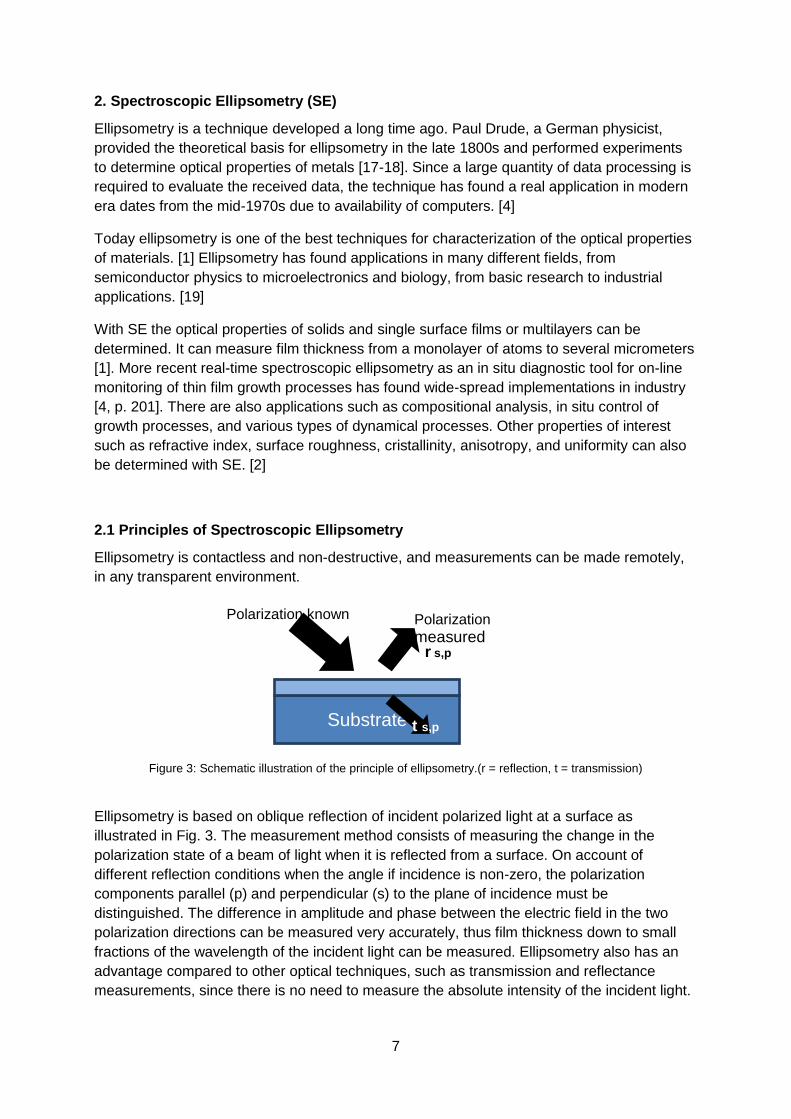
Ellipsometry is contactless and non-destructive, and measurements can be made remotely, in any transparent environment.
Figure 3: Schematic illustration of the principle of ellipsometry.(r = reflection, t = transmission)
Ellipsometry is based on oblique reflection of incident polarized light at a surface as illustrated in Fig. 3. The measurement method consists of measuring the change in the polarization state of a beam of light when it is reflected from a surface. On account of different reflection conditions when the angle if incidence is non-zero, the polarization components parallel (p) and perpendicular (s) to the plane of incidence must be distinguished. The difference in amplitude and phase between the electric field in the two polarization directions can be measured very accurately, thus film thickness down to small fractions of the wavelength of the incident light can be measured. Ellipsometry also has an advantage compared to other optical techniques, such as transmission and reflectance measurements, since there is no need to measure the absolute intensity of the incident light.
Substrate Surface layer
Polarization known Polarization measured
r s,p
t s,p
8
Maxwell‟s equation describes the reflection and transmission of light by a plane interface between two media with different refractive indices. [1]
=
Equation 1: The complex refractive index
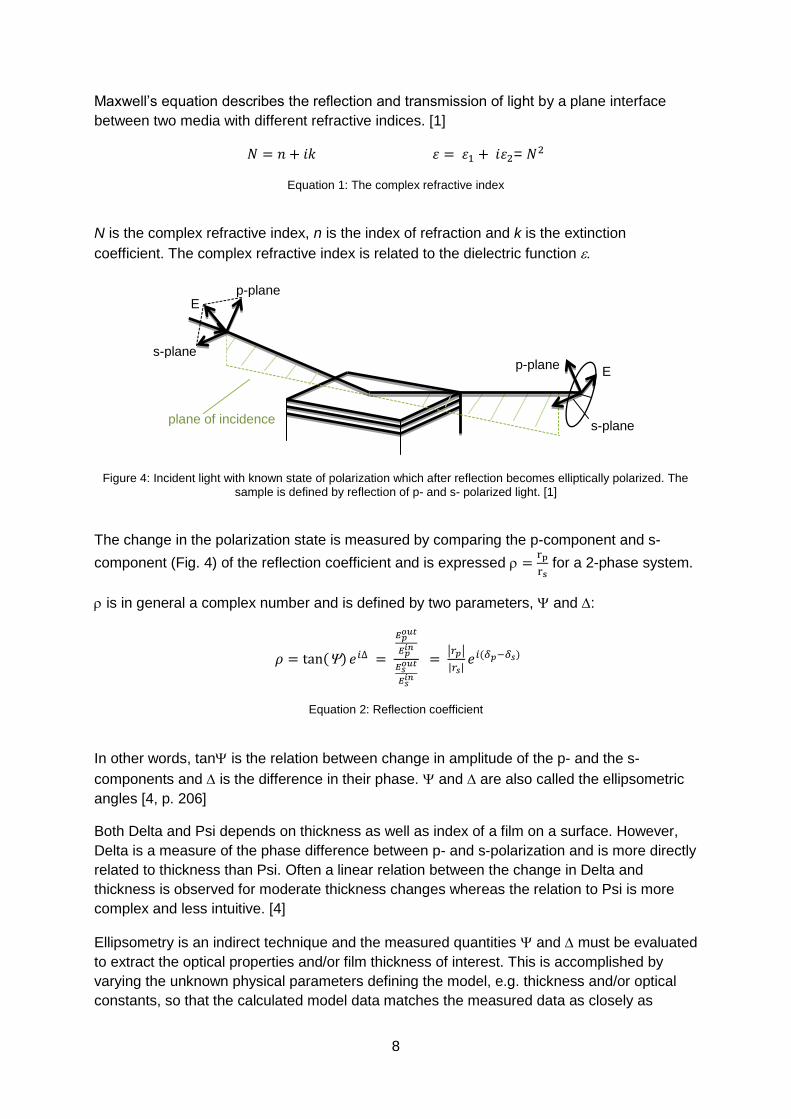
N is the complex refractive index, n is the index of refraction and k is the extinction coefficient. The complex refractive index is related to the dielectric function .
Figure 4: Incident light with known state of polarization which after reflection becomes elliptically polarized. The sample is defined by reflection of p- and s- polarized light. [1]
The change in the polarization state is measured by comparing the p-component and s-component (Fig. 4) of the reflection coefficient and is expressed
for a 2-phase system.
is in general a complex number and is defined by two parameters, and :
Equation 2: Reflection coefficient
In other words, tan is the relation between change in amplitude of the p- and the s- components and is the difference in their phase. and are also called the ellipsometric angles [4, p. 206]
Both Delta and Psi depends on thickness as well as index of a film on a surface. However, Delta is a measure of the phase difference between p- and s-polarization and is more directly related to thickness than Psi. Often a linear relation between the change in Delta and thickness is observed for moderate thickness changes whereas the relation to Psi is more complex and less intuitive. [4]
Ellipsometry is an indirect technique and the measured quantities and must be evaluated to extract the optical properties and/or film thickness of interest. This is accomplished by varying the unknown physical parameters defining the model, e.g. thickness and/or optical constants, so that the calculated model data matches the measured data as closely as
p-plane
s-plane
E
plane of incidence
p-plane
s-plane
E
9
possible. If then an acceptable fit is obtained the model hopefully will represent the true physical structure of the sample under study.
In SE experiments, and versus photon energy (or wavelength) are measured at one or several angles of incident. [4, p. 207]
2.2 Modeling
In order to relate the ellipsometric parameters and measured by spectroscopic ellipsometry to the actual characteristics of the sample, a model of the sample must be constructed from which modeled ellipsometric parameters and can be calculated.
and are calculated as functions of wavelength and angle of incidence for the sample under study with an assumed structure (model) using the appropriate Fresnel equations and a proper multilayer stack calculation. The parameters in the calculation are the thickness of each layer, the indices of refraction of each layer, and the fractions of constituents of any particular layer containing more than one material. The calculated and are then used in a procedure of fitting the calculated data to the experimentally measured data with an appropriate numerical fit algorithm.
Thus, mathematical analysis of spectroscopic ellipsometry data involves construction of a model for the actual sample and a fitting procedure to determine the fitted parameters, their associated errors, and a measure of how good the fit is.
In this paper the Levenberg-Marquardt algorithm is used to fit the model parameters to the measured and , by minimizing (best fit) this weighted (biased) test function
Equation 3: Levenberg-Marquardt algorithm
Where N is the number of measured and pairs, M is the total number of real valued fit parameters, and
and are the standard deviations of and . The standard
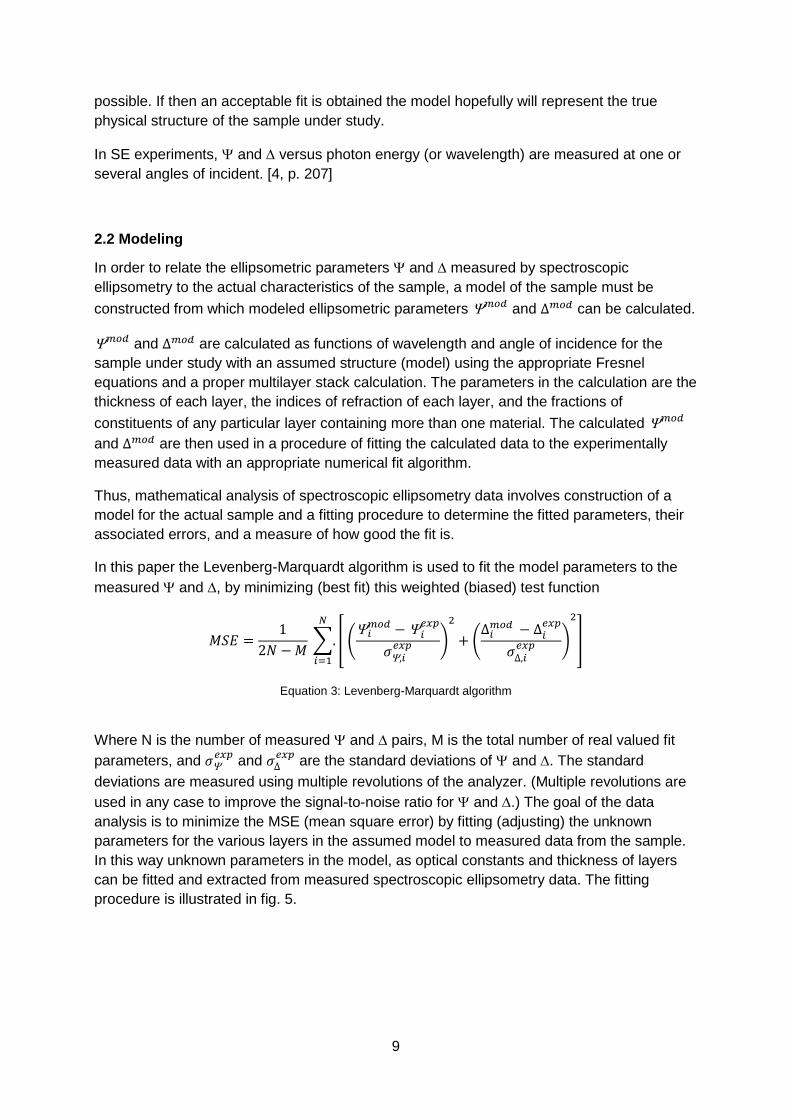
deviations are measured using multiple revolutions of the analyzer. (Multiple revolutions are used in any case to improve the signal-to-noise ratio for and .) The goal of the data analysis is to minimize the MSE (mean square error) by fitting (adjusting) the unknown parameters for the various layers in the assumed model to measured data from the sample. In this way unknown parameters in the model, as optical constants and thickness of layers can be fitted and extracted from measured spectroscopic ellipsometry data. The fitting procedure is illustrated in fig. 5.
10
Figure 5: Illustration of the fitting procedure for analysis of ellipsometric data. [1]
Determining oxide thickness
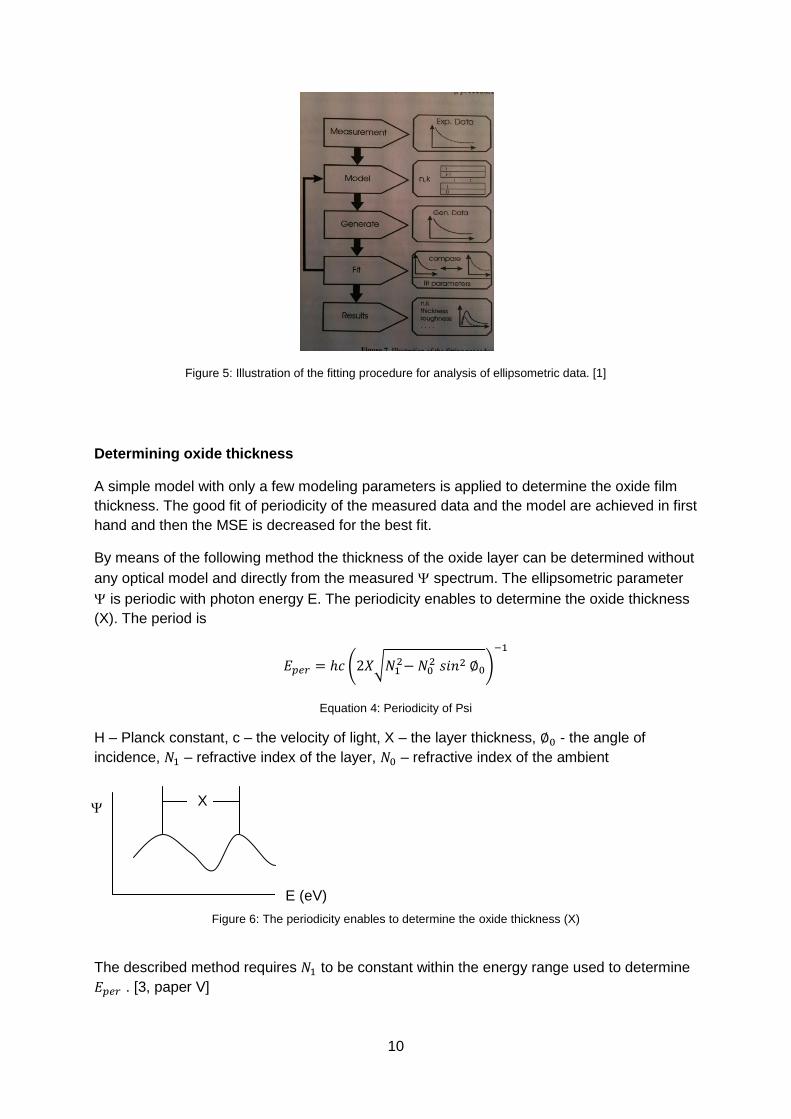
A simple model with only a few modeling parameters is applied to determine the oxide film thickness. The good fit of periodicity of the measured data and the model are achieved in first hand and then the MSE is decreased for the best fit.
By means of the following method the thickness of the oxide layer can be determined without any optical model and directly from the measured spectrum. The ellipsometric parameter is periodic with photon energy E. The periodicity enables to determine the oxide thickness (X). The period is
Equation 4: Periodicity of Psi
H – Planck constant, c – the velocity of light, X – the layer thickness, - the angle of incidence, – refractive index of the layer, – refractive index of the ambient
Figure 6: The periodicity enables to determine the oxide thickness (X)
The described method requires to be constant within the energy range used to determine . [3, paper V]
X
E (eV)
11
A more detailed interpretation of micro structural details requires that an optical model be defined. The modeling parameters are oxide film thickness (d), surface roughness, layer non-uniformity and EMA. The oxidized alloys in this paper are inhomogeneous materials for which the effective medium approximation (EMA) models are useful. Besides for composite materials EMA can be applied for other inhomogeneous structures like porous materials, surface roughness, layers with nanotips and more. EMA requires that the inhomogeneities are much smaller (10 times) than the wavelength of the light and further that there are at least two different materials in randomly mixed small volumes which can be assigned optical properties and have defined values on their . [4, p. 44 f]
2.3 Instrumentation
Measurements are made with an IR-ellipsometer. The ambient is air. Ellipsometry can be applied if the quote of the thickness of the roughness layer and the wavelength is much less than 1. A quote that is bigger than 1 will result in scattering. Hence IR-ellipsometry was applied for all four specimens. Measurements with IR-ellipsometer are modeled within wavelength range 4000nm -30000nm. The angle of incident is 70°.
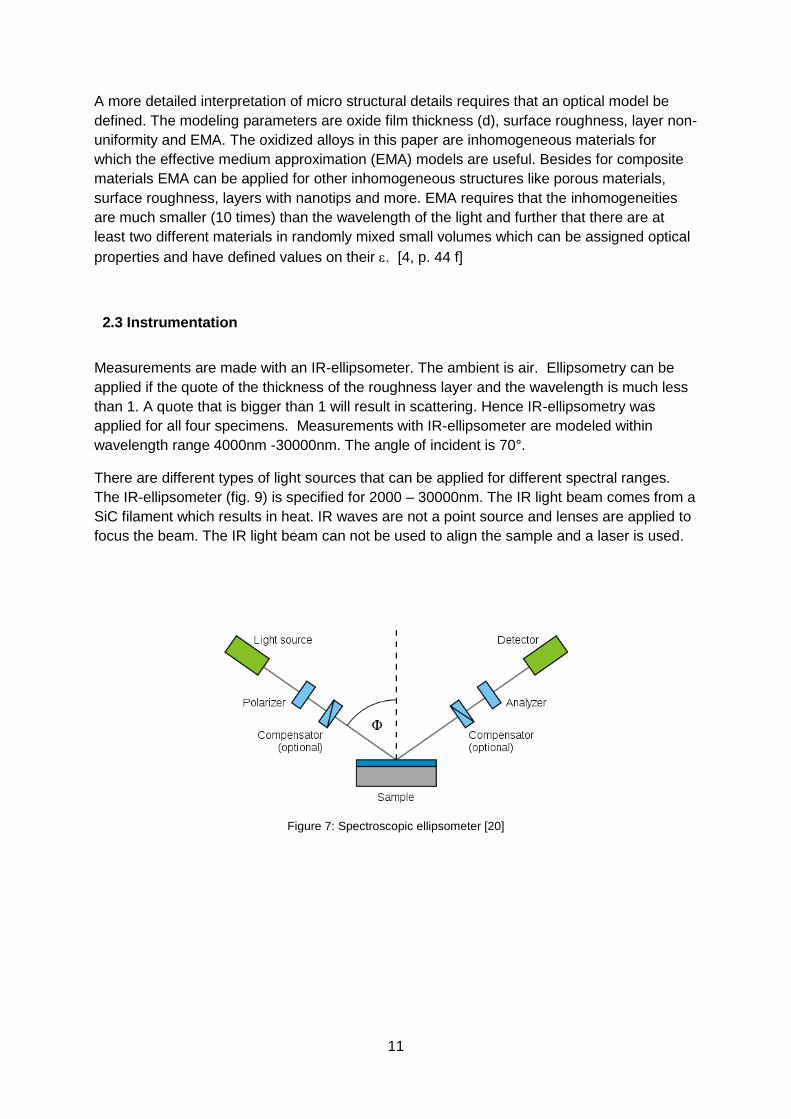
There are different types of light sources that can be applied for different spectral ranges. The IR-ellipsometer (fig. 9) is specified for 2000 – 30000nm. The IR light beam comes from a SiC filament which results in heat. IR waves are not a point source and lenses are applied to focus the beam. The IR light beam can not be used to align the sample and a laser is used.
Figure 7: Spectroscopic ellipsometer [20]

12
Figure 8: Spectroscopic ellipsometer at Linköping University
Figure 9: IR-ellipsometer at Linköping University
The infrared ellipsometer is of a rotating compensator type and the ellipsometer used in the mapping studied is a dual rotating compensator ellipsometer. Analysis was performed with the software CompleteEASE. Instrument and software are from J. A. Woollam Co., Inc..
13
3. Experimental
The data acquisition with SE is followed by a modeling process. In order to gain a proper model one need to determine the optical properties of the oxide films and the substrate. Either the data can be obtained directly from the database or specimens must be prepared and the optical properties determined.
3.1 Materials
The test coupons are corroded Alloy 82, Alloy 182, Alloy 52M, and Alloy 152. They have a dimension of 20x5 mm. The specimens were prepared in a previous project (10m/s: Alloy 82, Alloy 182 and 18 m/s: Alloy 52M, Alloy 152) by autoclave exposure under simulated BWR water environments (285ºC, 500 ppb [H2O2], flow velocity of approx. 10-18 m/s for four to five weeks). Before exposure in an autoclave the surfaces of all materials were fine-polished down to 4000-mesh finish under water-cooling with SiC grinding papers, thereafter scratched purposely by using a rough sand paper for latter visual inspection after corrosion testing. More detailed information about corrosion testing conditions may be found in reference [11].
Optical properties of some oxide species as found in the corrosion products do not exist in ellipsometry database and needed to be synthesized and measured with spectroscopic ellipsometry. In the following raw chemical and synthesis procedures for each needed oxide is described.
2.1.1 NiO
A monolithic oxide sample is prepared. The raw chemical, nickel monoxide, CAS number 1313-99-1, is a green crystalline solid and has a melting point of 1955 °C. [10]
A volume of 10.311g of NiO (99.998%) was weighed and pressed into a pellet with a force of 60kN. It is then sintered at 1200 °C under atmospheric pressure. The temperature is increased slowly with maximum 5°C per minute, and held at 1200 °C for 10 hours, followed by natural cooling in the furnace to room temperature.
After sintering the pellet sample was polished down to 6 m, using diamond fluid, and cleaned in acetone and in ethanol in an ultrasonic bath. Due to porosity polishing down to the fineness of 1m was assumed to not result in a better surface.
2.1.2 Fe0.7Cr1.3O3
This phase is a solid solution between hematite (Fe2O3) and green chromic oxide (Cr2O3).
Chromium(III) oxide (Cr2O3) is identified by CAS number 1308-38-9.The supplier is Merck with product number 1024831000. Ferric oxide (Fe2O3) is identified by CAS number 1309-37-1. The supplier is J.T. Baker Chemical Co., Phillipsburg, New Jersey.
In this paper 2.2626g of Fe2O3 was mixed with 4.0008g of Cr2O3, adding ethanol and using a shaker-mixer. The mixture of both phases resulted in a brown powder.
14
The preparation of Fe0.7Cr1.3O3 is not well specified in literature. In this paper Fe0.7Cr1.3O3 was pressed into a pellet with a force of 70 kN. It is then sintered at 1200°C under atmospheric pressure. The temperature is increased slowly and held at 1200 °C for 5 hours, followed by natural cooling in the furnace to ~220°C and outside the furnace to room temperature. After sintering the pellet sample was polished down to 6 m, using diamond fluid, and cleaned in acetone and in ethanol in an ultrasonic bath. Due to porosity polishing down to 6m did result in a better surface but did also cut the outer layer partly.
2.1.3 NiFe2O4
The already prepared specimen (1035°C, 200MPa, 5h) was gained from Studsviks‟ archive and polished down to the fineness of 1 m using a diamante fluid, and cleaned in acetone and in ethanol in an ultrasonic bath.
3.2 X-ray powder diffraction (XRD)
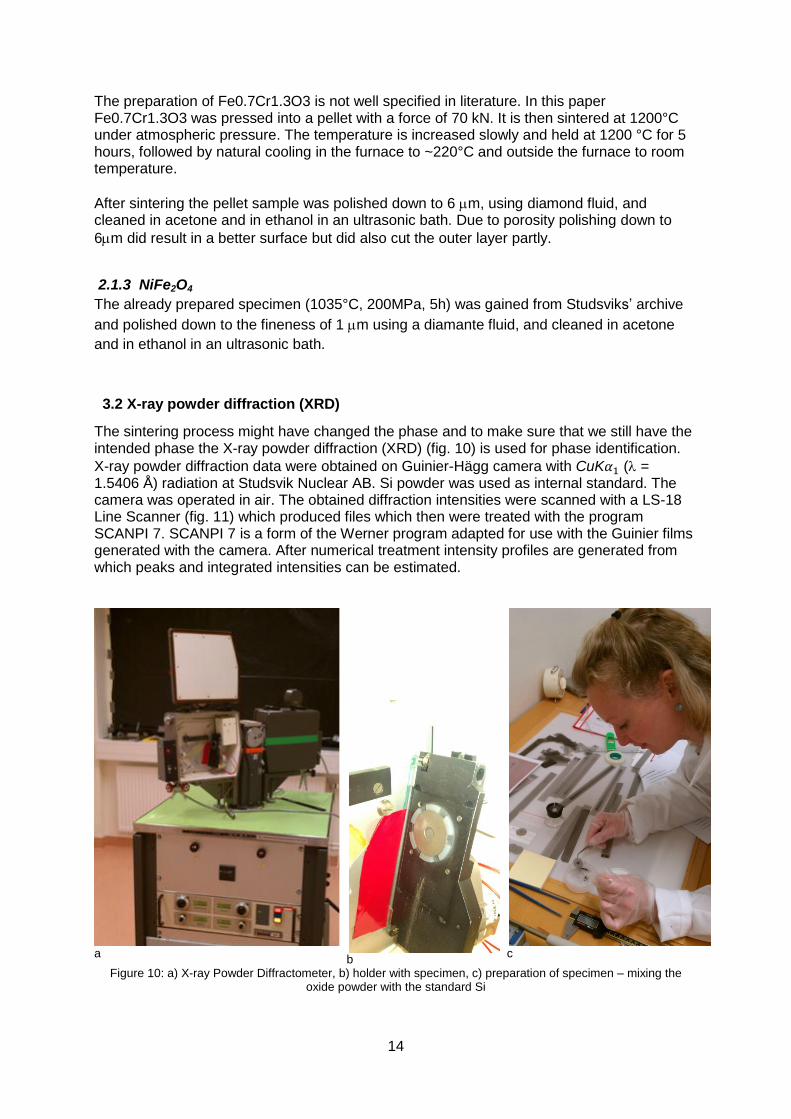
The sintering process might have changed the phase and to make sure that we still have the intended phase the X-ray powder diffraction (XRD) (fig. 10) is used for phase identification. X-ray powder diffraction data were obtained on Guinier-Hägg camera with CuK ( = 1.5406 Å) radiation at Studsvik Nuclear AB. Si powder was used as internal standard. The camera was operated in air. The obtained diffraction intensities were scanned with a LS-18 Line Scanner (fig. 11) which produced files which then were treated with the program SCANPI 7. SCANPI 7 is a form of the Werner program adapted for use with the Guinier films generated with the camera. After numerical treatment intensity profiles are generated from which peaks and integrated intensities can be estimated.
a
b
c
Figure 10: a) X-ray Powder Diffractometer, b) holder with specimen, c) preparation of specimen – mixing the oxide powder with the standard Si
15
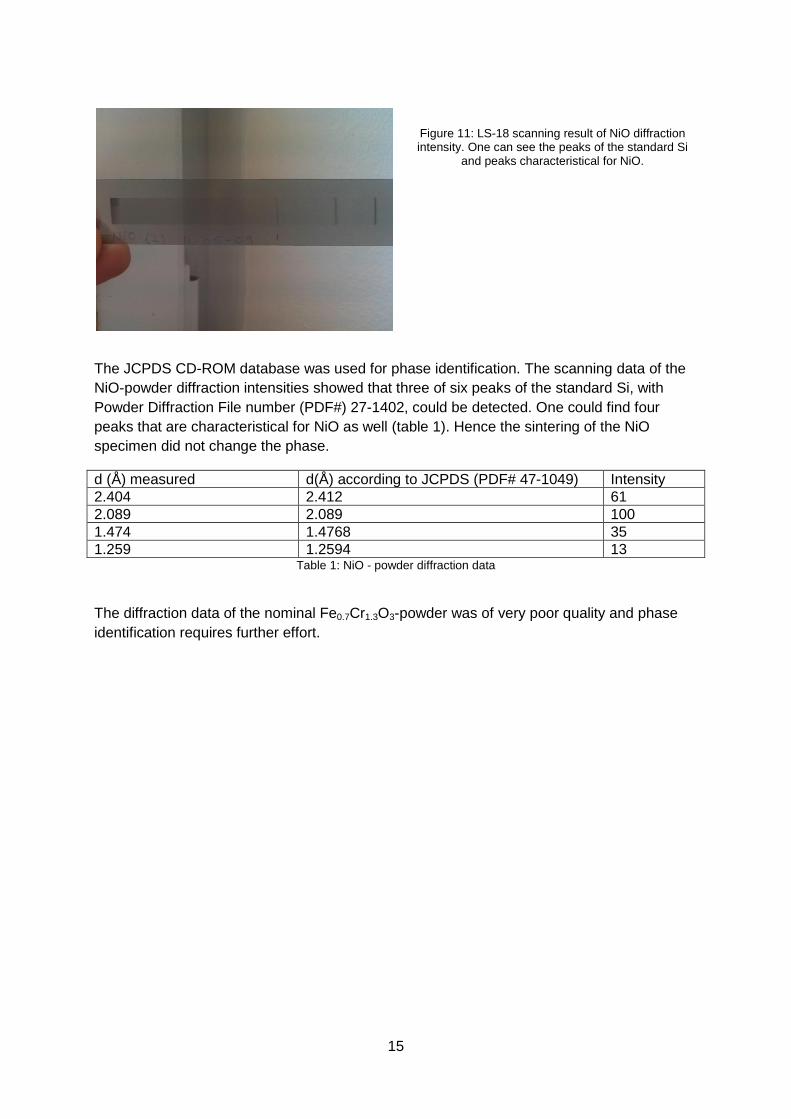
Figure 11: LS-18 scanning result of NiO diffraction intensity. One can see the peaks of the standard Si
and peaks characteristical for NiO.
The JCPDS CD-ROM database was used for phase identification. The scanning data of the NiO-powder diffraction intensities showed that three of six peaks of the standard Si, with Powder Diffraction File number (PDF#) 27-1402, could be detected. One could find four peaks that are characteristical for NiO as well (table 1). Hence the sintering of the NiO specimen did not change the phase.
d (Å) measured d(Å) according to JCPDS (PDF# 47-1049) Intensity 2.404 2.412 61 2.089 2.089 100 1.474 1.4768 35 1.259 1.2594 13
Table 1: NiO - powder diffraction data
The diffraction data of the nominal Fe0.7Cr1.3O3-powder was of very poor quality and phase identification requires further effort.
16
4. Results and discussion
Alloy 182
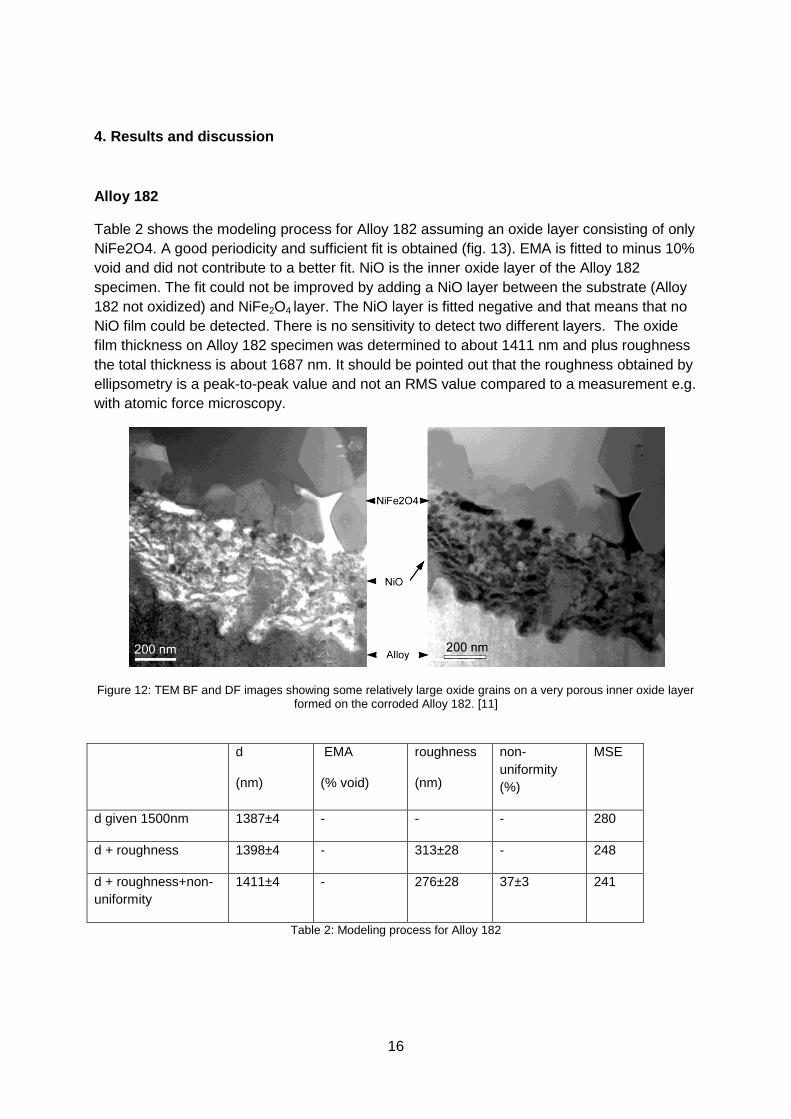
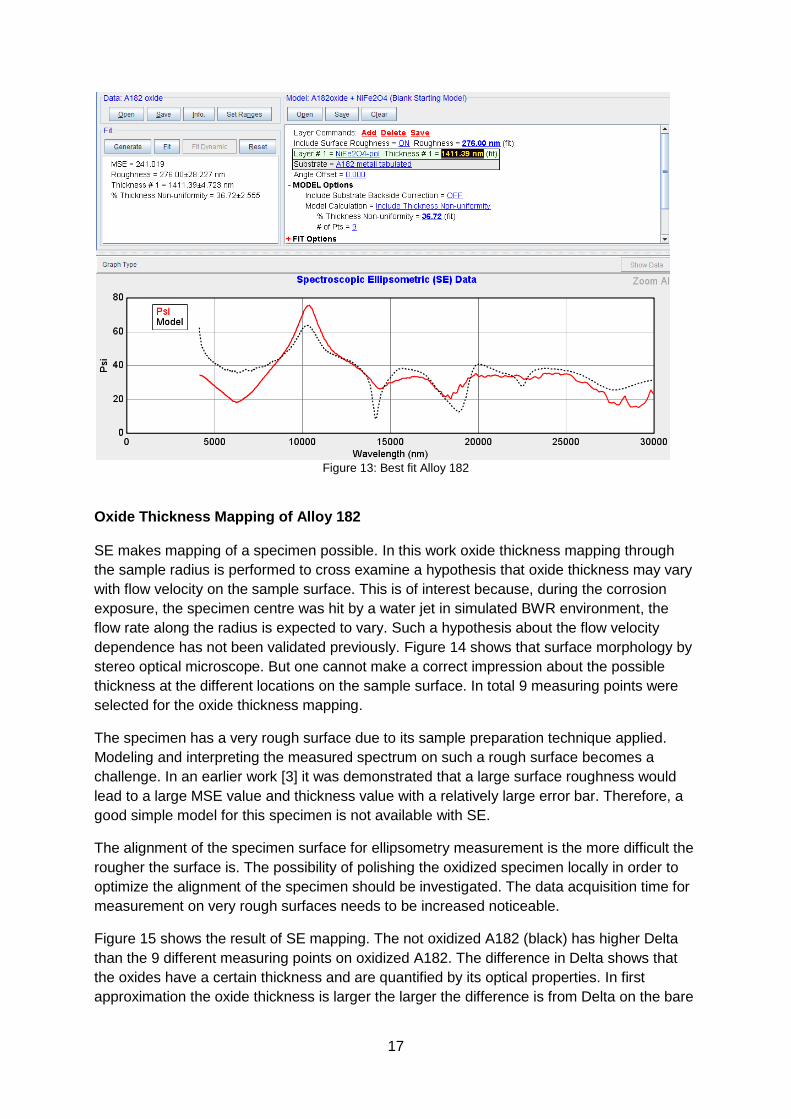
Table 2 shows the modeling process for Alloy 182 assuming an oxide layer consisting of only NiFe2O4. A good periodicity and sufficient fit is obtained (fig. 13). EMA is fitted to minus 10% void and did not contribute to a better fit. NiO is the inner oxide layer of the Alloy 182 specimen. The fit could not be improved by adding a NiO layer between the substrate (Alloy 182 not oxidized) and NiFe2O4 layer. The NiO layer is fitted negative and that means that no NiO film could be detected. There is no sensitivity to detect two different layers. The oxide film thickness on Alloy 182 specimen was determined to about 1411 nm and plus roughness the total thickness is about 1687 nm. It should be pointed out that the roughness obtained by ellipsometry is a peak-to-peak value and not an RMS value compared to a measurement e.g. with atomic force microscopy.
Figure 12: TEM BF and DF images showing some relatively large oxide grains on a very porous inner oxide layer formed on the corroded Alloy 182. [11]
d
(nm)
EMA
(% void)
roughness
(nm)
non-uniformity (%)
MSE
d given 1500nm 1387±4 - - - 280
d + roughness 1398±4 - 313±28 - 248
d + roughness+non-uniformity
1411±4 - 276±28 37±3 241
Table 2: Modeling process for Alloy 182
17
Figure 13: Best fit Alloy 182
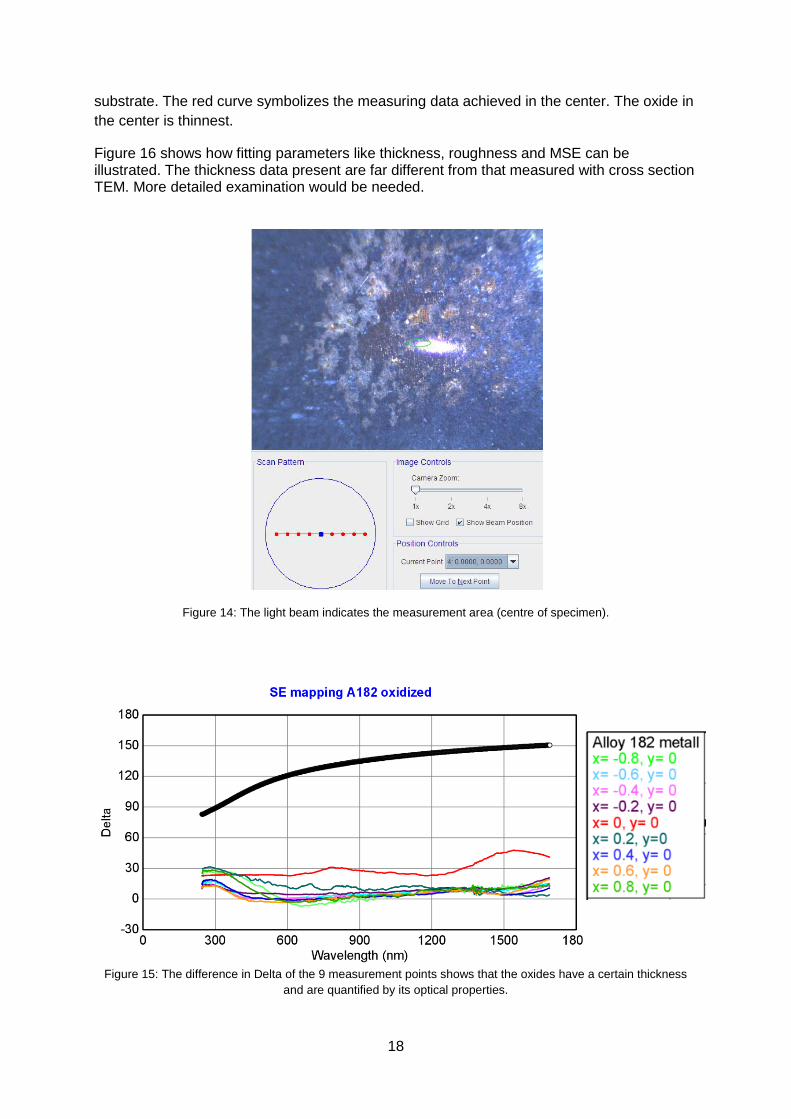
Oxide Thickness Mapping of Alloy 182 SE makes mapping of a specimen possible. In this work oxide thickness mapping through the sample radius is performed to cross examine a hypothesis that oxide thickness may vary with flow velocity on the sample surface. This is of interest because, during the corrosion exposure, the specimen centre was hit by a water jet in simulated BWR environment, the flow rate along the radius is expected to vary. Such a hypothesis about the flow velocity dependence has not been validated previously. Figure 14 shows that surface morphology by stereo optical microscope. But one cannot make a correct impression about the possible thickness at the different locations on the sample surface. In total 9 measuring points were selected for the oxide thickness mapping.
The specimen has a very rough surface due to its sample preparation technique applied. Modeling and interpreting the measured spectrum on such a rough surface becomes a challenge. In an earlier work [3] it was demonstrated that a large surface roughness would lead to a large MSE value and thickness value with a relatively large error bar. Therefore, a good simple model for this specimen is not available with SE.
The alignment of the specimen surface for ellipsometry measurement is the more difficult the rougher the surface is. The possibility of polishing the oxidized specimen locally in order to optimize the alignment of the specimen should be investigated. The data acquisition time for measurement on very rough surfaces needs to be increased noticeable.
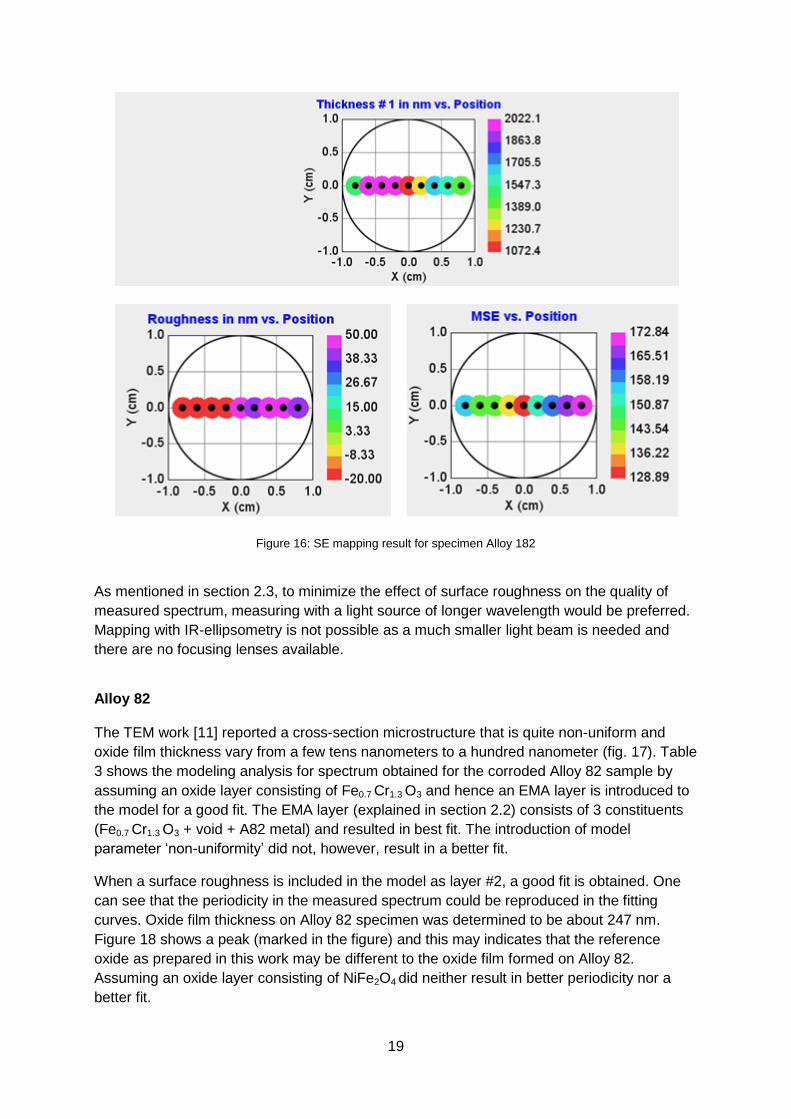
Figure 15 shows the result of SE mapping. The not oxidized A182 (black) has higher Delta than the 9 different measuring points on oxidized A182. The difference in Delta shows that the oxides have a certain thickness and are quantified by its optical properties. In first approximation the oxide thickness is larger the larger the difference is from Delta on the bare
18
substrate. The red curve symbolizes the measuring data achieved in the center. The oxide in the center is thinnest.
Figure 16 shows how fitting parameters like thickness, roughness and MSE can be illustrated. The thickness data present are far different from that measured with cross section TEM. More detailed examination would be needed.
Figure 14: The light beam indicates the measurement area (centre of specimen).
Figure 15: The difference in Delta of the 9 measurement points shows that the oxides have a certain thickness and are quantified by its optical properties.
19
Figure 16: SE mapping result for specimen Alloy 182
As mentioned in section 2.3, to minimize the effect of surface roughness on the quality of measured spectrum, measuring with a light source of longer wavelength would be preferred. Mapping with IR-ellipsometry is not possible as a much smaller light beam is needed and there are no focusing lenses available.
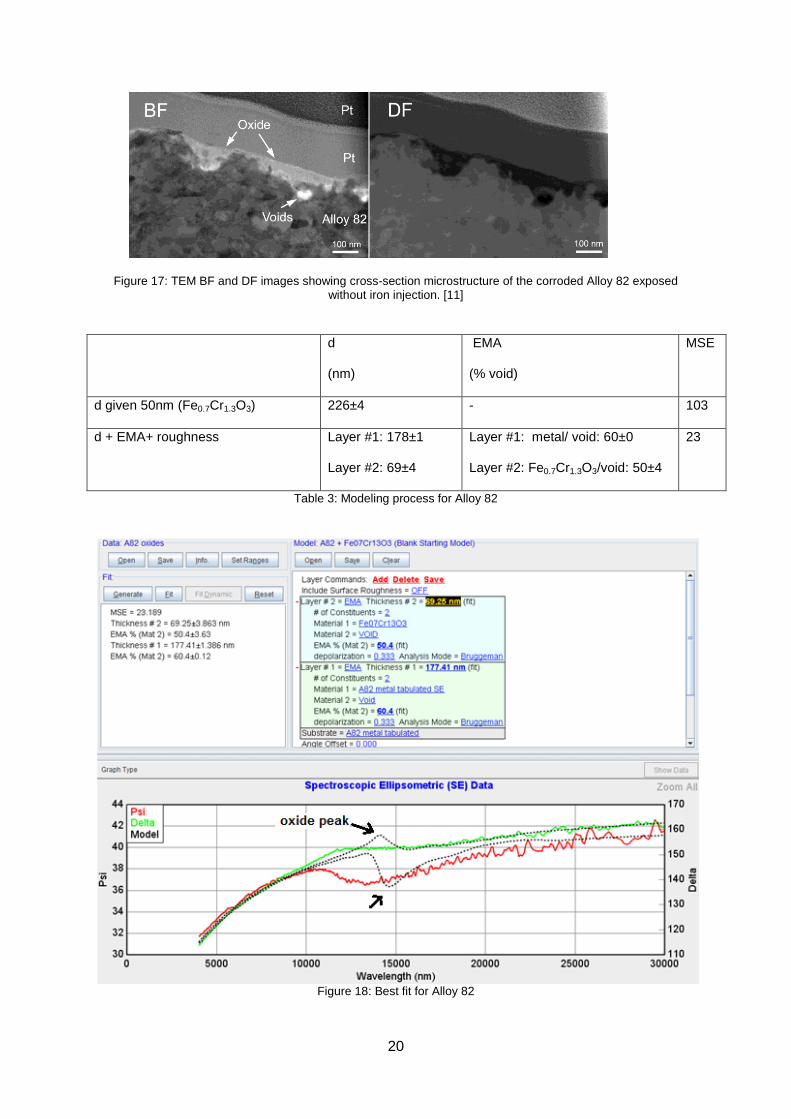
Alloy 82 The TEM work [11] reported a cross-section microstructure that is quite non-uniform and oxide film thickness vary from a few tens nanometers to a hundred nanometer (fig. 17). Table 3 shows the modeling analysis for spectrum obtained for the corroded Alloy 82 sample by assuming an oxide layer consisting of Fe0.7 Cr1.3 O3 and hence an EMA layer is introduced to the model for a good fit. The EMA layer (explained in section 2.2) consists of 3 constituents (Fe0.7 Cr1.3 O3 + void + A82 metal) and resulted in best fit. The introduction of model parameter „non-uniformity‟ did not, however, result in a better fit.
When a surface roughness is included in the model as layer #2, a good fit is obtained. One can see that the periodicity in the measured spectrum could be reproduced in the fitting curves. Oxide film thickness on Alloy 82 specimen was determined to be about 247 nm. Figure 18 shows a peak (marked in the figure) and this may indicates that the reference oxide as prepared in this work may be different to the oxide film formed on Alloy 82. Assuming an oxide layer consisting of NiFe2O4 did neither result in better periodicity nor a better fit.
20
Figure 17: TEM BF and DF images showing cross-section microstructure of the corroded Alloy 82 exposed without iron injection. [11]
d
(nm)
EMA
(% void)
MSE
d given 50nm (Fe0.7Cr1.3O3) 226±4 - 103
d + EMA+ roughness Layer #1: 178±1
Layer #2: 69±4
Layer #1: metal/ void: 60±0
Layer #2: Fe0.7Cr1.3O3/void: 50±4
23
Table 3: Modeling process for Alloy 82
Figure 18: Best fit for Alloy 82
21
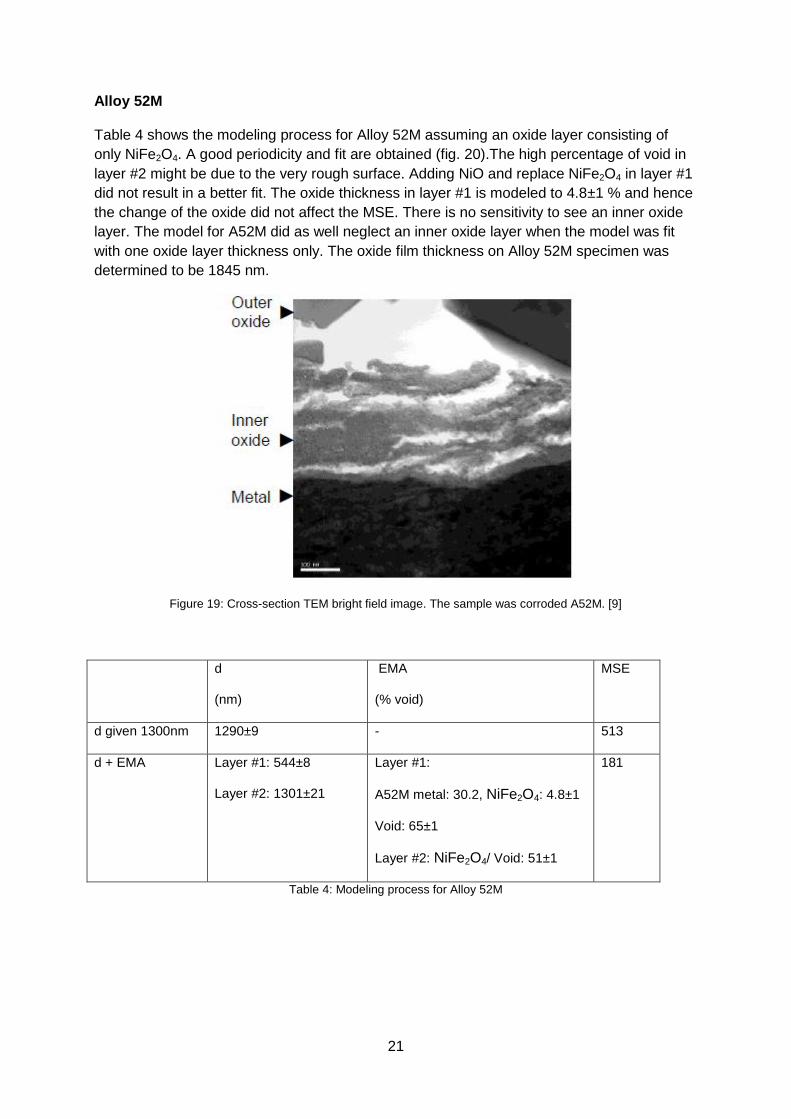
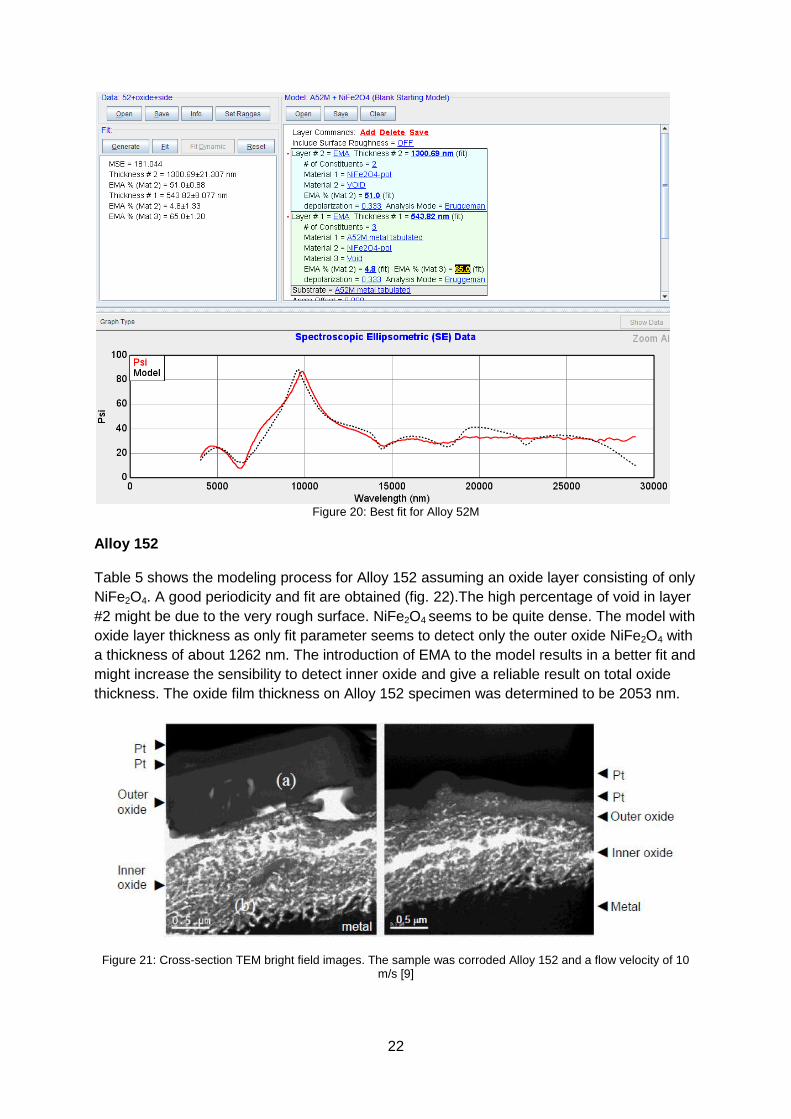
Alloy 52M Table 4 shows the modeling process for Alloy 52M assuming an oxide layer consisting of only NiFe2O4. A good periodicity and fit are obtained (fig. 20).The high percentage of void in layer #2 might be due to the very rough surface. Adding NiO and replace NiFe2O4 in layer #1 did not result in a better fit. The oxide thickness in layer #1 is modeled to 4.8±1 % and hence the change of the oxide did not affect the MSE. There is no sensitivity to see an inner oxide layer. The model for A52M did as well neglect an inner oxide layer when the model was fit with one oxide layer thickness only. The oxide film thickness on Alloy 52M specimen was determined to be 1845 nm.
Figure 19: Cross-section TEM bright field image. The sample was corroded A52M. [9]
d
(nm)
EMA
(% void)
MSE
d given 1300nm 1290±9 - 513
d + EMA Layer #1: 544±8
Layer #2: 1301±21
Layer #1:
A52M metal: 30.2, NiFe2O4: 4.8±1
Void: 65±1
Layer #2: NiFe2O4/ Void: 51±1
181
Table 4: Modeling process for Alloy 52M
22
Figure 20: Best fit for Alloy 52M
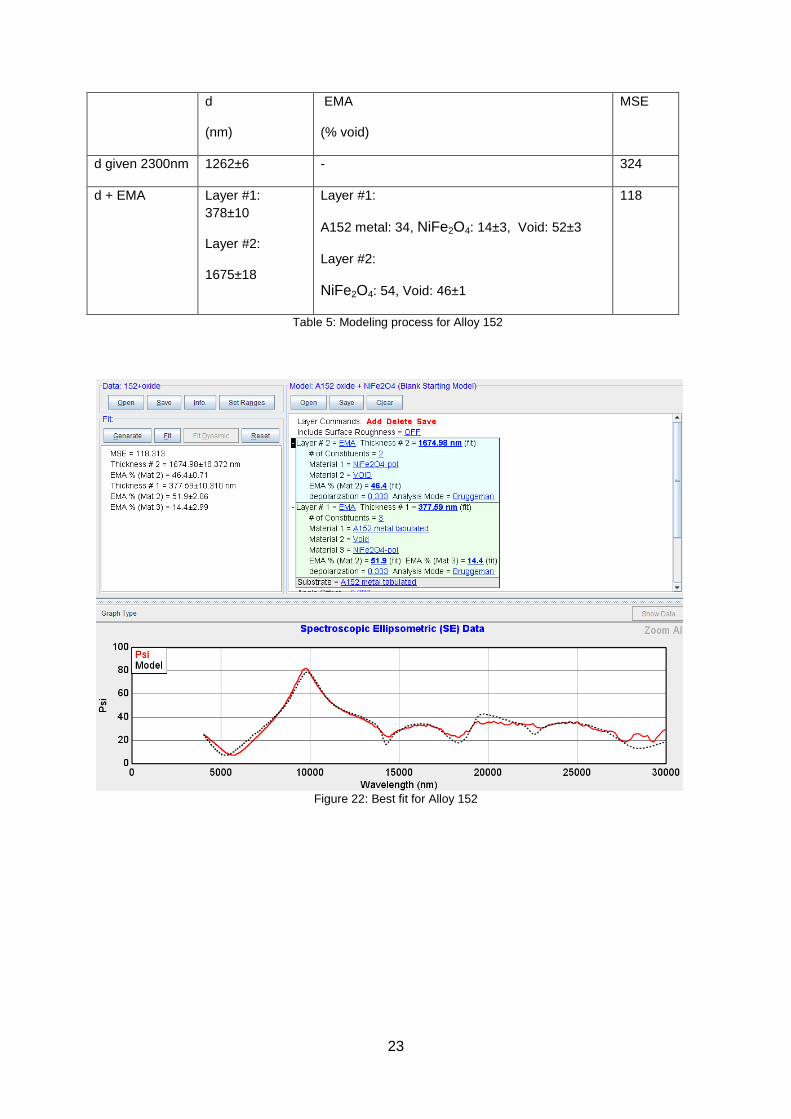
Alloy 152 Table 5 shows the modeling process for Alloy 152 assuming an oxide layer consisting of only NiFe2O4. A good periodicity and fit are obtained (fig. 22).The high percentage of void in layer #2 might be due to the very rough surface. NiFe2O4 seems to be quite dense. The model with oxide layer thickness as only fit parameter seems to detect only the outer oxide NiFe2O4 with a thickness of about 1262 nm. The introduction of EMA to the model results in a better fit and might increase the sensibility to detect inner oxide and give a reliable result on total oxide thickness. The oxide film thickness on Alloy 152 specimen was determined to be 2053 nm.
Figure 21: Cross-section TEM bright field images. The sample was corroded Alloy 152 and a flow velocity of 10 m/s [9]
23
d
(nm)
EMA
(% void)
MSE
d given 2300nm 1262±6 - 324
d + EMA Layer #1: 378±10
Layer #2:
1675±18
Layer #1:
A152 metal: 34, NiFe2O4: 14±3, Void: 52±3
Layer #2:
NiFe2O4: 54, Void: 46±1
118
Table 5: Modeling process for Alloy 152
Figure 22: Best fit for Alloy 152
24
4.1 Evaluation
Comparison measured thickness with thickness determined by TEM
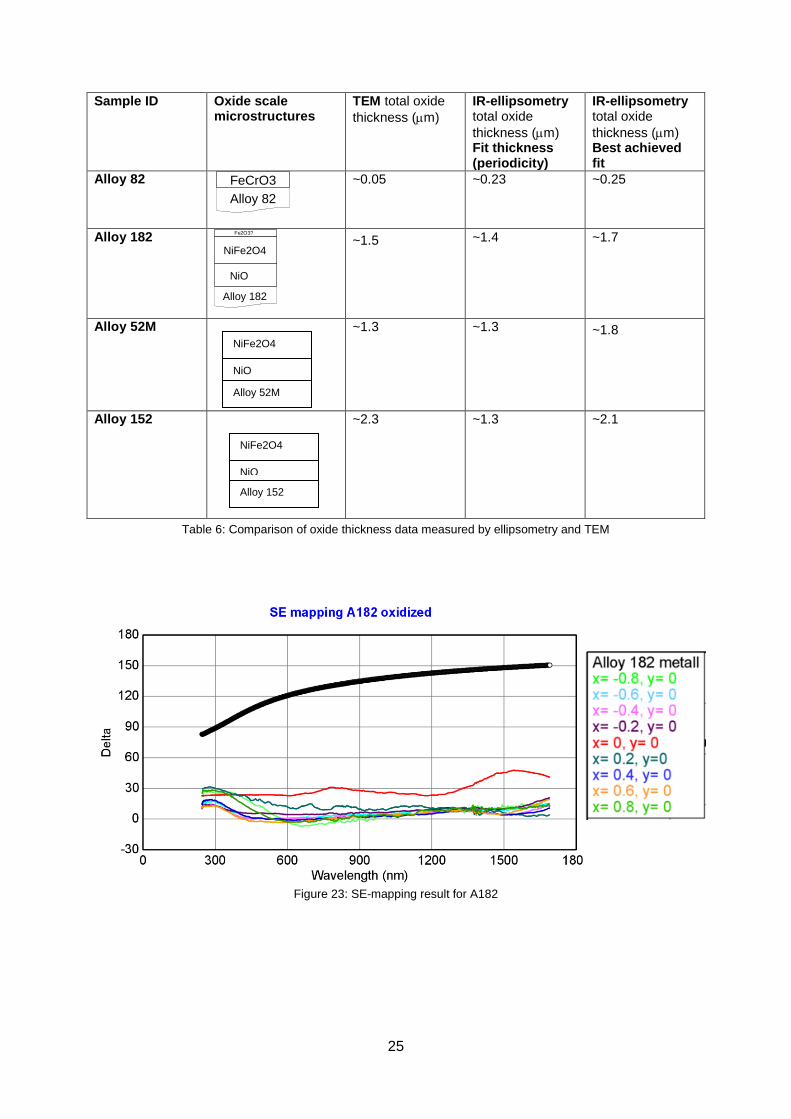
For all these alloy samples examined, oxide thickness and oxide microstructure have been examined by cross-section TEM. The information is used as references for judging the correctness of the thickness data from ellipsometric measurement. It must be pointed out that such information was obtained at the central parts of the corroded sample surfaces. Therefore, there could be some discrepancy in thickness data obtained by the different technique even if both techniques give thicknesses of high quality. The difference in obtained thickness data by the two techniques could also be due to that ellipsometry measurement is made on a much large surface area than that by FIB. The former covers a few millimeters radius while the latter covers only about 10 m in width. In this paper ellipsometry measurements are done on a bigger local area and not in the center of the specimen. Evaluation of the SE mapping (fig. 23) shows that there is a notable difference in film thickness if one compares the oxide thickness at the center with that in other areas on the specimen.
In table 6, one can see that the oxide thickness data obtained with ellipsometry differ from data determined by TEM.
An EMA model can only be applied when the optical properties of all constituents are known and the quality of the EMA layer will depend on how close the properties of the prepared reference film are to the film on the substrate.
Best fit
The objective with modeling is to get the best fit as possible and this means the lowest MSE possible. One may have found a good fit but probably not the best. In order to get as close as possible to the best fit you need to know your specimen and minimize the sources of error. One can get a better fit but evaluating the model one can state that in spite of a lower MSE indicating a better fit the model can not be correct. The fit might resulted in that one or several fit parameter did adopt a value that can not be true. The knowledge about the specimen examined is critical to the quality of the model received.
The determination of oxide thickness based on the periodicity (see section 2.2) of the ellipsometric parameters was also applied. The advantage is that oxide thickness is obtained directly from the measured spectrum without any modeling and thus is model independent. This is in contrast to the modeling describe above in which the definition of oxide thickness became model dependent, and correlation effects between interface layers, the oxide layer, and layer composition may make comparisons between different samples less straight forward. [3] The disadvantage with the periodicity approach is that the requirement of constant index in IR is not fulfilled.
25
Sample ID Oxide scale microstructures
TEM total oxide thickness (m)
IR-ellipsometry total oxide thickness (m) Fit thickness (periodicity)
IR-ellipsometry total oxide thickness (m) Best achieved fit
Alloy 82
~0.05 ~0.23 ~0.25
Alloy 182
~1.5
~1.4 ~1.7
Alloy 52M
~1.3 ~1.3 ~1.8
Alloy 152
~2.3 ~1.3 ~2.1
Table 6: Comparison of oxide thickness data measured by ellipsometry and TEM
Figure 23: SE-mapping result for A182
FeCrO3Alloy 82
NiFe2O4
NiO Alloy 182
Fe2O3?
NiFe2O4
NiO
Alloy 52M
NiFe2O4
NiO
Alloy 152
26
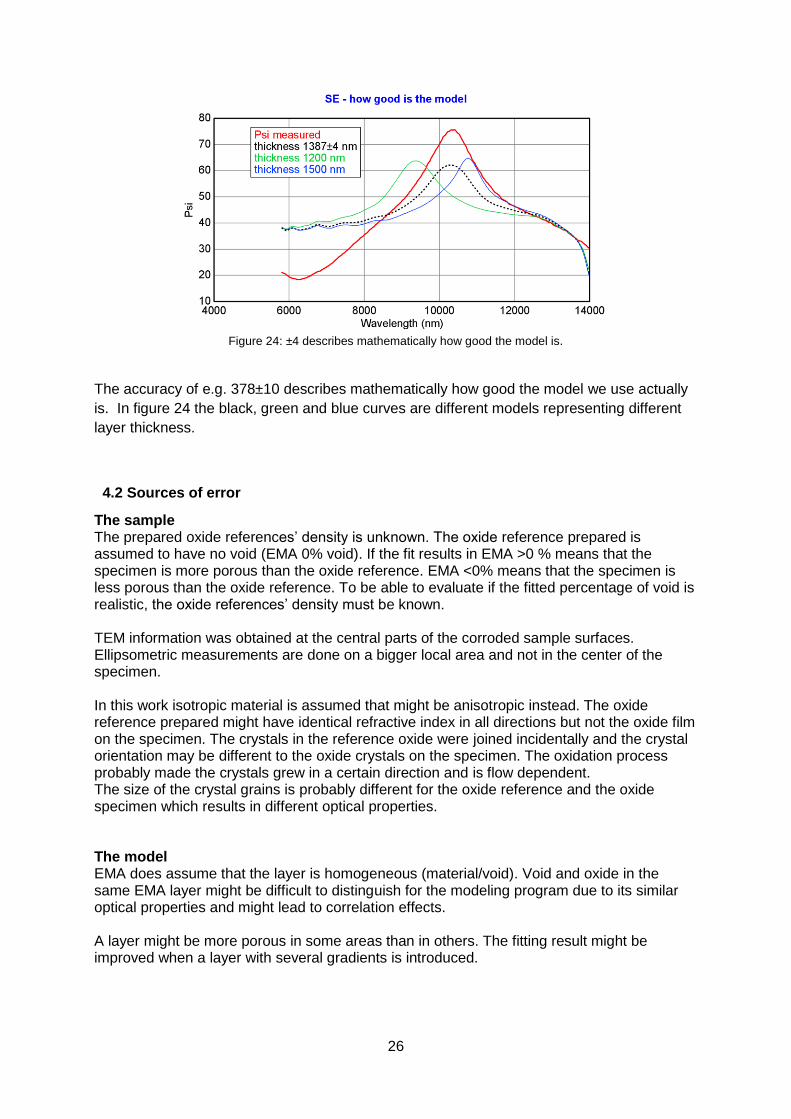
Figure 24: ±4 describes mathematically how good the model is.
The accuracy of e.g. 378±10 describes mathematically how good the model we use actually is. In figure 24 the black, green and blue curves are different models representing different layer thickness.
4.2 Sources of error
The sample The prepared oxide references‟ density is unknown. The oxide reference prepared is assumed to have no void (EMA 0% void). If the fit results in EMA >0 % means that the specimen is more porous than the oxide reference. EMA <0% means that the specimen is less porous than the oxide reference. To be able to evaluate if the fitted percentage of void is realistic, the oxide references‟ density must be known. TEM information was obtained at the central parts of the corroded sample surfaces. Ellipsometric measurements are done on a bigger local area and not in the center of the specimen. In this work isotropic material is assumed that might be anisotropic instead. The oxide reference prepared might have identical refractive index in all directions but not the oxide film on the specimen. The crystals in the reference oxide were joined incidentally and the crystal orientation may be different to the oxide crystals on the specimen. The oxidation process probably made the crystals grew in a certain direction and is flow dependent. The size of the crystal grains is probably different for the oxide reference and the oxide specimen which results in different optical properties. The model EMA does assume that the layer is homogeneous (material/void). Void and oxide in the same EMA layer might be difficult to distinguish for the modeling program due to its similar optical properties and might lead to correlation effects. A layer might be more porous in some areas than in others. The fitting result might be improved when a layer with several gradients is introduced.
27
Data acquisition procedure The quality of data is influenced by:
a. Instrument - Quality of calibration routines, beam quality, component quality, quality of data acquisition routines, detector linearity and polarization sensitivity
b. Alignment – x and y tilt angles, sample surface in the center of rotation [4]
The used instruments are high precision instruments and the data quality is excellent. The data quality is thus limited by the sample inhomogeneities (mainly roughness and planarity) which make alignment complicated. Errors in angle of incidence will occur.
6. Conclusion
SE-ellipsometric and IR-ellipsometric measurements have been applied on four nickel-base alloys, Alloy 82, Alloy 182, Alloy 52M and Alloy 152. Under the conditions specified, the following conclusions can be drawn:
1) IR-ellipsometry could be applied to gain information on oxide film thickness. 2) IR-ellipsometric measurement on corroded nickel base alloys with relative large
surface roughness produce improved spectra with less scattering. SE-ellipsometric measurement, on the other hand, produces relatively poor spectra. Evaluation of such poor spectra would require further effort.
3) A preliminary oxide thickness mapping result suggests that oxide thickness in the centre of the specimen is thinner than the peripheries of the sample surface. However, the evaluation of the obtained ellipsometric data requires further effort.
7. Future work
This work is a trial study to evaluate ellipsometry as a method for oxide film thickness measurement. The evaluation of the obtained ellipsometric data requires further effort.
For further studies a smaller sample surface roughness prior to corrosion study is suggested. Oxide references prepared with optical properties and density close to the properties of oxides on alloys examined are a must.
28
References
[1] Leif Pettersson, Kenneth Järrendahl and Hans Arwin, Spectroscopic ellipsometry – Laboratory exercise, 2008, Laboratory of Applied Optics, Department of Physics, Chemistry and Biology, Linköping University
[2] J.A. Woollam Co.,Inc., October 2009, Session 1 – Introduction & Theory (Presentation slides), Darmstadt
[3] Jiaxin Chen, High Temperature Oxidation and Corrosion of Hot Isostatically Pressed Si3N4 Ceramics, Göteborg 1994, Department of Inorganic Chemistry, Chalmers University of Technology, University of Göteborg
[4] Hans Arwin, Thin Film Optics and Polarized Light, October 20, 2009
[5] Jiaxin Chen, Corrosion of nickel-base alloys in BWR environments, Internal Report (2010-07-09)
[6] J.A. Woollam Co.,Inc., October 2009, Session 2 – Warm up with built-in Basic Models (Presentation slides), Darmstadt
[7] KSU AB, Vattenkemi, material och bränsle I lättvattenreaktorer, kompendium, 2004
[8] Nickel Institute, http://nickelinstitute.org/index.cfm?ci_id=18782&la_id=1
[9] Mika Helin, Jiaxin Chen, STUDSVIK/N-10/115, Corrosion of nickel-base alloys 52M and 152 in simulated BWR water environments, January 18, 2011
[10] http://en.wikipedia.org/wiki/Nickel%28II%29_oxide
[11] Jiaxin Chen, Fredrik Lindberg, Lyubov Belova, …, High resolution electron microscopy study on oxide films formed on nickel-base alloys X-750, 182 and 82 in simulated high flow velocity BWR water conditions, 15th International Conference on Environmental Degradation of Materials in Nuclear Power Systems – Water Reactors, 2011-08-07 – 2011-08-11, Colorado Springs, CO, USA
[12] http://nobelprize.org/educational/physics/microscopes/tem/index.html
[13] http://www.fei.com/uploadedFiles/DocumentsPrivate/Content/MRS_Bulletin_2007_FIB_TEM_prep.pdf [14] Mats Ullberg, Korrosion av Ni-bas i kokarreaktormiljö, STUDSVIK/N-09/xxx, 2009
[15] Anders Jensen, Studsvik Nuclear AB and Peter Ekström, SSM, General applications of A82, A182, A52M, A152, oral communication
[16] Jiaxin Chen, Fredrik Lindberg, … , High resolution electron microscopy study on oxide
films formed on nickel-base alloys X-750, 182 and 82 in simulated high flow velocity BWR water condition, May 2011
29
[17] P. Drude. ?? Ann. Phys. Chemie, 32:584, 1887
[18] P. Drude. ?? Ann. Phys. Chemie, 38:481, 1890
[19] http://en.wikipedia.org/wiki/Ellipsometry
[20] http://en.wikipedia.org/wiki/File:Ellipsometry_setup.svg
30
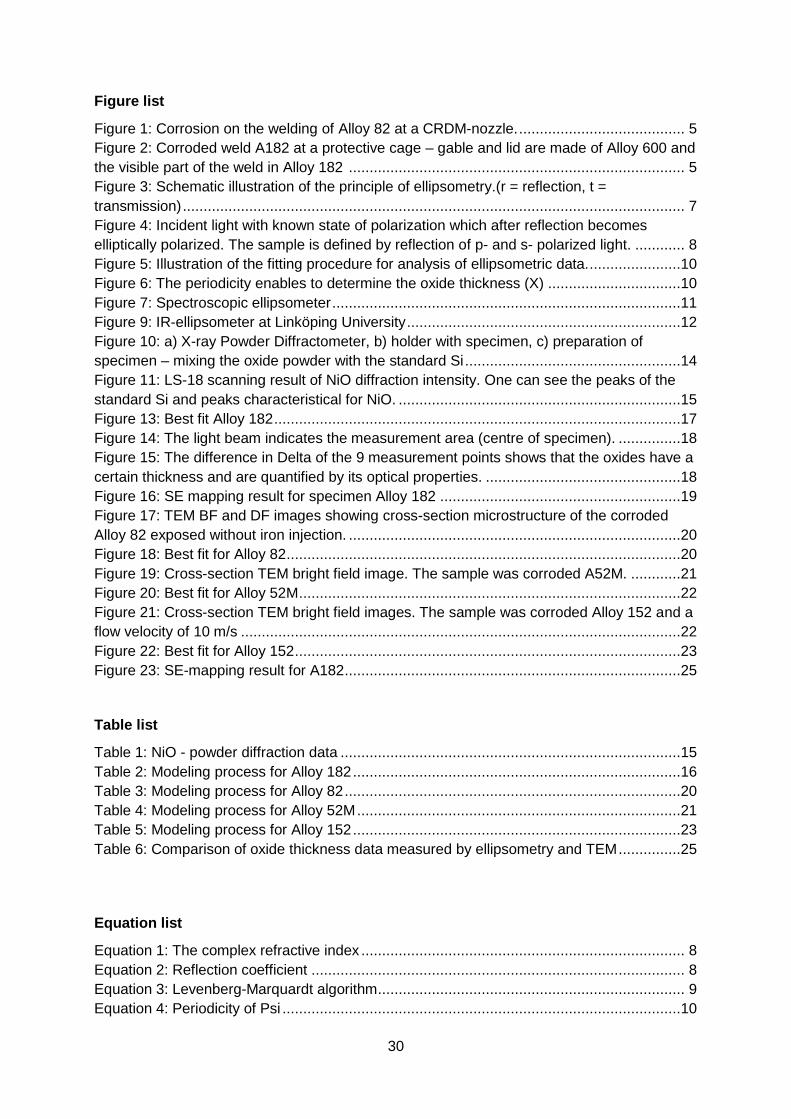
Figure list
Figure 1: Corrosion on the welding of Alloy 82 at a CRDM-nozzle. ........................................ 5
Figure 2: Corroded weld A182 at a protective cage – gable and lid are made of Alloy 600 and the visible part of the weld in Alloy 182 ................................................................................. 5
Figure 3: Schematic illustration of the principle of ellipsometry.(r = reflection, t = transmission) ......................................................................................................................... 7
Figure 4: Incident light with known state of polarization which after reflection becomes elliptically polarized. The sample is defined by reflection of p- and s- polarized light. ............ 8
Figure 5: Illustration of the fitting procedure for analysis of ellipsometric data. ......................10
Figure 6: The periodicity enables to determine the oxide thickness (X) ................................10
Figure 7: Spectroscopic ellipsometer ....................................................................................11
Figure 9: IR-ellipsometer at Linköping University ..................................................................12
Figure 10: a) X-ray Powder Diffractometer, b) holder with specimen, c) preparation of specimen – mixing the oxide powder with the standard Si ....................................................14
Figure 11: LS-18 scanning result of NiO diffraction intensity. One can see the peaks of the standard Si and peaks characteristical for NiO. ....................................................................15
Figure 13: Best fit Alloy 182 ..................................................................................................17
Figure 14: The light beam indicates the measurement area (centre of specimen). ...............18
Figure 15: The difference in Delta of the 9 measurement points shows that the oxides have a certain thickness and are quantified by its optical properties. ...............................................18
Figure 16: SE mapping result for specimen Alloy 182 ..........................................................19
Figure 17: TEM BF and DF images showing cross-section microstructure of the corroded Alloy 82 exposed without iron injection. ................................................................................20
Figure 18: Best fit for Alloy 82 ...............................................................................................20
Figure 19: Cross-section TEM bright field image. The sample was corroded A52M. ............21
Figure 20: Best fit for Alloy 52M ............................................................................................22
Figure 21: Cross-section TEM bright field images. The sample was corroded Alloy 152 and a flow velocity of 10 m/s ..........................................................................................................22
Figure 22: Best fit for Alloy 152 .............................................................................................23
Figure 23: SE-mapping result for A182 .................................................................................25
Table list
Table 1: NiO - powder diffraction data ..................................................................................15
Table 2: Modeling process for Alloy 182 ...............................................................................16
Table 3: Modeling process for Alloy 82 .................................................................................20
Table 4: Modeling process for Alloy 52M ..............................................................................21
Table 5: Modeling process for Alloy 152 ...............................................................................23
Table 6: Comparison of oxide thickness data measured by ellipsometry and TEM ...............25
Equation list
Equation 1: The complex refractive index .............................................................................. 8
Equation 2: Reflection coefficient .......................................................................................... 8
Equation 3: Levenberg-Marquardt algorithm .......................................................................... 9
Equation 4: Periodicity of Psi ................................................................................................10
31
Appendix
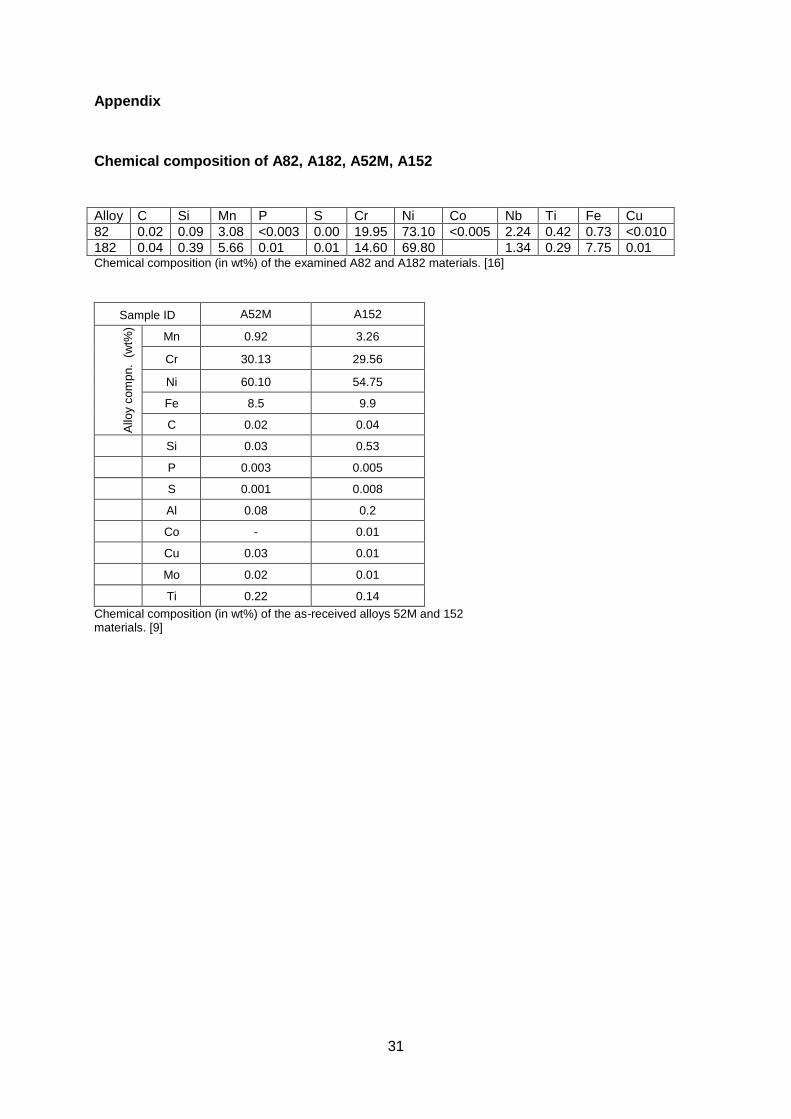
Chemical composition of A82, A182, A52M, A152
Alloy C Si Mn P S Cr Ni Co Nb Ti Fe Cu 82 0.02 0.09 3.08 <0.003 0.00 19.95 73.10 <0.005 2.24 0.42 0.73 <0.010 182 0.04 0.39 5.66 0.01 0.01 14.60 69.80 1.34 0.29 7.75 0.01 Chemical composition (in wt%) of the examined A82 and A182 materials. [16]
Sample ID A52M A152
Allo
y co
mpn
. (w
t%)
Mn 0.92 3.26
Cr 30.13 29.56
Ni 60.10 54.75
Fe 8.5 9.9
C 0.02 0.04
Si 0.03 0.53
P 0.003 0.005
S 0.001 0.008
Al 0.08 0.2
Co - 0.01
Cu 0.03 0.01
Mo 0.02 0.01
Ti 0.22 0.14 Chemical composition (in wt%) of the as-received alloys 52M and 152 materials. [9]
32
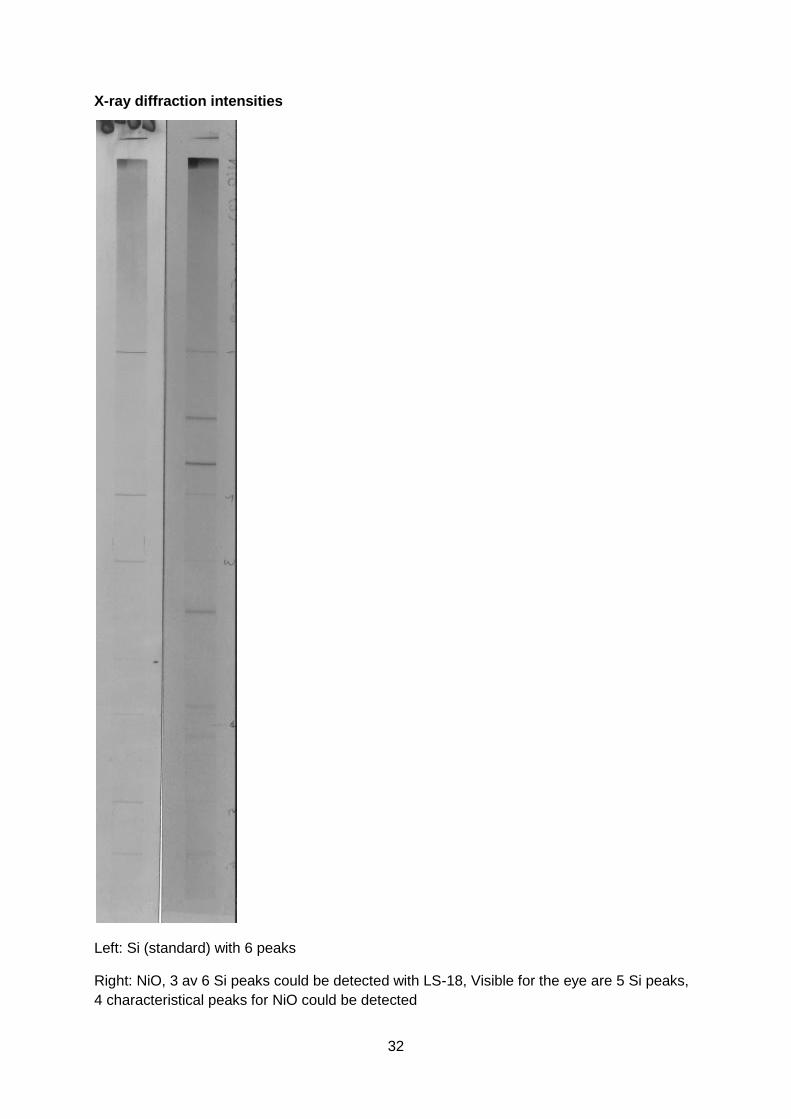
X-ray diffraction intensities
Left: Si (standard) with 6 peaks
Right: NiO, 3 av 6 Si peaks could be detected with LS-18, Visible for the eye are 5 Si peaks, 4 characteristical peaks for NiO could be detected
33
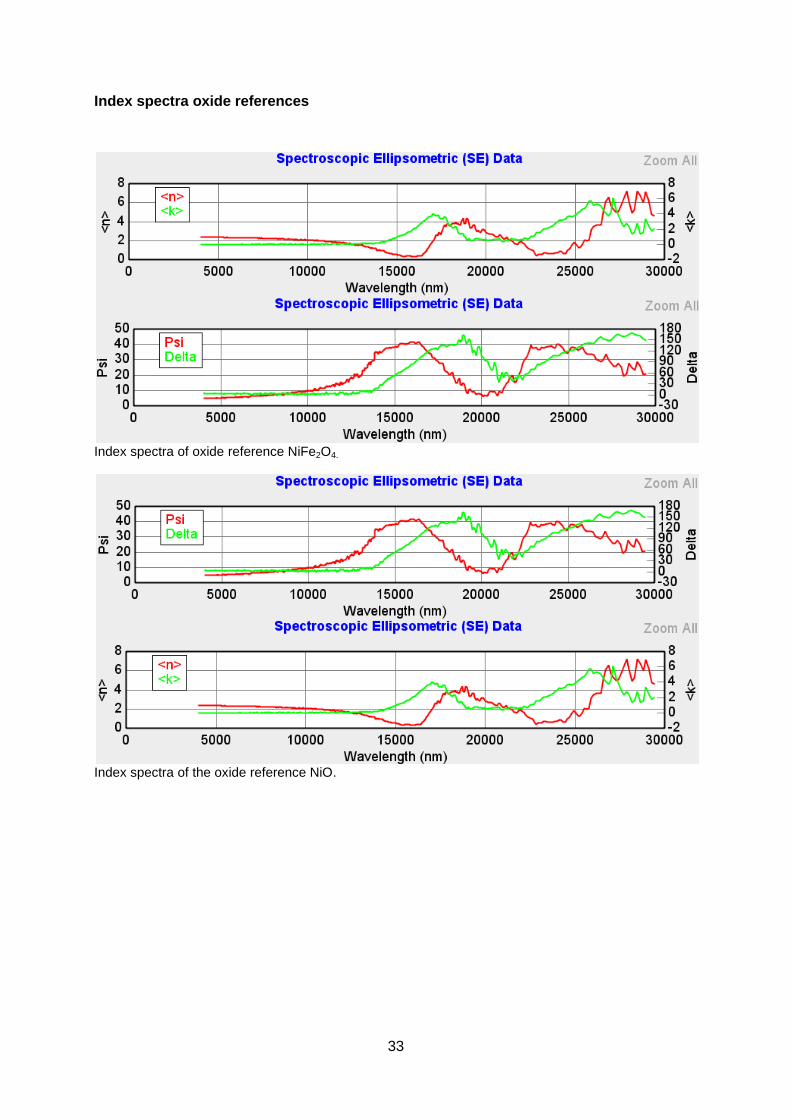
Index spectra oxide references
Index spectra of oxide reference NiFe2O4.
Index spectra of the oxide reference NiO.
34
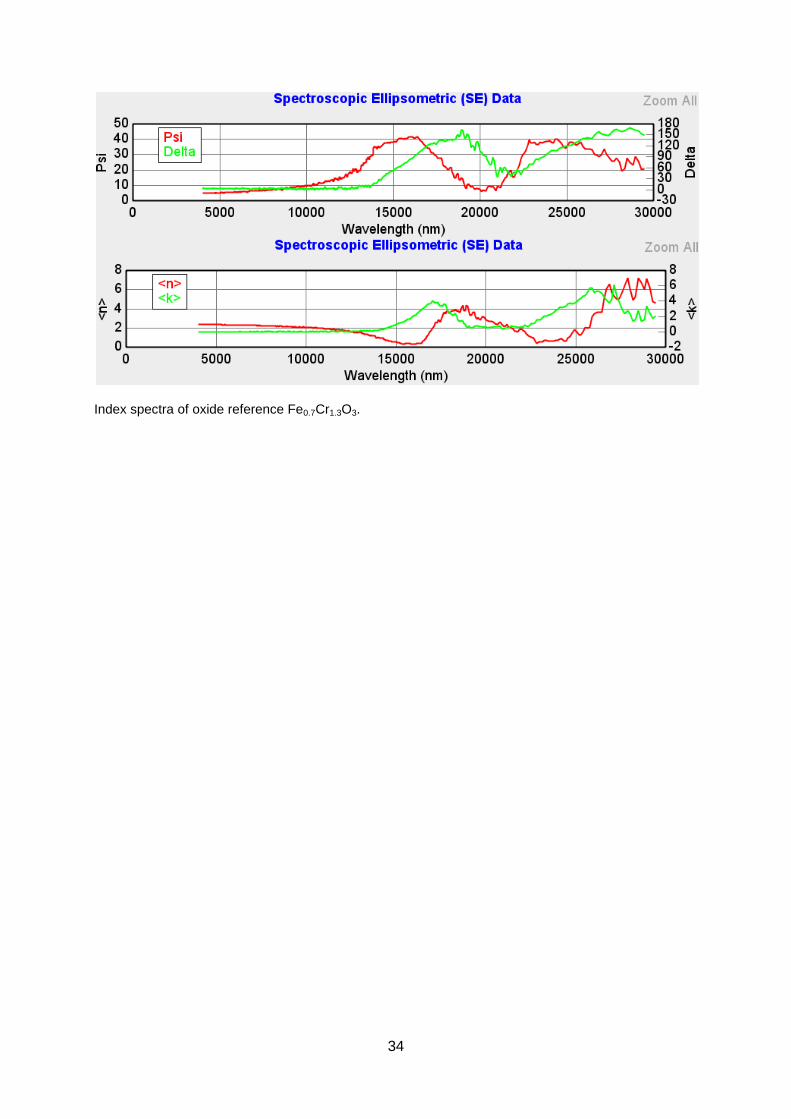
Index spectra of oxide reference Fe0.7Cr1.3O3.


![[FlhJ16fa] Film thickness by interference pattern and optical characterization of polyaniline by spectroscopic ellipsometry](https://img.pdfslide.us/doc/110x75/589982551a28abb97c8b592f/flhj16fa-film-thickness-by-interference-pattern-and-optical-characterization.jpg)