Embed Size (px)
Citation preview
Spectroscopic database for TROPOMI/Sentinel-5 Precursor
Joep Loos, Manfred Birk, Georg Wagner, Didier Mondelain, Samir Kassi, Semen Vasilchenko, Alain Campargue, Frank Hase, Johannes Orphal, Agnes
Perrin, Ha Tran, Laurent Coudert, Gaelle Dufour, Maxim Eremenko, Juan Cuesta, Ludovic Daumont, Maud Rotger, Alberto Bigazzi, Claus Zehner
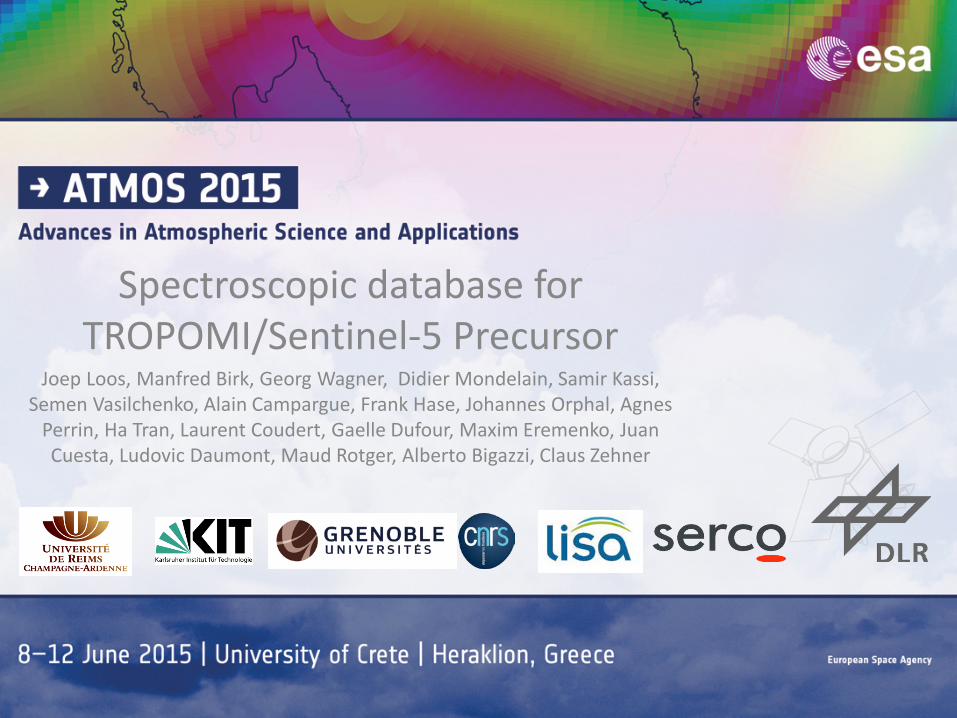
ESA project „SEOM-Improved Atmospheric Spectroscopy Databases” (IAS)
Goals: • Improve spectroscopic database of CH4, H2O and CO in 2.3 µm region for TROPOMI
– data products CH4 column (<2%), CO column (<15%)
• Resolve discrepancy of O3 spectroscopy in UV/MIR region • Improve spectroscopic database of SO2 in the UV
• First two years: 2.3 µm spectroscopy (Kick-off Feb 2014) • Project sequence: Literature study, user requirements, measurement plan,
measurements, analysis, validation • Spectroscopy of H2O, CH4, CO needed
– Goal: max. 30% error contribution from spectroscopy
• Measurements by two different techniques: FTS + CRDS
• O3 and SO2 covered in third year
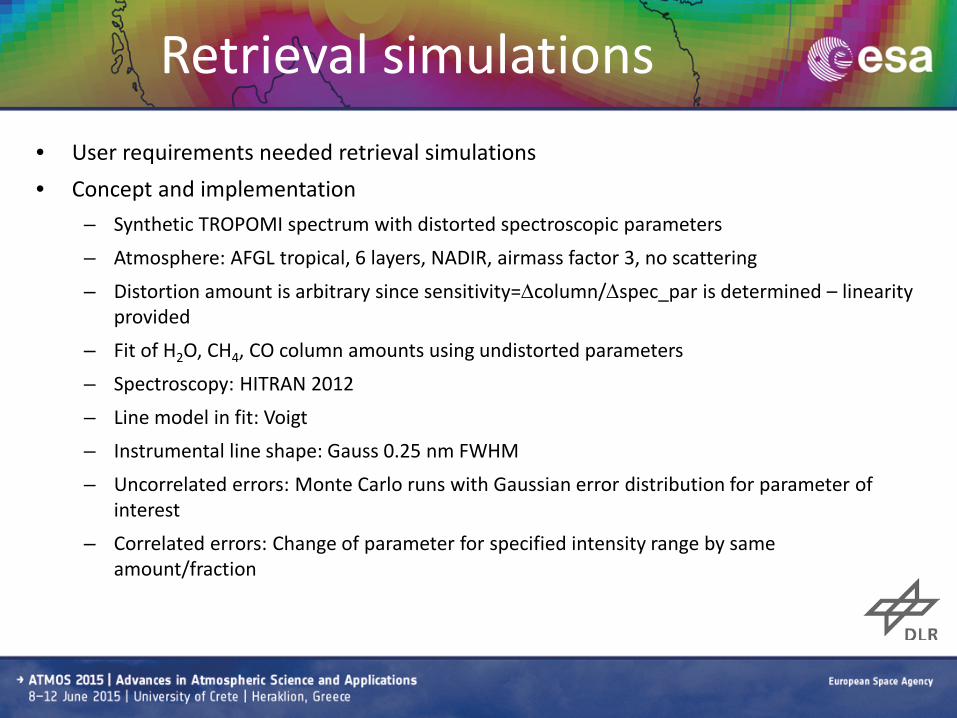
Retrieval simulations • User requirements needed retrieval simulations • Concept and implementation
– Synthetic TROPOMI spectrum with distorted spectroscopic parameters – Atmosphere: AFGL tropical, 6 layers, NADIR, airmass factor 3, no scattering
– Distortion amount is arbitrary since sensitivity=∆column/∆spec_par is determined – linearity provided
– Fit of H2O, CH4, CO column amounts using undistorted parameters – Spectroscopy: HITRAN 2012 – Line model in fit: Voigt – Instrumental line shape: Gauss 0.25 nm FWHM – Uncorrelated errors: Monte Carlo runs with Gaussian error distribution for parameter of
interest – Correlated errors: Change of parameter for specified intensity range by same
amount/fraction
Retrieval simulations
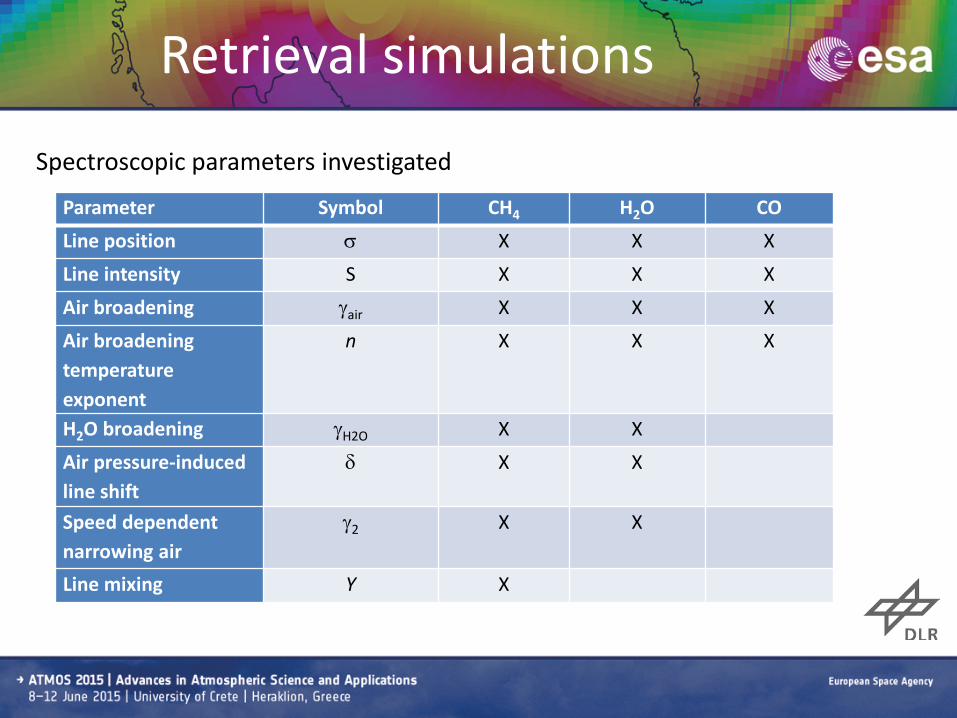
Spectroscopic parameters investigated
Parameter Symbol CH4 H2O CO Line position σ X X X Line intensity S X X X Air broadening γair X X X Air broadening temperature exponent
n X X X
H2O broadening γH2O X X Air pressure-induced line shift
δ X X
Speed dependent narrowing air
γ2 X X
Line mixing Y X

Retrieval simulations
Typical uncorrelated spectroscopic errors: • 10% absorption • Bruker FTS • 150 cm MOPD • Ca. 1 h measurement time • Total pressure 100 mbar • Precisions:
σ: 6e-5 cm-1 S: 0.7% γair: 2%
Spectroscopy error CH4 colum error contribution/%
CO colum error contribution/%
CH4 intensity cutoff 0.07 0.4 CH4 S uncor 0.15 1.2 CH4 γair cor 0.23 2.0 CH4 γair uncor 0.06 0.4 CH4 γH2O 0.05 0.4 CH4 n cor 0.20 0.0 CH4 n uncor 0.04 0.2 CH4 δ cor 0.04 0.2 CH4 SDV 0.05 0.0 CH4 LM 0.10 1.8 H2O intensity cutoff 0.08 0.4 H2O σ cor 0.04 0.0 H2O S uncor 0.17 2.3 H2O γair cor 0.25 2.4 H2O γair uncor 0.17 2.0 H2O γH2O cor 0.13 1.2 H2O γH2O uncor 0.08 1.0 H2O δ cor 0.16 1.1 H2O SDV 0.03 0.0 CO S uncor 0.00 0.6
RSS: 0.57 5.3
Summary of error contributions

Measurement plan DLR Molecule Psample/
mbar pair/H2O/ mbar
T/K Abs.path/m Number of meas.
Target parameters
Comment
CH4 0.3-50 - 296 8-168 9 σ S γCH4 ambient T
CH4 0.1-8 30-1000 296 8-168 24 γair γ2air δ Y ambient T
CH4 0.1-1.6 20 296 8-168 6 γH2O ambient T
CH4 0.1-2 0-1000 190-261 8-168 10 n δ(T) Y(T) low T
H2O 0.75-20 - 296 8-168 6 σ S γH2O ambient T
H2O 0.6-20 30-1000 296 59-168 19 γair γ2air δ ambient T
H2O 0.7-20 0-100 253-361 59-168 8 n δ(T) low/high T
D2O 0.3-1 - 296 21-168 4 σ S ambient T
HDO 0.7-2 - 296 21-168 4 σ S ambient T
CO 0.3-1.5 0-1000 296 8 5 σ S γair ambient T
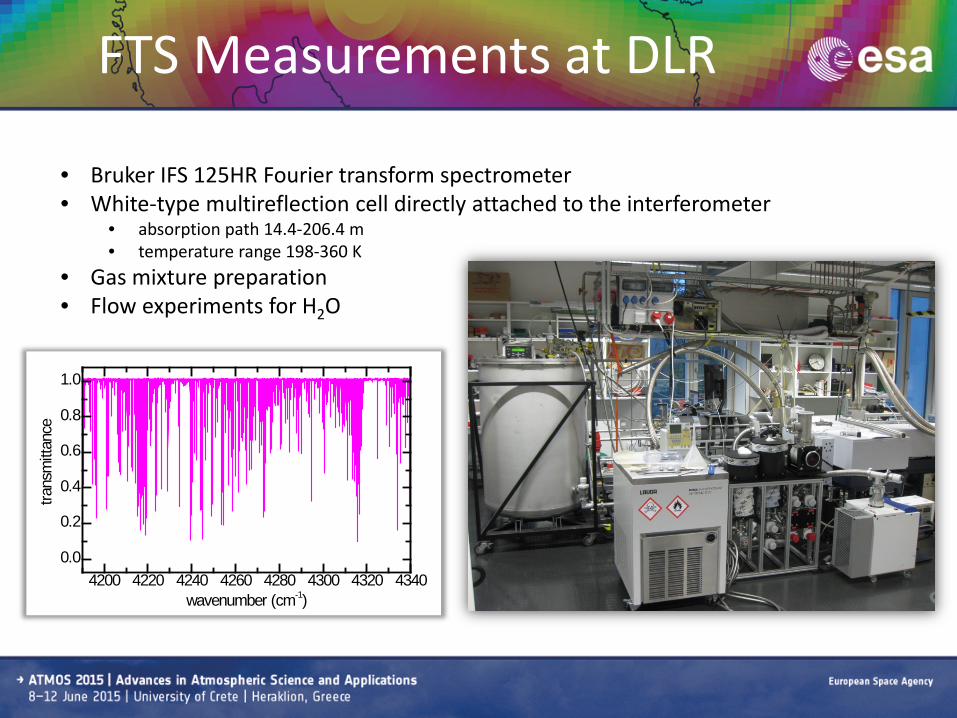
FTS Measurements at DLR
• Bruker IFS 125HR Fourier transform spectrometer • White-type multireflection cell directly attached to the interferometer
• absorption path 14.4-206.4 m • temperature range 198-360 K
• Gas mixture preparation • Flow experiments for H2O
4200 4220 4240 4260 4280 4300 4320 43400.0
0.2
0.4
0.6
0.8
1.0
trans
mitt
ance
wavenumber (cm-1)
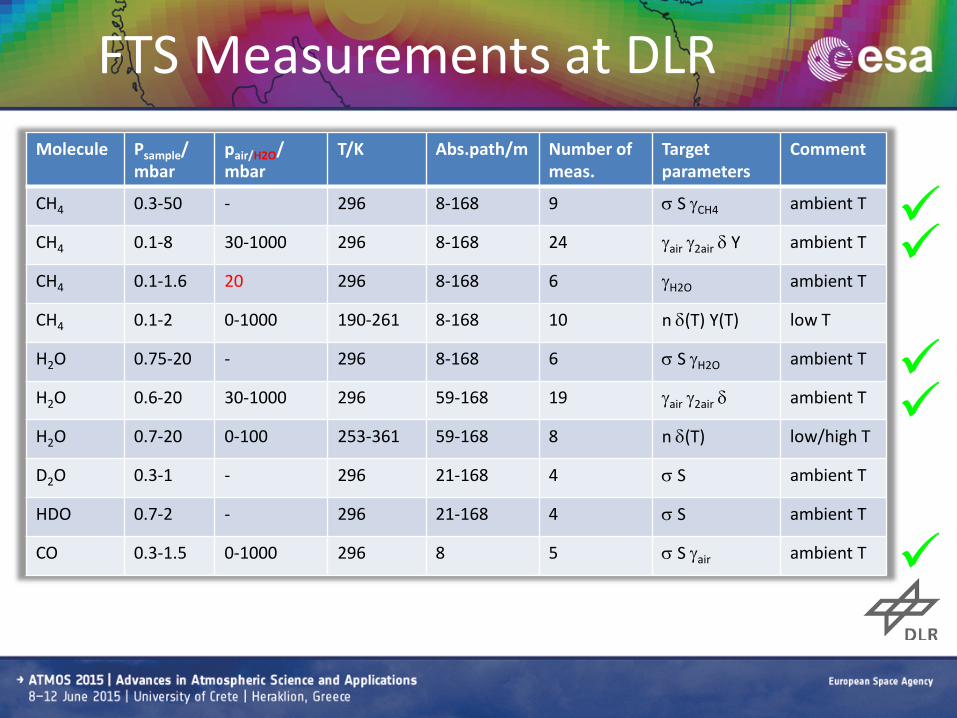
FTS Measurements at DLR Molecule Psample/
mbar pair/H2O/ mbar
T/K Abs.path/m Number of meas.
Target parameters
Comment
CH4 0.3-50 - 296 8-168 9 σ S γCH4 ambient T
CH4 0.1-8 30-1000 296 8-168 24 γair γ2air δ Y ambient T
CH4 0.1-1.6 20 296 8-168 6 γH2O ambient T
CH4 0.1-2 0-1000 190-261 8-168 10 n δ(T) Y(T) low T
H2O 0.75-20 - 296 8-168 6 σ S γH2O ambient T
H2O 0.6-20 30-1000 296 59-168 19 γair γ2air δ ambient T
H2O 0.7-20 0-100 253-361 59-168 8 n δ(T) low/high T
D2O 0.3-1 - 296 21-168 4 σ S ambient T
HDO 0.7-2 - 296 21-168 4 σ S ambient T
CO 0.3-1.5 0-1000 296 8 5 σ S γair ambient T
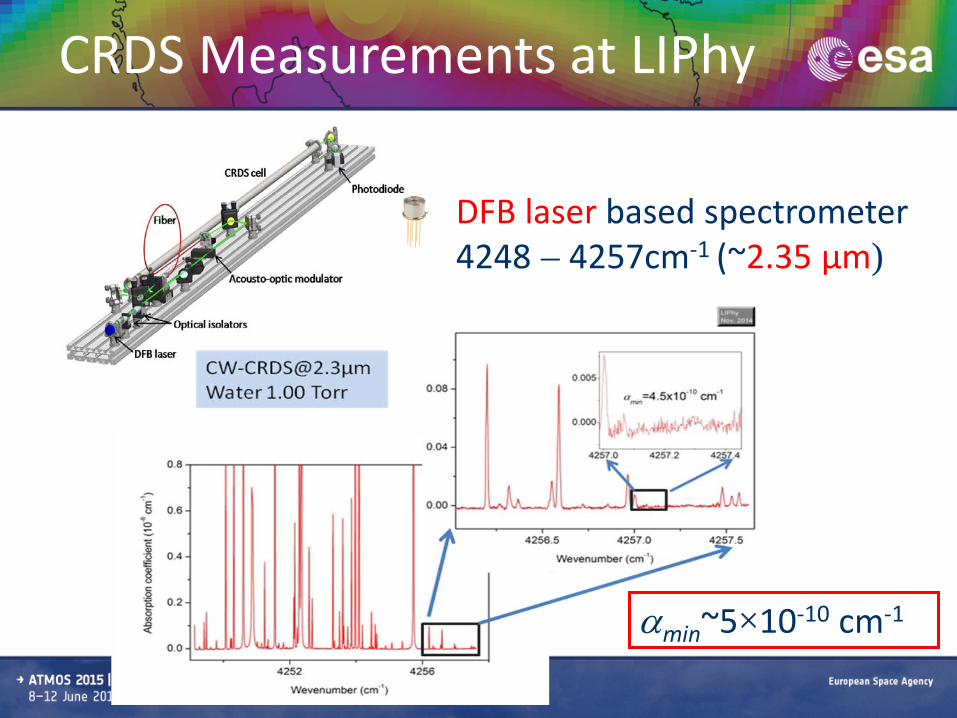
CRDS Measurements at LIPhy
DFB laser based spectrometer 4248 – 4257cm-1 (~2.35 µm)
αmin~5×10⁻¹⁰ cm-1
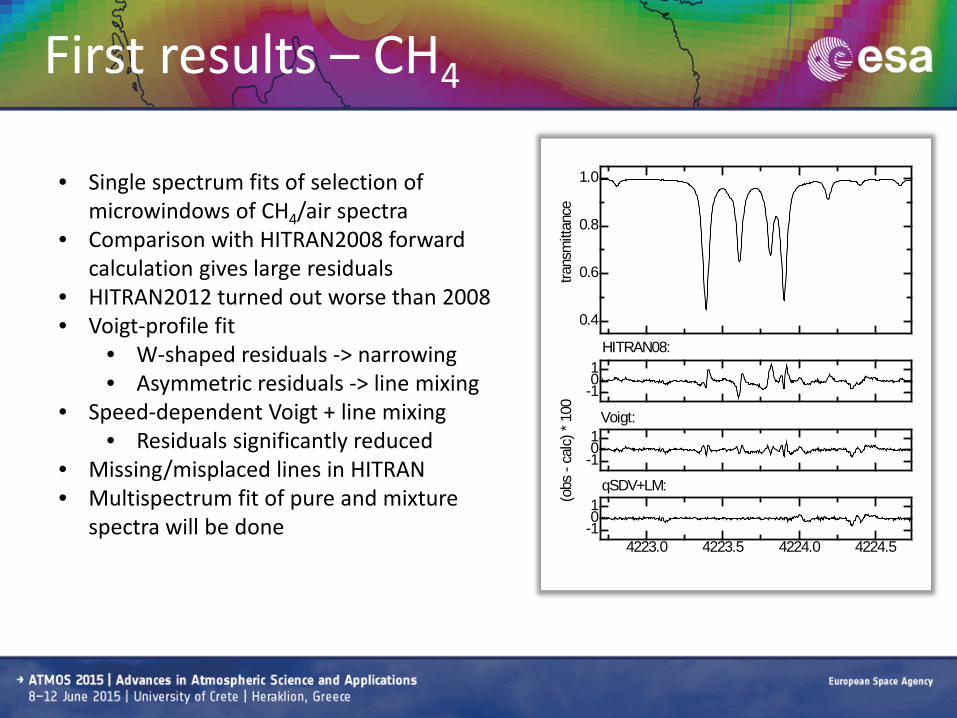
First results – CH4
• Single spectrum fits of selection of microwindows of CH4/air spectra
• Comparison with HITRAN2008 forward calculation gives large residuals
• HITRAN2012 turned out worse than 2008 • Voigt-profile fit
• W-shaped residuals -> narrowing • Asymmetric residuals -> line mixing
• Speed-dependent Voigt + line mixing • Residuals significantly reduced
• Missing/misplaced lines in HITRAN • Multispectrum fit of pure and mixture
spectra will be done
-101
-101
4223.0 4223.5 4224.0 4224.5-101
0.4
0.6
0.8
1.0
trans
mitt
ance
qSDV+LM:
Voigt:
HITRAN08:
(obs
- ca
lc) *
100
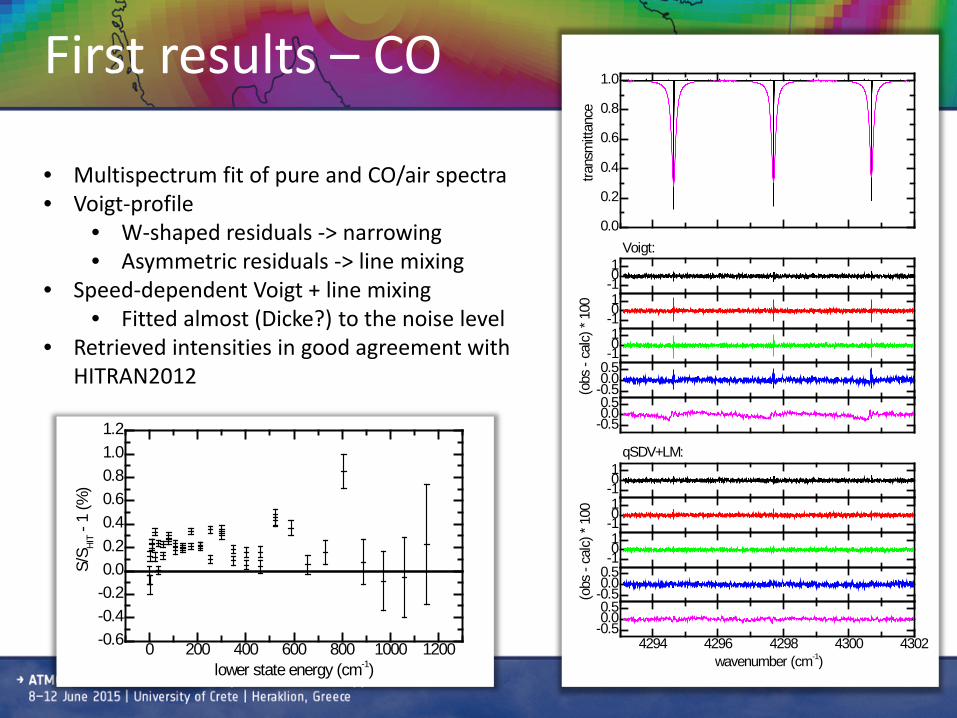
First results – CO
• Multispectrum fit of pure and CO/air spectra • Voigt-profile
• W-shaped residuals -> narrowing • Asymmetric residuals -> line mixing
• Speed-dependent Voigt + line mixing • Fitted almost (Dicke?) to the noise level
• Retrieved intensities in good agreement with HITRAN2012
-101
-101
-101
-0.50.00.5
-0.50.00.5
-101
-101
-101
-0.50.00.5
4294 4296 4298 4300 4302-0.50.00.5
0.0
0.2
0.4
0.6
0.8
1.0
trans
mitt
ance
qSDV+LM:
Voigt:
(o
bs -
calc)
* 10
0
(obs
- ca
lc) *
100
wavenumber (cm-1)0 200 400 600 800 1000 1200-0.6
-0.4-0.20.00.20.40.60.81.01.2
S/S HI
T - 1
(%)
lower state energy (cm-1)
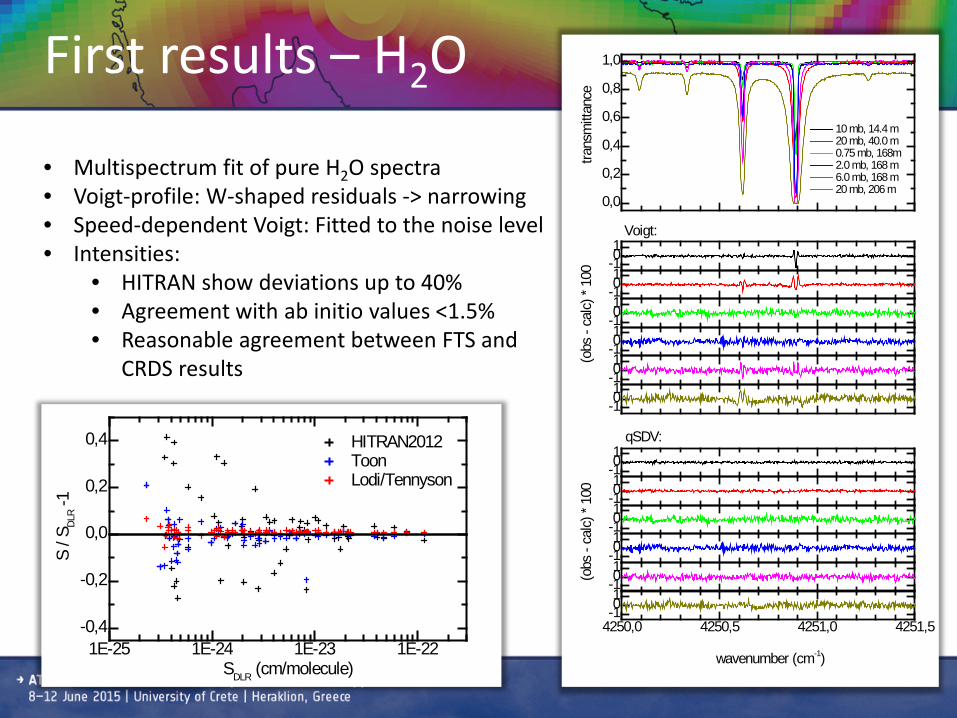
First results – H2O
• Multispectrum fit of pure H2O spectra • Voigt-profile: W-shaped residuals -> narrowing • Speed-dependent Voigt: Fitted to the noise level • Intensities:
• HITRAN show deviations up to 40% • Agreement with ab initio values <1.5% • Reasonable agreement between FTS and
CRDS results
-101
-101
-101
-101
-101
-101
-101
-101
-101
-101
-101
4250,0 4250,5 4251,0 4251,5-101
0,0
0,2
0,4
0,6
0,8
1,0
10 mb, 14.4 m 20 mb, 40.0 m 0.75 mb, 168m 2.0 mb, 168 m 6.0 mb, 168 m 20 mb, 206 m
trans
mitt
ance
qSDV:
Voigt:
(o
bs -
calc)
* 10
0
(obs
- ca
lc) *
100
wavenumber (cm-1)1E-25 1E-24 1E-23 1E-22-0,4
-0,2
0,0
0,2
0,4 HITRAN2012 Toon Lodi/Tennyson
S / S
DLR -
1
SDLR (cm/molecule)
Summary
• Extended retrieval simulations have been carried out to specify the accuracy required for the spectroscopic database -> non-Voigt line shapes have to be used -> spectroscopy of CH4, H2O has to be improved
• Most of the ambient temperature measurements are completed • CO: collisional narrowing and line mixing visible, intensities agree with HITRAN • CH4: line mixing and collisional narrowing has to be accounted for • H2O: satisfactory agreement of FTS and CRDS intensity results • H2O: major intensity differences to HITRAN, good agreement wiith ab initio
• Remaining measurements will be conducted in the coming months