Embed Size (px)
Citation preview
Sg
AD
a
ARRAA
KDOX
1
idinncasm4iltgelc
e
0d
Journal of Alloys and Compounds 488 (2009) 400–408
Contents lists available at ScienceDirect
Journal of Alloys and Compounds
journa l homepage: www.e lsev ier .com/ locate / ja l l com
pectroscopic and dielectric properties of crystallized PbO–Sb2O3–As2O3:NiOlass system
. Padmanabham, Y. Gandhi, T. Satyanarayana, N. Veeraiah ∗
epartment of Physics, Acharya Nagarjuna University-Nuzvid Campus, Nuzvid 521201, A.P., India
r t i c l e i n f o
rticle history:eceived 16 August 2009eceived in revised form 28 August 2009ccepted 31 August 2009vailable online 8 September 2009
eywords:
a b s t r a c t
Glasses of the composition 40PbO–(20 − x)Sb2O3–40As2O3 were crystallized with different concentra-tions of NiO (x) ranging from 0 to 1.5 mol%. The samples were characterized by X-ray diffraction, scanningelectron microscopy and differential thermal analysis techniques. The X-ray diffraction and the scan-ning electron microscopic studies have revealed the presence of NiSb2O6, NiAs2O4, Ni2As2O7, Pb5Sb2O8,PbSb2O6, Pb5Sb4O11 crystalline phases in these samples. Spectroscopic (IR and optical absorption), mag-netic and dielectric studies have been investigated. The IR spectral studies have pointed out the glass
ielectric responseptical properties-ray diffraction
ceramic network is composed of conventional AsO3 and SbO3 structural units; these studies have fur-ther indicated that the concentration of symmetrical vibrations of above structural groups decrease withincrease in the concentration of NiO beyond 0.8 mol%. The analysis of the results of optical absorption,magnetic properties and dielectric properties has indicated that there is a gradual transformation of Ni2+
ions from octahedral to tetrahedral positions when the concentration of the crystallizing agent NiO isincreased beyond 0.8 mol%. From these results it is also assessed that the glass crystallized with about
uitab
0.8 mol% of NiO is more s. Introduction
Crystalline glass materials with appropriate transition metalons like nickel as nucleating agents are considered as better candi-ates for ultra-broad band optical amplifiers that are widely used
n telecommunication systems [1]; in the glass ceramic materialson-radiative losses over the relaxation of excited states of lumi-escence ions are relatively low when compared with glasses andrystalline materials. Though, the rare earth ions doped glassesnd glass ceramics were considered as the suitable candidates foruch applications, but the optical amplification bandwidth in theseaterials is narrowed, due to the fact that the emission bands of
f–4f transition of the rare earth ions are very sharp. Additionally,f the care is taken to minimize the size of the micro-crystals (faress than the wavelength of interest) in the glass ceramics duringhe synthesis, the light scattering caused by these crystals is negli-ibly low and thereby a substantial improvement in the quantumfficiency of the broad band emission can be achieved. Further, the
asing ions disperse more evenly in crystalline embryos of bulk glasseramic samples when compared with as quenched glass samples.Among various transition metal ions, Cr4+ ions were consid-red as potential candidates for high gain optical amplifiers with
∗ Corresponding author. Tel.: +91 9440015188; fax: +91 8656235551.E-mail address: [email protected] (N. Veeraiah).
925-8388/$ – see front matter © 2009 Elsevier B.V. All rights reserved.oi:10.1016/j.jallcom.2009.08.148
le for getting maximum luminescence efficiency in the NIR region.© 2009 Elsevier B.V. All rights reserved.
larger bandwidths in glass ceramics; nevertheless, the chromiumions exist in multi-valent states, viz., Cr3+, Cr4+, Cr5+ and Cr6+ [2,3].The same is true in case of other transition metal ions like Ti andMn [4,5]. Hence, it is too difficult to have the strict control overthe required or suitable valence state of these ions embedded incrystal phases. Unlike these ions, the nickel ions mostly exist indivalent state and are extremely stable and no special care is nec-essary during synthesis to retain nickel ions in divalent state. Therehave been hardly any reports so far about reduction or oxidationof Ni2+ ions into lower or higher oxidation states, respectively inglasses or glass ceramic matrices during synthesis. Further, Ni2+ isan ion with exceptionally large crystal stabilization energies par-ticularly when it is in octahedral field [6]. Ni2+ ions exhibit severalstrong absorption bands in the visible and NIR regions where thepumping sources are easily available. The octahedrally positionedNi2+ ions in glass network are expected to exhibit eye safe laseremission of wavelength of about 1.5 �m due to 3T2 → 3A2 tran-sition, even at room temperature, which is of great importance intelecommunications [7]. There have been considerable recent stud-ies on lasing action and other physical properties of nickel ions invarious glass and glass ceramic materials [8–11].
The heavy metal oxide based glass ceramics like lead antimony
oxide based glass ceramics possess high refractive index and aretransparent to far infrared wavelengths [12–14]; these materialshave got potential applications in non-linear optical devices (suchas ultrafast optical switches, power limiters and broad band opti-cal amplifiers operating around 1.5 �m) [15,16]. Further, antimony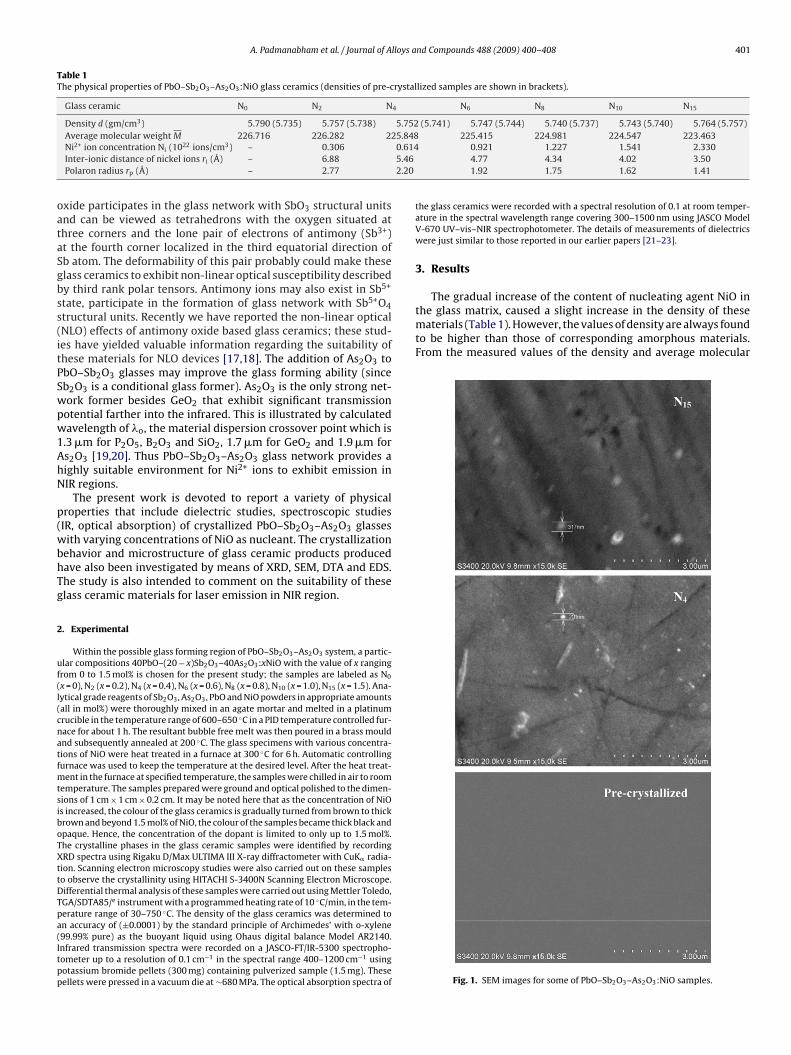
A. Padmanabham et al. / Journal of Alloys and Compounds 488 (2009) 400–408 401
Table 1The physical properties of PbO–Sb2O3–As2O3:NiO glass ceramics (densities of pre-crystallized samples are shown in brackets).
Glass ceramic N0 N2 N4 N6 N8 N10 N15
Density d (gm/cm3) 5.790 (5.735) 5.757 (5.738) 5.752 (5.741) 5.747 (5.744) 5.740 (5.737) 5.743 (5.740) 5.764 (5.757)25.848
0.6145.462.20
oataSgbss(itPSwpw1AhN
p(wbhTg
2
uf(l(cnatfmtsiboTXttDTpa(Itpp
The gradual increase of the content of nucleating agent NiO inthe glass matrix, caused a slight increase in the density of thesematerials (Table 1). However, the values of density are always foundto be higher than those of corresponding amorphous materials.From the measured values of the density and average molecular
Average molecular weight M 226.716 226.282 2Ni2+ ion concentration Ni (1022 ions/cm3) – 0.306Inter-ionic distance of nickel ions ri (Å) – 6.88Polaron radius rp (Å) – 2.77
xide participates in the glass network with SbO3 structural unitsnd can be viewed as tetrahedrons with the oxygen situated athree corners and the lone pair of electrons of antimony (Sb3+)t the fourth corner localized in the third equatorial direction ofb atom. The deformability of this pair probably could make theselass ceramics to exhibit non-linear optical susceptibility describedy third rank polar tensors. Antimony ions may also exist in Sb5+
tate, participate in the formation of glass network with Sb5+O4tructural units. Recently we have reported the non-linear opticalNLO) effects of antimony oxide based glass ceramics; these stud-es have yielded valuable information regarding the suitability ofhese materials for NLO devices [17,18]. The addition of As2O3 tobO–Sb2O3 glasses may improve the glass forming ability (sinceb2O3 is a conditional glass former). As2O3 is the only strong net-ork former besides GeO2 that exhibit significant transmissionotential farther into the infrared. This is illustrated by calculatedavelength of �o, the material dispersion crossover point which is
.3 �m for P2O5, B2O3 and SiO2, 1.7 �m for GeO2 and 1.9 �m fors2O3 [19,20]. Thus PbO–Sb2O3–As2O3 glass network provides aighly suitable environment for Ni2+ ions to exhibit emission inIR regions.
The present work is devoted to report a variety of physicalroperties that include dielectric studies, spectroscopic studiesIR, optical absorption) of crystallized PbO–Sb2O3–As2O3 glassesith varying concentrations of NiO as nucleant. The crystallization
ehavior and microstructure of glass ceramic products producedave also been investigated by means of XRD, SEM, DTA and EDS.he study is also intended to comment on the suitability of theselass ceramic materials for laser emission in NIR region.
. Experimental
Within the possible glass forming region of PbO–Sb2O3–As2O3 system, a partic-lar compositions 40PbO–(20 − x)Sb2O3–40As2O3:xNiO with the value of x rangingrom 0 to 1.5 mol% is chosen for the present study; the samples are labeled as N0
x = 0), N2 (x = 0.2), N4 (x = 0.4), N6 (x = 0.6), N8 (x = 0.8), N10 (x = 1.0), N15 (x = 1.5). Ana-ytical grade reagents of Sb2O3, As2O3, PbO and NiO powders in appropriate amountsall in mol%) were thoroughly mixed in an agate mortar and melted in a platinumrucible in the temperature range of 600–650 ◦C in a PID temperature controlled fur-ace for about 1 h. The resultant bubble free melt was then poured in a brass mouldnd subsequently annealed at 200 ◦C. The glass specimens with various concentra-ions of NiO were heat treated in a furnace at 300 ◦C for 6 h. Automatic controllingurnace was used to keep the temperature at the desired level. After the heat treat-
ent in the furnace at specified temperature, the samples were chilled in air to roomemperature. The samples prepared were ground and optical polished to the dimen-ions of 1 cm × 1 cm × 0.2 cm. It may be noted here that as the concentration of NiOs increased, the colour of the glass ceramics is gradually turned from brown to thickrown and beyond 1.5 mol% of NiO, the colour of the samples became thick black andpaque. Hence, the concentration of the dopant is limited to only up to 1.5 mol%.he crystalline phases in the glass ceramic samples were identified by recordingRD spectra using Rigaku D/Max ULTIMA III X-ray diffractometer with CuK� radia-
ion. Scanning electron microscopy studies were also carried out on these sampleso observe the crystallinity using HITACHI S-3400N Scanning Electron Microscope.ifferential thermal analysis of these samples were carried out using Mettler Toledo,GA/SDTA85/e instrument with a programmed heating rate of 10 ◦C/min, in the tem-erature range of 30–750 ◦C. The density of the glass ceramics was determined to
n accuracy of (±0.0001) by the standard principle of Archimedes’ with o-xylene99.99% pure) as the buoyant liquid using Ohaus digital balance Model AR2140.nfrared transmission spectra were recorded on a JASCO-FT/IR-5300 spectropho-ometer up to a resolution of 0.1 cm−1 in the spectral range 400–1200 cm−1 usingotassium bromide pellets (300 mg) containing pulverized sample (1.5 mg). Theseellets were pressed in a vacuum die at ∼680 MPa. The optical absorption spectra of225.415 224.981 224.547 223.4630.921 1.227 1.541 2.3304.77 4.34 4.02 3.501.92 1.75 1.62 1.41
the glass ceramics were recorded with a spectral resolution of 0.1 at room temper-ature in the spectral wavelength range covering 300–1500 nm using JASCO ModelV-670 UV–vis–NIR spectrophotometer. The details of measurements of dielectricswere just similar to those reported in our earlier papers [21–23].
3. Results
Fig. 1. SEM images for some of PbO–Sb2O3–As2O3:NiO samples.
402 A. Padmanabham et al. / Journal of Alloys and Compounds 488 (2009) 400–408
–Sb2O
wnrp
circcocvbpiet
TSP
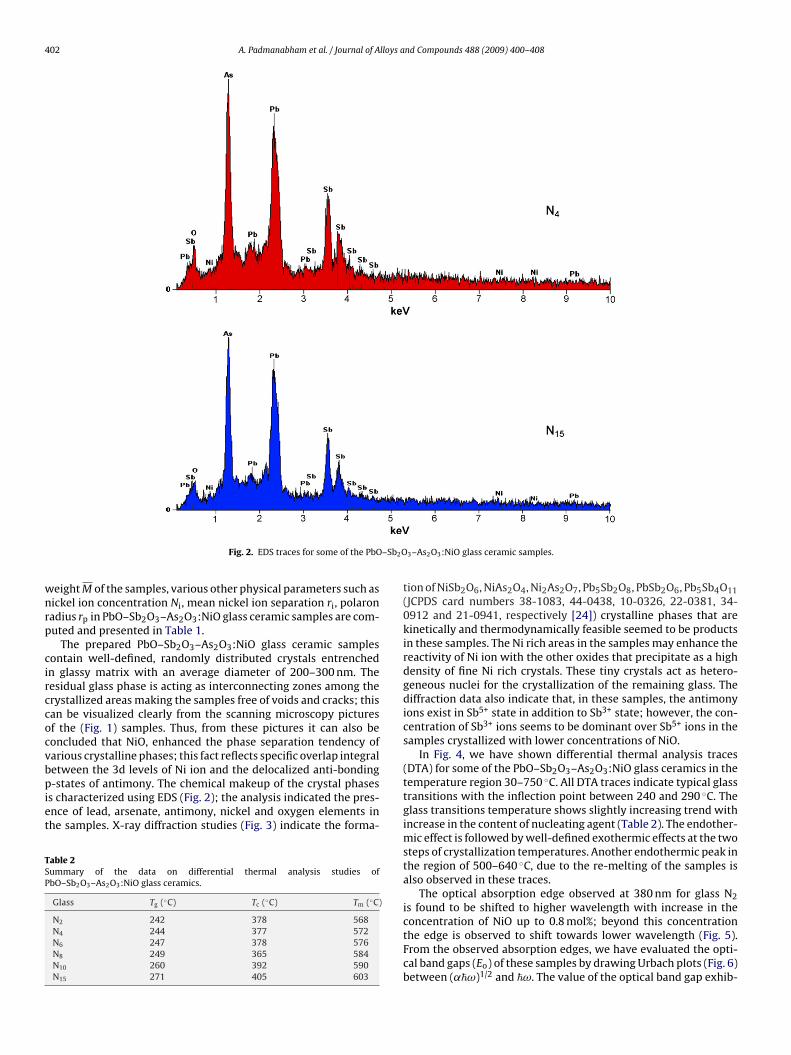
Fig. 2. EDS traces for some of the PbO
eight M of the samples, various other physical parameters such asickel ion concentration Ni, mean nickel ion separation ri, polaronadius rp in PbO–Sb2O3–As2O3:NiO glass ceramic samples are com-uted and presented in Table 1.
The prepared PbO–Sb2O3–As2O3:NiO glass ceramic samplesontain well-defined, randomly distributed crystals entrenchedn glassy matrix with an average diameter of 200–300 nm. Theesidual glass phase is acting as interconnecting zones among therystallized areas making the samples free of voids and cracks; thisan be visualized clearly from the scanning microscopy picturesf the (Fig. 1) samples. Thus, from these pictures it can also beoncluded that NiO, enhanced the phase separation tendency ofarious crystalline phases; this fact reflects specific overlap integraletween the 3d levels of Ni ion and the delocalized anti-bonding
-states of antimony. The chemical makeup of the crystal phasess characterized using EDS (Fig. 2); the analysis indicated the pres-nce of lead, arsenate, antimony, nickel and oxygen elements inhe samples. X-ray diffraction studies (Fig. 3) indicate the forma-
able 2ummary of the data on differential thermal analysis studies ofbO–Sb2O3–As2O3:NiO glass ceramics.
Glass Tg (◦C) Tc (◦C) Tm (◦C)
N2 242 378 568N4 244 377 572N6 247 378 576N8 249 365 584N10 260 392 590N15 271 405 603
3–As2O3:NiO glass ceramic samples.
tion of NiSb2O6, NiAs2O4, Ni2As2O7, Pb5Sb2O8, PbSb2O6, Pb5Sb4O11(JCPDS card numbers 38-1083, 44-0438, 10-0326, 22-0381, 34-0912 and 21-0941, respectively [24]) crystalline phases that arekinetically and thermodynamically feasible seemed to be productsin these samples. The Ni rich areas in the samples may enhance thereactivity of Ni ion with the other oxides that precipitate as a highdensity of fine Ni rich crystals. These tiny crystals act as hetero-geneous nuclei for the crystallization of the remaining glass. Thediffraction data also indicate that, in these samples, the antimonyions exist in Sb5+ state in addition to Sb3+ state; however, the con-centration of Sb3+ ions seems to be dominant over Sb5+ ions in thesamples crystallized with lower concentrations of NiO.
In Fig. 4, we have shown differential thermal analysis traces(DTA) for some of the PbO–Sb2O3–As2O3:NiO glass ceramics in thetemperature region 30–750 ◦C. All DTA traces indicate typical glasstransitions with the inflection point between 240 and 290 ◦C. Theglass transitions temperature shows slightly increasing trend withincrease in the content of nucleating agent (Table 2). The endother-mic effect is followed by well-defined exothermic effects at the twosteps of crystallization temperatures. Another endothermic peak inthe region of 500–640 ◦C, due to the re-melting of the samples isalso observed in these traces.
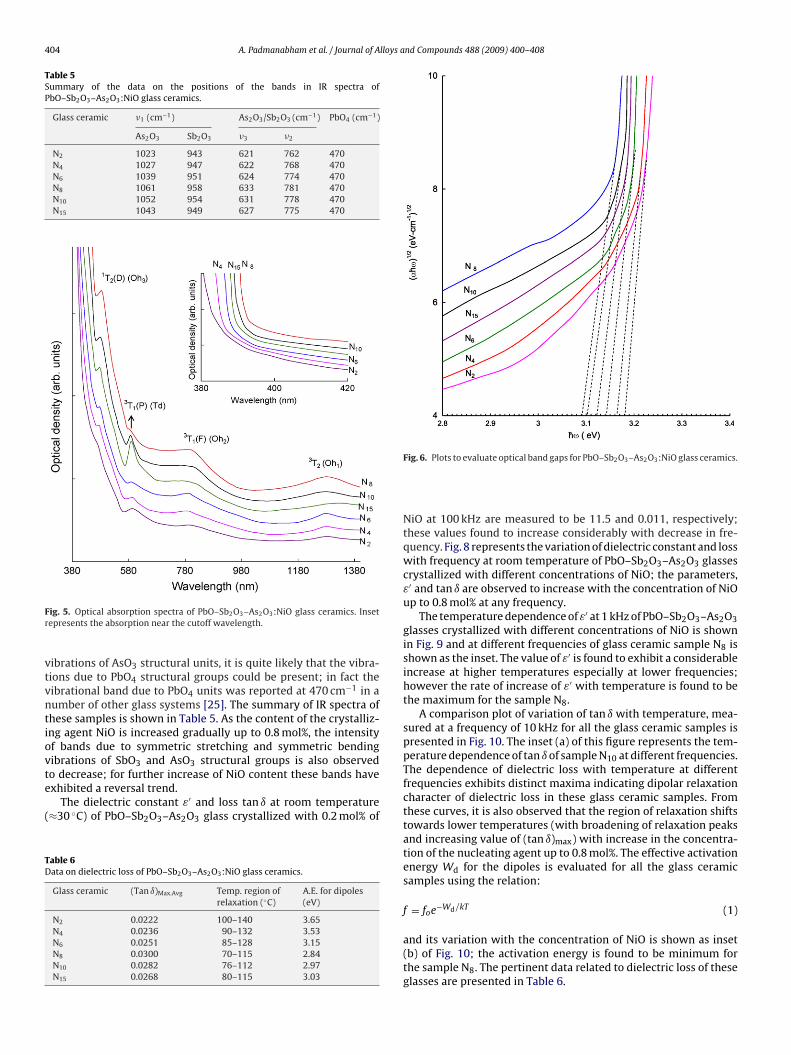
The optical absorption edge observed at 380 nm for glass N2is found to be shifted to higher wavelength with increase in the
concentration of NiO up to 0.8 mol%; beyond this concentrationthe edge is observed to shift towards lower wavelength (Fig. 5).From the observed absorption edges, we have evaluated the opti-cal band gaps (Eo) of these samples by drawing Urbach plots (Fig. 6)between (˛�ω)1/2 and �ω. The value of the optical band gap exhib-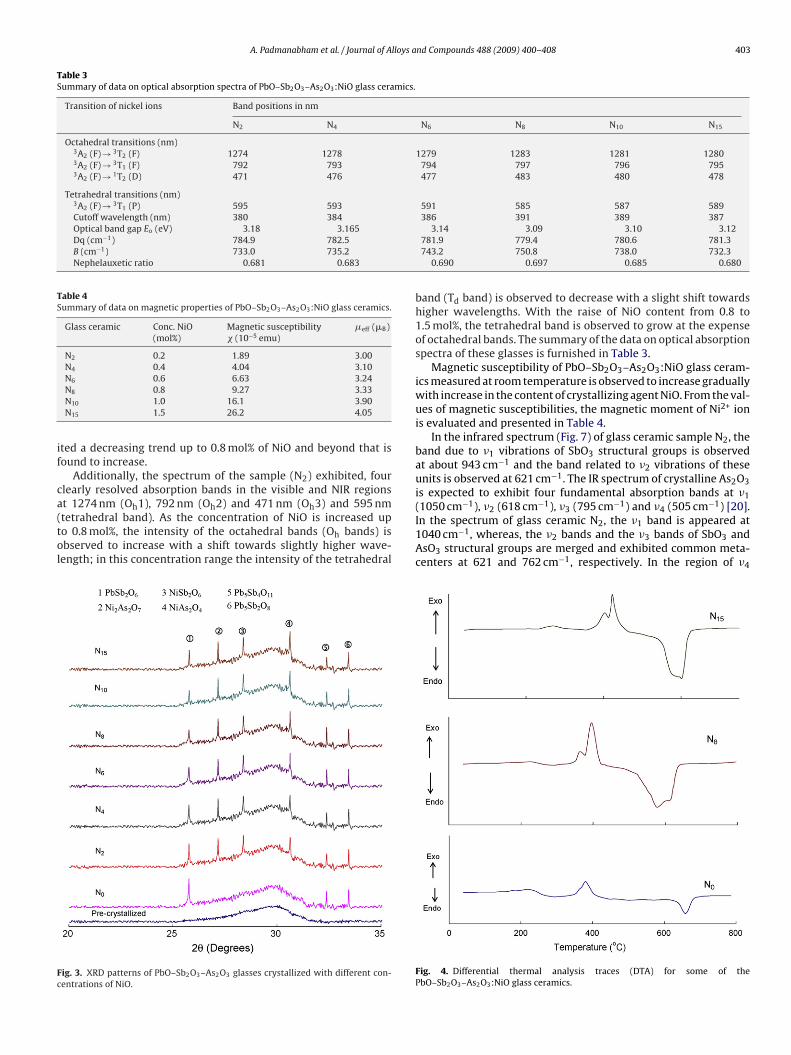
A. Padmanabham et al. / Journal of Alloys and Compounds 488 (2009) 400–408 403
Table 3Summary of data on optical absorption spectra of PbO–Sb2O3–As2O3:NiO glass ceramics.
Transition of nickel ions Band positions in nm
N2 N4 N6 N8 N10 N15
Octahedral transitions (nm)3A2 (F) → 3T2 (F) 1274 1278 1279 1283 1281 12803A2 (F) → 3T1 (F) 792 793 794 797 796 7953A2 (F) → 1T2 (D) 471 476 477 483 480 478
Tetrahedral transitions (nm)3A2 (F) → 3T1 (P) 595 593 591 585 587 589Cutoff wavelength (nm) 380 384 386 391 389 387Optical band gap Eo (eV) 3.18 3.165Dq (cm−1) 784.9 782.5B (cm−1) 733.0 735.2Nephelauxetic ratio 0.681 0.683
Table 4Summary of data on magnetic properties of PbO–Sb2O3–As2O3:NiO glass ceramics.
Glass ceramic Conc. NiO(mol%)
Magnetic susceptibility� (10−5 emu)
�eff (�B)
N2 0.2 1.89 3.00N4 0.4 4.04 3.10
if
ca(tol
Fc
N6 0.6 6.63 3.24N8 0.8 9.27 3.33N10 1.0 16.1 3.90N15 1.5 26.2 4.05
ted a decreasing trend up to 0.8 mol% of NiO and beyond that isound to increase.
Additionally, the spectrum of the sample (N2) exhibited, fourlearly resolved absorption bands in the visible and NIR regions
t 1274 nm (Oh1), 792 nm (Oh2) and 471 nm (Oh3) and 595 nmtetrahedral band). As the concentration of NiO is increased upo 0.8 mol%, the intensity of the octahedral bands (Oh bands) isbserved to increase with a shift towards slightly higher wave-ength; in this concentration range the intensity of the tetrahedralig. 3. XRD patterns of PbO–Sb2O3–As2O3 glasses crystallized with different con-entrations of NiO.
3.14 3.09 3.10 3.12781.9 779.4 780.6 781.3743.2 750.8 738.0 732.3
0.690 0.697 0.685 0.680
band (Td band) is observed to decrease with a slight shift towardshigher wavelengths. With the raise of NiO content from 0.8 to1.5 mol%, the tetrahedral band is observed to grow at the expenseof octahedral bands. The summary of the data on optical absorptionspectra of these glasses is furnished in Table 3.
Magnetic susceptibility of PbO–Sb2O3–As2O3:NiO glass ceram-ics measured at room temperature is observed to increase graduallywith increase in the content of crystallizing agent NiO. From the val-ues of magnetic susceptibilities, the magnetic moment of Ni2+ ionis evaluated and presented in Table 4.
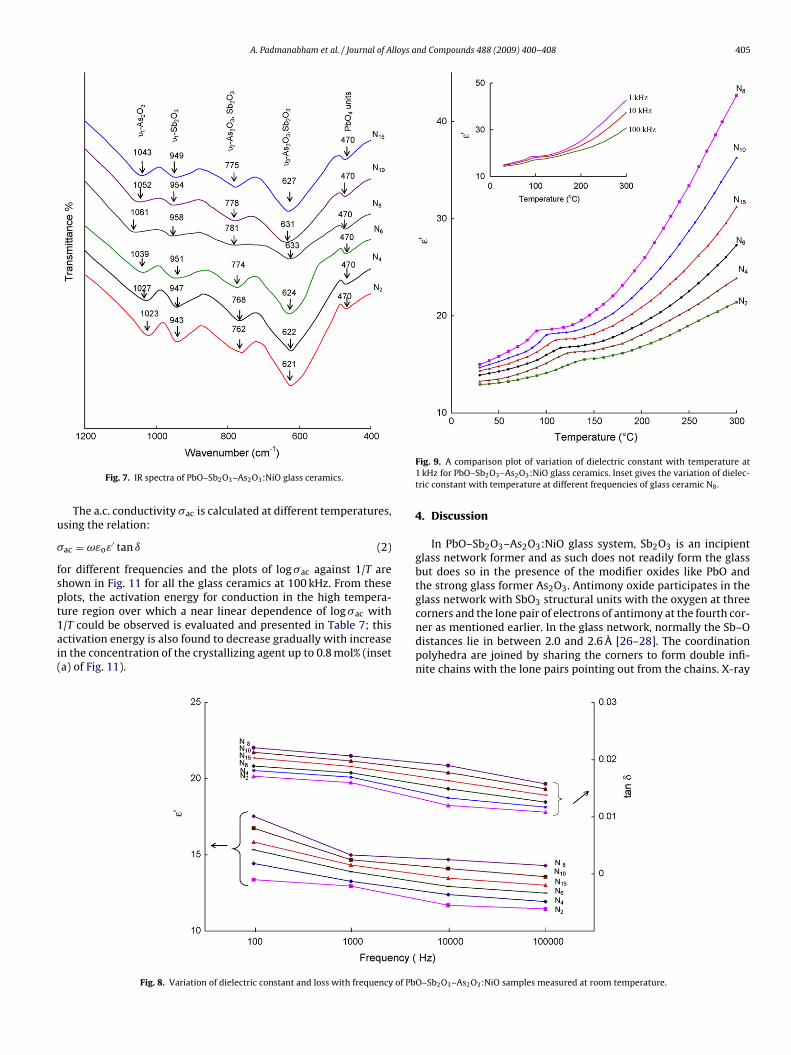
In the infrared spectrum (Fig. 7) of glass ceramic sample N2, theband due to �1 vibrations of SbO3 structural groups is observedat about 943 cm−1 and the band related to �2 vibrations of theseunits is observed at 621 cm−1. The IR spectrum of crystalline As2O3is expected to exhibit four fundamental absorption bands at �1
−1 −1 −1 −1
(1050 cm ), �2 (618 cm ), �3 (795 cm ) and �4 (505 cm ) [20].In the spectrum of glass ceramic N2, the �1 band is appeared at1040 cm−1, whereas, the �2 bands and the �3 bands of SbO3 andAsO3 structural groups are merged and exhibited common meta-centers at 621 and 762 cm−1, respectively. In the region of �4Fig. 4. Differential thermal analysis traces (DTA) for some of thePbO–Sb2O3–As2O3:NiO glass ceramics.
404 A. Padmanabham et al. / Journal of Alloys and Compounds 488 (2009) 400–408
Table 5Summary of the data on the positions of the bands in IR spectra ofPbO–Sb2O3–As2O3:NiO glass ceramics.
Glass ceramic �1 (cm−1) As2O3/Sb2O3 (cm−1) PbO4 (cm−1)
As2O3 Sb2O3 �3 �2
N2 1023 943 621 762 470N4 1027 947 622 768 470N6 1039 951 624 774 470N8 1061 958 633 781 470N10 1052 954 631 778 470N15 1043 949 627 775 470
Fr
vtvntiovte
(
TD
ig. 5. Optical absorption spectra of PbO–Sb2O3–As2O3:NiO glass ceramics. Insetepresents the absorption near the cutoff wavelength.
ibrations of AsO3 structural units, it is quite likely that the vibra-ions due to PbO4 structural groups could be present; in fact theibrational band due to PbO4 units was reported at 470 cm−1 in aumber of other glass systems [25]. The summary of IR spectra ofhese samples is shown in Table 5. As the content of the crystalliz-ng agent NiO is increased gradually up to 0.8 mol%, the intensityf bands due to symmetric stretching and symmetric bendingibrations of SbO3 and AsO3 structural groups is also observed
o decrease; for further increase of NiO content these bands havexhibited a reversal trend.The dielectric constant ε′ and loss tan ı at room temperature≈30 ◦C) of PbO–Sb2O3–As2O3 glass crystallized with 0.2 mol% of
able 6ata on dielectric loss of PbO–Sb2O3–As2O3:NiO glass ceramics.
Glass ceramic (Tan ı)Max.Avg Temp. region ofrelaxation (◦C)
A.E. for dipoles(eV)
N2 0.0222 100–140 3.65N4 0.0236 90–132 3.53N6 0.0251 85–128 3.15N8 0.0300 70–115 2.84N10 0.0282 76–112 2.97N15 0.0268 80–115 3.03
Fig. 6. Plots to evaluate optical band gaps for PbO–Sb2O3–As2O3:NiO glass ceramics.
NiO at 100 kHz are measured to be 11.5 and 0.011, respectively;these values found to increase considerably with decrease in fre-quency. Fig. 8 represents the variation of dielectric constant and losswith frequency at room temperature of PbO–Sb2O3–As2O3 glassescrystallized with different concentrations of NiO; the parameters,ε′ and tan ı are observed to increase with the concentration of NiOup to 0.8 mol% at any frequency.
The temperature dependence of ε′ at 1 kHz of PbO–Sb2O3–As2O3glasses crystallized with different concentrations of NiO is shownin Fig. 9 and at different frequencies of glass ceramic sample N8 isshown as the inset. The value of ε′ is found to exhibit a considerableincrease at higher temperatures especially at lower frequencies;however the rate of increase of ε′ with temperature is found to bethe maximum for the sample N8.
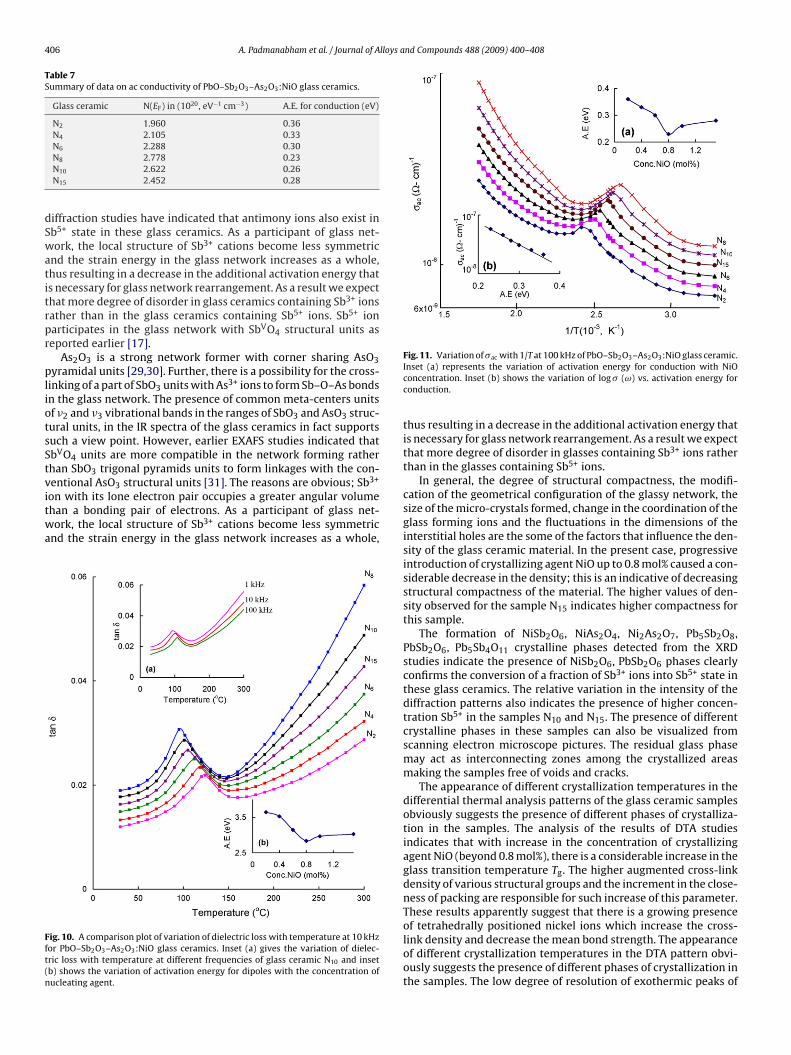
A comparison plot of variation of tan ı with temperature, mea-sured at a frequency of 10 kHz for all the glass ceramic samples ispresented in Fig. 10. The inset (a) of this figure represents the tem-perature dependence of tan ı of sample N10 at different frequencies.The dependence of dielectric loss with temperature at differentfrequencies exhibits distinct maxima indicating dipolar relaxationcharacter of dielectric loss in these glass ceramic samples. Fromthese curves, it is also observed that the region of relaxation shiftstowards lower temperatures (with broadening of relaxation peaksand increasing value of (tan ı)max) with increase in the concentra-tion of the nucleating agent up to 0.8 mol%. The effective activationenergy Wd for the dipoles is evaluated for all the glass ceramicsamples using the relation:
f = foe−Wd/kT (1)
and its variation with the concentration of NiO is shown as inset(b) of Fig. 10; the activation energy is found to be minimum forthe sample N8. The pertinent data related to dielectric loss of theseglasses are presented in Table 6.
A. Padmanabham et al. / Journal of Alloys and Compounds 488 (2009) 400–408 405
u
�
fspt1ai(
Fig. 7. IR spectra of PbO–Sb2O3–As2O3:NiO glass ceramics.
The a.c. conductivity �ac is calculated at different temperatures,sing the relation:
ac = ωεoε′ tan ı (2)
or different frequencies and the plots of log �ac against 1/T arehown in Fig. 11 for all the glass ceramics at 100 kHz. From theselots, the activation energy for conduction in the high tempera-
ure region over which a near linear dependence of log �ac with/T could be observed is evaluated and presented in Table 7; thisctivation energy is also found to decrease gradually with increasen the concentration of the crystallizing agent up to 0.8 mol% (inseta) of Fig. 11).Fig. 8. Variation of dielectric constant and loss with frequency of Pb
Fig. 9. A comparison plot of variation of dielectric constant with temperature at1 kHz for PbO–Sb2O3–As2O3:NiO glass ceramics. Inset gives the variation of dielec-tric constant with temperature at different frequencies of glass ceramic N8.
4. Discussion
In PbO–Sb2O3–As2O3:NiO glass system, Sb2O3 is an incipientglass network former and as such does not readily form the glassbut does so in the presence of the modifier oxides like PbO andthe strong glass former As2O3. Antimony oxide participates in theglass network with SbO3 structural units with the oxygen at three
corners and the lone pair of electrons of antimony at the fourth cor-ner as mentioned earlier. In the glass network, normally the Sb–Odistances lie in between 2.0 and 2.6 Å [26–28]. The coordinationpolyhedra are joined by sharing the corners to form double infi-nite chains with the lone pairs pointing out from the chains. X-rayO–Sb2O3–As2O3:NiO samples measured at room temperature.
406 A. Padmanabham et al. / Journal of Alloys and Compounds 488 (2009) 400–408
Table 7Summary of data on ac conductivity of PbO–Sb2O3–As2O3:NiO glass ceramics.
Glass ceramic N(EF) in (1020, eV−1 cm−3) A.E. for conduction (eV)
N2 1.960 0.36N4 2.105 0.33N 2.288 0.30
dSwatitrpr
pliotsStvitwa
Fft(n
6
N8 2.778 0.23N10 2.622 0.26N15 2.452 0.28
iffraction studies have indicated that antimony ions also exist inb5+ state in these glass ceramics. As a participant of glass net-ork, the local structure of Sb3+ cations become less symmetric
nd the strain energy in the glass network increases as a whole,hus resulting in a decrease in the additional activation energy thats necessary for glass network rearrangement. As a result we expecthat more degree of disorder in glass ceramics containing Sb3+ ionsather than in the glass ceramics containing Sb5+ ions. Sb5+ ionarticipates in the glass network with SbVO4 structural units aseported earlier [17].
As2O3 is a strong network former with corner sharing AsO3yramidal units [29,30]. Further, there is a possibility for the cross-
inking of a part of SbO3 units with As3+ ions to form Sb–O–As bondsn the glass network. The presence of common meta-centers unitsf �2 and �3 vibrational bands in the ranges of SbO3 and AsO3 struc-ural units, in the IR spectra of the glass ceramics in fact supportsuch a view point. However, earlier EXAFS studies indicated thatbVO4 units are more compatible in the network forming ratherhan SbO3 trigonal pyramids units to form linkages with the con-entional AsO structural units [31]. The reasons are obvious; Sb3+
3on with its lone electron pair occupies a greater angular volumehan a bonding pair of electrons. As a participant of glass net-ork, the local structure of Sb3+ cations become less symmetric
nd the strain energy in the glass network increases as a whole,
ig. 10. A comparison plot of variation of dielectric loss with temperature at 10 kHzor PbO–Sb2O3–As2O3:NiO glass ceramics. Inset (a) gives the variation of dielec-ric loss with temperature at different frequencies of glass ceramic N10 and insetb) shows the variation of activation energy for dipoles with the concentration ofucleating agent.
Fig. 11. Variation of �ac with 1/T at 100 kHz of PbO–Sb2O3–As2O3:NiO glass ceramic.Inset (a) represents the variation of activation energy for conduction with NiOconcentration. Inset (b) shows the variation of log � (ω) vs. activation energy forconduction.
thus resulting in a decrease in the additional activation energy thatis necessary for glass network rearrangement. As a result we expectthat more degree of disorder in glasses containing Sb3+ ions ratherthan in the glasses containing Sb5+ ions.
In general, the degree of structural compactness, the modifi-cation of the geometrical configuration of the glassy network, thesize of the micro-crystals formed, change in the coordination of theglass forming ions and the fluctuations in the dimensions of theinterstitial holes are the some of the factors that influence the den-sity of the glass ceramic material. In the present case, progressiveintroduction of crystallizing agent NiO up to 0.8 mol% caused a con-siderable decrease in the density; this is an indicative of decreasingstructural compactness of the material. The higher values of den-sity observed for the sample N15 indicates higher compactness forthis sample.
The formation of NiSb2O6, NiAs2O4, Ni2As2O7, Pb5Sb2O8,PbSb2O6, Pb5Sb4O11 crystalline phases detected from the XRDstudies indicate the presence of NiSb2O6, PbSb2O6 phases clearlyconfirms the conversion of a fraction of Sb3+ ions into Sb5+ state inthese glass ceramics. The relative variation in the intensity of thediffraction patterns also indicates the presence of higher concen-tration Sb5+ in the samples N10 and N15. The presence of differentcrystalline phases in these samples can also be visualized fromscanning electron microscope pictures. The residual glass phasemay act as interconnecting zones among the crystallized areasmaking the samples free of voids and cracks.
The appearance of different crystallization temperatures in thedifferential thermal analysis patterns of the glass ceramic samplesobviously suggests the presence of different phases of crystalliza-tion in the samples. The analysis of the results of DTA studiesindicates that with increase in the concentration of crystallizingagent NiO (beyond 0.8 mol%), there is a considerable increase in theglass transition temperature Tg. The higher augmented cross-linkdensity of various structural groups and the increment in the close-ness of packing are responsible for such increase of this parameter.These results apparently suggest that there is a growing presenceof tetrahedrally positioned nickel ions which increase the cross-
link density and decrease the mean bond strength. The appearanceof different crystallization temperatures in the DTA pattern obvi-ously suggests the presence of different phases of crystallization inthe samples. The low degree of resolution of exothermic peaks of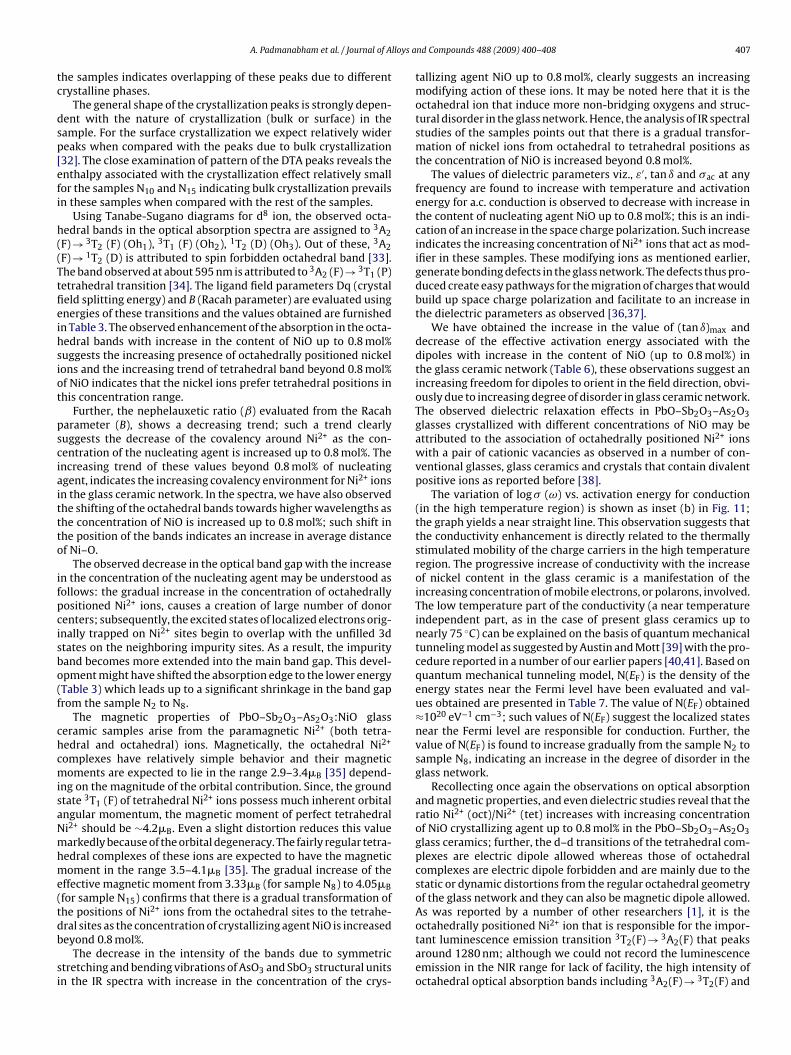
lloys a
tc
dsp[efi
h((Ttfieihsiot
psciaittto
ifpcisbo(f
chcmisaNmhme(tdb
si
A. Padmanabham et al. / Journal of A
he samples indicates overlapping of these peaks due to differentrystalline phases.
The general shape of the crystallization peaks is strongly depen-ent with the nature of crystallization (bulk or surface) in theample. For the surface crystallization we expect relatively widereaks when compared with the peaks due to bulk crystallization32]. The close examination of pattern of the DTA peaks reveals thenthalpy associated with the crystallization effect relatively smallor the samples N10 and N15 indicating bulk crystallization prevailsn these samples when compared with the rest of the samples.
Using Tanabe-Sugano diagrams for d8 ion, the observed octa-edral bands in the optical absorption spectra are assigned to 3A2F) → 3T2 (F) (Oh1), 3T1 (F) (Oh2), 1T2 (D) (Oh3). Out of these, 3A2F) → 1T2 (D) is attributed to spin forbidden octahedral band [33].he band observed at about 595 nm is attributed to 3A2 (F) → 3T1 (P)etrahedral transition [34]. The ligand field parameters Dq (crystaleld splitting energy) and B (Racah parameter) are evaluated usingnergies of these transitions and the values obtained are furnishedn Table 3. The observed enhancement of the absorption in the octa-edral bands with increase in the content of NiO up to 0.8 mol%uggests the increasing presence of octahedrally positioned nickelons and the increasing trend of tetrahedral band beyond 0.8 mol%f NiO indicates that the nickel ions prefer tetrahedral positions inhis concentration range.
Further, the nephelauxetic ratio (ˇ) evaluated from the Racaharameter (B), shows a decreasing trend; such a trend clearlyuggests the decrease of the covalency around Ni2+ as the con-entration of the nucleating agent is increased up to 0.8 mol%. Thencreasing trend of these values beyond 0.8 mol% of nucleatinggent, indicates the increasing covalency environment for Ni2+ ionsn the glass ceramic network. In the spectra, we have also observedhe shifting of the octahedral bands towards higher wavelengths ashe concentration of NiO is increased up to 0.8 mol%; such shift inhe position of the bands indicates an increase in average distancef Ni–O.
The observed decrease in the optical band gap with the increasen the concentration of the nucleating agent may be understood asollows: the gradual increase in the concentration of octahedrallyositioned Ni2+ ions, causes a creation of large number of donorenters; subsequently, the excited states of localized electrons orig-nally trapped on Ni2+ sites begin to overlap with the unfilled 3dtates on the neighboring impurity sites. As a result, the impurityand becomes more extended into the main band gap. This devel-pment might have shifted the absorption edge to the lower energyTable 3) which leads up to a significant shrinkage in the band gaprom the sample N2 to N8.
The magnetic properties of PbO–Sb2O3–As2O3:NiO glasseramic samples arise from the paramagnetic Ni2+ (both tetra-edral and octahedral) ions. Magnetically, the octahedral Ni2+
omplexes have relatively simple behavior and their magneticoments are expected to lie in the range 2.9–3.4�B [35] depend-
ng on the magnitude of the orbital contribution. Since, the groundtate 3T1 (F) of tetrahedral Ni2+ ions possess much inherent orbitalngular momentum, the magnetic moment of perfect tetrahedrali2+ should be ∼4.2�B. Even a slight distortion reduces this valuearkedly because of the orbital degeneracy. The fairly regular tetra-
edral complexes of these ions are expected to have the magneticoment in the range 3.5–4.1�B [35]. The gradual increase of the
ffective magnetic moment from 3.33�B (for sample N8) to 4.05�Bfor sample N15) confirms that there is a gradual transformation ofhe positions of Ni2+ ions from the octahedral sites to the tetrahe-
ral sites as the concentration of crystallizing agent NiO is increasedeyond 0.8 mol%.The decrease in the intensity of the bands due to symmetrictretching and bending vibrations of AsO3 and SbO3 structural unitsn the IR spectra with increase in the concentration of the crys-
nd Compounds 488 (2009) 400–408 407
tallizing agent NiO up to 0.8 mol%, clearly suggests an increasingmodifying action of these ions. It may be noted here that it is theoctahedral ion that induce more non-bridging oxygens and struc-tural disorder in the glass network. Hence, the analysis of IR spectralstudies of the samples points out that there is a gradual transfor-mation of nickel ions from octahedral to tetrahedral positions asthe concentration of NiO is increased beyond 0.8 mol%.
The values of dielectric parameters viz., ε′, tan ı and �ac at anyfrequency are found to increase with temperature and activationenergy for a.c. conduction is observed to decrease with increase inthe content of nucleating agent NiO up to 0.8 mol%; this is an indi-cation of an increase in the space charge polarization. Such increaseindicates the increasing concentration of Ni2+ ions that act as mod-ifier in these samples. These modifying ions as mentioned earlier,generate bonding defects in the glass network. The defects thus pro-duced create easy pathways for the migration of charges that wouldbuild up space charge polarization and facilitate to an increase inthe dielectric parameters as observed [36,37].
We have obtained the increase in the value of (tan ı)max anddecrease of the effective activation energy associated with thedipoles with increase in the content of NiO (up to 0.8 mol%) inthe glass ceramic network (Table 6), these observations suggest anincreasing freedom for dipoles to orient in the field direction, obvi-ously due to increasing degree of disorder in glass ceramic network.The observed dielectric relaxation effects in PbO–Sb2O3–As2O3glasses crystallized with different concentrations of NiO may beattributed to the association of octahedrally positioned Ni2+ ionswith a pair of cationic vacancies as observed in a number of con-ventional glasses, glass ceramics and crystals that contain divalentpositive ions as reported before [38].
The variation of log � (ω) vs. activation energy for conduction(in the high temperature region) is shown as inset (b) in Fig. 11;the graph yields a near straight line. This observation suggests thatthe conductivity enhancement is directly related to the thermallystimulated mobility of the charge carriers in the high temperatureregion. The progressive increase of conductivity with the increaseof nickel content in the glass ceramic is a manifestation of theincreasing concentration of mobile electrons, or polarons, involved.The low temperature part of the conductivity (a near temperatureindependent part, as in the case of present glass ceramics up tonearly 75 ◦C) can be explained on the basis of quantum mechanicaltunneling model as suggested by Austin and Mott [39] with the pro-cedure reported in a number of our earlier papers [40,41]. Based onquantum mechanical tunneling model, N(EF) is the density of theenergy states near the Fermi level have been evaluated and val-ues obtained are presented in Table 7. The value of N(EF) obtained≈1020 eV−1 cm−3; such values of N(EF) suggest the localized statesnear the Fermi level are responsible for conduction. Further, thevalue of N(EF) is found to increase gradually from the sample N2 tosample N8, indicating an increase in the degree of disorder in theglass network.
Recollecting once again the observations on optical absorptionand magnetic properties, and even dielectric studies reveal that theratio Ni2+ (oct)/Ni2+ (tet) increases with increasing concentrationof NiO crystallizing agent up to 0.8 mol% in the PbO–Sb2O3–As2O3glass ceramics; further, the d–d transitions of the tetrahedral com-plexes are electric dipole allowed whereas those of octahedralcomplexes are electric dipole forbidden and are mainly due to thestatic or dynamic distortions from the regular octahedral geometryof the glass network and they can also be magnetic dipole allowed.As was reported by a number of other researchers [1], it is the
octahedrally positioned Ni2+ ion that is responsible for the impor-tant luminescence emission transition 3T2(F) → 3A2(F) that peaksaround 1280 nm; although we could not record the luminescenceemission in the NIR range for lack of facility, the high intensity ofoctahedral optical absorption bands including 3A2(F) → 3T2(F) and
4 lloys a
to
5
dDpmcssnNtotfptc
A
OPtaUi
R
[[
[[
[
[
[[
[
[[[
[
[
[
[[[[[[[[[[[
[
[
[
08 A. Padmanabham et al. / Journal of A
he results of the magnetic moments clearly indicate the possibilityf high luminescence emission in glass ceramic sample N8.
. Conclusions
40PbO–(20 − x)Sb2O3–40As2O3 glasses were crystallized withifferent concentrations (x = 0–1.5 mol%) of NiO. The XRD, SEM andTA studies have indicated the presence of different crystallinehases in these samples. The studies on optical absorption andagnetic properties have indicated that there is a higher con-
entration of nickel ions that occupy tetrahedral positions in theamples crystallized with more than 0.8 mol% of NiO. The dielectrictudies have indicated the growing degree of disorder in the glassetwork with increase in the concentration of crystallizing agentiO up to 0.8 mol%; from these results it is concluded that within
he concentration range of 0.2–0.8 mol%, the nickel ions mostlyccupy octahedral positions and induce bonding defects causinghe enhancement of the values of dielectric parameters. Finally,rom the careful analysis of these results, it is felt that there is aossibility for getting high intense lasing emission (correspondingo 3A2(F) → 3T2(F) transition in the NIR region) if these glasses arerystallized with about 0.8 mol% of NiO.
cknowledgements
This work is supported by Defence Research and Developmentrganization, Government of India in the form of Major Researchroject (Grant No.: ERIP/ER/0503545M/01/946). The authors wisho thank Dr. Y.V. Swamy of IICT, Hyderabad for his help in thermalnalysis of the samples and Mr N. Venkatramaiah of Pondicherryniversity for his help in taking SEM pictures of the samples used
n the present study.
eferences
[1] B. Wu, N. Jiang, S. Zhou, D. Chen, C. Zhu, J. Qiu, Opt. Mater. 30 (2008) 1900.[2] A.M. Malyarevich, Yu.V. Volk, K.V. Yumashev, V.K. Pavlovskii, S.S. zapalov, O.S.
Dymshits, A.A. Zhilin, J. Non-Cryst. Solids 351 (2005) 3551.[3] M. Srinivasa Reddy, S.V.G.V.A. Prasad, N. Veeraiah, Phys. Status Solidi (a) 204
(2007) 816.[4] B.V. Raghavaiah, C. Laxmikanth, N. Veeraiah, Opt. Commun. 235 (2004) 341.[5] P.C. DeRose, M.V. Smith, K.D. Mielenz, D.H. Blackburn, G.W. Kramer, J. Lumin.
129 (2009) 349.
[[
[
nd Compounds 488 (2009) 400–408
[6] H. Keppler, N. Bagdassarov, Chem. Geol. 158 (1999) 105.[7] E. Zannoni, E. Cavalli, M. Bettinelli, J. Phys. Chem. Solids 67 (2006) 789.[8] S. Wang, K. Liang, J. Non-Cryst. Solids 354 (2008) 1522.[9] G. Murali Krishna, Y. Gandhi, N. Veeraiah, Phys. Status Solidi (a) 205 (2008)
177.10] T. Suzuki, Y. Arai, Y. Ohishi, J. Lumin. 128 (2008) 603.11] A. Jouini, A. Yoshikawa, Y. Guyot, A. Brenier, T. Fukuda, G. Boulon, Opt. Mater.
30 (2007) 47.12] I.V. Kityk, J. Phys. Chem. B 107 (2003) 10083.13] B. Zhang, Q. Chen, L. Song, H. Li, F. Hou, J. Zhang, J. Non-Cryst. Solids 354 (2008)
1948.14] Y. Gandhi, K.S.V. Sudhakar, M. Nagarjuna, N. Veeraiah, J. Alloys Compd. (2009),
doi:10.1016/j.jallcom.2009.06.115.15] M. Nalin, M. Poulain, M. Poulain, J.L.R. Sidney, Y. Messaddeq, J. Non-Cryst. Solids
284 (2001) 110.16] J.S. Wang, E.M. Vogel, E. Snitzer, Opt. Mater. 3 (1994) 187.17] T. Satyanarayana, I.V. Kityk, M. Piasecki, P. Bragiel, M.G. Brik, Y. Gandhi, N.
Veeraiah, J. Phys. Condens. Matter 21 (2009) 245104.18] T. Satyanarayana, I.V. Kityk, K. Ozga, M. Piasecki, P. Bragiel, M.G. Brik, V. Ravi
Kumar, A.H. Reshak, N. Veeraiah, J. Alloys Compd. 482 (2009) 283.19] K. Nassau, Bell Syst. Tech. J. 60 (1981) 327.20] A. Bishay, C. Maghrabi, Phys. Chem. Glasses 10 (1969) 1.21] Y. Gandhi, N. Venkatramaiah, V. Ravi Kumar, N. Veeraiah, Physica B 404 (2009)
1450.22] M. Nagarjuna, T. Satyanarayana, Y. Gandhi, N. Veeraiah, J. Alloys Compd. 479
(2009) 549.23] L. Srinivasa Rao, M. Srinivasa Reddy, D. Krishna Rao, N. Veeraiah, Solid State Sci.
11 (2009) 578.24] Powder Diffraction File, Alphabetical Index, Inorganic Compounds,
JCPDS—International Centre for Diffraction Data, Newtown Square, PA,2003, pp. 3273–19073.
25] P. Subbalakshmi, P.S. Sastry, N. Veeraiah, Phys. Chem. Glasses 42 (2001) 307.26] B. Dubois, J.J. Videau, J. Portier, J. Non-Cryst. Solids 88 (1986) 355.27] P.J. Miller, C.A. Cody, Spectrochim. Acta A 38 (1982) 555.28] B.V. Raghavaiah, N. Veeraiah, Phys. Status Solidi (a) 199 (2003) 389.29] J.J. Kleperis, P.D. Cikmach, A.R. Lusis, Phys. Status Solidi (a) 83 (1984) 291.30] Y.R. Zakis, A.R. Lusis, Y.R. Lagzduns, J. Non-Cryst. Solids 47 (1982) 267.31] D. Holland, Solid State NMR 26 (2004) 72.32] A. Marotta, A. Buri, F. Branda, J. Mater. Sci. 16 (1981) 341.33] E. Zamoni, G. Cavalli, M. Bettinelli, J. Phys. Chem. Solids 60 (1999) 449.34] J.L. Rao, G.L. Narendra, S.V.J. Lakshman, Polyhedron 9 (1990) 1475.35] J.D. Lee, Concise Inorganic Chemistry, fifth ed., Blackwell Science Ltd.,
1996.36] M. Nagarjuna, T. Satyanarayana, V. Ravi Kumar, N. Veeraiah, Phys. B: Condens.
Matter, doi:10.1016/j.physb.2009.06.123.37] A. Padmanabham, T. Satyanarayana, Y. Gandhi, N. Veeraiah, Phys. Status Solidi
(a), doi:10.1002/pssa.200925191.38] S.V.G.V.A. Prasad, M. Srinivasa Reddy, N. Veeraiah, J. Phys. Chem. Solids 67
(2006) 2478.39] G. Austin, N.F. Mott, Adv. Phys. 18 (1969) 657.40] K. Sambasiva Rao, M. Srinivasa Reddy, V. Ravi Kumar, N. Veeraiah, Mater. Chem.
Phys. 111 (2008) 283.41] P. Venkateswara Rao, T. Satyanarayana, M. Srinivasa Reddy, Y. Gandhi, N. Veera-
iah, Physica B 403 (2008) 3751.