Embed Size (px)
Citation preview

SPECTROPHOTOMETRIC ANALYSIS OF AMINO ACIDS AND PEPTIDES WITH THEIR COPPER SALTS
BY JOSEPH R. SPIES AND DORRIS C. CHAMBERS
(From the Allergen Research Division, Bureau of Agricultural and Industrial Chemistry, United States Department of Agriculture,
Washington, D. C.)
(Received for publication, March 15, 1951)
The Pope and Stevens method (1) for quantitative determination of amino acids and peptides is based on iodometric analysis of the combined copper, a procedure that is somewhat inconvenient. Woiwood (a), using the color produced by diethyldithiocarbamate, has described a spectro- photometric modification of the Pope and Stevens method. Martin and Mittelmann (3) have used polarographic analysis of copper. Schroeder, Kay, and Mills (4) have improved the Pope and Stevens method to obtain precise and accurate results for amino acids, but they also use iodometric analysis of copper. The present paper describes a simple and rapid spec- trophotometric method for determining amino acids and peptides which is based on the color obtained when the combined copper is converted to the copper salt of alanine, together with an application of the procedure in studying the rate of protein hydrolysis.
Color intensities of equimolar concentrations of copper complexes of amino acids vary. Therefore, any one amino acid cannot be used as a reference standard for the determination of the other amino acids. How- ever, an excess of an amino acid added to solutions of the copper com- plexes of other amino acids converts their copper largely to the complex of the added amino acid which can then serve as a standard. Alanine was chosen as standard because of its relative high solubility, the ease of its purification, its cheapness, and because it gives a color intensity near to or intermediate between those of the other amino acids.
EXPERIMENTAL
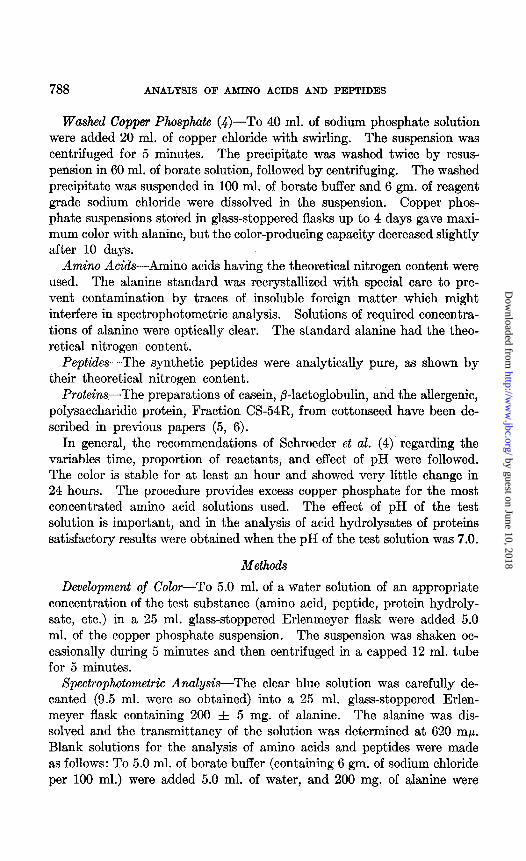
A Coleman spectrophotometer, model 11, with round 19 mm. cuvettes was used for the analyses. A Beckman spectrophotometer, with 10 mm. quartz cuvettes, was used to obtain the absoprtion curve shown in Fig. 1.
Copper Chloride-28 gm. of reagent grade cupric chloride dihydrate per liter of water solution.
Sodium Phosphate-68.5 gm. of reagent grade trisodium phosphate do- decahydrate per liter of water solution.
Sodium Borate Bufer, pH 9.1 to 9.240.3 gm. of reagent grade anhy- drous sodium tetraborate in 4 liters of water; filtered.
787
by guest on June 10, 2018http://w
ww
.jbc.org/D
ownloaded from
788 ANALYSIS OF AMINO ACIDS AND PEPTIDES
Washed Copper Phosphate (Q)-To 40 ml. of sodium phosphate solution were added 20 ml. of copper chloride with swirling. The suspension was centrifuged for 5 minutes. The precipitate was washed twice by resus- pension in 60 ml. of borate solution, followed by centrifuging. The washed precipitate was suspended in 100 ml. of borate buffer and 6 gm. of reagent grade sodium chloride were dissolved in the suspension. Copper phos- phate suspensions stored in glass-stoppered flasks up to 4 days gave maxi- mum color with alanine, but the color-producing capacity decreased slightly after 10 days.
Amino Acids---Amino acids having the theoretical nitrogen content were used. The alanine standard was recrystallized with special care to pre- vent contamination by traces of insoluble foreign matter which might interfere in spectrophotometric analysis. Solutions of required concentra- tions of alanine were optically clear. The standard alanine had the theo- retical nitrogen content.
Peptides-The synthetic peptides were analytically pure, as shown by their theoretical nitrogen content.
Proteins-The preparations of casein, /3-lactoglobulin, and the allergenic, polysaccharidic protein, Fraction CS-54R, from cottonseed have been de- scribed in previous papers (5, 6).
In general, the recommendations of Schroeder et al. (4) regarding the variables time, proportion of reactants, and effect of pH were followed. The color is stable for at least an hour and showed very little change in 24 hours. The procedure provides excess copper phosphate for the most concentrated amino acid solutions used. The effect of pH of the test solution is important, and in the analysis of acid hydrolysates of proteins satisfactory results were obtained when the pH of the test solution was 7.0.
Methods
Development of Color-To 5.0 ml. of a water solution of an appropriate concentration of the test substance (amino acid, peptide, protein hydroly- sate, etc.) in a 25 ml. glass-stoppered Erlenmeyer flask were added 5.0 ml. of the copper phosphate suspension. The suspension was shaken oc- casionally during 5 minutes and then centrifuged in a capped 12 ml. tube for 5 minutes.
Spectrophotometric Analysis-The clear blue solution was carefully de- canted (9.5 ml. were so obtained) into a 25 ml. glass-stoppered Erlen- meyer flask containing 200 f 5 mg. of alanine. The alanine was dis- solved and the transmittancy of the solution was determined at 620 rnp. Blank solutions for the analysis of amino acids and peptides were made as follows: To 5.0 ml. of borate buffer (containing 6 gm. of sodium chloride per 100 ml.) were added 5.0 ml. of water, and 200 mg. of alanine were
by guest on June 10, 2018http://w
ww
.jbc.org/D
ownloaded from
J. R. SPIES AND D. C. CHAMBERS 789
dissolved in 9.5 ml. of this solution. Blank solutions of protein hydroly- sates were made by mixing 5.0 ml. of salt-containing buffer with 5.0 ml. of the hydrolysate and, after centrifugation, 200 mg. of alanine were dis- solved in the decanted solution.
The colored solution used to obtain the absorption curve shown in Fig. 1 was prepared with an 0.04 M solution of alanine to which 200 mg. of alanine
.50 -
A0 -
c
5 g .30 -
3
ii 0
30 -
.I0 -
.,,/, 400 500 600 )O
WAVELENGTH,QX
FIQ. 1. Absorption curve of copper-&nine complex
were added to test and blank solutions as described above. The absorp- tion curve of the copper complex of alanine made similarly but without added alanine practically coincided with that shown in Fig. 1.
Standard Curves-Two standard curves were prepared. One curve was obtained from data on alanine alone and the other on alanine to which 200 mg. of alanine were added. The two standard curves were used in deter- mining the color intensities produced by amino acids with and without added alanine, as described below. However, only the standard curve of alanine with added alanine is needed in the recommended method of analy- sis. Eight alanine solutions ranging from 0.005 to 0.040 M (each differing
by guest on June 10, 2018http://w
ww
.jbc.org/D
ownloaded from

790 ANALYSIS OF AMINO ACIDS AND PEPTIDES
by 0.005 M) were used to obtain the standard curves. To 10 ml. of each solution were added 10 ml. of copper phosphate suspension in 50 ml. glass-
TABLE I Relative Color Intensities Produced by 0.0260 Y Solutions of Amino Acids
Alone and with Added Alanine As Compared to Alanine As 100 Per Cent
Amino acid
Alanine .................................. Arginine monohydrochloride. ............. Aspartic acid. ............................ Glutamic “ ............................. Glycine .................................. Histidine monohydrochloride. ............ Hydroxyproline .......................... Isoleucine ................................ Leucinet ................................. Lysine monohydrochloride. .............. Methionine$.............................. Phenylalaninet ......................... Proline ................................. Serine .................................... Threonine ................................ Trytophant .............................. Tyrosinell ................................ Valine ...................................
- I Alanine equivalence
Without added alanine* -
)er cent
100.0 103.8 89.3
104.6 79.8
145.2 125.9 109.2 101.8 102.0
8 101.8 123.7 91.3 95.0
108.9 99.6
105.6
With added alaninet
per cent
100.0
98.8 99.0
101.2 98.8
123.6 103 :6 101.2 98.2 98.2
102.4 99.4
100.6 99.5
100.0 99.4 99.4
100.4
* Duplicate determinations; over-all average deviation of all results 10.4 per cent.
t Duplicate determinations; over-all average deviation of all results st0.2 per cent.
# Analyzed in solution containing 0.01667 M giycine and 0.00833 M amino acid. $ Copper salt precipitated just before readings could be taken. There was no
precipitation in test with added alanine. 11 Because of the insolubility of tyrosine in water and the desire to avoid possible
effects of adding acid or alkali, samples of tyrosine were added in the solid state to a water-copper phosphate suspension. The tyrosine dissolved in 1 hour and trans- mittancies were determined as usual.
stoppered Erlenmeyer flasks. The suspensions were shaken occasionally during 5 minutes and centrifuged in capped tubes. The clear supernatant solutions were decanted and to 9.5 ml. of each were added 200 mg. of alanine. Transmittancies determined on the two portions of each solu- tion, with appropriate blank solutions, ranged from 77.1 to 12.7 and 77.2 to 12.9 per cent for the 0.005 to 0.040 M solutions with and without added
by guest on June 10, 2018http://w
ww
.jbc.org/D
ownloaded from

J. R. SPIES AND D. C. CHAMBERS 791
alanine, respectively. Excellent conformity to Beer’s law over the entire range of concentration was shown.
Comparison of Color Intensities of Amino Acids Alone and with Added Alanine-The results shown in Table I were obtained as follows: To 10 ml. of an 0.0250 M solution of the amino acid in a 50 ml. glass-stoppered flask were added 10 ml. of copper phosphate suspension, The mixture was shaken occasionally during 5 minutes and centrifuged in capped tubes. The blue solution was carefully decanted and 9.5 ml. were removed and 200 mg. of alanine were added. The transmittancy of each solution (with
- 80 I I I I I
c
TIME ( HOURS)
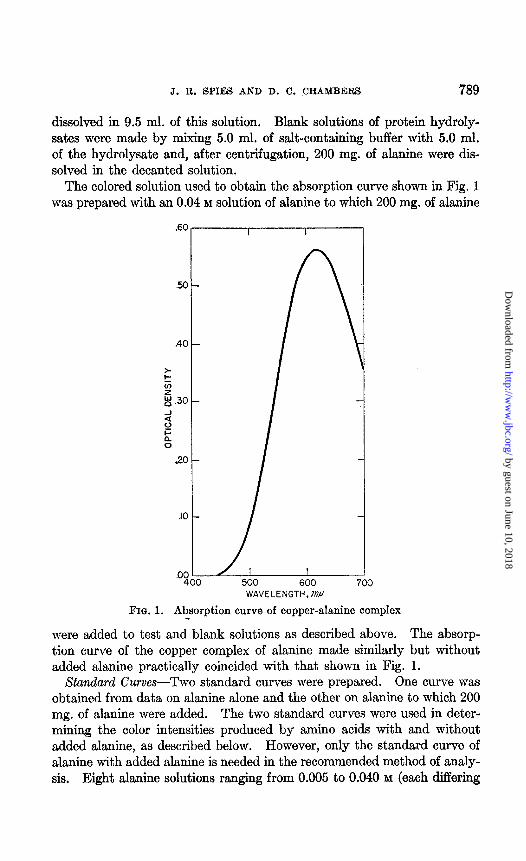
FIG. 2. Rate of hydrolysis of casein with 3 N hydrochloric acid as shown by lib eration of chromogenic nitrogen.
E 0 I I I I I I
2 4 6 8 10 12 24 TIME ( HOURS)
FIG. 2. Rate of hydrolysis of casein with 3 N hydrochloric acid as shown by lib eration of chromogenic nitrogen.
and without added alanine) was determined at 620 m,u with appropriate blank solutions. The transmittancies were converted to molarity from corresponding alanine standard curves. The relative percentage relation- ship of color intensities produced by each amino acid, compared to alanine as 100 per cent, was calculated by dividing 100 times the observed molarity by 0.0250.
Hydrolysis of Proteins-The following procedure was used in applying the method to the rate of hydrolysis of casein (Fig. 2). 100 mg. of casein were placed in a 16 X 65 mm. Thunberg tube which was modified by seal- ing off the bulb of the stopper. 2 ml. of 3 N hydrochloric acid were added, care being taken not to get casein on the walls of the tube. The tube was heated to loo’, whereupon the stopper was closed and heating was
by guest on June 10, 2018http://w
ww
.jbc.org/D
ownloaded from

792 ANALYSIS OF AMINO ACIDS AND PEPTIDES
continued for the desired interval. The tube was cooled, 1.2 ml. of 5 N
sodium hydroxide were added, the contents were quantitatively trans- ferred to a beaker, and the pH was adjusted to 7.0 with dilute sodium hydroxide and hydrochloric acid with a glass electrode. The solution was then diluted to 25.0 ml. and duplicate analyses were made.
Complete hydrolysis of proteins (Table III) was made as follows: To 100 mg. of protein in a 17 X 90 mm. Pyrex tube were added 2 ml. of 3 N
hydrochloric acid. The tubes were placed upright in a Pyrex desiccator. Enough water was placed in the bottom of the desiccator to fill it with water vapor on evacuation. The desiccator was then evacuated to 40 mm. and heated in an autoclave at 120-125’ for 8 hours. The hydrolysates were cooled, neutralized to pH 7.0, diluted to 25.0 ml., and analyzed as above.
RESULTS AND DISCUSSION
Amino Acids-The relative color intensities produced by seventeen amino acids, compared with alanine as 100 per cent, were determined with and without added alanine (Table I). The color intensities of sixteen amino acids ranged from 79.8 per cent for glycine to 125.9 per cent for hydroxy- proline when anQyzed without added alanine. When analyzed with added alanine, the range was 98.2 to 103.6 per cent and the over-all deviation from 100 per cent was ~1.2 per cent, a degree of accuracy satisfactory for most analytical purposes. Histidine behaved atypically, as discussed below.
Pope and Stevens (1) and Schroeder et al. (4) observed that cystine, phenylalanine, methionine, leucine, and tryptophan form insoluble or par- tially soluble copper salts, but they were able to analyze all but cystine by adding known amounts of glycine to form a soluble mixed salt. In the present study, 2 moles of glycine per mole of each of methionine, leucine, phenylalanine, and tryptophan were used. Under these condi- tions, the copper salts of methionine and tryptophan precipitated a short time after centrifugation of the copper phosphate, but no precipitates formed when 200 mg. of alanine were added to solutions of their copper salts. nn-Leucine could not be analyzed in the presence of 2 moles of glycine because precipitation occurred before excess copper phosphate could be removed. However, precipitation did not occur with n-leucine, which was analyzed successfully. Cystine was not determined because even the mixed salt was too insoluble (4).
Previous workers (2-4, 7) have concluded that the amino acids form cupric salts, under conditions of the test, according to the formula CuAz (A = 1 amino acid molecule). On this basis, it is apparent from results in Table I that all of the amino acids except histidine reacted in these proportions.
by guest on June 10, 2018http://w
ww
.jbc.org/D
ownloaded from
J. R. SPIES AND D. C. CHAMBERS 793
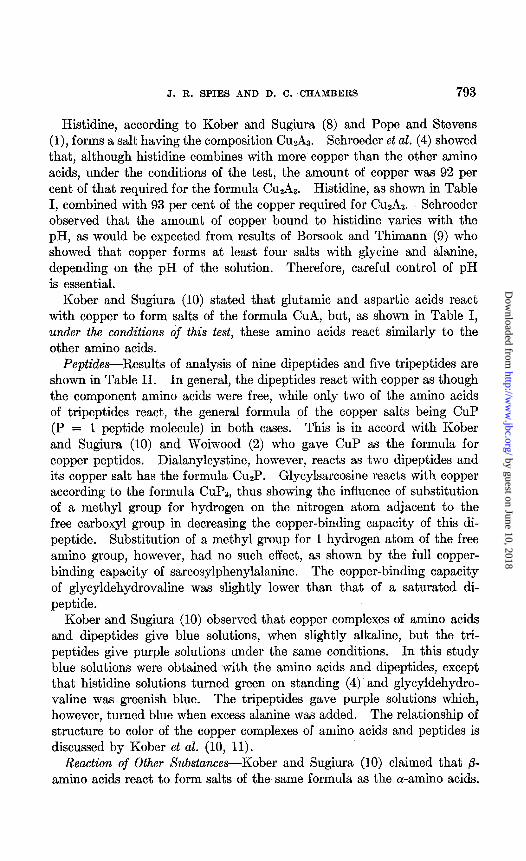
Histidine, according to Kober and Sugiura (8) and Pope and Stevens (l), forms a salt having the composition Cu2As. Schroeder et al. (4) showed that, although histidine combines with more copper than the other amino acids, under the conditions of the test, the amount of copper was 92 per cent of that required for the formula Cu2A3. Histidine, as shown in Table I, combined with 93 per cent of the copper required for CuzAz. Schroeder observed that the amount of copper bound to histidine varies with the pH, as would be expected from results of Borsook and Thimann (9) who showed that copper forms at least four salts with glycine and alanine, depending on the pH of the solution. Therefore, careful control of pH is essential.
Kober and Sugiura (10) stated that glutamic and aspartic acids react with copper to form salts of the formula CuA, but, as shown in Table I, under the conditions of this test, these amino acids react similarly to the other amino acids.
Peptides-Results of analysis of nine dipeptides and five tripeptides are shown in Table II. In general, the dipeptides react with copper as though the component amino acids were free, while only two of the amino acids of tripeptides react, the general formula of the copper salts being CUP (P = 1 peptide molecule) in both cases. This is in accord with Kober and Sugiura (10) and Woiwood (2) who gave CUP as the formula for copper peptides. Dialanylcystine, however, reacts as two dipeptides and its copper salt has the formula CuzP. Glycylsarcosine reacts with copper according to the formula CUPS, thus showing the influence of substitution of a methyl group for hydrogen on the nitrogen atom adjacent to the free carboxyl group in decreasing the copper-binding capacity of this di- peptide. Substitution of a methyl group for 1 hydrogen atom of the free amino group, however, had no such effect, as shown by the full copper- binding capacity of sarcosylphenylalanine. The copper-binding capacity of glycyldehydrovaline was slightly lower than that of a saturated di- peptide.
Kober and Sugiura (10) observed that copper complexes of amino acids and dipeptides give blue solutions, when slightly alkaline, but the tri- peptides give purple solutions under the same conditions, In this study blue solutions were obtained with the amino acids and dipeptides, except that histidine solutions turned green on standing (4) and glycyldehydro- valine was greenish blue. The tripeptides gave purple solutions which, however, turned blue when excess alanine was added. The relationship of structure to color of the copper complexes of amino acids and peptides is discussed by Kober et al. (10, 11).
Reaction of Other Substances-Kober and Sugiura (10) claimed that & amino acids react to form salts of the same formula as the a-amino acids.
by guest on June 10, 2018http://w
ww
.jbc.org/D
ownloaded from

794 ANALYSIS OF AMINO ACIDS AND PEPTIDES
In this study &alanine produced a blue solution, but the copper-binding capacity was only 40 per cent that of cr-alanine.
Solutions (0.025 M) of lactic acid, glucose, galactose, sucrose, inositol, mannitol, and ammonium chloride gave no color with copper under the conditions of the test and would not, therefore, interfere in applications of the methods.
Analysis of Di
Substance
Alanine Dialanylcystine Alanylglycine Glycylalanine Glycyl-or-aminoisobutyric
acid Glycyl-e-amino-n-butyric
acid Glycyldehydrovaline Glycylsarcosine Glycylserine Sarcosylphenylalanine Glycylalanylglycine Glycylglycylalanine Glycylglycylleucine Glycylleucylglycine Leucylglycylglycine
Pt -
I
-~
-
TABLE II
!ptides and Tripeptides with Added Alanine
Blue “ “ “ “
“
Green-blue Blue
“ “
Purples ‘I “ ‘I “
L
-_
-
0.0250 0.0062: 0.0125 0.0125 0.0125
0.0125
0.0125 0.0125 0.0125 0.0125 0.0125 0.0125 0.0125 0.0125 0.0125
Alanine equivalence of test solution*
)LI cent
100.0 96.4 f 0.0
lOO.O$ 100.0 f 0.4 102.4 f 0.0
99.8 f 0.2
90.2 f 0.0 35.0 f 0.2
104.3 f 0.3 98.8 f 0.0
100.2 f 0.2 99.6 f 0.0 95.5 f 0.2 99.2$ 99.8 f 0.2
1.00
3.86 2.00 2.00 2.05
Formula of copper
sa1tt
CuAz CUZP CUP
“ C‘
‘I
‘I
CUP3 CUP
L‘ “ ‘I “ ‘I “
* Duplicate analyses. t Calculated on the basis of alanine having the formula CuA2. P = abbreviation
for dipeptide or tripeptide. $ Single analysis. $ Test solutions turned characteristic blue on adding to 200 mg. of alanine.
Protein Hydrolysates-Study of the amino acids and peptides demonstra- ted the applicability of the analytical method to these compounds and also aided in interpretation of results obtained with complete and partial protein hydrolysates. In general, only the “end-group” amino acids of peptides react with copper; that is, those amino acids with a free carboxyl adjacent to peptide-linked nitrogen or with a free amino group adjacent to a peptide-linked carboxyl group. Copper-binding capacity of protein hydrolysates should, therefore, increase during hydrolysis until all a-amino nitrogen is either free or in dipeptide form, and the method should be
by guest on June 10, 2018http://w
ww
.jbc.org/D
ownloaded from
.I. R. SPIES AND D. C. CHAMBERS 795
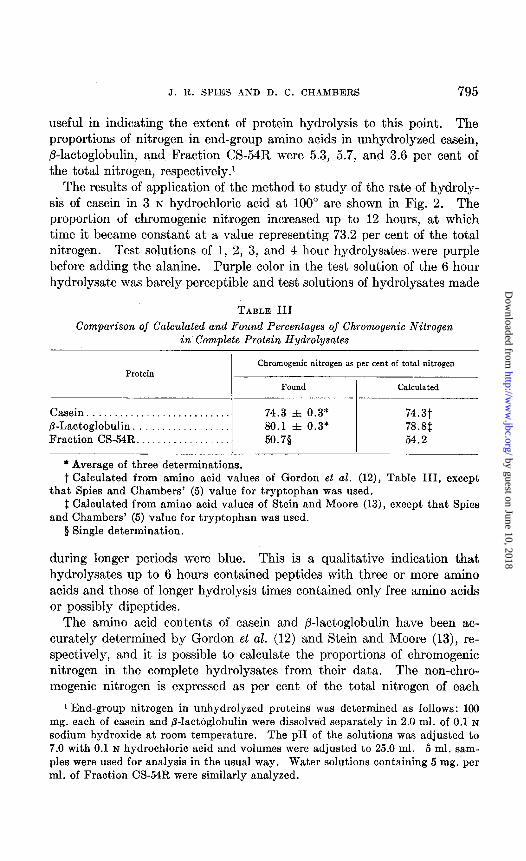
useful in indicating the extent of protein hydrolysis to this point. The proportions of nitrogen in end-group amino acids in unhydrolyzed casein, p-lactoglobulin, and Fraction CS-54R were 5.3, 5.7, and 3.6 per cent of the total nitrogen, respectively.’
The results of application of the method to study of the rate of hydroly- sis of casein in 3 N hydrochloric acid at 100” are shown in Fig. 2. The proportion of chromogenic nitrogen increased up to 12 hours, at which time it became constant at a value representing 73.2 per cent of the total nitrogen. Test solutions of 1, 2, 3, and 4 hour hydrolysates were purple before adding the alanine. Purple color in the test solution of the 6 hour hydrolysate was barely perceptible and test solutions of hydrolysates made
TABLE III Comparison of Calculated and Found Percentages of Chromogenic Nitrogen
in Complete Protein Hydrolysates
Protein Chromogenic nitrogen as per cent of total nitrogen
Found I Calculated
Casein ........................... P-Lactoglobulin .................. Fraction CS-MR ..................
74.3 f 0.3* 74.3.f 80.1 f 0.3* 7s.q 50.7s 54.2
* Average of three determinations. t Calculated from amino acid values of Gordon et al. (12), Table III, except
that Spies and Chambers’ (5) value for tryptophan was used. $ Calculated from amino acid values of Stein and Moore (13), except that Spies
and Chambers’ (5) value for tryptophan was used. 0 Single determination.
during longer periods were blue. This is a qualitative indication that hydrolysates up to 6 hours contained peptides with three or more amino acids and those of longer hydrolysis times contained only free amino acids or possibly dipeptides.
The amino acid contents of casein and /3-lactoglobulin have been ac- curately det#ermined by Gordon et al. (12) and Stein and Moore (13), re- spectively, and it is possible to calculate the proportions of chromogenic nitrogen in the complete hydrolysates from their data. The non-chro- mogenic nitrogen is expressed as per cent of the total nitrogen of each
‘1 End-group nitrogen in unhydrolyzed proteins was determined as follows: 100 mg. each of casein and fi-lactoglobulin were dissolved separately in 2.0 ml. of 0.1 N sodium hydroxide at room temperature. The pH of the solutions was adjusted to 7.0 with 0.1 N hydrochloric acid and volumes were adjusted to 25.0 ml. 5 ml. sam- ples were used for analysis in the usual way. Water solutions containing 5 mg. per ml. of Fraction CS-54R were similarly analyzed.
by guest on June 10, 2018http://w
ww
.jbc.org/D
ownloaded from
796 ANALYSIS OF AMINO ACIDS AND PEPTIDES
component containing non-chromogenic nitrogen as follows: ammonia or amide nitrogen, 100; arginine, 75; lysine, 50; histidine, 59 (this value rather than 67 per cent was used because histidine gave 24 per cent more color than that calculated for its a-amino nitrogen content, Table I); tryptophan, 60 (19 and 20 per cent, respectively, of the chromogenic ni- trogen of the added tryptophan was destroyed when 100 mg. of casein and of P-lactoglobulin were hydrolyzed with 3 N acid at 125” with 25 mg. of tryptophan added to each. This value serves only as an approxima- tion. Although tryptophan per se is probably completely destroyed under these conditions, destruction of its chromogenic nitrogen would not be expected, because only the a-amino part of the molecule is involved in color formation. When tryptophan alone was similarly hydrolyzed, no chromogenic nitrogen was destroyed). The sum of the non-chromogenic nitrogen was substracted from 100 per cent to give the calculated values. As is shown in Table III, the found and calculated values for casein and /?-lactoglobulin are in excellent agreement and the greater difference in the case of Fraction CS-54R is possibly due to the fact that CS-54R con- tains 6.3 per cent carbohydrate, which may have caused some destruction of amino acids during hydrolysis.
The authors make grateful acknowledgment to Dr. J. P. Greenstein, National Institutes of Health, Bethesda, Maryland, for the synthetic peptides used in this study.
SUMMARY
A simple, rapid, and accurate method for the quantitative determina- tion of amino acids and peptides by spectrophotometric analysis of their copper complexes is described. Seventeen amino acids, nine dipeptides, and five tripeptides were studied and the interpretation of the results in relation to application of the method in studying the rate of hydrolysis of proteins is discussed. An example of use of the method in studying the rate of hydrolysis of casein is given. Excellent agreement was obtained between the values for chromogenic nitrogen found and calculated for complete acid hydrolysates of casein, /?-lactoglobulin, and Fraction CS- 54R (cottonseed allergenic protein) based on their amino acid contents.
BIBLIOGRAPHY
1. Pope, C. G., and Stevens, M. F., Biochem. J., 33, 1070 (1939). 2. Woiwood, A. J., Biochem. .I., 46, 412 (1949). 3. Martin, A. J. P., and Mittelmann, R., Biochem. J., 43, 353 (1948). 4. Schroeder, W. A., Kay, L. M., and Mills, R. S., Anal. Chem., 22, 760 (1950). 5. Spies, J. R., and Chambers, D. C., Anal. Chem., 21, 1249 (1949). 6. Spies, J. R., Bernton, H. S., and Stevens, H., J. Am. Chem. Sot., 63,2163 (1941).
by guest on June 10, 2018http://w
ww
.jbc.org/D
ownloaded from

J. R. SPIES AND D. C. CHAMBERS 797
7. Kober, P. A., and Sugiura, K., J. Biol. Chem., 13, 1 (191213). 8. Kober, P. A., and Sugiura, K., J. Am. Chem. Sot., 36, 1546 (1913). 9. Borsook, H., and Thimann, K. V., J. Biol. Chem., 93, 671 (1932).
10. Kober, P. A., and Sugiura, K., Am. Chem. J., 43, 383 (1912). 11. Kober, P. A., and Haw, A. B., J. Am. Chem. Sot., 33,457 (1916). 12. Gordon, W. G., Semmett, W. F., Cable, R. S., and Morris, M., J. Am. Chem. Sot.,
71, 3293 (1949). 13. Stein, W. H., and Moore, S., J. Biol. Chem., 178, 79 (1949).
by guest on June 10, 2018http://w
ww
.jbc.org/D
ownloaded from

Joseph R. Spies and Dorris C. ChambersWITH THEIR COPPER SALTS
OF AMINO ACIDS AND PEPTIDES SPECTROPHOTOMETRIC ANALYSIS
1951, 191:787-797.J. Biol. Chem.
http://www.jbc.org/content/191/2/787.citation
Access the most updated version of this article at
Alerts:
When a correction for this article is posted•
When this article is cited•
alerts to choose from all of JBC's e-mailClick here
tml#ref-list-1
http://www.jbc.org/content/191/2/787.citation.full.haccessed free atThis article cites 0 references, 0 of which can be
by guest on June 10, 2018http://w
ww
.jbc.org/D
ownloaded from