Embed Size (px)
Citation preview

SpectrophotometersModels 7310 & 7315
Operating Manual
731 005 REV E/12-10

2

3
Safety
Please read this information carefully prior to installing or using this equipment.
1. The unit described in this manual is designed be operated only by trained personnel. Any adjustments, maintenance and repair must be carried out as defined in this manual, by a person qualified to be aware of the hazards involved.
2. It is essential that both operating and service personnel employ a safe system of work, in addition to the detailed instructions specified in this manual.
3. Other than for those items defined in the maintenance procedures herein there are no user serviceable items in this instrument. Removal of covers and attempted adjustment or service by unqualified personnel will invalidate the warranty and may incur additional charges for repair.
4. References should always be made to the Health and Safety data supplied with any chemicals used. Generally accepted laboratory procedures for safe handling of chemicals should be employed.
5. If it is suspected that safety protection has been impaired in any way, the unit must be made inoperative and secured against any intended operation. The fault condition should immediately be reported to the appropriate servicing authority.

4

1
Contents
Page
Safety 3
SeCtion 1 - introduction 8
1.1 Instrument description 8
1.2 Instrument specification 8
SeCtion 2 - installation 12
2.1 Unpacking 12
2.2 Installation 12
2.3 Display 13
2.4 Controls 14
2.5 Rear panel 15
2.6 Front panel 15
SeCtion 3 - theory and practice of spectroscopy measurements 16
3.1 Theory of spectroscopy measurement 16
3.2 Spectroscopy measurement 16
3.3 Good practice guidelines 17
SeCtion 4 - instrument setup 19
4.1 Navigating and screen setup 19
4.2 Time and date 20
4.3 Instrument settings menu 20
4.4 Security and setting passwords 21
4.4.1 Setting security codes 21
4.4.2 Settings lock 21
4.4.3 Method lock 21
4.5 Mode selection 22
4.6 Diagnostics 22
4.7 GLP settings 22
4.8 Screen contrast 23
4.9 Lamp save 23
SeCtion 5 - Photometrics 25
5.1 Mode specific parameters 25
5.2 Method set up 25
5.2.1 Selecting a wavelength 26
5.3 Calibration 26
5.4 Sample measurment 26
SeCtion 6 - Concentration 27
6.1 Mode specific parameters 27
6.2 Method setup 27
6.2.1 Selecting a wavelength 27
6.2.2 Settings 28
6.2.2.1 Selecting concentration units 28
6.2.2.2 Changing the resolution 29
6.2.2.3 Using a standard 29
5

6
6.2.2.4 Using a factor 29
6.3 Calibration 29
6.3.1 Calibrating to a standard 29
6.3.2 Calibrating to a factor 30
6.4 Sample measurement 30
6.4.1 Measuring a sample after calibrating to a standard 30
6.4.2 Measuring a sample after calibrating to a factor 30
SeCtion 7 - Spectrum 31
7.1 Mode specific parameters 31
7.2 Method setup 32
7.2.1 Scan settings 32
7.2.1.1 Selecting absorbance or % transmittance 32
7.2.1.2 Setting start and end wavelengths 32
7.2.1.3 Setting the scan interval 33
7.2.1.4 Y-axis scaling 34
7.3 Calibration 34
7.4 Sample measurement 34
7.5 Data analysis 35
7.5.1 Peaks and valleys threshold 35
7.5.2 Peaks and valleys table 36
7.5.3 Spectral points analysis 36
SeCtion 8 - Quantitation 38
8.1 Mode specific parameters 38
8.2 Method setup 39
8.2.1 Selecting a wavelength 39
8.2.2 Quantitation table 39
8.2.2.1 Selecting number of standards 39
8.2.2.2 Selecting concentration units 39
8.2.2.3 Changing the resolution 40
8.2.2.4 Selecting absorbance or % transmittance 40
8.2.2.5 Adding standards 40
8.2.3 Standard curve 40
8.2.3.1 Creating a new standard curve 41
8.3 Calibration 42
8.4 Sample measurement 42
8.5 Data analysis 43
SeCtion 9 - Kinetics 44
9.1 Mode specific parameters 44
9.2 Method set up 45
9.2.1 Kinetics settings 45
9.2.1.1 Y-axis scaling 45
9.2.1.2 Setting lag time or start on level 46
9.2.1.3 Selecting absorbance or % transmittance 46
9.2.1.4 Changing the resolution 47
9.2.1.5 Selecting concentration units 47
9.2.1.6 Using a standard 47
9.2.1.7 Using a factor 47
9.2.1.8 Selecting a wavelength 48

7
9.2.1.9 Setting the kinetics measurement time 48
9.3 Calibration 48
9.4 Sample measurement 48
9.5 Data analysis 49
SeCtion 10 - Saving, printing and autologging 51
10.1 Saving methods 51
10.1.1 Saving methods to internal memory 52
10.1.2 Saving methods to USB memory stick 52
10.2 Opening methods 52
10.2.1 Opening methods from internal memory 52
10.2.2 Opening methods from USB memory stick 53
10.3 Deleting methods 53
10.4 Saving results 53
10.5 Opening results 54
10.6 Deleting results 55
10.7 Printing 55
10.7.1 Print setup 56
10.7.1.1 Print setup – photometrics and concentration 56
10.7.1.2 Print setup - spectrum 56
10.7.1.3 Print setup – quantitation 57
10.7.1.4 Print setup – kinetics 57
10.7.2 Printing results 57
10.8 Autologging 58
10.8.1 Setting the number of sample repetitions 58
10.8.2 Selecting result’s destination 59
10.9 Connecting to a PC 59
SeCtion 11 - Accessories and spare parts 60
11.1 Optional accessories 60
11.2 Connecting the accessories 60
11.2.1 Internal printer 60
11.2.2 Passive accessories 61
11.2.3 Active accessories 61
11.2.3.1 Automatic 8 cell turret 62
11.2.3.2 Peltier 62
11.2.3.3 Sipper pump 63
11.2.3.4 Combined sipper peltier pump 64
11.3 Using the accessories 65
11.3.1 Automatic 8 cell turret 65
11.3.1.1 Supporting creation of a standard curve in quantitation 65
11.3.2 Peltier 66
11.3.3 Sipper pump 66
11.3.3.1 Manual sipper pump settings 66
11.3.3.2 Timed sipper pump settings 67
11.3.4 Combined sipper peltier pump 69
11.4 Spares 70
SeCtion 12 - Maintenance and service 71
12.1 Routine maintenance 71
12.2 Lamp replacement 71
12.2.1 Tungsten halogen lamp replacement 71

8
12.2.2 Xenon lamp module replacement 71
12.3 Service 72
SeCtion 13 - troubleshooting 73
13.1 Error codes 73
13.2 Troubleshooting guide 75
13.3 Technical support 75
SeCtion 14 - Declaration of conformity 76
SeCtion 15 - Glossary of icons 78
index 85

9

10
SeCtion 1 - introduction 1.1 inStRUMent DeSCRiPtion
The 7310 and 7315 spectrophotometers are suited to a wide range of applications in education, quality control, environmental and clinical analysis. The 7310 is a visible spectrophotometer covering a wavelength range from 320nm to 1000nm. The 7315 is a UV/Visible spectrophotometer with a wavelength range from 198nm to 1000nm. Both models have five measurement modes: photometrics, concentration, spectrum scanning, quantitation and kinetics. These instruments use icon driven software and have an improved navigation system for easy and intuitive usability.
1.2 inStRUMent SPeCiFiCAtion
7310 7315
Wavelength
Range 320 to 1000nm 198 to 1000nm
Resolution 1nm
Accuracy ± 2nm
Repeatability ± 0.5nm
Spectral bandwidth 5nm
Photometrics
Transmittance 0 to 199.9%
Absorbance -0.300 to 2.500A
Accuracy ±1%T, ±0.01Abs at 1.000 Absorbance
Resolution 0.1%T, 0.001A
Stray light <0.5% at 340nm <0.5% at 340nm and 220nm
Concentration
Range -300 to 9999
Resolution Selectable 1/0.1/0.01/0.001
Calibration Blank with a single standard or factor
Units no units, %, ppm, EBC, SRM, mEq/l, mEq, M, mM, µM, nM, U, U/l, U/ml, g/l, mg/l,
µg/l, ng/l, g/dl, mg/dl, µg/dl, mg/ml, µg/ml, ng/ml, µg/µl, ng/µl, mol/l, mmol/l
Factor 0.001 to 10000
Standard 0.001 to 1000
Quantitation
Range -300 to 9999
Resolution Selectable 1/0.1/0.01/0.001
Calibration Blank with up to 6 standards
Units no units, %, ppm, EBC, SRM, mEq/l, mEq, M, mM, µM, nM, U, U/l, U/ml, g/l,
mg/l, µg/l, ng/l, g/dl, mg/dl, µg/dl, mg/ml, µg/ml, ng/ml, µg/µl, ng/µl, mol/l, mmol/l
Curve fit algorithms Quadratic, quadratic through zero, linear, linear through zero, interpolate
Kinetics
Measurement Time 2 to 9999 seconds
Calibration Blank with a single standard or factor
Display Concentration, rate of change, initial and final absorbance/%T
Resolution Selectable 1/0.1/0.01/0.001

11
7310 7315
Spectrum
Range 320 to 1000nm 198 to 1000nm
Scan interval Selectable 1, 2 or 5nm
Analysis Absorbance or % transmittance and peak and valley wavelengths
other
Beam height 15mm
Light source Tungsten halogen lamp Xenon lamp
Lamp save Yes Not applicable
GLP Current time and date, user ID, settings lock and method lock
Number of users 999
Methods memory 48 in each measurement mode
Results memory Limited by attached mass storage device
Removable media USB (supplied)
Outputs USB, Analogue, RS232, Internal printer
Power 24V
Size (w x d x h) 275 x 400 x 220mm
Weight 6kg

12
SeCtion 2 - installation 2.1 UnPACKinG
Remove the 7310 or 7315 from the packaging and ensure the following items are included:
1. Model 7310 spectrophotometer (731 001), or Model 7315 spectrophotometer (731 501)
2. 24V 65W power supply unit (021 060)
3. Pack of 100 disposable plastic visible wavelength cuvettes (060 084), or pack of 100 disposable UV plastic cuvettes (060 230)
4. 2 GB USB memory stick (019 146)
5. Jenway 73 series PC software (735 100) and interface cable (013 203)
6. Instruction manual (731 005)
7. Jenway Foreign Manual CD (JENMANCD)
8. Optional accessories (as ordered)
2.2 inStALLAtion
Models 7310 and 7315 are supplied ready to use.
The unit should be placed on a clean flat surface which is free from drafts and vibrations. The units are designed for operation on 90V to 264V AC input at 47 to 63Hz. Select the correct plug attachment and attach to the power supply unit as shown below:
Fig2.2.1–Powersupplyunitwithvariousplugs
Connect the power supply unit to the power inlet socket on the rear panel of the instrument and connect to the mains socket. Turn the power on at the mains and switch the instrument on using the power switch on the rear of the instrument.
The instrument will perform several power on tests before displaying the main menu:

13
Fig2.2.2–AllPowerOnTestsComplete
1. Instrument check – ensures the validity of the saved parameters
2. Dark test
3. Checks for the accessory fitted. If an active accessory is found the instrument verifies communication and response
4. Self calibration of wavelengths
5. Checks communication between USB memory stick port and the instrument
2.3 DiSPLAY
These spectrophotometers have a dot matrix display which enables icons and graphs to be displayed clearly. Following successful completion of the power on tests the main menu screen will be displayed:
Fig.2.3.1–Display
1. Spectrum measurement mode
2. Photometrics measurement mode
3. Back key
4. Time and date menu
5. Quantitation measurement mode
6. Instrument settings menu
7. Concentration measurement mode
8. Kinetics measurement mode
7310
09:02
7310
09:02
2
1 3
4
1
2
3
8
7
4 5
5
6

14
2.4 ContRoLS
The keypad used for these models enables an easy and effective way of navigating the different measurement modes, entering numbers, saving and analysing results. The soft keys are active when an icon is displayed above or adjacent to the key. The only exception to this is the back key which is always active.
The main menu screen and surrounding keypad is displayed below.
Fig.2.4.1–Display
1. Spectrum measurement mode
2. Photometrics measurement mode
3. Back key
4. Time and date menu
5. Quantitation measurement mode
6. Instrument settings menu
7. Concentration measurement mode
8. Kinetics measurement mode
7310
09:02
1
1
2
2
3
8
8
7
7
4 5 5 5 6

2.5 ReAR PAneL
The image below shows the rear panel on the instrument:
Fig.2.5.1–RearPanel
1. Lamp access panel Allows access to lamp when replacement is necessary
2. Power switch On/off switch for the unit
3. Power in socket Connection socket for power supply unit
4. RS232 serial port Connection to a PC or external serial printer
5. Output sockets Analogue output
2.6 FRont PAneL
The image below shows the front panel of the instrument:
Fig.2.6.1–FrontPanel
1. Integral printer (optional accessory)
2. Keypad
3. USB memory stick slot
4. Instrument lid
5. Display
15
2
1
2
3
3
4
5 1
5
4

16
SeCtion 3 – theory and Practice of Spectroscopy Measurements
3.1 tHeoRY oF SPeCtRoSCoPY MeASUReMent
UV-visible spectroscopy is the measurement of the absorbance of light at a specific wavelength in a sample. This is used to identify the presence and concentration of molecular entities within the sample. The Beer-Lambert law is used to relate the absorption of light to the properties of the sample through which the light is travelling through. The Beer-Lambert law states that:
A is the absorbance
is the molar absorption coefficient (l mol-1cm-1)
c is the concentration (mol l-1)
l is the path length (cm)
This law shows that absorbance is linear to concentration but this is only true for low concentrations. For absorbance levels above 3 the concentration starts to move away from the linear relationship.
Transmittance is the proportion of the light which passes through the sample:
Therefore: T = It
Io
Absorbance is inversely related to transmittance:
A = log 1
T
3.2 SPeCtRoSCoPY MeASUReMent
There are four main components of a spectrophotometer. These are a light source to emit a high and constant amount of energy over the full wavelength range; a method for separating the light into discreet wavelengths; a sample holder and a light detector.
Where:
Lo is the incident light
lt is the transmitted light
l is the path length
l
Io It
l

17
The optical layout of the 7310 and 7315 spectrophotometers is shown below:
Figure3.2.1–Diagramoflightpath
The light from the pre-focused tungsten halogen (7310) or pre-aligned xenon (7315) lamp is focused onto the grating, with 1200 lines per millimeter, which separates the light into discreet wavelengths. The diffracted spectrum of light then passes through a further slit and lens arrangement before passing through the sample in the sample chamber from left to right. The light which is not absorbed by the sample is transmitted through a collecting lens and onto the signal detector. The photo-diode detector used is mounted directly onto the detector PCB and the output is used to calculate the % transmittance. The result is displayed either as % transmittance or absorbance on the instrument display.
3.3 GooD PRACtiCe GUiDeLineS
1. For optimum performance all spectrophotometers should be sited in a clean, dry, dust free atmosphere. When in use ambient temperature and light levels should remain as constant as possible.
2. If required adherence to Standard Operating Procedures (SOP) and Good Laboratory Practice (GLP) should be monitored with regular calibration checks and a suitable Quality Control (QC) programme.
3. The sample chamber lid must be fully closed during measurement and before any readings are recorded or printed.
4. The correct selection of sample containers is imperative for accurate and reproducible results:
a) Check that the material of the sample container is compatible with the wavelengths to be used for measurement. In general glass can only be used down to 360nm or 320nm depending on quality. Standard plastic cuvettes can be used down to 320nm. Special UV versions can be used down to 260nm. Below this level quartz cuvettes must be used.
b) Plastic disposable cuvettes should only be used ONCE.
c) Glass cuvettes should be thoroughly cleaned after use. Discard when scratches become evident on optical surfaces.
d) Care should be taken when selecting semi-micro or micro cuvettes. The cuvette window on the
Entrance slit
Grating
Collimator mirror
Exit SlitDetector
Collecting LensSample
Lamp

18
inner chamber (the area filled with sample) must be wider than the aperture in the sample holder or light will reach the detector without passing through the sample. In this case, semi-micro or micro cuvettes with self-screening black surrounds must be used or, alternative holders for these cuvettes should be used.
e) Glass test tubes and other sample tubes should be used with care. Where possible, matched tubes should be used and any index mark set to the correct position before measurements are made.
f) Ensure any sample containers used are compatible with the constituents of both the samples and standards they are to hold. Plastic cuvettes are not compatible with organic solvents.
g) All sample containers must be handled with care; by the top, bottom and non-optical surfaces only. Any finger marks evident must be removed by a suitable cleaning process.
h) Flow-through cuvettes must be selected with care and consideration for the sample type, sample volume, pumping system, rinse, sample and waste handling to be used.
5. Samples and standards should not be stored in open cuvettes or sample containers as evaporation will change the value and lead to staining of the walls which may be irreversible. If stored in stoppered and sealed cuvettes, they should be filled with little or no air space and the values regularly checked against a reference standard or quality control material.
6. Samples should be allowed to equilibrate to ambient temperature before measurement (unless a suitable temperature controlled sample holder is in use). Temperature change during measurement may cause air bubbles to form on the walls of the sample holder. This is a common cause of drift during measurement.
7. In the preparation of samples and standards high grade borosilicate glass and AR grade chemicals and reagents must be used. Good quality deionised water or other suitable solvents must be used for dissolving or diluting samples, chemicals and reagents.
8. All measurements require calibration to a blank, for maximum accuracy this should be prepared with care using the same deionised water or solvent used for dissolving or diluting the sample. Where reagents are added to the sample to produce a colour proportional to its concentration a ‘sample based’ blank should be used. In this case the blank should consist of all reagents or chemicals to be used, except the sample which will produce the colour to be measured.
9. Deviations from the Beer-Lambert Law may occur at high and low concentrations giving non-linear response during sample concentration measurements. For all new methods a linear range should be defined by the preparation of a calibration curve. The quantitation mode may be used to construct such a curve against which sample results are automatically measured.
10. Cuvettes and sample holders must be filled to a minimum level which covers the light path. All Jenway spectrophotometers have a beam height of 15mm.
11. The instrument must be calibrated to zero absorbance/100% transmittance prior to taking readings. In the spectrum measurement mode a baseline scan must be performed before performing a sample scan.

0.000100.0
400
09:02
ABS
%T
nm
SeCtion 4 – instrument Setup
4.1 nAViGAtinG AnD SCReen SetUP
The main menu screen is displayed below.
Fig4.1.1–HomeScreen
To navigate around the spectrophotometer screen press the soft keys adjacent to icons displayed on the
screen. In the main menu either of the two soft keys adjacent to the measurement mode icon can be
pressed to access the mode. There is a back key which returns to the previous menu without saving any
changes.
The main menu screen provides access to all five measurement modes, the time and date menu and
the instrument settings menu. The measurement modes are spectrum, photometrics, quantitation,
concentration and kinetics. The instrument settings menu enables access to settings lock, security codes,
method lock, mode selection, user ID, screen contrast and lamp save menus.
All of the measurement modes open initially into a
minimal operating menu. This menu allows calibration
and simple readings to be taken without changing any
measurement parameters. Pressing the key adjacent to
the JW icon opens the expanded operating menu.
This menu enables changes to measurement parameters
and settings to be made. Depending on the mode, the
measurement parameters can be accessed through the
settings menu which is displayed in the top right hand
corner of the screen. The only mode where this function
is not available is the photometrics mode; instead a
toggle icon is displayed which is used to change the
primary and secondary displays.
19
7310
09:02
Kinetics measurement
mode
Concentration measurement
mode
Instrument settings menu
Spectrum measurement
mode
Photometrics measurement
mode
Back key Quantitation measurement modeTime and date menu
0.000100.0
400
09:02
ABS
%T
nm
MinimalOperatingMenu
ExpandedOperatingMenu(Photometricsmeasurementmode)

20
The measurement settings can be accessed through the utility toolbar displayed on the left hand side
of the expanded operating menu. This toolbar provides the same functions in all of the measurement
modes. The utility toolbar enables access to printing, print setup options, opening, saving and deleting
results and methods and autologging options. For more details on the different functions of the utility
toolbar refer to section 10.
4.2 tiMe AnD DAte
The time and date menu enables the current time and date to be set. This information will be saved on all results and displayed on printouts. The time and date menu can be accessed from the main menu by holding the key below the timeanddate icon for 2 seconds. Pressing the key once cycles the display between time and date.
In the time and date menu to set the time press the key adjacent to the clock icon. Select the digit to be changed using the keys at the bottom of the screen. Use the keys adjacent to the arrow icons to increase or decrease the number. The clock function uses a 24 hour format.
In the time and date menu to set the date press the key adjacent to the calendar icon. Select the digit to be changed using the keys at the bottom of the screen. Use the keys adjacent to the arrow icons to increase or decrease the number. The date format can be displayed as either European dd/mm/yy or American mm/dd/yy. To change between the two formats press the key below the toggle icon. Once the current time and date have been set press the key adjacent to the tick icon to save the changes. To exit this menu without saving any changes press the back key and the screen will return to the main menu.
4.3 inStRUMent SettinGS MenU
The instrument settings menu is accessed by pressing the key below the instrumentsettings icon in
the main menu. This menu enables access to settings lock, security code, method lock, mode selection,
diagnostics, user ID, screen contrast and lamp save menus. The tick icon saves any changes made and
returns to the main menu.
Fig4.3.1-SettingsMenu
7310
09:02
1 4 5 3:
30 11 09
Tick iconSettings lock
Security code
Method lock
Mode selection
Diagnostics
User ID
Screen contrast
Lamp save

21
4.4 SeCURitY AnD SettinG PASSWoRDS
4.4.1 Setting Security Codes
The security code function enables a security code to
be set to lock the instrument settings and measurement
mode settings. The security code is not specific to the
user ID but is designed to enable an administrator to
control either the instrument or protocols. The security
code menu is accessed through the instrument settings
menu.
In the instrument settings menu press the key adjacent
to the securitycode icon. Using the keys at the bottom
of the screen select the digit to be changed. Use the keys
adjacent to the arrow icons to increase or decrease the
selected number. Once the preferred code has been set
press the key adjacent to thetick icon to save the security
code.
4.4.2 Settings lock
The settings lock function enables the instrument and measurement mode settings to be locked to
prevent any changes to the measurement parameters or instrument settings. The only exceptions to this
are that the user ID and contrast can be changed when the settings lock is active.
The settings lock function is accessed through the
instrument settings menu by pressing the key adjacent to
the openpadlockicon. One press will lock the settings
instantly. To unlock the settings press the key again. This
will open the security code menu as detailed in section
4.4.1. The previously set security code must be entered
to unlock the settings. When the settings lock is active
methods can still be opened, deleted and saved but the
method parameters cannot be changed.
To enter the security code use the keys at the bottom
of the screen to select the digit to be changed. Use the
keys adjacent to the arrow icons to increase or decrease
the selected number. Once the correct security code has
been entered press the key adjacent to the tick icon. The
settings are now unlocked.
If the settings are locked before the security code has
been set a default code of 660 will unlock the settings.
4.4.3 Method Lock
When the method lock is active the method selection
menu is disabled in all the measurement modes therefore
methods cannot be opened, deleted or saved. However
the measurement parameters of the currently loaded
method can be changed. The method lock function
is accessed through the instrument settings menu by
pressing the key adjacent to the method lock icon.
66 0
00 0

22
One press will lock the methods instantly. To unlock the methods press the key adjacent to the method
lock icon again. The methods are now unlocked. If the settings lock is active this must be disabled before
the method lock can be activated or deactivated.
In all the measurement modes if a user tries to save changes to a method when the method lock is active
the padlock icon flashes on the screen and changes cannot be saved.
4.5 MoDe SeLeCtion
The mode selection function enables access to the various
measurement modes to be restricted. The required modes
can be selected and the settings lock activated to prevent
other users from accessing the deactivated modes. The
mode selection function can be accessed through the
instrument settings menu by pressing the key adjacent
to the modeselection icon.
The measurement mode icons which are displayed on the
main menu are identified with a modeshown icon. The
mode icons which are not displayed on the main menu
are identified with a modenotshownicon.
To change a mode from displayed to restricted or vice
versa press the key adjacent to the measurementmode
icon. Once the required modes have been selected press
the key adjacent to the tick icon to save the changes.
The selected measurement modes will be displayed on
the main menu.
4.6 DiAGnoStiCS
The diagnostic function allows simple checks to be
carried out on the instrument. The wavelength can
be changed, the lamp can be turned on and off and a
sensitivity reading can be performed.
To exit this function without performing any checks press
the back key.
4.7 GLP SettinGS
In addition to the time and date settings this instrument also has a user ID function. This function
enables an individual three digit ID number to be set. This will be displayed on all printouts and saved
results.
7315
09:02
0.00500.0 nm
READON
Go to WL
23
The user ID function can be accessed through the
instrument settings menu by pressing the key adjacent
to the userID icon. Use the keys at the bottom of the
screen to select the digit to be changed. Use the keys
adjacent to the arrow icons to increase or decrease the
number. Once the preferred user ID has been set press
the key adjacent to the tick icon to save and return to the
instrument settings menu.
4.8 SCReen ContRASt
The screen contrast function enables the brightness of
the screen to be set. In the instrument settings menu
press the key adjacent to the screencontrast icon. Use
the keys below the arrow icons to increase or decrease
the screen contrast. Once the required contrast level has
been reached press the key adjacent to the tick icon to
save and return to the instrument settings menu.
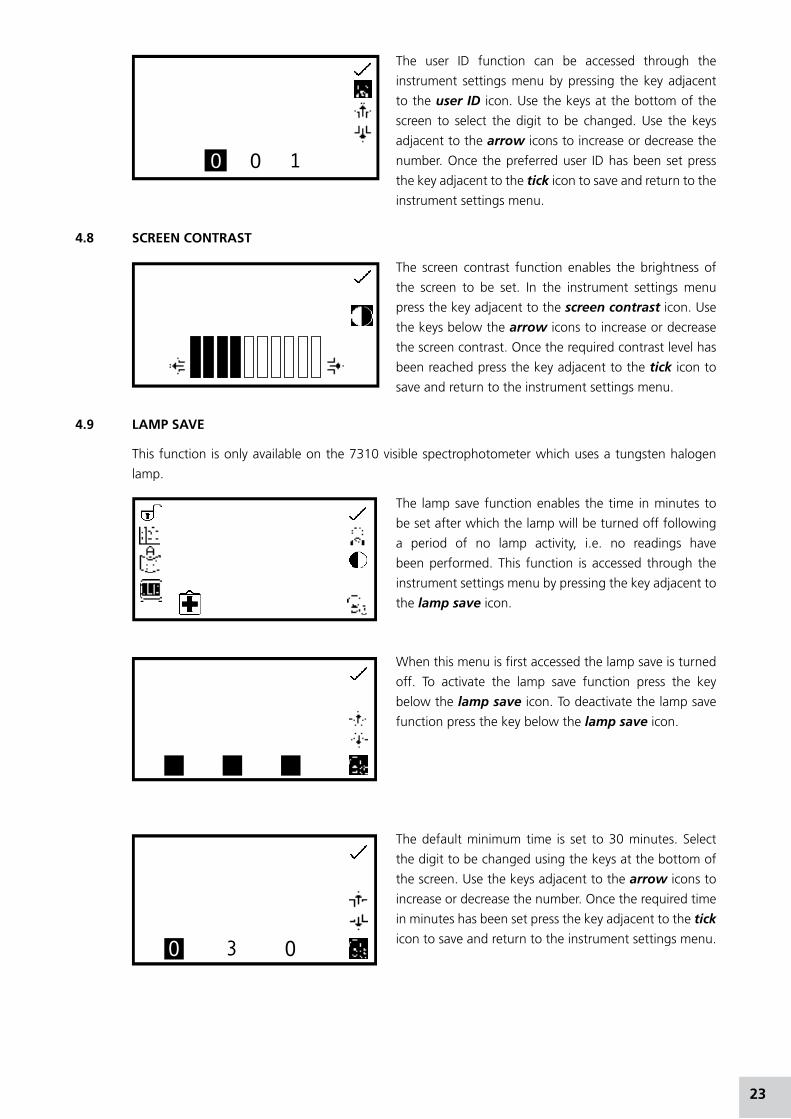
4.9 LAMP SAVe
This function is only available on the 7310 visible spectrophotometer which uses a tungsten halogen
lamp.
The lamp save function enables the time in minutes to
be set after which the lamp will be turned off following
a period of no lamp activity, i.e. no readings have
been performed. This function is accessed through the
instrument settings menu by pressing the key adjacent to
the lampsave icon.
When this menu is first accessed the lamp save is turned
off. To activate the lamp save function press the key
below thelampsave icon. To deactivate the lamp save
function press the key below the lampsave icon.
The default minimum time is set to 30 minutes. Select
the digit to be changed using the keys at the bottom of
the screen. Use the keys adjacent to the arrow icons to
increase or decrease the number. Once the required time
in minutes has been set press the key adjacent to the tick
icon to save and return to the instrument settings menu.
00 1
0 3 0

24
The time set will begin to count down when there is
no lamp activity. When the count down is complete the
lamp and the fan will be turned off and the lampsave
icon is shown in all the measurement modes. To bring
the instrument out of the lamp save in order to perform
a measurement press the key below the lampsave icon.
The lamp and fan will be turned back on and the lamp
will begin to warm up.
The lampcoldicon is displayed adjacent to the calibrate
tozero icon in the measurement mode. The time needed
for the lamp to warm up is five minutes.
To view the remaining warm up time press the key below
the lampcoldicon. Calibration and measurements can
be performed whilst the lamp is warming up but these
results may not be accurate.
Once the warm up time of five minutes is complete the
lampcold icon disappears.
0.000100.0
400
09:02
ABS
%T
nm
0.000100.0
400
09:02
ABS
%T
nm
09:02
16:30
0.000100.0
400
09:02
ABS
%T
nm

25
SeCtion 5 – Photometrics
The photometrics measurement mode enables simple measurements of absorbance and % transmittance to be performed. The sample is measured at one wavelength and at one point in time. There are no post measurement calculations available in this measurement mode.
5.1 MoDe SPeCiFiC PARAMeteRS
The photometrics minimal operating menu enables
calibration to zero absorbance/100% transmittance
and simple readings to be taken without changing any
measurement parameters. Pressing the key adjacent to
the JW icon opens the expanded operating menu.
The photometrics expanded operating menu enables
measurement parameters to be changed. The utility
toolbar on the left hand side of the screen enables access
to printing, print setup options, results, methods and
autologging options. For more details on the different
functions of the utility toolbar refer to section 10.
Fig5.1.1-ExpandedOperatingMenu
5.2 MetHoD Set UP
This measurement mode is very simple and the only
parameters which can be adjusted are the wavelength
and the display format.
0.000100.0
400
09:02
ABS
%T
nm
100.00.000
400
09:02
%T
ABS
nm
100.00.000
400
09:02
%T
ABS
nm
MinimalOperatingMenu
ExpandedOperatingMenu
0.000100.0
400
09:02
ABS
%T
nm
Toggle
Increase wavelength
Decrease wavelength
Print/print settings
Results selection menu
Method selection menu
Autolog menu
Calibrate to zero Measure sample

26
The toggle icon enables the large primary display to be set to show the absorbance or % transmittance.
To change the primary and secondary displays press the key adjacent to the toggle icon. Repeat presses
will cycle the displays between absorbance or % transmittance.
5.2.1 Selecting a Wavelength
The wavelength can be adjusted in the expanded operating menu by using the keys adjacent to the arrow icons to increase or decrease the wavelength. Once the required wavelength has been selected a calibration can be performed.
5.3 CALiBRAtion
The calibration must be performed at the same
wavelength at which the sample will be measured. Insert
a cuvette containing the blank solution into the sample
chamber and close the instrument lid. Press the key below
the calibrate to zero absorbance icon. This sets the
instrument to zero absorbance and 100% transmittance.
Once the calibration is complete the measuresample icon appears and the sample can be measured.
If the wavelength is adjusted before a sample is measured the measuresample icon will disappear and
the instrument must be calibrated again at the new wavelength.
5.4 SAMPLe MeASURMent
It is not possible to measure a sample before the instrument
has been calibrated at the selected wavelength. Once the
calibration has been performed the measure sample
icon is displayed and a sample can be measured. Remove
the cuvette containing the blank solution and place a
cuvette containing the sample to be measured in the
sample holder. Close the instrument lid and press the key
below the measuresample icon.
Once the measurement is complete the photometric result will be shown on the screen. Subsequent
samples can be measured in the same way. If the wavelength is adjusted between sample measurements
then the instrument must be calibrated again before more samples can be measured.
100.00.000
400
09:02
%T
ABS
nm
81.70.088
400
09:02
%T
ABS
nm
27
SeCtion 6 – Concentration
The concentration measurement mode enables simple measurements of absorbance and concentration to be performed. In this measurement mode it is possible to calibrate against a standard of a known concentration or use a known factor. The sample is measured at one wavelength at one point in time. There are no post measurement calculations available in this measurement mode.
6.1 MoDe SPeCiFiC PARAMeteRS
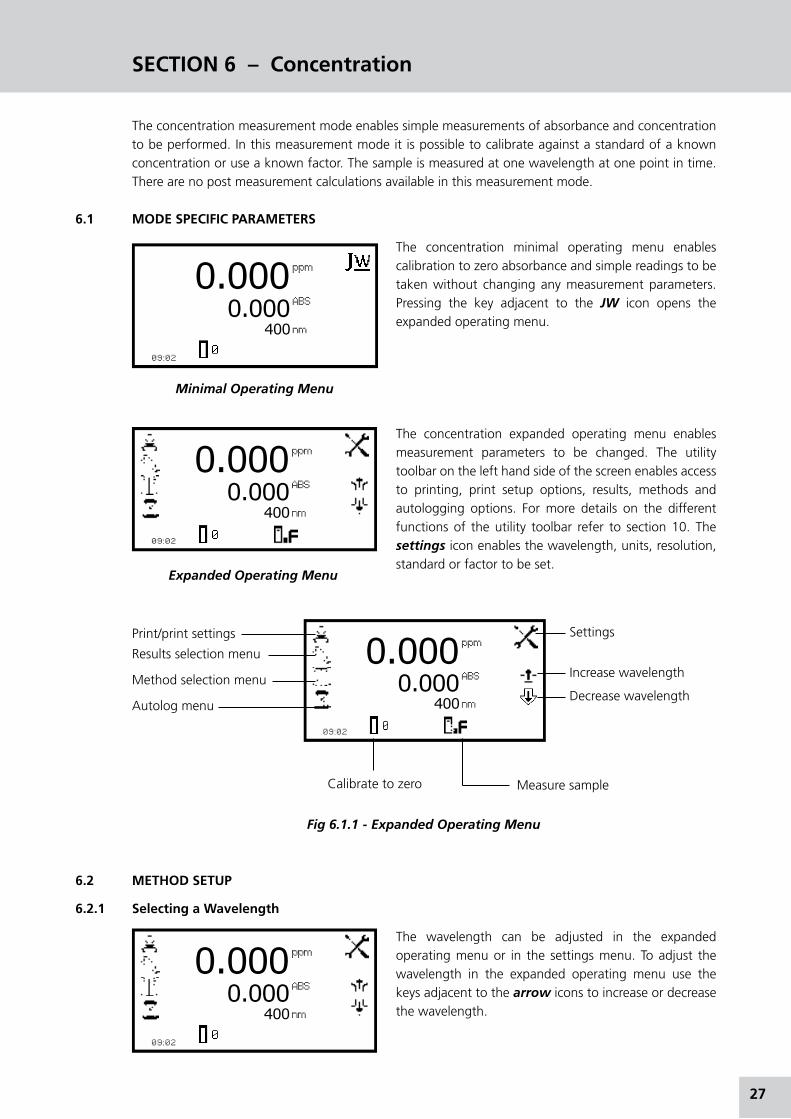
The concentration minimal operating menu enables calibration to zero absorbance and simple readings to be taken without changing any measurement parameters. Pressing the key adjacent to the JW icon opens the expanded operating menu.
The concentration expanded operating menu enables measurement parameters to be changed. The utility toolbar on the left hand side of the screen enables access to printing, print setup options, results, methods and autologging options. For more details on the different functions of the utility toolbar refer to section 10. The settings icon enables the wavelength, units, resolution, standard or factor to be set.
Fig6.1.1-ExpandedOperatingMenu
6.2 MetHoD SetUP
6.2.1 Selecting a Wavelength
The wavelength can be adjusted in the expanded operating menu or in the settings menu. To adjust the wavelength in the expanded operating menu use the keys adjacent to the arrow icons to increase or decrease the wavelength.
0.0000.000
400
09:02
ppm
ABS
nm
0.0000.000
400
09:02
ppm
ABS
nm
0.0000.000
400
09:02
ppm
ABS
nm
MinimalOperatingMenu
ExpandedOperatingMenu
0.0000.000
400
09:02
ppm
ABS
nm
Settings
Increase wavelength
Decrease wavelength
Print/print settings
Results selection menu
Method selection menu
Autolog menu
Calibrate to zero Measure sample

28
The settings menu is accessed through the expanded operating menu by pressing the key adjacent to the settings icon. In the settings menu press the key below the wavelength icon.
This will open a number entry screen. Use the keys at the bottom of the screen to select the digit to be adjusted. Use the keys adjacent to the arrow icons to increase or decrease the wavelength to the required number. Press the key adjacent to the tick icon to save the changes and return to the settings menu.
6.2.2 Settings
The settings menu enables the wavelength,units,resolution,standard or factor to be set and is accessed from the expanded operating menu by pressing the key adjacent to the settings icon. Once all of the required settings have been entered press the key adjacent to the tick icon to save and return to the expanded operating menu.
Fig6.2.2.1–SettingsMenu
When setting the method parameters either the standard or the factor should be selected. The standard should be used if the factor is not known as selecting this option will calculate the factor. If the factor is known it is not necessary to measure a known standard’s concentration. When the standard or factor is not selected the value should be set to 1.00.
6.2.2.1 Selecting Concentration Units
The units of concentration can be selected from a number of options: no units, %, ppm, EBC, SRM, mEq/l, mEq, M, mM, µM, nM, U, U/l, U/ml, g/l, mg/l, µg/l, ng/l, g/dl, mg/dl, µg/dl, mg/ml, µg/ml, ng/ml, µg/µl, ng/µl, mol/l, mmol/l.
In the settings menu press the key below the units icon. This opens the unit selection screen which displays all the different units. Use the keys adjacent to the arrow icons to navigate around the screen to select the required units. Once the required units have been highlighted press the key adjacent to the tick icon to save and return to the settings menu. The selected unit will be displayed in the minimal and expanded operating menu along with absorbance and selected wavelength.
ppm
1.000
2.008
400nm
4 00 0
ppm
1.000
2.008
400nm
---- % ppm EBC SRM mEq/l
mEq M mM µM nM U U/l
U/ml g/l mg/l µg/l ng/l g/dl
mg/dl µg/dl mg/ml µg/ml ng/ml
µg/µl ng/µl mol/l mmol/l.
Standard menuSelecting resolution
Selecting concentration units
Tick
Factor menu
Selecting a wavelength

29
6.2.2.2 Changing the Resolution
The resolution that the concentration is displayed as can be selected from 1, 0.1, 0.01 or 0.001 by repeat presses of the key below theresolution icon in the settings menu.
6.2.2.3 Using a Standard
The standard menu enables the value of a standard to be entered. This function is accessed by pressing the key adjacent to the standard icon. This opens the extended number entry screen. Use the keys at the bottom of the screen to select the digit to be changed. The key below the digit must be pressed twice to select the adjacent digit. For example 00 the first press of the key alters 10, the second press alters 01.
Use the keys adjacent to the arrowicons to increase or decrease the selected number. Standard values from 0.001 to 1000 can be entered. The standard value can be reset to zero by pressing the key adjacent to the 000 icon. Once the standard value has been entered press the key adjacent to the tick icon to save and return to the settings menu. The entered value is displayed in the settings menu adjacent to the
standard icon. A standard value should only be entered if the factor is not known. If the factor is known
the standard value should be set to 1.000.
6.2.2.4 Using a Factor
The factor menu enables a factor to be entered. This function is accessed by pressing the key adjacent to the factor icon. This opens the extended number entry screen. Use the keys at the bottom of the screen to select the digit to be changed. The key below the digit must be pressed twice to select the adjacent digit. For example 00 the first press of the key alters 10, the second press alters 01.
Use the keys adjacent to the arrow icons to increase or decrease the selected number. Factor values of 0.001 to 10,000 can be entered. The factor value can be reset to zero by pressing the key adjacent to the000icon. Once the factor has been entered press the key adjacent to thetickicon to save and return to the settings menu. The entered value is displayed in the settings menu adjacent to the factor icon. If the factor is not known a standard should be measured in order to calculate the factor. If a standard is used the factor value should be set to 1.000.
6.3 CALiBRAtion
In the concentration measurement mode calibrations against a standard or a factor can be performed following a zero calibration. If the factor is not known calibration against a known standard is performed in order to calculate the factor. However if the factor is known there is no need to calibrate using a standard. The calibration must be performed at the same wavelength at which the sample will be measured.
6.3.1 Calibrating to a Standard
Insert a cuvette containing the blank solution into the sample chamber and close the instrument lid. Press the key below the calibrate to zero absorbance icon. The instrument will calibrate to zero absorbance. Insert a cuvette containing the standard concentration sample solution into the sample chamber and close the instrument lid.
00 1.00 00
000
000 1.00 00
000
0.0000.000
400
09:02
ppm
ABS
nm

30
Press the key below the calibratetozeroabsorbanceorstandard icon, this will open another menu with the option to re-calibrate to zero absorbance or to calibrate to the previously entered standard value. Press the key adjacent to thecalibratetostandard icon.
If the standard selected requires a factor beyond the range of the instrument the check standard icon will be displayed.
The instrument will take a reading and calibrate to the standard concentration. Once the calibration is complete the sample can be measured using the measure tostandard icon.
6.3.2 Calibrating to a Factor
Insert a cuvette containing the blank solution into the sample chamber and close the instrument lid. Press the key below the calibratetozeroabsorbance icon. The instrument will calibrate to zero absorbance. Once the calibration is complete the sample can be measured using the measuretofactor icon.
6.4 SAMPLe MeASUReMent
It is not possible to perform sample measurements before the instrument has been calibrated at the selected wavelength. In this operating mode the type of sample measurement performed depends on the calibration which has been carried out.
6.4.1 Measuring a Sample After Calibrating to a Standard
Remove the cuvette containing the standard sample and place a cuvette containing the sample to be measured in the sample chamber. Close the instrument lid and press the key below the measure to standard icon. Once the measurement is complete the concentration and absorbance values are displayed.
6.4.2 Measuring a Sample After Calibrating to a Factor
Remove the cuvette containing the blank solution and place a cuvette containing the sample to be measured in the sample chamber. Close the instrument lid and press the key below the measuretofactor icon. Once the measurement is complete the concentration and absorbance values are displayed.
In order to measure a sample based on a known factor the value for the factor must be entered in the settings menu before commencing measurement of the sample.
0.0000.000
400
09:02
ppm
ABS
nm
0.000 ABS
20.000
10.000.121
400
09:02
ppm
ABS
nm
0.0000.000
400
09:02
ppm
ABS
nm
10.000.121
400
09:02
ppm
ABS
nm
0.0000.000
400
09:02
ppm
ABS
nm

31
SeCtion 7 – Spectrum
The spectrum measurement mode enables measurements of absorbance or % transmittance over a range of wavelengths to be performed. The absorbance or % transmittance at each wavelength is plotted graphically. Post measurement tools such as peaks and valleys analysis and spectral points analysis can be performed. This operating mode can be used to partially characterise a sample.
7.1 MoDe SPeCiFiC PARAMeteRS
The spectrum minimal operating menu enables baseline scans and spectrum scans to be performed without changing any measurement parameters or settings. Pressing the key adjacent to the JW icon opens the expanded operating menu.
The spectrum expanded operating menu enables measurement parameters to be changed. The utility toolbar on the left hand side of the screen enables access to printing, print setup options, results, methods and autologging options. For more details on the different functions of the utility toolbar refer to section 10.
The scansettings icon enables the graph y-axis, absorbance or % transmittance operating mode, start and end wavelengths and scan interval to be set. The peaksandvalleysthresholdicon enables the peaks and valleys threshold to be set. The peaksandvalleystable icon enables the peaks and valleys of the scan to be viewed in tabular form. The spectralpointsanalysis icon enables points to be selected from the scan for post measurement analysis.
Fig7.1.1-ExpandedOperatingMenu–PostMeasurement
09:02
2.500ABS
1.000
-0.500
350 550450nm
09:02
2.500ABS
-0.500
350 550450nm
09:02
2.500ABS
-0.500
350 550450nm
MinimalOperatingMenu
ExpandedOperatingMenu
Scan settings
Peaks and valleys threshold
Peaks and valleys table
Spectral points analysis
Print/print settings
Results selection menu
Method selection menu
Autolog menu
Baseline scan Scan sample

32
7.2 MetHoD SetUP
In this measurement mode all of the method setup parameters are accessed through the scan settings menu. To open the scan settings menu press the key adjacent to the scansettings icon in the expanded operating menu.
7.2.1 Scan Settings
This function enables the graph y-axis, absorbance or % transmittance operating mode, start and end wavelengths and scan interval to be set. To access this function press the key adjacent to the scansettings icon in the expanded operating menu.
Fig7.2.1.1–ScanSettingsMenu
7.2.1.1 Selecting Absorbance or % transmittance
The operating mode is displayed on the left hand side of the menu. The default parameter is absorbance and pressing the key adjacent to theABS icon cycles the operating mode between absorbance and % transmittance.
7.2.1.2 Setting Start and end Wavelengths
This function enables the start and end wavelengths of the spectrum scan to be set. Model 7310 has a spectrum range from 320nm to 1000nm; model 7315 has a spectrum range from 198 to 1000nm. To set the start wavelength in the scan settings menu press the key adjacent to the wavelength on the far left of the x-axis. This opens the number entry screen.
Use the keys at the bottom of the screen to select the digit to be changed and use the keys adjacent to the arrow icons to increase or decrease the number. Once the required start wavelength has been entered press the key adjacent to the tick icon to save and return to the scan settings menu.
To set the end wavelength in the scan settings menu press the key adjacent to the wavelength icon on the far right of the x-axis. This opens the number entry screen. Use the keys at the bottom of the screen to select the digit to be changed and use the arrowkeys to increase or decrease the number. Once the required end wavelength has been entered press the key adjacent to the tick icon to save and return to the scan settings menu.
4 00 0 500nm
5 00 0400nm
2.500
-0.500
ABS
350nm 550nm
Tick iconMaximum Abs/% transmittance
Manual/automatic y-axis scaling
Selecting Abs/% transmittance
Minimum Abs/% transmittance
Setting start wavelength
Setting end wavelength
Setting scan interval
09:02
2.500ABS
-0.500
350 550450nm

33
If the start wavelength entered is the same as the end wavelength the end wavelength will automatically be set to be one times the scan interval. For example, if the start wavelength is entered as 500nm but the end wavelength is already set to 500nm and the scan interval is 2nm, the end wavelength will be automatically adjusted to 502nm. If the end wavelength entered is the same as the start wavelength the start wavelength will automatically be set to be one times the scan interval. For example, if the end wavelength is entered as 500nm but the start wavelength is already set to 500nm and the scan interval is 2nm, the start wavelength will be automatically adjusted to 498nm.
7.2.1.3 Setting the Scan interval
This function enables the interval between wavelengths measured in the spectrum scan to be set. The scan interval can be altered to 1, 2 or 5nm by pressing the key below the scaninterval icon. Repeat pressing of the key cycles the interval between 1, 2 or 5nm. The scan interval can only be selected if the wavelength range is divisible by this number. For example a scan interval of 5nm cannot be selected for a wavelength range of 400 to 503nm.
7.2.1.4 Y-Axis Scaling
This function enables the scale of the y-axis of the spectrum graph to be adjusted either manually or automatically. The automatic scaling is represented by the hand icon with a cross through it and the manual scaling by the hand icon without the cross. To select manual or automatic scaling press the key adjacent to the hand icon. Repeat pressing of the key cycles between manual and automatic scaling.
In automatic y-axis scaling the absorbance or % transmittance values are cleared from the settings screen. When the spectrum scan has been completed the y-axis is automatically re-scaled.
In manual scaling the minimum and maximum absorbance or % transmittance values can be set. To change the absorbance or % transmittance values press the key adjacent to the minimum y-axis value, this opens a number entry screen.
Use the keys at the bottom of the screen to select the digit to be changed and use the keys adjacent to the arrowicons to increase or decrease the number. To change the sign press the key below the + or - icon. Repeat presses will cycle between + and -. Once the required absorbance or % transmittance value has been entered press the key adjacent to the tick icon.
AutomaticScaling
ManualScaling
3- . 00 0
400nm 500nm
ABS
-0.500
2.500
400nm 500nm
ABS

34
To change the maximum absorbance or % transmittance value press the key adjacent to the maximum y-axis value, this opens a number entry screen. Use the keys adjacent to the arrow icons to increase or decrease the number. To change the sign press the key below the + or - icon. Repeat presses will cycle between + and –. Once the required absorbance or % transmittance value has been entered press the key adjacent to the tickicon.
7.3 CALiBRAtion
In the spectrum measurement mode the calibration is a baseline scan which is performed across the selected wavelength range at the selected scan interval. Insert a cuvette containing the blank solution into the sample chamber and close the instrument lid. Press the key below the baselinescan icon to initiate the baseline scan. The baseline icon will change to show baseline scan inprogress icon and a progress bar will be displayed.
To stop the baseline scan before completion press the key below the baselinescaninprogress icon. Confirmation will be needed to stop the baseline scan. Press the key adjacent to the tickicon to confirm stopping the baseline scan and return to the expanded operating menu.
Press the key adjacent to the cross icon to continue the baseline scan. Once the baseline scan has been completed the scansample icon is displayed and a sample can be measured.
If the wavelength range, or the scan interval, is changed before a sample scan is performed a new baseline scan must be performed across the new wavelength range, at the new scan interval, before a sample can be measured.
7.4 SAMPLe MeASUReMent
It is not possible to measure a sample before a baseline scan has been performed. Insert a cuvette containing the sample to be measured in the sample chamber and close the instrument lid. Press the key below the scansample icon to start the spectrum scan of the sample.
The instrument will perform a scan across the wavelength range and scan interval previously selected. The scansample icon will change to show the spectrumscanisinprogressicon.
09:02
2.500ABS
-0.500
350 550450nm
0 100
09:02
2.500ABS
-0.500
350 550450nm
09:02
2.500ABS
-0.500
350 550450nm
09:02
2.500ABS
-0.500
350 550nm450nm
3+ . 02 0

35
To stop the scan before completion press the key below the scaninprogress icon. Confirmation will be needed to stop the sample scan. Press the key adjacent to the cross icon to continue with the scan of the sample or press the key adjacent to the tick icon to confirm stopping the scan.
Depending on how many data points have been measured either a partial scan and all the post measurement tools will be displayed, or the instrument will return to the expanded operating menu with no measurements saved.
Once the scan is completed the spectrum will be shown on the screen. If automatic scaling was selected the y-axis will automatically be re-scaled.
7.5 DAtA AnALYSiS
The post measurement tools icons are displayed on the screen following the completion of the scan. The tools include peaks and valleys threshold, peaks andvalleystable and spectralpointsanalysis. The peaks and valleys table displays all the detected peaks and valleys above the selected threshold value. The spectral points analysis function enables points to be selected from the scan to analyse absorbance or % transmittance at selected wavelengths.
7.5.1 Peaks and Valleys threshold
This function enables the peaks and valleys threshold to be set at 1, 5, 10% or turned off. To select the threshold value press the key adjacent to the peaksandvalleysthreshold icon. Repeat presses of the key will cycle through 1%, 5%, 10% and off.
If the peaks and valleys are turned off this is represented by the peaks and valleys icon with a cross in place of a number. When the peaks and valleys threshold is switched off the peaks and valleys table icon is not displayed. If a 5% threshold is selected then only peaks and valleys above this threshold will be displayed in the peaks and valleys table:
09:02
2.500ABS
-0.500
350 550450nm
1.500425nm
1.500475nm
1.000450nm
09:02
2.500ABS
-0.500
350 550450nm
1.500425nm
1.500475nm
1.000450nm
09:02
2.500ABS
-0.500
350 550450nm
1.500425nm
1.500475nm
1.000450nm
09:02
2.500ABS
-0.500
350 550450nm
X
09:02
2.500ABS
-0.500
350 550450nm
Wavelengthrange ThresholdAbsor%Trange Percentage
The threshold is calculated as:

7.5.2 Peaks and Valleys table
This function displays all the detected peaks and valleys above the selected threshold, in tabular form. To open the table press the key adjacent to the peaksandvalleystable icon. If the peaks and valleys threshold is switched off this icon is not displayed.
In the peaks and valleys table screen it is possible to display both peaks and valleys, just peaks or just valleys. To display the peaks only press the key below the peakonly icon. To redisplay the peaks and valleys press the same key again.
To display the valleys only press the key below the valleyonly icon. To redisplay the peaks and valley press the same key again.
In the table the absorbance or % transmittance values (depending on the operating mode selected in the scan settings) are shown with the corresponding wavelength. Use the keys adjacent to the arrow icons to scroll up or down through the readings in the table. Press the key adjacent to the tick icon to return to the expanded operating menu.
7.5.3 Spectral Points Analysis
The spectral points analysis function enables points to be selected from the scan to analyse the absorbance or % transmittance at a selected wavelength. To access this function press the key adjacent to the spectralpointsanalysis icon and this opens the selection screen.
A solid vertical line will appear on the far right of the screen. Use the keys below the greaterthan (>) or lessthan (<) icons to move the line along the spectrum by decreasing or increasing the wavelength by one scan interval, the double greaterthan (>>) or lessthan (<<) icons increase or decrease the wavelength by ten times the scan interval.
As the vertical line moves along the scan the wavelength and absorbance or % transmittance value is displayed at the top of the screen. To add the selected point from the spectrum to the spectral points analysis table press the key adjacent to the addpointstospectralpointsanalysistable icon.
Only 6 points can be stored in the spectral points analysis table. When adding a selected point to the table the position this point is in the table will flash up on the screen. If the table is full and a 7th point is selected to go into the table a warning symbol will flash up and a point must be deleted from the table before another point can be added.
36
----
ABSnm
450 1.000
1.5001.500
ABSnm
425475
--------
2.500
1.000
-2.500
350 550450nm
1.500----1.500
ABSnm
425450475
----1.000----
2.500
ABS
1.000
-0.500
350 550450nm

The wavelength to be analysed can also be entered manually. This can be done in two ways; firstly by pressing the key below the wavelength icon in the spectral points analysis menu. This opens a number entry screen where the wavelength can be input manually. Use the keys at the bottom of the screen to select the digit to be changed and use the keys adjacent to the arrow icons to increase or decrease the number. Once the wavelength has been entered press the key adjacent to the tickicon to save and return to the spectral points analysis menu.
Secondly, the wavelength can also be entered manually in the spectralpoints analysis table by pressing the key adjacent to the location in the table where the result is to be stored. This opens a number entry screen where the analysis point can also be deleted by pressing the key adjacent to the delete icon.
Use the keys at the bottom of the screen to select the digit to be changed and use the keys adjacent to the arrow icons to increase or decrease the number. Once the required wavelength has been entered or the analysis point deleted press the key adjacent to the tick icon to save and return to the spectral points analysis table. If a wavelength entered is outside the scan range the checknumberwarning icon will be displayed before the wavelength is automatically adjusted to within the range.
To view the points in the spectral points analysis table press the key adjacent to the spectralpointsanalysistable icon. Only three points can be displayed on the screen at one time; to view the other points in the table press the key below thedownarrow icon. To view the first three points again press the key below the uparrow icon. The table displays the wavelength and either the corresponding absorbance or % transmittance, as well as the order in which the points were selected or entered.
To change the photometric value between absorbance or % transmittance press the key below the ABSicon or %T icon. Pressing the key adjacent to the tick icon will save any changes made and return to the spectral points analysis menu.
It is possible to access spectral points analysis before a scan is performed. Points to be analysed can be pre-selected from the blank axis, or entered manually in the spectral points analysis table. When the scan has been performed the points for analysis will already be in the table with the corresponding absorbance or % transmittance values.
37
40 4 2
5
487
500
447
1
2
3
0.513
0.028
0.855
ABS(nm)
%T
445
442
439
4
5
6
0.843
0.733
0.515
ABS(nm)
%T
00 5 0

38
SeCtion 8 – Quantitation
The quantitation measurement mode enables sample concentrations to be calculated using a standard curve. In this mode a number of standard solutions covering a range of known concentrations are measured at a set wavelength. The absorbance or % transmittance of these solutions is plotted to create a standard curve. Once the standard curve has been created a sample of unknown concentration can be measured and the concentration calculated using the standard curve.
8.1 MoDe SPeCiFiC PARAMeteRS
The quantitation minimal operating menu enables calibration to zero absorbance and simple readings to be taken without changing any measurement parameters or settings. Pressing the key adjacent to the JW icon opens the expanded operating menu.
The quantitation expanded operating menu enables measurement parameters to be changed. The utility toolbar on the left hand side of the screen enables access to printing, print setup options, results, methods and autologging options. For more details on the different functions of the utility toolbar refer to section 10.
The standardcurve icon enables the current standard curve and curve statistics to be viewed or a new standard curve to be created. Thequantitationtable icon enables the quantitation standards to be viewed.
Fig8.1-ExpandedOperatingMenu–PostMeasurement
MinimalOperatingMenu
ExpandedOperatingMenu
-0.0000.000
400
09:02
ppm
ABS
nm
-0.0000.000
400
09:02
ppm
ABS
nm
0.9860.000
400
09:02
ppm
ABS
nm
Print/print settings Standard curve
Quantitation table
Increase wavelenth
Decrease wavelength
Calibrate to zero
Measure sample
Results selection menu
Method selection menu
Autolog menu

39
8.2 MetHoD SetUP
8.2.1 Selecting a Wavelength
The wavelength can be changed in the expanded operating menu by using the keys adjacent to the arrow icons. Use the keys to increase or decrease the wavelength until the required wavelength has been selected. The wavelength selected should be the same wavelength that the standards and unknown samples are to be measured at. The wavelength can also be adjusted in the standard curve screen. Refer to section 8.2.3 for more details.
8.2.2 Quantitation table
The quantitation table enables the quantitation standards to be viewed. This function also enables the number of standards, units, resolution and operating mode to be set. To access the quantitation table screen press the key adjacent to thequantitationtable icon in the expanded operating menu.
Only three standards can be displayed on the screen at one time; to view the other standards in the table press the key below the downarrow icon. The quantitation table displays the standard concentration on the left hand side of the table with the corresponding absorbance or % transmittance on the right hand side of the table. The standard curve can also be accessed from this screen by pressing the key adjacent to the standardcurve icon. The standard curve can also be viewed from this screen by pressing the key adjacent to the standardcurve icon.
8.2.2.1 Selecting number of Standards
The number of standards used to create a standard curve can be changed from 2 to 6 standards. To change the number of standards press the key below the numberof standards icon. Repeat presses cycles the number between 2, 3, 4, 5 and 6. If there is only one standard available the concentration measurement mode should be used.
8.2.2.2 Selecting Concentration Units
The units of concentration can be selected from a number of options: no units, %, ppm, EBC, SRM, mEq/l, mEq, M, mM, µM, nM, U, U/l, U/ml, g/l, mg/l, µg/l, ng/l, g/dl, mg/dl, µg/dl, mg/ml, µg/ml, ng/ml, µg/µl, ng/µl, mol/l, mmol/l.
In the quantitation table menu press the key below the units icon and use the keys adjacent to the arrow icons to navigate round the screen to select the required units. Once the required units have been selected press the key adjacent to the tick icon to save and return to the quantitation table screen.
-0.0000.000
400
09:02
ppm
ABS
nm
ppm ABS
0.100.200.30
0.1000.2000.300
123
---- % ppm EBC SRM mEq/l
mEq M mM µM nM U U/l
U/ml g/l mg/l µg/l ng/l g/dl
mg/dl µg/dl mg/ml µg/ml ng/ml
µg/µl ng/µl mol/l mmol/l.
ppm ABS
0.100.200.30
0.1000.2000.300
123

40
8.2.2.3 Changing the Resolution
The resolution of the concentration can be selected from 1, 0.1, 0.01 or 0.001 by repeat presses of the key below the resolution icon.
8.2.2.4 Selecting Absorbance or % transmittance
The operating mode can be changed between absorbance or % transmittance by pressing the key below the Abs or %T icon. Repeat presses will cycle between absorbance or % transmittance.
8.2.2.5 Adding Standards
This function enables standards to be added which will be used to create the standard curve. Before creating a new standard curve the concentrations of the standards to be measured must be entered here. To enter the concentration of the first standard press the key adjacent to the first concentration in the table.
This opens a number entry screen; use the keys at the bottom of the screen to select the digit to be changed and use the keys adjacent to the arrow icons to increase or decrease the number. Once the required number has been entered press the key adjacent to the tick icon to save the changes.
The photometric values of the standards can also be entered if known. To enter the photometric value press the key adjacent to the photometric value in the table that corresponds to the relevant concentration; this opens the number entry screen. Use the keys at the bottom of the screen to select the digit to be changed and use the keys adjacent to the arrow icons to increase or decrease the number.
The positive sign can be changed to a negative sign by pressing the key below the + icon. Once the required number has been entered press the key adjacent to the tick icon to save. When the required resolution, units, number of standards, operating mode and standard concentrations have been set press the key adjacent to the tick icon to save and return to the expanded operating menu.
8.2.3 Standard Curve
This function enables the current standard curve to be viewed, a new standard curve to be created, the curve fit to be adjusted and the curve statistics to be displayed. To access this function press the key adjacent to the standardcurveicon in the expanded operating menu.
ppm ABS
0.100.200.30
0.1000.2000.300
123
0+ 00 . 0 10
1+ . 0 0 0
ABS
-0.0000.000
400
09:02
ppm
ABS
nm

When the current standard curve is displayed the concentration and photometric value of the last sample measured is also displayed on the curve. The curve fit algorithm can be changed by pressing the key below the curvefit icon. Repeat presses of the key cycles the curve fit between linear, linear through zero, quadratic, quadratic through zero and interpolate.
The wavelength which the standards were measured at is displayed on the right hand side of the screen. To adjust the wavelength press the key adjacent to the wavelength icon.
This opens the number entry screen. Use the keys at the bottom of the screen to select the digit to be changed and use the keys adjacent to the arrow icons to increase or decrease the number. Press the key adjacent to the tick icon to save and return to the standard curve screen. The wavelength selected should be the same wavelength that the new standards and unknown samples are to be measured at.
The curve statistics can also be displayed by pressing the key below the S icon; this opens a screen on top of the existing curve displaying statistics for the curve fit chosen. For example if the curve fit is y = mx+c the curve statistics displayed will be the gradient of the line (m), constant (c) and correlation coefficient (r2). To exit this screen press the key adjacent to the tick icon. The quantitation table can also be viewed from this screen by pressing the key adjacent to the quantitationtable icon.
8.2.3.1 Creating a new Standard Curve
Before creating a new curve it is necessary to enter the concentrations of the standard solutions in the quantitation table. Also the number of standards should be selected in the quantitation table menu. A new standard curve can be created by pressing the key below the create newstandardcurveicon.
Confirmation will be needed to delete the old curve before a new one can be created. Press the key adjacent to the cross icon to cancel deletion and return to the current standard curve screen. Press the key adjacent to the tick icon to confirm deletion of the current standard curve and create a new curve.
This will open the standard measurement screen. The first sample to be measured should be a blank sample as this will be used to calibrate the instrument to zero absorbance. Place the cuvette containing the blank solution into the sample chamber and close the instrument lid. Press the key adjacent to the tick icon to perform an initial calibration to zero absorbance.
41
4 00 0
0.600ABS
0.300
0.000
0.00
y = mx+c
0.600.30 ppm
Y = mX+Cm = 1. 000c = 0. 000r2 = 1. 149
0.600ABS
0.300 400nm
0.000
0.00
y = mx+c
0.600.30 ppm
0.600ABS
0.300 400nm
0.000
0.00
y = mx+c
0.600.30 ppm
0.000 ABS

Once this measurement has been performed the standard concentration samples can be measured. Remove the cuvette containing the blank solution from the sample chamber and insert the cuvette containing the first standardised solution to be measured.
Close the instrument lid and press the key adjacent to the tick icon to take a reading of the standard. The concentration along with the photometric value will then be displayed. This standard can be re-measured by pressing the key adjacent to the back icon.
To measure the next standard remove the current standard from the sample chamber and insert the cuvette containing the second standardised solution. Press the key adjacent to the tick icon to take a reading of the standard. Repeat this procedure until all the standards (up to a maximum of six) have been measured. Once all the standards have been measured the instrument returns to the standard curve screen and the new curve can be viewed. The photometric values for all of the newly added standards can be viewed in the quantitation table.
To abort creation of the new standard curve before all the standards have been measured press the key adjacent to the cross icon at any time and the instrument will return to the previous standard curve.
Once the curve has been created press the key adjacent to the tick icon and the screen will return to the expanded operating menu where unknown samples can be measured. When this operating mode is exited the current standard curve will be saved until it is replaced by a new curve.
The automatic 8 cell turret can be used to assist creating a new curve. Refer to section 11.3.1.1 for more details.
8.3 CALiBRAtion
The zero calibration must be performed at the same wavelength as the standards were measured at and the unknown samples will be measured at. Insert a cuvette containing the blank solution into the sample chamber and close the instrument lid. Press the key below the calibratetozeroabsorbanceicon. The instrument will calibrate to zero absorbance.
Once the calibration is complete the measuresample icon appears and the sample can be measured. If the wavelength is adjusted before a sample is measured the measuresampleicon will disappear and the instrument must be calibrated again at the new wavelength.
8.4 SAMPLe MeASUReMent
Once a calibration has been performed the measuresample icon appears. A standard curve should either be created or loaded from a previously saved method before carrying out a measurement of an unknown sample. Place the cuvette containing the sample in the sample chamber and close the instrument lid.
Press the key below the measure sample icon and the instrument will take a reading and the concentration and photometric values will be displayed on the screen. To view the position of this sample on the standard curve open the standard curve screen.
42
0.000 ABS
1: 0.10 ppm
0.0000.000
400
09:02
ppm
ABS
nm
0.9860.000
400
09:02
ppm
ABS
nm
43
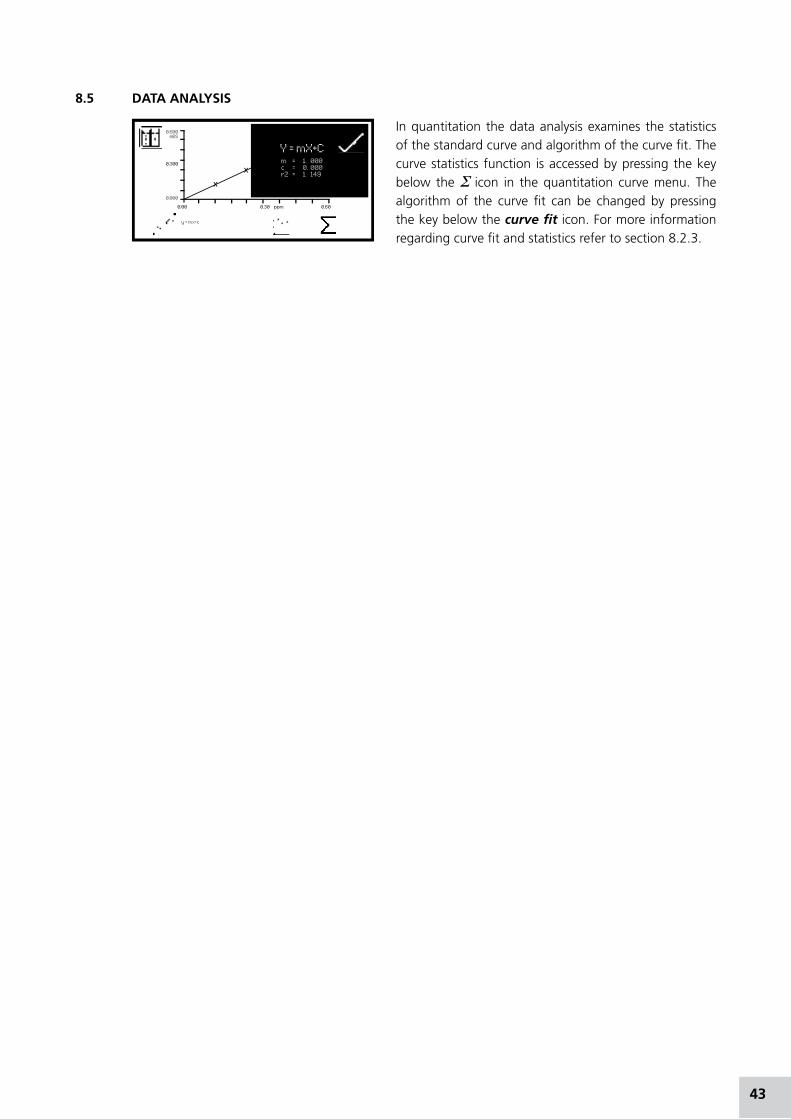
8.5 DAtA AnALYSiS
In quantitation the data analysis examines the statistics of the standard curve and algorithm of the curve fit. The curve statistics function is accessed by pressing the key below the S icon in the quantitation curve menu. The algorithm of the curve fit can be changed by pressing the key below the curvefiticon. For more information regarding curve fit and statistics refer to section 8.2.3.
0.600ABS
0.300
0.000
0.00
y = mx+c
0.600.30 ppm
Y = mX+Cm = 1. 000c = 0. 000r2 = 1. 149

44
SeCtion 9 – Kinetics
The kinetics measurement mode enables the absorbance or % transmittance of an active molecule to be measured over a period of time; for example enzyme analysis of horseradish peroxidase. The absorbance or % transmittance is measured at regular time intervals at a set wavelength over a period of time. The results are plotted on a graph to show the change in absorbance or % transmittance over time. Following sample measurement statistical analysis of all or part of the experiment can be performed.
9.1 MoDe SPeCiFiC PARAMeteRS
The kinetics minimal operating menu enables calibration to zero absorbance and kinetics measurements to be performed without changing any measurement parameters or settings. Pressing the key adjacent to the JW icon opens the expanded operating menu.
The kinetics expanded operating menu enables measurement parameters to be changed. The utility toolbar on the left hand side of the screen enables access to printing, print setup options, results, methods and autologging options. For more details on the different functions of the utility toolbar refer to section 10.
The settings icon enables the wavelength, units, resolution, graph y-axis, absorbance or % transmittance operating mode, standard, factor, measurement time, lag time and start on level to be set. Following the completion of a set of kinetics measurements the statistics for all or part of the kinetics run can be analysed. The kineticsmovingline function enables the initial and final points of the curve to be selected, so that analysis of the area between these two points can be performed.
Fig9.1.1-ExpandedOperatingMenu–PostMeasurement
MinimalOperatingMenu
ExpandedOperatingMenu
3.000ABS
-5.000
0.00 10.005.0 s
09:02
3.000ABS
-5.000
0.00 10.005.0 s
09:02
3.000ABS
-5.000
0.00 10.005.0 s
09:02
Print/print settings Settings
Kinetics moving line
Statistics
Calibrate to zero
Start kinetics Measurement
Results selection menu
Method selection menu
Autolog menu

0010s ppm 0020s
2.500
-0.500
Abs
400nm
1.000
1.00
45
9.2 MetHoD Set UP
In this measurement mode all the method set up parameters are accessed through the settings menu. To open the settings menu press the key adjacent to the settings icon in the expanded operating menu.
9.2.1 Kinetics Settings
The settings menu enables the wavelength, units, resolution, graph y-axis, operating mode, standard, factor, measurement time, lag time and start on level to be set. Once all of the required settings have been entered press the key adjacent to the tick icon to save and return to the expanded operating menu.
Fig9.2.1.1-SettingsMenu
9.2.1.1 Y-Axis Scaling
This function enables the scale of the y-axis of the kinetics graph to be adjusted either manually or automatically. The automatic scaling is represented by the hand icon with a cross through it and the manual scaling by the hand icon without the cross. To select manual or automatic scaling press the key adjacent to the hand icon. Repeat pressing of the key cycles between manual and automatic scaling.
In automatic y-axis scaling the absorbance or % transmittance values are cleared from the settings screen. When the kinetics measurement is complete the y-axis is automatically re-scaled.
In manual scaling the minimum and maximum absorbance or % transmittance values can be set. To change the absorbance or % transmittance values press the key adjacent to the minimum y-axis value, this opens a number entry screen.
3.000ABS
-5.000
0.00 10.005.0 s
09:02
0000s ppm 0010s
Abs
400nm
1.000
1.00
Maximum ABS/%T Tick icon
Select wavelength
Standard menu
Factor menu
Selecting resolution
Selecting units
Setting the measurement time
Setting lag time/start on level
Manual/automatic scaling
Abs/% transmittance
Minimum Abs/%T
AutomaticScaling
ManualScaling
0010s ppm 0020s
2.500
-0.500
Abs
400nm
1.000
1.00

Use the keys at the bottom of the screen to select the digit to be changed and use the keys adjacent to the arrow icons to increase or decrease the number. To change the sign press the key below the + or - icon. Repeat presses will cycle between + and –. Once the required absorbance or % transmittance value has been entered press the key adjacent to the tick icon.
To change the maximum absorbance or % transmittance value press the key adjacent to the maximum y-axis value, this opens a number entry screen. Use the keys adjacent to the arrow icons to increase or decrease the number. To change the sign press the key below the + or - icon. Repeat presses will cycle between + and –. Once the required absorbance or % transmittance has been entered press the key adjacent to the tick icon.
9.2.1.2 Setting Lag time or Start on Level
In this measurement mode starting the kinetics measurements can be delayed by setting a lag time or a start on level. The lag time is the amount of time that the instrument will wait before starting the kinetics measurements. The start on level is the absorbance level that must be reached before starting the kinetics measurements. Both options can be set using the set lag time/start on menu. This function is accessed by pressing the key below the starttimepause icon on the far left side of the x-axis. This opens the lag time/start on level menu.
To set the lag time press the key adjacent to the clock icon. Use the keys at the bottom of the screen to select the digit to be changed and the keys adjacent to the arrow icons to increase or decrease the number. The lag time can be reset to zero by pressing the key adjacent to the 000 icon.
Once the required lag time has been entered in seconds press the key adjacent to the tick icon to save and return to the settings menu.
To set the start on level press the key adjacent to the Abs/%Ticon. Use the keys at the bottom of the screen to select the digit to be changed and the keys adjacent to the arrow icons to increase or decrease the number. The positive sign can be changed to a negative sign by pressing the key below the symbol + icon.
On the left hand side of the screen the symbol can be changed to read greaterthan (>) or lessthan (<) the absorbance level that has been entered. The start on level can also be turnedoff (</>). Once the required absorbance or % transmittance level (depending on the operating mode selected) has been entered press the key adjacent to the tick icon to save and return to the settings menu.
9.2.1.3 Selecting Absorbance or % transmittance
The operating mode is displayed on the left hand side of the screen. The default parameter is absorbance and pressing the key adjacent to the ABS icon cycles the operating mode between the absorbance or % transmittance.
46
5- . 00 0
5+ . 02 0
1 00
000
0+ . 02 0

47
9.2.1.4 Changing the Resolution
The resolution of the concentration can be selected from 1, 0.1, 0.01 or 0.001 by repeat presses of the key below the resolution icon.
9.2.1.5 Selecting Concentration Units
The concentration units can be selected from a number of options: no units, %, ppm, EBC, SRM, mEq/l, mEq, M, mM, µM, nM, U, U/l, U/ml, g/l, mg/l, µg/l, ng/l, g/dl, mg/dl, µg/dl, mg/ml, µg/ml, ng/ml, µg/µl, ng/µl, mol/l, mmol/l.
In the settings menu press the key below the units icon to open the unit selection screen which displays all the different unit options. Use the keys adjacent to the arrow icons to navigate around the screen to select the required units. Once the required units have been highlighted press the key adjacent to the tick icon to save and return to the settings menu.
9.2.1.6 Using a Standard
The standard menu enables the value for a standard to be entered. This function is accessed by pressing the key adjacent to the standard icon. This opens the extended number entry screen. Use the keys at the bottom of the screen to select the digit to be changed. The key below
the digit must be pressed twice to select the adjacent
digit. For example 00, the first press of the key alters 10,
the second press alters 01.
Use the keys adjacent to the arrow icons to increase or decrease the selected number. Standard values of 0.001 to 1000 can be entered. The standard value can be reset to zero by pressing the key adjacent to the 000 icon. Once the standard value has been entered press the key adjacent to the tick icon to save and return to the settings menu screen. The entered value is now displayed in the settings menu adjacent to the standard icon.
A standard value should only be entered if the factor is not known. If the factor is known the standard
value should be set to 1.000.
9.2.1.7 Using a Factor
The factor menu enables a factor to be entered. This function is accessed by pressing the key adjacent to the factor icon. This opens the extended number entry screen. Use the keys at the bottom of the screen to select the digit to be changed. The key below the digit must be pressed twice to select the adjacent digit. For example 00, the first press of the key alters 10, the second press alters 01. Use the keys adjacent to the arrow icons to
increase or decrease the selected number. Factor values of 0.001 to 10,000 can be entered. The factor value can be reset to zero by pressing the key adjacent to the 000 icon. Once the factor has been entered press the key adjacent to the tick icon to save and return to the settings menu screen. The entered value is now displayed in the settings menu adjacent to the factor icon.
If the factor is not known a standard should be measured in order to calculate the factor. If a standard is used the factor value should be set to 1.000.
---- % ppm EBC SRM mEq/l
mEq M mM µM nM U U/l
U/ml g/l mg/l µg/l ng/l g/dl
mg/dl µg/dl mg/ml µg/ml ng/ml
µg/µl ng/µl mol/l mmol/l.
00 1.00 00
000
000 1.00 00
000

48
9.2.1.8 Selecting a Wavelength
To adjust the wavelength press the key adjacent to the wavelength icon. This will open the number entry screen. Use the keys at the bottom of the screen to select the digit to be changed and the keys adjacent to the arrow icons to increase or decrease the number. Once the required wavelength has been entered press the key adjacent to the tick icon to save the changes and return to the settings menu screen.
9.2.1.9 Setting the Kinetics Measurement time
This function enables the measurement time for the kinetics scan to be set. To access this function press the key below the time displayed on the far right of the x-axis; this will open a number entry screen. Use the keys at the bottom of the screen to select the digit to be changed and use the keys adjacent to the arrow icons to increase or decrease the number. Once the required measurement time in seconds has been entered press the key adjacent to the tick icon to save and return to the settings menu.
9.3 CALiBRAtion
The calibration must be performed at the same wavelength at which the sample will be measured. Insert a cuvette containing the blank solution into the sample chamber and close the instrument lid. Press the key below the calibratetozeroabsorbance icon. The instrument will calibrate to 0.00 absorbance.
Once the calibration is complete the startkineticsmeasurementicon will be displayed and a sample can be measured. If the wavelength is adjusted before the sample is measured the start kineticsmeasurementsicon will disappear and the instrument must be calibrated again at the new wavelength.
9.4 SAMPLe MeASUReMent
Insert a cuvette containing the sample to be analysed into the sample chamber and press the key below the startkineticsmeasurements icon. If a start on level or lag time has not been set the instrument begins taking a photometric reading every second. As each reading is taken it is plotted on the graph.
If a lag time has been set a progress bar will be displayed showing the lag time counting down. Once the lag time is complete the instrument will begin taking readings.
4 00 0
0 20 0
3.000ABS
-5.000
0.00 10.005.0 s
09:02
3.000ABS
-5.000
0.00 10.005.0 s
09:02
09:02
2.500ABS
-0.500
1.000
350 550450nm
0 100

49
If a start on level has been set the Abs/%T icon is displayed in the centre of the screen. The instrument will take photometric readings until the start on level is reached. Once the absorbance/% transmittance level has been reached the readings will be plotted on the graph.
Once the measurement has commenced it can be aborted by pressing the key below the kinetics measurementinprogress icon.
Depending on how many data points have been recorded, the instrument will either return to the pre-measurement screen or display a partial scan.
Once the measurement time is reached the experiment is complete and the post measurement icons are displayed. If the automatic scaling was selected the y-axis will automatically be re-scaled.
9.5 DAtA AnALYSiS
Following the completion of the kinetics measurements the post measurement icons are displayed on the screen. These include the statistics for the kinetics experiment and the kineticsmovingline. The post measurement statistics include rate of change, start and end absorbance levels and concentration of the sample. The kinetics moving line function enables the initial and final points of the experiment to be set and the statistics for this part of the experiment to be analysed.
To access the statistics for the whole of the kinetics experiment press the key adjacent to the S icon which opens the statistics menu over the top of the expanded operating menu.
The information displayed includes concentration, absorbance per minute (rate of change), correlation coefficient (r2), start time absorbance and end time absorbance. If the operating mode selected was % transmittance then the statistics displayed will be % transmittance instead of absorbance.
In this menu the factor can be updated by pressing the key adjacent to the factor icon. The instrument calculates the factor and saves the value in the settings. Therefore the factor value calculated can be used in subsequent measurements to calculate the concentration of unknown samples.
To exit the statistics menu press the key adjacent to the tick icon.
The kinetics moving line screen can also be accessed from this menu by pressing the key adjacent to the kineticsmovingline icon. The kinetics moving line function enables the initial and final points of the kinetics experiment to be set, allowing the statistics for this part of the experiment to be analysed specifically. This function can be accessed from the statistics menu or from the expanded operating menu by pressing the key adjacent to the kineticsmovingline icon.
09:02
2.500ABS
-0.500
350 550450nm
3.000ABS
-5.000
0.00 10.005.0 s
09:02
3.000ABS
-5.000
0.00 10.005.0 s
09:02
3.000ABS
-5.000
0.00 10.005.0 s
09:02
0.000
ABS/m:
r2:
0s
10s
ppm
0.000
1.000
0.152
0.152

50
In the kinetics moving line screen the initial and final time lines appear as two vertical lines. The line which is selected is represented by a dashed line ---- and can be moved using the keys below the greaterthan (>) or lessthan (<) icons at the bottom of the screen. Move the dashed line to the point on the x-axis which is to be the initial time.
To select the final time press the key adjacent to the toggle icon. This will change the initial line from a dashed line to a solid line. The final time line will change from a solid line to a dashed line. Use the keys below the greaterthan (>) or lessthan (<) icons to move the line to the final time on the x-axis by reducing or increasing in 1 second time intervals.
The doublegreaterthan (>>) or doublelessthan (<<) icons move the line in 5 second time intervals.
Once the required initial and final times have been selected press the key adjacent to the S icon to display the statics menu for that portion of the experiment. The information displayed includes concentration, absorbance per minute (rate of change), correlation coefficient (r2), start time absorbance and end time absorbance. If the operating mode selected was % transmittance then the statistics will be % transmittance instead of absorbance. To exit the statistics menu press the key adjacent to the tick icon.
3.000ABS
-5.000
0.00 10.005.0 s
ppm
0.000
1.000
0.152
0.152
3.000ABS
-5.000
0.00 10.005.0 s
ppm
0.000
1.000
0.152
0.152
3.000ABS
-5.000
0.00 10.005.0 s
ppm
0.000
1.000
0.152
0.152
-0.005
ABS/m:
r2:
0s
10s
ppm
-0.005
0.74
0.118
0.112

51
SeCtion 10 – Saving, Printing and Autologging
The utility toolbar in the expanded operating menu provides access to printing, print setup options, opening, saving and deleting results and methods and autologging options.
If the method lock has been activated the method selection menu is disabled.
Fig10.1-ExpandedOperatingMenu
10.1 SAVinG MetHoDS
Up to 48 methods can be saved in each of the measurement modes to the internal memory of the instrument. Once the method has been saved to the internal memory the method can be saved directly to a USB memory stick and opened on another instrument.
10.1.1 SAVinG MetHoDS to inteRnAL MeMoRY
In the expanded operating menu press the key adjacent to the method icon to open the method selection menu. Select the location to save the method by pressing the key adjacent to the location. Use the keys below the arrow icons to move page up or down. Press the key below the createmethodicon to open the method naming menu.
The default method name will be displayed. To save the method under the default name press the key adjacent to the tick icon. To change the name of the method press the key below the eraser icon. One press of the key will delete one letter, holding the key for 2 seconds will delete the name completely.
To select letters use the keys adjacent to the arrow icons to move around the menu. Once the required letter is highlighted press the key below the pencil icon to select the letter. Up to eight characters can be selected. To change the letter case or to use numbers in the method name press the key below the AB icon. Repeat pressing of this key will cycle between upper case, lower case and numbers. Once the required name for the method has been entered press the key adjacent to the tick icon to save the method and return to the method selection menu.
If there is already a method saved in the chosen location confirmation will be needed to replace the existing method with the new one; press the key adjacent to the tick icon to confirm replacement. Press the key adjacent to the cross icon to cancel and return to the method naming menu. To exit the method naming menu without saving the method press the back key.
0.0000.000
400
09:02
ppm
ABS
nm
01
02
03
04
TEST 05
06
07
08
TESTA B C D E F G H I J K L M N O P Q R S T U V W X Y Z _
01: TEST
01: EXP_1 ?
Print/print settings
Results selection menu
Method selection menu
Autolog menu

52
10.1.2 SAVinG MetHoDS to USB MeMoRY StiCK
In the expanded operating menu press the key adjacent to the method icon to open the method selection menu. Select the method to save to USB memory stick by pressing the key adjacent to the method location. Use the keys below the arrow icons to move page up or down. Hold the key below the createmethod icon for 2 seconds to open the save to UBS memory stick menu.
Either the single method selected or all 48 methods can be saved to USB memory stick. To save a single method press the key adjacent to the singlemethodsaveicon. To save all 48 methods press the key adjacent to the 1-48methodsave icon. Press the key adjacent to the tick icon to confirm saving the method(s) to USB memory stick. Press the key adjacent to the cross icon to cancel saving the method(s) to USB memory stick and return to the method selection screen.
Confirmation will be needed to save the methods to USB memory stick. Press the key adjacent to the tick icon to confirm saving the method(s). Press the key adjacent to the cross icon to cancel and return to the option of saving one or all of the methods to USB memory stick.
10.2 oPeninG MetHoDS
Methods can be opened from the internal memory of the instrument or from a USB memory stick. Before a method can be opened from a USB memory stick it must be saved to the internal memory of the instrument first.
10.2.1 oPeninG MetHoDS FRoM inteRnAL MeMoRY
In the expanded operating menu press the key adjacent to the method icon to open the method selection menu and use the keys below the arrow icons to move page up or down. Select the method to open by pressing the key adjacent to the method location. Press the key below the openmethod icon.
The instrument will return to the current measurement mode and the method name will be displayed at the top of the expanded operating menu.
If a method hasn’t been selected it is still possible to calibrate the instrument and take measurements. The instrument will operate in a generic method, 0, where all the current operating settings will be stored. There are separate method 0’s for each measurement mode.
01
02
03
04
TEST 05
06
07
08
1
1-48
1
1-48 1
01
02
03
04
TEST 05
06
07
08
0.000100.0
400
09:02
ABS
%T
nm
01 TEST

53
10.2.2 oPeninG MetHoDS FRoM USB MeMoRY StiCK
In the expanded operating menu press the key adjacent to the method icon to open the method selection menu and use the keys below the arrow icons to move page up or down. Select an empty location to save the method by pressing the key adjacent to the location. Hold the key below the openmethod icon for 2 seconds.
Either a single method or all 48 methods can be opened from the USB memory stick. Select one method by pressing the key adjacent to the singlemethodopenicon. To open all methods press the key adjacent to the 1-48methodopen icon. Press the key adjacent to the tick icon to confirm selection or press the key adjacent to the cross icon to cancel and return to the method selection screen.
Confirmation will be needed to open the method(s) as any existing methods in this measurement mode will be overwritten. Press the key adjacent to the tick icon to save over the existing methods. Press the key adjacent to the cross icon to cancel and return to the option of opening one or all methods from the USB memory stick. If a single method is selected to be opened, this method will be stored in the same location that is was saved in when it was saved to the USB memory stick.
10.3 DeLetinG MetHoDS
In the expanded operating menu press the key adjacent to the method icon to open the method selection menu and use the keys adjacent to the arrow icons to move page up or down. Select the method to be deleted by pressing the key adjacent to the method location and press the key below the delete icon.
Confirmation will be needed to delete the selected method; press the key adjacent to the tick icon to confirm deletion. Press the key adjacent to the cross icon to cancel deletion and return to the method selection menu.
10.4 SAVinG ReSULtS
Results can only be saved to a USB memory stick if there is a valid USB memory stick inserted into the front of the instrument. The instruments are supplied with a USB memory stick but other types which may be used include: the PNY Attache Premium, the Emtec C250, The Kingston Data Traveler G2, the Sony Pocket Bit and the Integral Flexi.
01
02
03
04
TEST 05
06
07
08
1
1-48
01
02
03
04
TEST 05
06
07
08
01: TEST
1
11-48

54
In the expanded operating menu press the key adjacent to the USB memory stick icon to open the results selection menu.
If the USB memory stick doesn’t have any results stored on it only the savetoUSBmemorystick icon will be displayed. To save a result press the key below the saveto USB memory stick icon. This will open the results naming menu.
The default result name will be displayed. To save the result under the default name press the key adjacent to the tick icon. To change the name of the result press the key below the eraser icon. One press of the key will delete one letter, holding the key for 2 seconds will delete the name completely.
To select letters use the keys adjacent to the arrow icons to move around the menu. Once the required letter is highlighted press the key below the pencil icon to select the letter. Up to eight characters can be selected. To use numbers in the results name press the key below the AB icon. Repeat pressing of this key will cycle between upper case and numbers. Once the required name for the result has been entered press the key adjacent to the tick icon to save and return to the results selection menu.
The saved results are listed alphabetically with the date and time that the result was generated.
If there is already a result saved under the same name confirmation will be needed to replace the existing result with the new one. Press the key adjacent to the tick icon to confirm replacement. Press the key adjacent to the cross icon to cancel and return to the results naming menu.
In photometrics, concentration and quantitation once a result has been saved to the USB memory stick the USBmemorystick icon will remain highlighted. Pressing the key adjacent to the highlighted icon will result in subsequent results being saved under the same file name. To save the result with a new filename hold the key adjacent to the highlightedUSBmemorystick icon for 2 seconds. This will open the results naming screen.
10.5 oPeninG ReSULtS
Results can only be opened if a valid USB memory stick is inserted into the front of the instrument.
In the expanded operating menu press the key adjacent to the USBmemorystick icon to open the results selection menu. Select the result to be opened by pressing the key adjacent to the result. Press the key below the loadfromUSBmemorystick icon.
1/1
1.0000.099
400
09:02
ppm
ABS
nm
JW0000~0A B C D E F G H I J K L M N O P Q R S T U V W X Y Z _
1/1
SAMPLE_105/07/2010 11.11
1/1
BEER05/07/2010 11.16
SAMPLE_130/07/2010 10.02

55
The result will be displayed on the screen.
The information displayed is specific to the measurement mode which the result was generated and saved in. Use the keys below the arrow icons to display more information.
When opening a spectrum or kinetics result the result can be viewed graphically on an axis or as a text file. To view the result graphically press the key adjacent to the axis icon. To view the result as a text file press the key adjacent to the ABC icon.
10.6 DeLetinG ReSULtS
Results can only be deleted if a valid USB memory stick is inserted into the front of the instrument.
In the expanded operating menu press the key adjacent to the USBmemorystick icon to open the results selection menu. Select the result to be deleted by pressing the key adjacent to the result. Press the key below the delete icon.
Confirmation will be needed to delete the selected result; press the key adjacent to the tick icon to confirm deletion. Press the key adjacent to the cross icon to cancel and return to the results selection menu.
10.7 PRintinG
The utility toolbar in the expanded operating menu enables results to be printed and print setup options to be set. The print setup menu enables the destination of the printouts and language of the printouts to be set. Depending on the measurement mode the printouts can be customized to print off post analysis statistics.
Operating modeOperator IdMethod IdWavelengthSample intervalSample CountResults DestinationCal Time/DateID001
Photometrics20
4201
0Internal
10 : 54 : 33 05/07/2010TimeDateCell
01. 4.0. 091 10 : 54 : 40 05/07/2010
SPECTRUM05/07/2010 11.19
1/1
BEER05/07/2010 11.16
SAMPLE_130/07/2010 10.02
SAMPLE_1 ?05/07/2010 11 : 11
0.0000.000
400
09:02
ppm
ABS
nm

56
10.7.1 Print Setup
To open the print setup menu hold the key adjacent to the printer icon for 2 seconds in the expanded operating menu.
To select the language for the printouts press the key adjacent to English icon. Repeat pressing of the key cycles the language between English, Français, Deutsche, Espânôl and Italiano.
The destination of the printouts can be the internal printer or an external serial printer. The results can only be sent to an external serial printer if there is a serial printer connected to the instrument via the RS232 serial port. Press the key adjacent to the computer icon to select the external serial printer. The results can only be sent to the internal printer if there is an internal printer connected. To select the internal printer for the printout destination press the key adjacent to the printer icon.
Once the required printout destination and language has been selected press the key adjacent to thetick icon to save and return to the expanded operating menu.
10.7.1.1 Print Setup – PHotoMetRiCS AnD ConCentRAtion
In the photometrics and concentration measurement modes the print setup menu does not contain any additional post analysis statistics.
10.7.1.2 Print Setup - SPeCtRUM
In the spectrum measurement mode print setup menu it is possible to print off the spectralpointsanalysistable,peaksandvalleys data and absorbance or %T values recorded at certain dataintervals. If the data interval is set to 5 every 5th data point recorded is reported. If no data is required the data interval can be set to zero.
To select the spectral points analysis table to be printed press the key adjacent to the spectraltable icon. Repeat presses of the key will cycle between a tick and a cross icon for selected or deselected. To select the peaks and valleys data to be printed press the key adjacent to the peaksandvalleys icon. To select the data interval press the key adjacent to the datainterval icon.
0.0000.000
400
09:02
ppm
ABS
nm
English
English
English 1
English 1

57
Repeat presses will cycle between 0, 1, 2, 5, 10 or 50. Once the required options have been selected press the key adjacent to the tick icon to save and exit print-set up.
10.7.1.3 Print Setup – QUAntitAtion
In the quantitation measurement mode print setup menu it is possible to print off the statistics for the standard curve. To select the curve statistics press the key adjacent to the curvestatistics icon. Repeat presses of the key will cycle between a tick and a cross icon for selected or deselected.
Once the required options have been selected press the key adjacent to the tick icon to save and exit print-set up.
10.7.1.4 Print Setup – KinetiCS
In the kinetics measurement mode print setup menu it is possible to print off the statistics for the whole kinetics experiment and the absorbance or % transmittance values recorded at certain data intervals. If the data interval is set to 10 every 10th data point recorded is reported. If no data is required the data interval can be set to zero. To select the statistics to be printed press the key adjacent to the S icon.
Repeat presses of the key will cycle between a tick and a cross icon for selected or deselected. To select the data interval press the key adjacent to the datainterval icon. Repeat presses will cycle between 0, 1, 5, 10, 30 or 60 seconds.
Once the required options have been selected press the key adjacent to the tick icon to save and exit print-set up.
10.7.2 Printing Results
Results displayed in the expanded operating menu can be printed by pressing the key adjacent to the printer icon. Any options selected in the print setup menu will also be reported when the printer icon is pressed. Depending on the printout destination selected the result will be sent to the internal printer or to the external serial printer. If the printer icon is pressed when there is not a result on the screen the noresulttoprinteror noresulttoRS232icon (depending on results destination) will flash up on the screen.
Saved results can be printed by pressing the key below the printer icon. The printout will include the date and time the result was generated, the user ID and the measurement parameters.
English
English1
81.70.088
400
09:02
%T
ABS
nm
Operating modeOperator IdMethod IdWavelengthSample intervalSample CountResults DestinationCal Time/DateID001
Photometrics20
4201
0Internal
10 : 54 : 33 05/07/2010TimeDateCell
01. 4.0. 091 10 : 54 : 40 05/07/2010

58
10.8 AUtoLoGGinG
The autolog function enables repeat measurements of the same sample to be performed with a set time period between each measurement. This produces a batch of results for the same sample. The autolog function also enables the results to be autologged to different destinations. The autolog menu is accessed from the utility toolbar in the expanded operating menu by pressing the key adjacent to the autolog icon.
10.8.1 Setting the number of Sample Repetitions
To set the number of repeat measurements of the same sample press the key below the sample icon and use the keys adjacent to the arrow icons to increase or decrease the number of repetitions required. To reset the number to zero press and hold the key below the sample icon for 2 seconds.
Once the number of repetitions is increased above zero, if the results are autologged to a USB memory stick, the batchABC icon will be displayed. To assign a batch name for the repeated measurements press the key below thebatchABC icon to open the batch naming menu.
The default batch name will be displayed. To save the batch name under the default name press the key adjacent to the tick icon. To change the name press the key below the eraser icon. One press of the key will delete one letter, holding the key for 2 seconds will delete the name completely. To select letters use the keys adjacent to the arrow icons to move around the menu.
Once the required letter is highlighted press the key below the pencil icon to select the letter. Up to eight characters can be selected. To use numbers in the batch name press the key below the AB icon. Repeat pressing of this key will cycle between upper case and numbers. Once the required name for the batch has been entered press the key adjacent to the tick icon to save and return to the autolog menu.
To set the time period between each measurement press the key below the timer icon and use the keys adjacent to the arrow icons to increase or decrease the time in 1 second intervals. To reset the time to one second press and hold the key below the timer icon for 2 seconds.
Once the required number of repetitions and time period has been selected press the key adjacent to the tick icon to save the changes and return to the expanded operating menu.
0.0000.000
400
09:02
ppm
ABS
nm
0000 001s
ExpandedOperatingMenu
0000 001s
JW0000-0 1
2
3
4
5
JW0000~0A B C D E F G H I J K L M N O P Q R S T U V W X Y Z _
0005 010sX

The number of repetitions and time interval will be displayed below the autolog icon. To commence autologging press the key below the measuresample icon. Once the first measurement has been performed the time period starts counting down until it reaches zero and then the next measurement will be taken. This will reduce the repetition number by one. When the number of repetitions reaches zero autologging is complete.
Autologging can be stopped before all the measurements have been completed by pressing the key adjacent to the autolog icon. Confirmation will be needed to stop autologging. Press the key adjacent to the tick icon to confirm stopping autologging or press the key adjacent to the cross icon to continue autologging. If autologging is stopped before completion the measurements already recorded will be saved under the previously entered batch name.
Once a set of results has been autologged to the USB memory stick when the measure sample key is pressed again the batch append/delete screen is displayed. Pressing the key adjacent to the batch append icon enables the next set of results to be added to the existing batch of results. Pressing the key adjacent to the batchdelete icon will delete the first set of results and replace them with the results that are going to be recorded. Press the key adjacent to the tick icon to confirm selection. Press the key adjacent to the cross icon to cancel and return to the expanded operating menu.
10.8.2 Selecting Result’s Destination
The autolog menu enables the result’s destination to be set. To select the internal printer press the key adjacent to the printer icon. This option is only available if an internal printer is connected. To select the USB memory stick as the result’s destination press the key adjacent to the USB memory stick icon. This option is only available if a valid USB memory stick is connected to the instrument. To send the results to an external instrument such as a PC or a serial printer press the key adjacent to the computer icon.
10.9 ConneCtinG to A PC
Connect the interface cable to the RS232 serial port on the rear of the instrument and connect to the serial port on the rear of the PC. Turn the PC on and load the PC software by inserting the PC software disc into the CD drive. If the PC software does not auto run open My Computer and double click on the Jenway 73 series software icon. Follow the instructions to install the PC software to the required location. Refer to the PC software manual for further instructions. Once the software is installed, turn the mains power on to the instrument.
The PC software is pre-configured to run using the following settings:
9600 baud
8 data bits
no parity
1 stop bit
59
0.000100.0
400
09:02
0002x003s
ABS
%T
nm
JW0000-5
JW0000-5
0005 010sX

60
SeCtion 11 – Accessories and Spare Parts
11.1 oPtionAL ACCeSSoRieS
Part Code Description of Accessory
660 101 Internal printer
735 401 Automatic 8 cell turret
735 201 Sipper pump
735 301 Peltier
735 701 Combined sipper peltier pump
735 801 10x10mm path length cuvette holder
735 901 16/24mm test tube holder
736 001 10 x 100mm path length cuvette holder
736 101 10x10 (70µl cell holder)
736 201 Water heated 10x10 single cell holder
735 601 Boiling tube holder
035 088 Visible calibration set
035 091 UV/Visible calibration set
060 422 Moulded cuvette rack for 16 10x10mm cuvettes
735 001 Dust cover
019 146 2GB USB memory sticks for external memory
037 551 RS232 to USB converter for use with computer without a serial port
11.2 ConneCtinG tHe ACCeSSoRieS
There are two types of accessories which can be fitted in the sample chamber – passive or active accessories. The range of passive accessories includes 10 x 10mm single cuvette holders, single water heated cuvette holders, adjustable path length (10 to 100 mm) cuvette holders, test tube holders, boiling tube holders, film holders and micro-cuvette holders. The range of active accessories includes an automated 8 cell changer, sipper pump, peltier and combined peltier sipper pump. The instrument must be turned off before any accessories are fitted.
11.2.1 inteRnAL PRinteR
Use a small screw driver to lift the blanking panel on the top of the instrument. Squeeze the two clips in order to remove the blanking panel. Disconnect the printer wires which are secured to the underside of the blanking plate.
Unpack the printer from the packaging. Turn the printer upside down and connect the printer wires by clipping into the connector on the printer.
Clips

61
Squeeze the grey plastic clips together so that the printer top opens. Slot the printer into the top of the instrument and push down until it fits flush to all four sides.
Insert the paper roll into the printer – ensuring that there is some paper sticking out of the printer before clicking the grey plastic back into place. Switch the instrument on. The power and error lights on the printer will flash. Once the instrument power on tests are complete press the feed button to check that the paper is fed correctly.
11.2.2 PASSiVe ACCeSSoRieS
Unscrew the thumb screw to undo the passive accessory. Lift out the passive accessory. To fit a different passive accessory simply place the accessory in the correct orientation, align the thumb screw and tighten to fix in place.
To replace the passive accessory with an active accessory refer to section 11.2.3.
11.2.3 ACtiVe ACCeSSoRieS
Unscrew the thumb screw to undo the passive accessory. Lift out the passive accessory. To fit an active accessory unscrew screws 1 to 4 and lift out the metal base plate.
This will expose the bottom of the sample chamber with the power supply connection needed to operate the active accessories.
2.
4.
1.
3.
Thumb screw
Thumb screw

11.2.3.1 Automatic 8 cell turret
Take the 8 cell turret base plate. Connect the power supply in the bottom of the sample chamber to the connector on the underside of the baseplate. Place the base plate in the sample chamber. Replace screws 1 to 4.
Take the 8 cell carousel and place on top of the motor, taking care to align the three ball bearings with the grooves on the motor shaft. Gently push the carousel down onto the motor shaft until it is located into place. Gently rotate the carousel until there is some resistance. The carousel is now in the correct position.
If the fitting is too tight use a small screw driver to loosen the ball bearings before pushing the carousel down onto the shaft.
11.2.3.2 Peltier
For this accessory as well as removing the passive accessory base plate, the front panel of the instrument must also be removed. Loosen screws 5 and 6 until the front panel can be lifted out in the forwards direction.
Take the peltier base plate. Connect the power supply in the bottom of the sample chamber to the connector on the underside of the base plate. Place the base plate in the sample chamber. Replace screws 1 to 4. Take the peltier front panel and slot into place before retightening screws 5 and 6.
When the accessory is fitted the instrument will look like this.
62
5.
6.

63
11.2.3.3 Sipper pump
For this accessory as well as removing the passive accessory base plate, the front panel of the instrument must also be removed. Loosen screws 5 and 6 until the front panel can be lifted out in a forward direction.
Take the sipper base plate. Connect the power supply in the bottom of the sample chamber to the connector on the underside of the base plate. Place the base plate in the sample chamber. Replace screws 1 to 4. Take the sipper front panel and slot into place before re-tightening screws 5 and 6.
The tubing should be connected depending on the function that the sipper pump is going to perform. All tubing must be kept as short as possible and the tubing must not be allowed to obstruct the ligth path.
For sipping:
1. Connect the sipper pump tubing to the outlet port on the flow-through cuvette.
2. Secure the tubing using the clip on the righthand side of the pump head.
3. Ease the tubing round the rollers by carefully rotating them clockwise, by hand. Clamp the tubing into the clip on the left hand side of the motor.
4. Once secured, ensure the tubing is routed into the two retaining clips located on the base plate at the side of the pump head.
5. Cut the tubing at the point where it fits comfortably onto the left hand tube located on the inside of the front bulk head.
6. Connect a suitable length of this tubing to the external waste pipe.
Bi directional flow A (sipping)
Continuous flow
1.7.
3.
4.
9.
6.
5.8.
2.
Bi directional flow B (pumping)
5.
6.

64
7. Cut a small length of the sipper pump tube and push this over one end of the capillary tube. Connect this to the inlet port of the flow-through cuvette.
8. Route the tube into the two retaining clips located on the base plate at the side of the pump head.
9. Fit the sipper probe and secure using the thumbscrew. Feed the capillary tubing through the tube and up through the sipper probe, allowing sufficient length for it to pass into a suitable receptacle.
For pumping:
1. Cut two pieces of sipper pump tubing approximately 300mm in length. Take one length of tubing and fit this to the pump head, as shown, securing the tubing using the clip on the right hand side of the pump head.
2. Ease the tubing round the rollers carefully rotating them clockwise, by hand. Clamp the tubing into the clip on the left hand side of the motor.
3. Fit the other end onto the inlet port on the flow-through cuvette.
4. Fit the second 300mm length of tubing to the outlet port of the flow-through cuvette. Once secured, ensure the tubing is routed into the two retaining clips located on the base plate at the side of the pump head.
5. Fit the other end of the tubing onto the outlet port, located on the inside of the front bulkhead.
6. Connect a suitable length of sipper pump tubing to the external outlet port.
7. Insert one end of the capillary tube into the sipper pump tubing, as shown.
8. Feed the other end through the inlet port located on the inside of the bulkhead.
9. Fit the sipper probe and secure using the thumbscrew.
10. Carefully feed the tubing through the sipper probe, allowing sufficient length for it to pass into a suitable receptacle.
When the sipper accessory has been fitted and the tubing has been connected the instrument will look like this.
11.2.3.4 Combined sipper peltier pump Refer to section 11.2.3.3 for more details.
1.
7.
3.
4.
9.
10.
6. 5. 8. 2.

65
11.3 USinG tHe ACCeSSoRieS
11.3.1 Automatic 8 cell turret
When the automatic 8 cell turret is in use the 8cellturreticon is displayed in the bottom right hand corner of the screen. The current cell position is displayed adjacent to the 8 cell turret icon. The 0 position should always be used for the zero calibration sample.
To perform measurements using the automatic 8 cell turret, insert the cuvettes containing the samples into turret positions 1 to 7. Insert the cuvette containing the blank solution into turret position 0. Enter the required measurement mode and set up the required measurement parameters. Press the key below the calibratetozero icon. The instrument will automatically move the turret around to position zero to perform the measurement. Once the calibration is complete the measuresample icon will appear and the turret will return to its original starting position.
Press the key below the 8 cell turret icon to highlight the icon and the two arrow icons above. Press the keys adjacent to the arrow icons to increase or decrease the current cell position of the turret, until the required sample position has been selected. Press the key below the measuresample icon. The instrument will perform a reading and display the result on the screen.
To measure the next sample select the next turret position and press the key below the measuresampleicon. Repeat this process until all the samples have been measured. To adjust the wavelength press the key below the 8cellturret icon and use the arrow icons to adjust the wavelength.
11.3.1.1 Automatic 8 cell turret - supporting creation of a standard curve in quantitation
The 8 cell turret can be used to support creation of a new standard curve in the quantitation measurement mode. Refer to section 8.2.3.1 for more details.
When the standard measurement screen is open the 8 cell turret icon will be displayed in the bottom left hand corner of the screen. The current cell position is displayed adjacent to the 8 cell turret icon. The 0 position should always be used for the zero calibration sample.
To measure the standards using the automatic 8 cell turret, insert the cuvettes containing the standards into turret, insert the cuvettes containing the standards into turret positions 1 to 6 (depending on how many standards needed). Insert the cuvette containing the blank solution into turret position 0. Press the key adjacent to the tick icon to perform an initial calibration to zero absorbance.
Use the keys adjacent to the arrow icons to increase the turret position, until the required standard position has been selected. Press the key adjacent to the tick icon to measure the standard. The standard concentration and photometric value will then be displayed. The standard can be re-measured by pressing the key adjacent to the back icon.
To measure the next standard select the next turret position and press the key adjacent to tick icon. Repeat this process until all the standards have been measured.
0.0000.000
500
09:02 0
ppm
ABS
nm
0.0000.000
500
09:02 0
ppm
ABS
nm
0.000 ABS
0

11.3.2 Peltier
When the peltier is in use the peltier icon is displayed in the bottom right hand corner of the screen. The current temperature is displayed above the set point temperature adjacent to the peltier icon. Below the peltier icon there is an arrow icon to indicate if the current temperature is below or above the set temperature. To adjust the set point temperature hold the key below the peltier icon for 2 seconds.
This opens the peltier settings screen. Use the keys at the bottom of the screen to select the digit to be changed and use the keys adjacent to the arrow icons to increase or decrease the number. The temperature can be set in °C or °F by pressing the key adjacent to the °C icon. Repeat presses will cycle between °C and °F.
Once the required temperature has been selected press the key adjacent to the tick icon to save and return to the expanded operating menu. The peltier will begin to heat or cool depending on the current temperature.
11.3.3 Sipper pump
When the sipper is in use the sipper pump icon is displayed in the bottom right hand corner of the screen. The pump direction is displayed by an arrow icon below the sipper pump icon. The sipper pump can operate in manual or timed mode, depending on the option selected in sipper pump settings. To open the sipper pump settings hold the key below the sipperpump icon for 2 seconds.
11.3.3.1 MAnUAL SiPPeR PUMP SettinGS
To operate the sipper pump in manual mode press the key adjacent to the manualsipper icon. Select the preferred pump direction by pressing the key below the forwards or backwards arrow icon. Press the key adjacent to the tick icon to save and return to the expanded operating menu.
To perform a measurement place the sipper tubing into the sample and press the key below the sipperpumpicon.
66
.80 06ºF
0.000100.0
400
09:02
ABS
%T
nm
0.000100.0
400
09:02
ABS
%T
nm
19.9
-> 120.5
.02 0ºC
0.000100.0
400
09:02
ABS
%T
nm

67
Confirmation will be needed to start the sipper pump. Press the key adjacent to the tick icon to confirm and start the sipper pump. Press the key adjacent to the cross icon to cancel and return to the expanded operating menu.
To stop the sipper pump press the key adjacent to the stop icon. Ensure that the flow through cuvette contains enough sample before pressing the key below the measuresample icon.
11.3.3.2 tiMeD SiPPeR PUMP SettinGS
To operate the sipper pump in timed mode press the key adjacent to the timedsipperpump icon.
Press the key below the calibrate timed sipper icon. Select the required pump direction by pressing the key below the forwards or backwards arrow icon. Press the key adjacent to the tick icon to continue to the next stage of the calibration sequence.
Insert the inlet tubing into the sample container and press the key adjacent to the single greater thanicon. The sipper pump will start and the sample will be pumped through the tubing to the flow through cuvette. It is possible to skip this setup stage by pressing the key adjacent to the doublegreaterthanicon.
Once the cuvette is full press the key adjacent to the stop icon to stop the sipper pump. The time taken for sample uptake is recorded.
0.000100.0
400
09:02
ABS
%T
nm
0.000100.0
400
09:02
ABS
%T
nm

68
To fine tune the amount of sample uptake press the key below the plus or minus icon to increase or decrease the amount of sample taken up. The recorded time will be adjusted accordingly. Once the fine tuning is complete, or if none is required, press the key adjacent to the tick icon to move to the next stage of the calibration sequence.
This stage allows an air gap to be added to the calibration sequence. If an air gap is not required press the key below the 000 icon to set the air gap to zero. If a previously programmed air gap is to be used press the key adjacent to the doublegreaterthanicon to skip this stage and retain the current air gap time.
To program an air gap remove the inlet tubing from the sample container and press the key adjacent to the singlegreaterthanicon. The sipper pump will start and air will be pumped through the tubing to the flow through cell.
Once the required amount of air has been taken up press the key adjacent to the stop icon. The time taken for air uptake is recorded.
To fine tune the amount of air uptake press the keys below the plus or minus icons to increase or decrease the amount of air taken in. The recorded time will be adjusted accordingly. Once the fine tuning is complete, or if none is required, press the key adjacent to the tick icon to move to the next stage of the calibration sequence.
Once the sample uptake and air gap have been programmed the preferred disposal of the sample can be set. There are two options, the sample can either be sent back to the sample container or it can be sent to the waste pipe. Press the key below the forward or backward arrows to select what happens to the sample after measurement.
If the original pump direction selected was forwards, selecting the forwards direction at this stage will send the sample to waste and selecting the backwards direction will send the sample back to the sample container. Once the required direction has been selected press the key adjacent to the tick icon to save the calibration sequence and return to the expanded operating menu. To exit the sipper calibration sequence without saving any changes press the back key at any point during the calibration sequence.
000

69
To perform a measurement place the sipper tubing into the sample and press the key below the sipperpump icon.
Confirmation will be needed to start the sipper pump. Press the key adjacent to the cross icon to cancel and return to the expanded operating menu. Press the key adjacent to the tick icon to confirm and start the sipper pump. The pump will run for the previously recorded sample take up time. Ensure that the flow through cuvette contains enough sample before pressing the key below the measuresampleicon.
Once the measurement has been performed remove the tubing from the sample and press the key below the sipperpump icon to perform the next stage of the calibration sequence.
Confirmation will be needed to start the sipper pump. Press the key adjacent to the cross icon to cancel and return to the expanded operating menu. Press the key adjacent to the tick icon to confirm and start the sipper pump. The pump will run for the previously recorded air gap take up time.
If an air gap of zero was previously selected this screen will not appear and the calibration sequence will continue to sample disposal.
Once this stage of the calibration sequence is complete press the key below the sipperpump icon to dispose of the sample. Confirmation will be needed to start the sipper pump. Press the key adjacent to the cross icon to cancel and return to the expanded operating menu. Press the key adjacent to the tick icon to confirm and start the sipper pump. Depending on the disposal route previously selected the sample will either go to drain or back to the sample container.
11.3.4 Combined sipper peltier pump
When the combined sipper peltier is in use the sipperpeltier icon is displayed in the bottom right hand corner of the screen. The current temperature is displayed above the set point temperature adjacent to the sipper peltier icon. Adjacent to the peltier icon is an arrow to indicate if the current temperature is below or above the set temperature.
0.000100.0
400
09:02
ABS
%T
nm
0.000100.0
400
09:02
ABS
%T
nm
0.000100.0
400
09:02
ABS
%T
nm
0.000100.0
400
09:02
ABS
%T
nm
0.000100.0
400
09:02
ABS
%T
nm
20.0-20.0
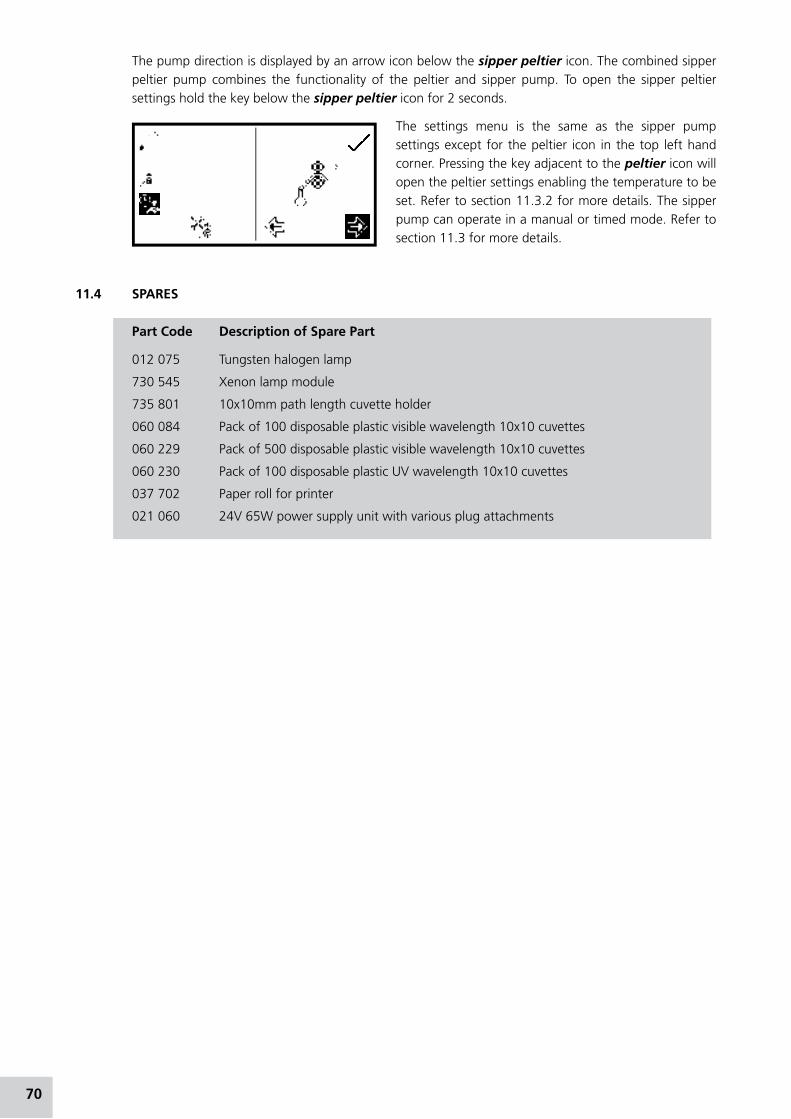
The pump direction is displayed by an arrow icon below the sipperpeltiericon. The combined sipper peltier pump combines the functionality of the peltier and sipper pump. To open the sipper peltier settings hold the key below the sipperpeltier icon for 2 seconds.
The settings menu is the same as the sipper pump settings except for the peltier icon in the top left hand corner. Pressing the key adjacent to the peltier icon will open the peltier settings enabling the temperature to be set. Refer to section 11.3.2 for more details. The sipper pump can operate in a manual or timed mode. Refer to section 11.3 for more details.
11.4 SPAReS
Part Code Description of Spare Part
012 075 Tungsten halogen lamp
730 545 Xenon lamp module
735 801 10x10mm path length cuvette holder
060 084 Pack of 100 disposable plastic visible wavelength 10x10 cuvettes
060 229 Pack of 500 disposable plastic visible wavelength 10x10 cuvettes
060 230 Pack of 100 disposable plastic UV wavelength 10x10 cuvettes
037 702 Paper roll for printer
021 060 24V 65W power supply unit with various plug attachments
70

SeCtion 12 – Maintenance and Service
12.1 RoUtine MAintenAnCe
Ensure the external surfaces of the unit are clean and free from dust. The sample area should always be kept clean and any accidental spillage should be wiped away immediately. To give added protection when not in use, the unit should be disconnected from the mains supply and covered with the optional dust cover.
The only routine maintenance which maybe required is the replacement of the light source. The replacement lamps are available from your local distributor (refer to section 11.4 for spare part codes). Only genuine replacement lamps should be used. Similar lamps may have different filament configurations or be wavelength restricted for domestic or commercial use and will give errors if used.
12.2 LAMP RePLACeMent
12.2.1 tungsten Halogen Lamp Replacement
This option is only valid for 7310 spectrophotometers.
Before replacing the lamp disconnect the unit from the mains supply and ensure the lamp is cool before handling. Access to the tungsten halogen lamp can be gained via the lamp access panel located on the rear of the instrument (refer to section 2.5).
1. Remove the screws holding the lamp access panel in place.
2. Withdraw the lamp access panel and unscrew the lamp bracket fixing screw.
3. Grasp and rotate the lamp bracket to gain access to the lamp.
4. Remove the old lamp from the holder. The lamp is a plug-in fit and should be removed by gently easing it from the holder.
5. Carefully remove the replacement lamp from the packaging. Ensure that the glass portion of the lamp is not touched as finger marks will damage the lamp resulting in a reduced performance. If accidental damage occurs the surface of the lamp may be cleaned using propan-2-ol.
6. Insert the lamp into the holder, ensuring it is fully pushed home.
7. Rotate the lamp bracket and put back into operational position. Replace the lamp bracket fixing screw and tighten.
8. Replace the lamp access panel and fix in place with the two screws.
9. Reconnect the power supply, turn on the unit and ensure that the lamp is illuminated after a few seconds.
For further instructions refer to the service manual.
12.2.2 Xenon Lamp Module Replacement
This option is only valid for the 7315 spectrophotometers and must be done by an accredited service engineer. Refer to section 12.3 for more details.
71

12.3 SeRViCe
Our dedicated service staff are on hand to help in the unlikely event that your Jenway equipment develops a fault. Please contact them by one of the following means with a clear description of the problem:
e-mail: [email protected]
tel: +44 (0) 1785 810475
Fax: +44 (0) 1785 810471
On occasion it may be necessary for your equipment to be sent back to our Service Department for repair. In this case please contact the Service Department for a reference number which you should include with your faulty equipment. Please also ensure you include a clear description of the fault and a completed copy of our Decontamination Certificate. This is available as a downloadable pdf file at www.jenway.com, or contact us and we will be happy to fax you a copy. Please clearly mark the package for the attention of the Service Department and post to the following address:
Bibby Scientific Ltd
Beacon Road
Stone
Staffordshire
St15 0SA
United Kingdom
All replacement parts are guaranteed for 1 year and where ever possible, returned equipment is turned around in 5 working days.
72
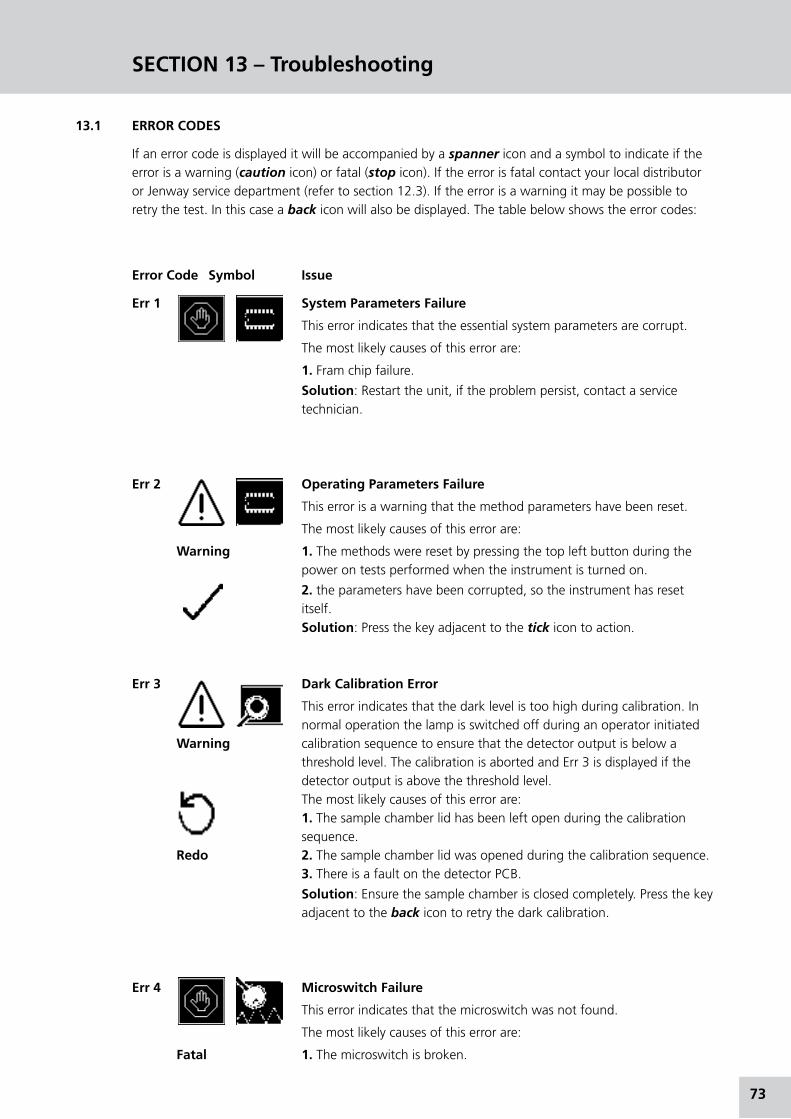
SeCtion 13 – troubleshooting
13.1 eRRoR CoDeS
If an error code is displayed it will be accompanied by a spanner icon and a symbol to indicate if the error is a warning (caution icon) or fatal (stop icon). If the error is fatal contact your local distributor or Jenway service department (refer to section 12.3). If the error is a warning it may be possible to retry the test. In this case a back icon will also be displayed. The table below shows the error codes:
error Code Symbol issue
err 1 System Parameters Failure
This error indicates that the essential system parameters are corrupt.
The most likely causes of this error are:
1. Fram chip failure.
Solution: Restart the unit, if the problem persist, contact a service technician.
err 2 operating Parameters Failure
This error is a warning that the method parameters have been reset.
The most likely causes of this error are:
Warning 1. The methods were reset by pressing the top left button during the power on tests performed when the instrument is turned on.
2. the parameters have been corrupted, so the instrument has reset itself.
Solution: Press the key adjacent to the tick icon to action.
err 3 Dark Calibration error
This error indicates that the dark level is too high during calibration. In normal operation the lamp is switched off during an operator initiated Warning calibration sequence to ensure that the detector output is below a threshold level. The calibration is aborted and Err 3 is displayed if the detector output is above the threshold level. The most likely causes of this error are: 1. The sample chamber lid has been left open during the calibration sequence. Redo 2. The sample chamber lid was opened during the calibration sequence. 3. There is a fault on the detector PCB.
Solution: Ensure the sample chamber is closed completely. Press the key adjacent to the back icon to retry the dark calibration.
err 4 Microswitch Failure
This error indicates that the microswitch was not found.
The most likely causes of this error are:
Fatal 1. The microswitch is broken.
73

err 5 Light Saturation not Found
This error indicates that the peak light hasn’t been found at zero.
The most likely causes of this error are:
Fatal 1. Lamp failure.
2. Deterioating lamp signal.
3. Sample or cuvette in the sample holder.
Solution: Ensure that the sample holder is empty. Restart the unit, if the problem persists contact a service technican.
err 7 USB Module Failure
This error indicates the instrument is unable to detect a response from the UBS module.
Warning The most likely causes of this error are:
1. USB port failure.
Solution: press the key adjacent to the tick icon to carry on using the instrument. Restart the unit, if the problem persists contact a service technician.
err 8 Unable to find Vane on turret
This error indicates that the vane position zero on the turret cannot
be found.
Warning The most likely causes for this error are:
1. The turret carousel has been removed and not replaced.
Redo
Solution: Check if the turret is in the sample chamber and inserted properly. Press the key adjacent to the back icon to try rechecking.
err 9 over temperature
This error indicates that the thermal switch has cut out.
The most likely causes for this error are:
Fatal 1. Failure of the fan
2. Thermal switch not connected.
Solution: restart the unit, if the problem persists contact a service technician.
74

13.2 tRoUBLeSHootinG GUiDe
issue Solution
Unable to achieve zero Ensure that there is not a sample in the sample chamber.absorbance or 100% Ensure the instrument lid is closed before and during the calibration.transmittance when Ensure the lamp is working – if the lamp has failed replace the lamp calibrating (7310) or lamp module (7315).
Unable to achieve a reading Ensure the correct cuvette is being used so that light isn’t being when measuring a sample absorbed by the cuvette. Ensure the sample isn’t too dense that light is not transmitted through the sample. Ensure the lamp is working.
Unable to add additional The table can only hold 6 points. Delete one or more points before points to the spectral selecting additional points to add to the table.points analysis table
Unable to print results using Ensure internal printer selected in autolog menu.the internal printer Ensure there is paper in the unit. Ensure there is a result displayed on screen.
Unable to save results to Ensure the USB stick is inserted into the front of the unitthe USB memory stick Ensure the USB memory stick has free capacity Ensure there is a result displayed on the screen.
Unable to continue kinetics Due to the nature of the kinetics measurements stopping themeasurement after measurement before completion will result in some measurementcancelling abort action time being lost. Therefore the experiment cannot be continued. It must be restarted.
The peaks and valleys table The peaks and valleys threshold is turned off. Change this value to 1%,icon is not displayed 5% or 10% and the peaks and valleys table icon will be displayed. following a spectrum scan The measure sample icon A calibration must be performed at the new wavelength. When thedisappears after changing calibration is complete the measure sample icon will be displayed. the wavelength Unable to save methods Ensure the method lock is not active.
13.3 technical Support
Jenway have a dedicated Technical Support team made up of experienced scientists who are on hand to help with any applications advice and questions you may have about our products and how to use them. If you require any technical or application assistance please contact the team at:
e-mail: [email protected].
Phone: +44 (0)1785 810433
Fax: +44 (0)1785 810405
75

SeCtion 14 – Declaration of Conformity
76

SeCtion 14 – Declaration of Conformity
77

SeCtion 15 – Glossary of icons
Mode icon Description
Common Back key
Common Tick icon - Done/yes
Common Cross icon – Cancel/no
Common JW icon - Opens expanded operating menu
Common Printer icon - Print/open printer settings
Common No results to send to printer
Common Computer icon - RS232 serial port for connection to an external serial
printer or a computer
Common No results to send to RS232
Common English English icon - Language selection
Common USB memory stick
Common Save to USB memory stick
Common Load from USB memory stick
Common Result already saved to USB memory stick
Common 1 Single method save icon
Common 1-48 1 – 48 method save icon
Common 1 Single method open icon
Common 1-48 1 – 48 method open icon
Common Axis icon – View the result graphically
Common ABC icon – View the results as a text file
Common Arrow icon - Results page down, move left, decrease
Common Arrow icon - Results page up, move right, increase
Common Arrow icon – Move up, increase
Common Arrow icon – Move down, decrease
78

Common Calibrate to zero icon
Common Pencil icon - Select letter/number
Common Eraser icon - Delete letter/number
Common AB icon - Change letter case/number
Common Delete
Common Method icon – opens method selection screen
Common Create method
Common Open method
Common - - - - Units icon – opens unit selection screen
Common Resolution
Common 400nm Wavelength
Common ABS/%T Abs/%T icon - Operating mode either absorbance or % transmittance
Common Lamp cold
Common Lamp save
Common Caution icon – accompanied by error code
Common Check number
Common Stop icon – accompanied by error code
Main Menu Opens concentration measurement mode
Main Menu Opens kinetics measurement mode
Main Menu Opens photometrics measurement mode
Main Menu Opens quantitation measurement mode
Main Menu Opens spectrum measurement mode
79

Main Menu Instrument settings
Main Menu 12.00 Time/date icon
Time & Date Clock icon - Set time
Time & Date Calendar icon - Set date
Time & Date Toggle icon – Switches date format
Autolog Autolog icon - Opens autolog menu
Autolog Printer icon - Autolog to printer
Autolog USB icon - Autolog to USB memory stick
Autolog Computer icon - Autolog to computer or external serial printer through
RS232 serial port
Autolog Sample icon - Number of sample measurement repetitions
Autolog Timer icon - Time interval between each sample measurement repetition
Autolog Batch ABC icon - Set batch name for repeated measurements
Autolog Batch append – add existing results
Autolog Batch delete – overwrite existing results
Instrument Closed padlock icon - Settings lockedSettings
Instrument Open padlock icon – Settings unlockedSettings
Instrument Methods unlocked – method selection menu enabledSettings
Instrument Methods locked – method selection menu disabledSettings
Instrument Security codeSettings
Instrument Mode selectionSettings
Instrument Mode shown Settings
Instrument Mode not shown Settings
Instrument User IDSettings
Instrument ContrastSettings
Instrument Lamp saveSettings
80

Instrument DiagnosticsSettings
Photometrics Measure sample
Photometrics Toggle icon – switches between ABS/%T
Concentration Settings menu
Concentration Measure to a factor
Concentration Measure to a standard
Concentration 0.000 ABS Calibrate to zero absorbance
Concentration 0.000 Calibrate to a standard
Concentration Calibrate to zero absorbance or standard
Concentration Factor menu
Concentration Standard menu
Concentration 000 Resets standard or factor value to zero
Concentration Check standard
Spectrum Scan settings menu
Spectrum Hand icon – Manual y-axis scaling
Spectrum Hand icon with cross through it - Auto y-axis scaling
Spectrum Scan interval
Spectrum Baseline scan
Spectrum Baseline scan in progress
Spectrum Scan sample
Spectrum Sample scan in progress
Spectrum Peaks and valleys threshold turned off
Spectrum Peaks and valleys above threshold 5% are shown
Spectrum Peaks and valleys table
Spectrum Show peaks only
Spectrum Show valleys only
Spectrum Spectral points analysis
Spectrum Double less than icon- decrease the wavelength by 10 times scan interval
81

Spectrum Single less than icon - decrease the wavelength by 1 times scan interval
Spectrum Double greater than icon - increase the wavelength by 10 times scan interval
Spectrum Single greater than icon - increase the wavelength by 1 times scan interval
Spectrum Wavelength icon - manually enter the wavelength
Spectrum Add points to the spectral points analysis table
Spectrum View spectral points analysis table
Spectrum Data point interval – used in print setup
Quantitation Measure sample
Quantitation Quantitation table – Opens quantitation table
Quantitation Number of standards
Quantitation View standard curve
Quantitation Curve fit – enables the curve fit to be adjusted
Quantitation Sigma icon – Displays curve statistics
Quantitation Create new standard curve
Quantitation Tick icon - Read Standard
Quantitation Back icon – Re-measure previous standard
Quantitation Cross icon – Cancel creation of new standard curve
Quantitation Curve statistics – used in print setup
Kinetics Settings menu
Kinetics Hand icon – Manual y-axis scaling
Kinetics Hand icon with cross through it - Auto y-axis scaling
Kinetics 0000s
Start time pause – Opens lag time/start on level menu
Kinetics 000 000 - Resets lag time, standard or factor values to zero
Kinetics Clock icon - Set the lag time
Kinetics ABS/%T icon - Set the start on level
Kinetics Greater than - Start above
Kinetics Less than - Start below
Kinetics No start on level set
82
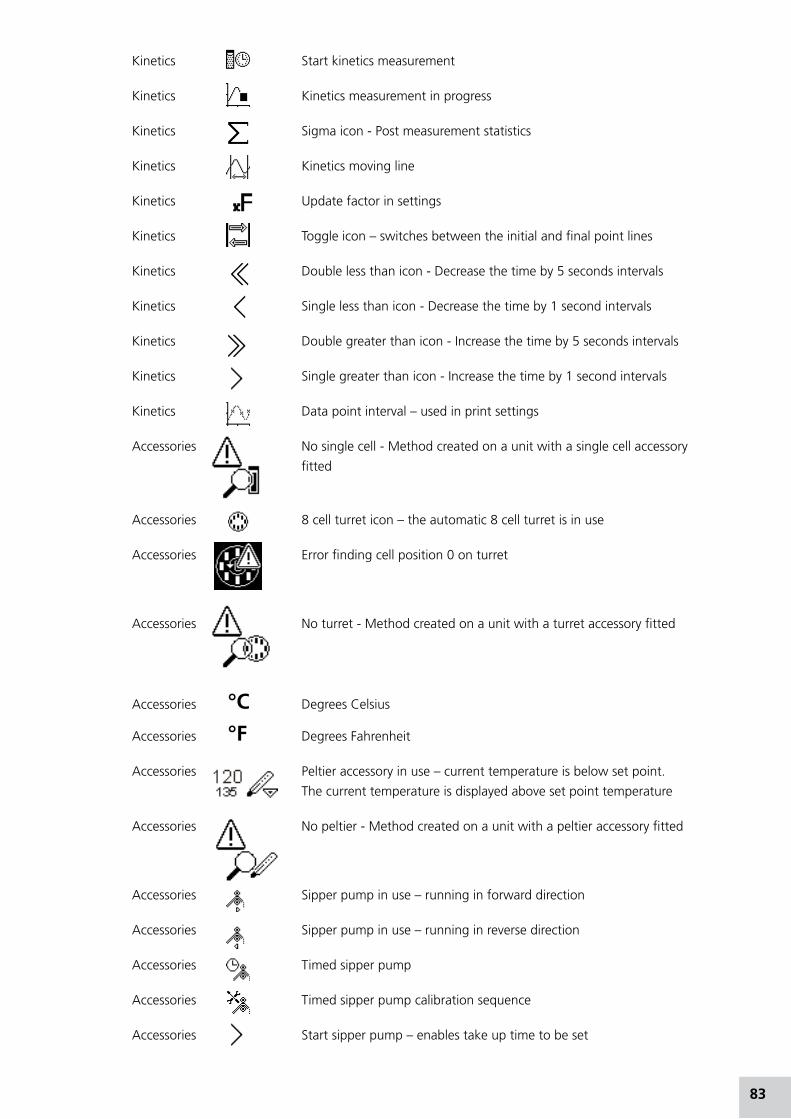
Kinetics Start kinetics measurement
Kinetics Kinetics measurement in progress
Kinetics Sigma icon - Post measurement statistics
Kinetics Kinetics moving line
Kinetics Update factor in settings
Kinetics Toggle icon – switches between the initial and final point lines
Kinetics Double less than icon - Decrease the time by 5 seconds intervals
Kinetics Single less than icon - Decrease the time by 1 second intervals
Kinetics Double greater than icon - Increase the time by 5 seconds intervals
Kinetics Single greater than icon - Increase the time by 1 second intervals
Kinetics Data point interval – used in print settings
Accessories No single cell - Method created on a unit with a single cell accessory
fitted
Accessories 8 cell turret icon – the automatic 8 cell turret is in use
Accessories Error finding cell position 0 on turret
Accessories No turret - Method created on a unit with a turret accessory fitted
Accessories °C Degrees Celsius
Accessories °F Degrees Fahrenheit
Accessories Peltier accessory in use – current temperature is below set point.
The current temperature is displayed above set point temperature
Accessories No peltier - Method created on a unit with a peltier accessory fitted
Accessories Sipper pump in use – running in forward direction
Accessories Sipper pump in use – running in reverse direction
Accessories Timed sipper pump
Accessories Timed sipper pump calibration sequence
Accessories Start sipper pump – enables take up time to be set
83

Accessories Skip take up time – uses the previously set take up time
Accessories 000 000 – sets air gap to zero
Accessories Stop sipper pump
Accessories Reduce sample uptake/reduce air gap
Accessories Increase sample uptake/increase air gap
Accessories No sipper - Method created on a unit with a sipper accessory fitted
Accessories Sipper peltier pump in use
Accessories No sipper peltier - Method created on a unit with a sipper peltier
accessory fitted
Accessories PC comms - shown when the instrument is connected to a PC and communicating via the PC software
Error Spanner - Refer to section 13
84

inDeX Page
ACCESSORIES 60Accessories - connecting 60Accessories - using 65AUTOLOGGING 58CONCENTRATION 27 CALIBRATION 29 METHOD SETUP 27 MODE SPECIFIC PARAMETERS 27 SAMPLE MEASUREMENT 30Connecting to a PC 59Controls Display 13 Keypad 13 Rear panel 15Declaration of conformity 76Error codes 73Good practice guidelines 17ICON GLOSSARY 78Installation 12 Unpacking 12Instrument setup 19 Contrast 23 Expanded operating menu 19 GLP settings 22 Lamp save 23 Mode selection 22 Navigating 19 Utility toolbar 20KINETICS 44 CALIBRATION 48 DATA ANALYSIS 49 METHOD SET UP 45 MODE SPECIFIC PARAMETERS 44 SAMPLE MEASUREMENT 48Lamp replacement Tungsten halogen lamp replacement 71 Xenon lamp module replacement 71Language 56PHOTOMETRICS 25 CALIBRATION 26 METHOD SET UP 27 MODE SPECIFIC PARAMETERS 25 SAMPLE MEASURMENT 26PRINTING 55 Print set up 56QUANTITATION 38 CALIBRATION 42 DATA ANALYSIS 43 METHOD SETUP 39 MODE SPECIFIC PARAMETERS 38 SAMPLE MEASUREMENT 42
85

Routine maintenance 71Safety 3SAVING, PRINTING AND AUTOLOGGING 51 DELETING METHODS 53 DELETING RESULTS 55 OPENING METHODS 52 OPENING RESU LTS 54 PRINTING RESULTS 55 SAVING METHODS 51 SAVING RESULTS 53Screen setup 19SERVICE 71Spare parts 70SPECTRUM 31 CALIBRATION 34 DATA ANALYSIS 35 METHOD SETUP 32 MODE SPECIFIC PARAMETERS 31 SAMPLE MEASUREMENT 34Technical specification 8Technical support 75Theory and practice of spectroscopy measurements 16 Spectroscopy measurement 16 Theory of spectroscopy measurements 16Troubleshooting 73Utility toolbar 20
86

87

Bibby Scientific Middle east LtdBPO Box 27842Engomi 2433Nicosia CyprusTel: +357 22 660 423Fax: +357 22 660 424e-mail: [email protected]
Bibby Scientific LtdBeacon Road Stone Staffordshire ST15 0SAUnited KingdomTel: +44 (0)1785 812121 Fax: +44 (0)1785 813748 e-mail: [email protected]
Bibby Scientific France SASZI du Rocher Vert - BP 7977793 Nemours Cedex FranceTel: +33 1 64 45 13 13 Fax: +33 1 64 45 13 00 e-mail: [email protected]
Bibby Scientific italia SrlVia Alcide de Gasperi 5620077 Riozzo di Cerro al LambroMilano ItaliaTel: +39 (0)2 98230679Fax: +39 (0)2 98230211 e-mail: [email protected]
Bibby Scientific US Ltd 3 Terri Lane Suite 10 Burlington NJ 08016 USATel: 800-225-9243 Fax: 609-589-2571www.bibby-scientific.com
Bibby Scientific (Asia) LtdRoom 607 Yen Sheng Centre64 Hoi Yuen Road Kwun TongKowloon Hong KongTel: +852 3583 1581Fax: +852 3583 1580e-mail [email protected]